Abstract
In this paper, an induced birefringence was observed on an ammonia sensor based on an etched fiber Bragg grating (EFBG) coated with an organic film. The film was prepared with a solution of the perylene derivative, along with the copolymer PCDTBT in chlorobenzene. The EFBG was coated by drop cast technique, and a split in the reflection band, characteristic of birefringence, was observed after deposition. The response of the two observed peaks as a function of time was modeled by a pair of exponentials that could represent two processes: adsorption followed by diffusion of the gas molecules in the microstructured film. Such phenomena alter the boundary conditions of the optical fiber propagating mode, which allows an indirect ammonia detection by monitoring the EFBG wavelength shift of the reflected peaks. The sensor was experimentally tested in a concentration range from 3 ppm to 41,700 ppm, and the calibrations curves were determined in a range from 27 ppm to 6960 ppm. The two observed peaks showed different sensitivities, which presents an intrinsic potential for multiparameter measurements. The split in the reflection band was hypothesized to be birefringence induced by the formation of an asymmetric film. This hypothesis was numerically evaluated and compared with the experimental results.
1. Introduction
Ammonia (NH3) is a hazardous substance that is highly toxic and corrosive to the skin, eyes and lungs [1,2]. Anthropogenic emissions are mainly from agricultural, domestic and industrial activities, and they are predominant when compared to natural emissions [3]. In vapor state, it is colorless and presents a pungent odor, which perception by smell is around 50 ppm [2]. At low concentrations, ammonia is irritating to the respiratory system, skin and eyes; at high concentrations (from 300 ppm), it can lead to immediate and severe irritation of the nose and throat, pulmonary edema and even serious or fatal respiratory illnesses, depending on the exposure time [2]. Regarding the local environment, long-term exposure at low concentrations (up to 15 ppm) is a hazard to the vegetation, which can cause metabolic disturbance and leaf damage to plants [4].
In recent years, different approaches have been proposed for the ammonia sensors fabrication. Andre et al. [5] reported the fabrication of an efficient NH3 sensing hybrid material based on In2O3 nanofibers (NFI) functionalized with partially reduced graphene sheets (rGO). Tabr et al. [6] presented the fabrication and properties of new ammonia sensors with sensitive layer of nickel nanoparticles decorated on three-dimensional nitrogen-doped graphene-based frameworks/polyaniline. Vinoth and Gopalakrishnan [7] present ZnO-based Ag sputtered interdigitated electrode ammonia sensor. Polymers are also good candidates for the development of ammonia sensors [8,9]. The interaction between NH3 molecule and perilene derivative (PDI) may result in a charge transfer complex, which would change the film optical absorbance and/or the film refraction index [10,11]. Therefore, PDIs are promising materials for the development of optical sensors for ammonia detection. In recent years, several authors presented high sensitivity ammonia sensors based on functionalized optical fibers applied to detect ammonia in gas phase and liquid solution [12,13,14,15,16,17] A recent review of fiber optic sensors for gases, vapors and ions can be found at [18]. Fiber Bragg gratings are a class of optical sensors that have attracted attention of researchers in recent decades due to properties such as wavelength coding, multipoint remote sensing, electrical passivity and electromagnetic immunity. In 2018, Fu et al. proposed a microfiber Bragg grating (MFBG) to detect ammonia gas with high sensitivity [12]. Recently, Mohammed and Yaacob presented an etched-tapered fiber Bragg grating coated with polyaniline/graphite nanofibers (PANI/GNF) nanostructures as a sensing layer for the ammonia sensor [14]. Another advantage of fiber Bragg grating-based sensors is the ability to measure multiple parameters. In a previous work, we demonstrated the use of two distinct wavelengths to discriminate temperature and refractive index using an EFBG inscribed in a multimode fiber [19]. Birefringent fibers pose as an alternative for multimode fibers for multiparameter measurements since they present two distinct wavelength responses [20]. For simultaneous measurements, FBG inscribed in high birefringence (Hi-Bi) fibers have also been studied extensively [20,21,22]. In Hi-Bi FBG, the difference in response of each peak is used to discriminate the quantities of interest.
In this work, the conjugated polymer poly[[9-(1-octylnonyl)-9H-carbazole-2,7-diyl]-2,5-thiophenediyl-2,1,3-benzothiadiazole-4,7-diyl-2,5-thiophenediyl] (PCDTBT) and a perylene derivative, N,N-bis(ndecyl)-perylene-3,4:9,10-tetracarboxyldiimide (PDI) were used as an EFBG functional coating for the detection of ammonia vapor. The PCDTBT and the PDI were processed in thin film to modulate the resonant Bragg wavelength due to amonia vapor interaction. After film deposition, a splitting of the reflection band was observed due to a possible induced birefringence. This hypothesis is numerically investigated and compared with experimental results.
2. Materials and Methods
2.1. Materials
Perylene-3,4,9,10-tetracarboxylic dianhydride, Poly[[9-(1-octylnonyl)-9H-carbazole-2,7-diyl]-2,5 -thiophenediyl-2,1,3-benzothiadiazole-4,7-diyl-2,5-thiophenediyl], decylamine, imidazole and zinc acetate were purchased from Sigma-Aldrich, and they were used without any further purification. Imidazole was purchased from Alfa Aesar. Spectroscopic grade solvents were used for all the experiments.
2.2. Synthesis of PDI n-Decyl
The perylene derivative was synthesized following the standard condensation method [23,24]. Briefly, a mixture of perylene-3,4,9,10-tetracarboxylic dianhydride (300 mg, mmol), decyl amine (216 mg, mmol), zinc acetate (catalytic amount) and g of imidazole was heated at 140 for 8 h under continuous stirring. The reaction mixture was then allowed to cool and poured into water. Then a mol/L HCl solution was added to the mixture under continuous stirring to obtain a precipitate. The resultant mixture was centrifuged and washed several times with water followed by drying under vacuum to acquire the red colored solid product. PDI-n-decyl was further purified by column chromatography using hexane-chloroform as an eluent.
The conjugated polymer PCDTBT was used as a matrix to the PDI molecule, the chemical structure of the PDI and PCDTBT derivative is shown in Figure 1.
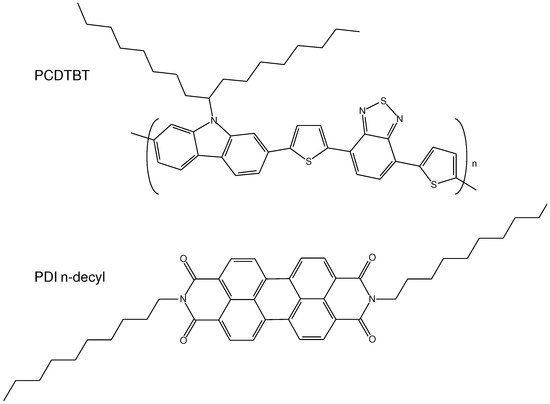
Figure 1.
Chemical structures of PDI n-decyl and PCDTBT.
The compounds solutions were prepared as follows: 1 mg/mL PBI molecule (PBI: 1 mg; chloroform: 1 mL), mg/mL PCDTBT polymer (PCDTBT: mg; chloroform: 2 mL) and the samples of PCDTBT:PDI were prepared at 1:2 vol/vol.
2.3. FBG Fabrication and Characterizations
The FBG was inscribed in a Draka Comteq single mode fiber, with μm cladding diameter and μm core diameter. The gratings were inscribed applying the phase mask technique (Ibsen photonics, nm pitch), after 4 min exposure to an ArF excimer laser (Xantos XS, Coherent®). The laser emits at 193 nm and it was set to an emission rate of 250 Hz at mJ energy per pulse.
The fiber cladding was removed by chemical etching to provide the interaction between the evanescent field and the coating film. The FBG sensor was dipped in a 40% HF solution until a 4 nm blue shift could be observed. The etching process was neutralized in NaOH solution and the fiber was washed in deionized water. The EFBG was left to dry overnight and fastened into a glass slide. The volume of 20 μL of the PCDTBT:PDI was drop casted over the EFBG. The sensor was kept sheltered from light for 24 h, at room temperature.
Both the FBG inscription and cladding removal were monitored with the Yokogawa AQ-6375 optical spectrum analyzer (OSA), operating with a nm resolution. The Ammonics ASM-10-M amplified spontaneous emission (ASE) light source and a Thorlabs 6015-5-FC optical circulator were also applied.
A 3 L flask was used as vapor chamber. To create ammonia vapor, a fixed volume of 50 μL of NH4OH, under different concentrations, was injected into the chamber using a micropipette. To ensure concentration, each NH4OH sample had its own chamber. The sensor is kept exposed to the ammonia vapor within the chamber for 15 min. Thereafter, the sensor is exposed to air for the same period of time. The vapor concentration within each chamber was calculated according to Equation (1) [25]:
where C is the vapor concentration (in ppm), is the volume of the pipetted analyte (in μL), is the analyte density (in g/mL), is the chamber volume (in mL) and is the molecular weight of the analyte in the liquid phase (in g/mol). For measures of lower ammonia concentration fourteen samples were prepared ranging from 3 ppm to 41,700 ppm.
The sensor was alternately exposed to atmospheres with and without NH3. The Bragg wavelength shift was monitored with the SM-125 optical interrogator (Micron Optics), at a 2 Hz scan rate and wavelength accuracy of 1 pm. The interrogation procedure was performed at room temperature and isolated from external illumination sources.
3. Experimental Results and Discussions
The PCDTBT:PDI film was characterized by SEM (EVO MA 15, Carl Zeiss Microscopy). Figure 2 presents the SEM image showing a complex morphology with amorphous micrometric structures. There are relatively large spaces among the micrometric structures, which may enhance the adsorption and further diffusion of the vapor molecules.
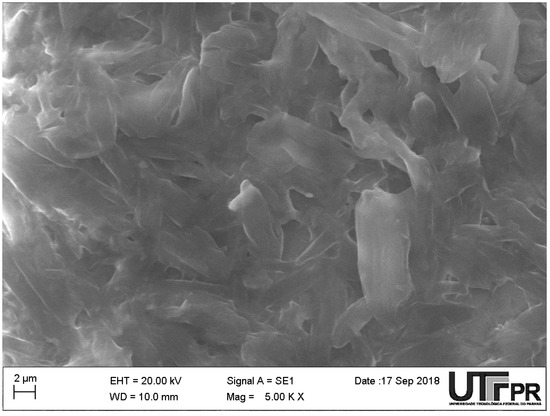
Figure 2.
Microstructures of the PCDTBT:PDI observed through SEM image.
The Figure 3a shows the FBG spectrum before and after the etching process. The spectrum of the unetched FBG shows a reflectivity peak at nm. The etching process over the FBG was stopped after a nm wavelength blue shift had been verified. The final spectrum of the etched FBG, in deionized water, shows a reflectivity peak at nm. The wavelength observed during the etched process allowed to estimate the fiber diameter at approximately 8 μm [26]. Such diameter indicates that optical fiber cladding was fully removed.
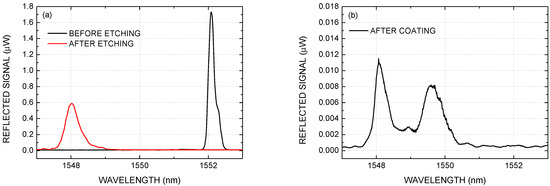
Figure 3.
FBG reflected spectra: (a) before and after the etching process, and (b) after the PCDTBT:PDI film deposition.
The spectra after the film deposition are showed in Figure 3b, which presents 2 peaks at nm and nm. A hypothesis for the appearance of these separated peaks is a birefringence induced by an asymmetric deposition of the film around the fiber. Drop cast deposition can lead to a thicker film in the direction parallel to the microscope slide surface. An interesting mini-review about the asymmetric deposition and reproducibility issues of drop casted surfaces can be found at [27]. The thicker film in this direction increases the propagation constant, which explains the appearance of the band at 1549.62 nm, with a wavelength shift of nm in relation to the original position. Whereas in the direction orthogonal to the slide surface, it was possible to observe a wavelength shift of nm which can be attributed to a smaller film thickness. From this point on, these modes will be called parallel and orthogonal modes.
The Figure 4 shows the wavelength response of the two bands of the PCDTBT:PDI coated sensor, for ammonia concentrations ranging from 27 ppm to 6960 ppm, at room temperature. In this range, the wavelength shift seems to increase linearly with the logarithm of the ammonia concentration. Exposure to ammonia causes a wavelength shift to higher values indicating an increase in the effective refractive index. And exposure to air causes the wavelength to return to lower values. The PDI molecules are a n-type organic semiconductor materials that can act as electrons acceptors [28,29,30,31]. It is expected that in the presence of electron donor materials, such as amine, changes in the PDI optical and electrical behavior should be verified. One possible mechanism is a charge transfer interaction between PDI molecules and amine, resulting in conformational changes and increasing of the molecular polarizability. In addition, the microscopically irregular coating surface may improve the diffusion of gas molecules, which can also change the refractive index of the film, and consequently, the effective index.
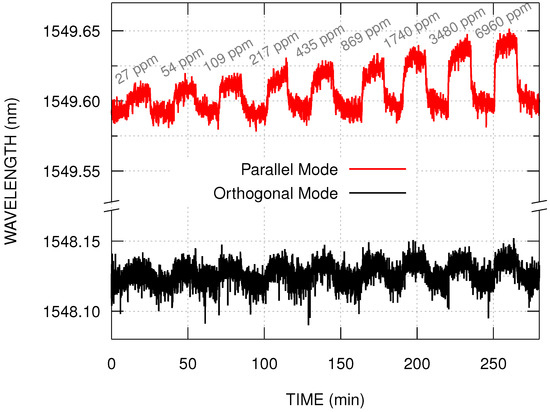
Figure 4.
Wavelength shifts of the parallel and the orthogonal modes in the presence of ammonia vapor with concentration ranging from 27 ppm to 6960 ppm.
Figure 4 shows that the band at nm (parallel mode) presents a greater wavelength shift in the presence of ammonia when compared to the band at nm (orthogonal mode). For both modes, with ammonia concentrations lower than 27 ppm, the wavelength shift is constant, and may be explained by the water vapor interaction with the film. For ammonia concentrations higher than 6960 ppm, the wavelength shift is non-linear with the logarithm of the ammonia concentration. This may be explained by additional effects, such as the ammonia condensation over the film.
The wavelength response of the sensor as a function of the exposition time was analyzed using two approaches. The first one uses a pair of exponential functions in the form [32]:
where A represents the asymptotic value of the wavelength response; and represent characteristic time constants; and and represent wavelength shift amplitudes. As discussed by Corotti et al. [32], this approach can be used to describe two interdependent processes, one fast and another one slower, such as the vapor adsorption followed by the molecular diffusion. The second approach is a simplified version of the first one, and it uses a single exponential that would represent only the adsorption process.
The Figure 5 shows the comparison between the results of the fit using the two proposed models to describe the sensor’s response with ammonia vapor at 3480 ppm. In both approaches, within the measurement time interval and uncertainties, the wavelength shifts converge to similar values, both when exposed to ammonia and to air. When analyzing the sensor’s response using the 2-processes model (Equation (2)), with , the fitting results , with being one order of magnitude smaller than , and being twice the value of (in average). This means that most of the sensor’s response is produced by the fast process, which we are hypothesizing to be the adsorption. It was observed a small red shift in the asymptotic wavelength after the recovery, which is perceptible for higher ammonia concentrations (see Figure 4). This small difference could be associated with the presence of residual diffused molecules within the film matrix. As diffusion is considered a slower process, it may take longer for the sensor to return to the initial wavelength for higher concentrations. The calculated response and recovery times also differ according to the model used, with the single exponential model resulting, on average, half the times of the 2-processes model.
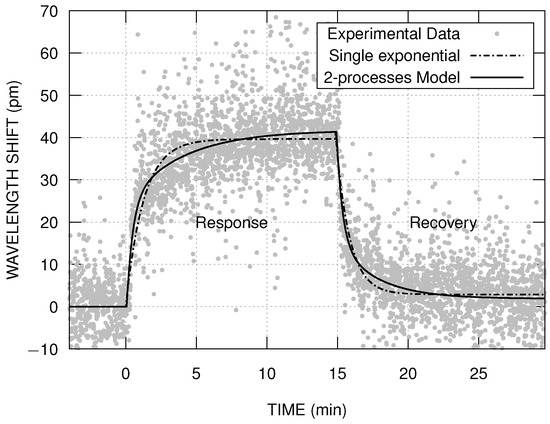
Figure 5.
Comparison between the two fitting models used to study the sensor’s response with ammonia vapor at 3480 ppm.
Table 1 shows the wavelength shift, and the response and recovery times for each exposure considering the 2-processes model. The wavelength shift was calculated by averaging the response and recovery shifts. The response and recovery times were obtained when the wavelength shift reached 90% of its magnitude. The average response and recovery times were similar, respectively with min and min for the parallel mode, and min and min for the orthogonal mode.

Table 1.
Mean values of the fit results using Equation (2) for each concentration regarding the parallel and the orthogonal modes.
The wavelength shifts shown in Table 1 were used to determine the sensor’s calibration curve (Figure 6). The empirical model used to fit the experimental wavelength shift () as a function of the concentration () is expressed by Equation (3). In this equation, represents the extrapolation of the fit for the ammonia concentration at 1 ppm, and the logarithm in base 2 was chosen for convenience, to ease the comparison with the experimental results. The parameter k represents how much the wavelength shift changes when the ammonia concentration doubles. The fitting results for k were pm and pm, for the parallel and orthogonal modes, respectively. The parameter k is associated with the sensor’s sensitivity, and the parallel mode response is about 4 times greater than the orthogonal mode. The best sensitivity was pm/ppm with a resolution of 29 ppm, which was obtained at 27 ppm for the parallel mode. Considering the hypothesis of induced birefringence, the greater sensitivity is due to the greater thickness of parallel mode, since the variation in the effective index depends on the refractive index and thickness of the film.
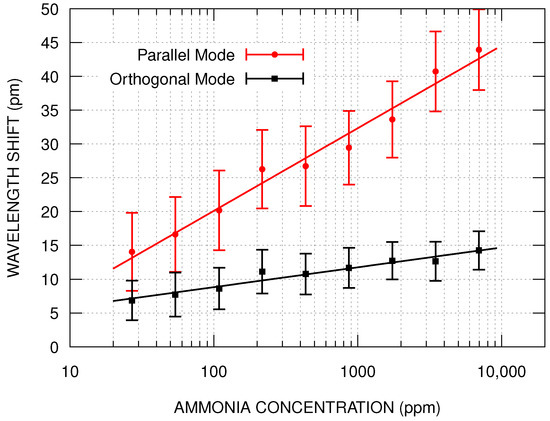
Figure 6.
Calibration curves of parallel and orthogonal modes of the sensor in the presence of ammonia vapor with concentration ranging from 27 ppm to 6960 ppm.
4. Theoretical Results and Discussions
To verify if an asymmetric film could induce a birefringence effect and explain the observed behavior, a numerical model was created using the commercially finite element solver COMSOL Multiphysics® with the Wave Optics module. Figure 7 presents the geometry used in the simulation. The fiber core radius was set to 4 μm, with a refractive index of . For simplicity, the surrounding asymmetric film was considered to be an elliptical geometry with a semi-major axis of μm, semi-minor axis of μm, with a refractive index of , and the external medium refractive index of 1. For the fiber core, the parameters were chosen based on the previous work of Kuhne et al. [26]. The parameters chosen for the asymmetric film were initially optimized to reproduce the experimental wavelength of the orthogonal mode. To simulate the ammonia exposure, the refractive index of the asymmetric film was changed considering the experimental wavelength shift of the parallel mode (Table 1). By dividing the wavelength shifts by , the changes in the effective refractive indices were obtained. Finally, the asymmetric film’s refractive indices were set to numerically reproduce these empirical changes in the effective refractive indices.
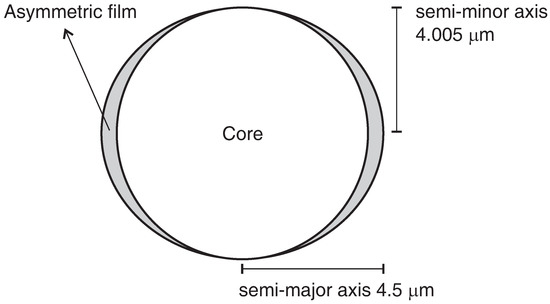
Figure 7.
Fiber model geometry used in the computational simulation, representing a circular core and an elliptical film.
Figure 8 presents the simulation results of the sensor’s response, for both modes, in the effective refractive index range corresponding to the presence of ammonia vapor with concentration ranging from 27 ppm to 6960 ppm. As expected, the asymmetric film removes the superposition of the fundamental core mode polarizations, which explains the splitting of the reflected band. Equation (3) also was used to determine the sensor’s calibration curve of the simulated results. The fitting values for k were pm and pm, for parallel and orthogonal modes, respectively.
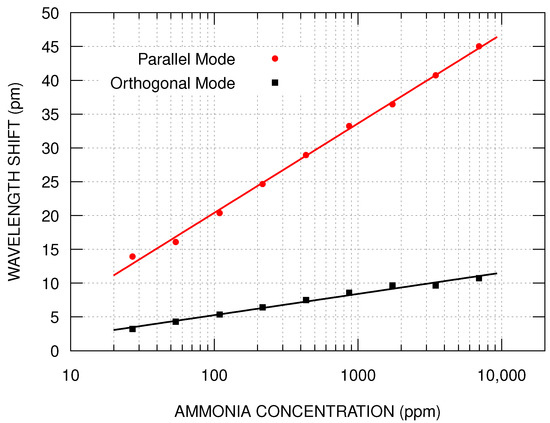
Figure 8.
Simulation results of the sensor’s response for both modes in the same range as Figure 6 to ease the comparison. The ammonia concentration was mapped using the effective refraction index of the parallel mode.
5. Conclusions
In this work, an induced birefringence on an EFBG ammonia gas sensor functionalized with a PCDTBT:PDI thin film is presented and investigated. The film was carried out by drop cast, and after the deposition, a split in the reflection band was observed. Our hypothesis for the division of the reflection band is a birefringence induced by the asymmetric deposition of the film. The numerical simulation showed that an asymmetrical coating results in different effective index for each mode, which supported our hypothesis. The band located at a longer wavelength is associated with the polarization in which the film is thicker, and it presented a sensitivity four times higher than the band located at the shorter wavelength. To the best knowledge of the authors, for the first, it was reported the division of the reflection band of an EFBG after a film coating. The possibility of obtaining birefringence from film deposition may combine advantages from both functionalization with nanostructures and birefringent gratings, which can result in sensors for multiparameter measurements with selectivity.
Author Contributions
J.F.K. designed and implemented the experiments, N.d.C.P. performed the numerical simulations, B.B.M.T. synthesized the PDI, R.C.B. develop the model, R.C.K. designed this study and proposed the birefringence hypothesis. All authors contributed to the results analysis and discussions and write/revision the manuscript. All authors have read and agreed to the published version of the manuscript.
Funding
This work was supported in part by the Coordenação de Aperfeiçoamento de Pessoal de Nível Superior (CAPES), Brazil, under Grant 001, in part by the Conselho Nacional de Desenvolvimento Científico e Tecnológico (CNPq) under Grant 443134/2014-6.
Acknowledgments
FBGs were fabricated at the Multi-User Photonics Facility-UTFPR-CT, associated laboratory of INCT Fotonicom. The authors would also like to thank the Multi-User Center for Materials Characterization—CMCM of UTFPR-CT, and Paula Cristina Rodrigues for the useful suggestions.
Conflicts of Interest
The authors declare no conflict of interest. The funders had no role in the design of the study; in the collection, analyses, or interpretation of data; in the writing of the manuscript, or in the decision to publish the results.
References
- Kwak, D.; Lei, Y.; Maric, R. Ammonia gas sensors: A comprehensive review. Talanta 2019, 204, 713–730. [Google Scholar] [CrossRef] [PubMed]
- Timmer, B.; Olthuis, W.; van den Berg, A. Ammonia sensors and their applications—A review. Sens. Actuators B Chem. 2005, 107, 666–677. [Google Scholar] [CrossRef]
- Van Damme, M.; Clarisse, L.; Whitburn, S.; Hadji-Lazaro, J.; Hurtmans, D.; Clerbaux, C.; Coheur, P.F. Industrial and agricultural ammonia point sources exposed. Nature 2018, 564, 99–103. [Google Scholar] [CrossRef] [PubMed]
- Krupa, S. Effects of atmospheric ammonia (NH3) on terrestrial vegetation: A review. Environ. Pollut. 2003, 124, 179–221. [Google Scholar] [CrossRef]
- Andre, R.S.; Mercante, L.A.; Facure, M.H.; Mattoso, L.H.; Correa, D.S. Enhanced and selective ammonia detection using In2O3/reduced graphene oxide hybrid nanofibers. Appl. Surf. Sci. 2019, 473, 133–140. [Google Scholar] [CrossRef]
- Ahmadi Tabr, F.; Salehiravesh, F.; Adelnia, H.; Gavgani, J.N.; Mahyari, M. High sensitivity ammonia detection using metal nanoparticles decorated on graphene macroporous frameworks/polyaniline hybrid. Talanta 2019, 197, 457–464. [Google Scholar] [CrossRef]
- Vinoth, E.; Gopalakrishnan, N. Fabrication of interdigitated electrode (IDE) based ZnO sensors for room temperature ammonia detection. J. Alloys Compd. 2020, 824, 153900. [Google Scholar] [CrossRef]
- Bittencourt, J.C.; de Santana Gois, B.H.; Rodrigues de Oliveira, V.J.; da Silva Agostini, D.L.; de Almeida Olivati, C. Gas sensor for ammonia detection based on poly(vinyl alcohol) and polyaniline electrospun. J. Appl. Polym. Sci. 2019, 136, 47288. [Google Scholar] [CrossRef]
- Eising, M.; Cava, C.E.; Salvatierra, R.V.; Zarbin, A.J.G.; Roman, L.S. Doping effect on self-assembled films of polyaniline and carbon nanotube applied as ammonia gas sensor. Sens. Actuators B Chem. 2017, 245, 25–33. [Google Scholar] [CrossRef]
- Zhang, S.; Wang, X.; Huang, Y.; Zhai, H.; Liu, Z. Ammonia sensing properties of perylene diimides: Effects of core-substituted chiral groups. Sens. Actuators B Chem. 2018, 254, 805–810. [Google Scholar] [CrossRef]
- Kalita, A.; Hussain, S.; Malik, A.H.; Subbarao, N.V.V.; Iyer, P.K. Vapor phase sensing of ammonia at the sub-ppm level using a perylene diimide thin film device. J. Mater. Chem. C 2015, 3, 10767–10774. [Google Scholar] [CrossRef]
- Fu, H.; Zhang, J.; Ding, J.; Wang, Q.; Li, H.; Shao, M.; Liu, Y.; Liu, Q.; Zhang, M.; Zhu, Y.; et al. Ultra sensitive NH3 gas detection using microfiber Bragg Grating. Opt. Commun. 2018, 427, 331–334. [Google Scholar] [CrossRef]
- Mohammed, H.A.; Rashid, S.A.; Abu Bakar, M.H.; Ahmad Anas, S.B.; Mahdi, M.A.; Yaacob, M.H. Fabrication and Characterizations of a Novel Etched-tapered Single Mode Optical Fiber Ammonia Sensors Integrating PANI/GNF Nanocomposite. Sens. Actuators B Chem. 2019, 287, 71–77. [Google Scholar] [CrossRef]
- Mohammed, H.; Yaacob, M. A novel modified fiber Bragg grating (FBG) based ammonia sensor coated with polyaniline/graphite nanofibers nanocomposites. Opt. Fiber Technol. 2020, 58, 102282. [Google Scholar] [CrossRef]
- Leal-Junior, A.G.; Frizera, A.; Marques, C. Low-cost Fiberoptic Probe for Ammonia Early Detection in Fish Farms. Remote Sens. 2020, 12, 1439. [Google Scholar] [CrossRef]
- Thangaraj, S.; Paramasivan, C.; Balusamy, R.; Arumainathan, S.; Thanigainathan, P. Evanescent wave optical fibre ammonia sensor with methylamine hydroiodide. IET Optoelectron. 2020, 14, 292–295. [Google Scholar] [CrossRef]
- Fan, X.; Deng, S.; Wei, Z.; Wang, F.; Tan, C.; Meng, H. Ammonia Gas Sensor Based on Graphene Oxide-Coated Mach-Zehnder Interferometer with Hybrid Fiber Structure. Sensors 2021, 21, 3886. [Google Scholar] [CrossRef]
- Pawar, D.; Kale, S.N. A review on nanomaterial-modified optical fiber sensors for gases, vapors and ions. Microchim. Acta 2019, 186, 253. [Google Scholar] [CrossRef] [PubMed]
- Fernandes, D.; Barreto, R.C.; Macedo, A.G.; Cardozo Da Silva, J.C.; Kamikawachi, R.C. A Simple Equation to Describe Cross-Sensitivity Between Temperature and Refractive Index in Fiber Bragg Gratings Refractometers. IEEE Sens. J. 2018, 18, 1104–1110. [Google Scholar] [CrossRef]
- Abe, I.; de Góes, R.E.; Fabris, J.L.; Kalinowski, H.J.; Müller, M.; Fugihara, M.C.; Falate, R.; Diesel, B.W.; Kamikawachi, R.C.; Barbosa, C.L. Production and characterization of refractive index gratings in high-birefringence fibre optics. Opt. Lasers Eng. 2003, 39, 537–548. [Google Scholar] [CrossRef]
- Chehura, E.; Ye, C.C.; Staines, S.E.; James, S.W.; Tatam, R.P. Characterization of the response of fibre Bragg gratings fabricated in stress and geometrically induced high birefringence fibres to temperature and transverse load. Smart Mater. Struct. 2004, 13, 888–895. [Google Scholar] [CrossRef]
- Leandro, D.; Lopez-Amo, M. All-PM Fiber Loop Mirror Interferometer Analysis and Simultaneous Measurement of Temperature and Mechanical Vibration. J. Light. Technol. 2018, 36, 1105–1111. [Google Scholar] [CrossRef] [Green Version]
- Türkmen, G.; Erten-Ela, S.; Icli, S. Highly soluble perylene dyes: Synthesis, photophysical and electrochemical characterizations. Dye. Pigment. 2009, 83, 297–303. [Google Scholar] [CrossRef]
- Singh, T.; Erten, S.; Günes, S.; Zafer, C.; Turkmen, G.; Kuban, B.; Teoman, Y.; Sariciftci, N.; Icli, S. Soluble derivatives of perylene and naphthalene diimide for n-channel organic field-effect transistors. Org. Electron. 2006, 7, 480–489. [Google Scholar] [CrossRef]
- Kaneti, Y.V.; Zhang, Z.; Yue, J.; Zakaria, Q.M.D.; Chen, C.; Jiang, X.; Yu, A. Crystal plane-dependent gas-sensing properties of zinc oxide nanostructures: Experimental and theoretical studies. Phys. Chem. Chem. Phys. 2014, 16, 11471–11480. [Google Scholar] [CrossRef] [PubMed]
- Kuhne, J.F.; Rocha, A.M.; Barreto, R.C.; Kamikawachi, R.C. Estimation models for the Refractive Index response curve of EFBGs. IEEE Sens. J. 2020, 20, 13394–13402. [Google Scholar] [CrossRef]
- Kaliyaraj Selva Kumar, A.; Zhang, Y.; Li, D.; Compton, R.G. A mini-review: How reliable is the drop casting technique? Electrochem. Commun. 2020, 121, 106867. [Google Scholar] [CrossRef]
- Che, Y.; Datar, A.; Yang, X.; Naddo, T.; Zhao, J.; Zang, L. Enhancing One-Dimensional Charge Transport through Intermolecular π-Electron Delocalization: Conductivity Improvement for Organic Nanobelts. J. Am. Chem. Soc. 2007, 129, 6354–6355. [Google Scholar] [CrossRef] [PubMed]
- Zang, L.; Che, Y.; Moore, J.S. One-Dimensional Self-Assembly of Planar π-Conjugated Molecules: Adaptable Building Blocks for Organic Nanodevices. Acc. Chem. Res. 2008, 41, 1596–1608. [Google Scholar] [CrossRef]
- Hu, J.; Kuang, W.; Deng, K.; Zou, W.; Huang, Y.; Wei, Z.; Faul, C.F. Self-Assembled Sugar-Substituted Perylene Diimide Nanostructures with Homochirality and High Gas Sensitivity. Adv. Funct. Mater. 2012, 22, 4149–4158. [Google Scholar] [CrossRef]
- Huang, Y.; Wang, J.; Wei, Z. Modulating supramolecular helicity and electrical conductivity of perylene dyes through an achiral alkyl chain. Chem. Commun. 2014, 50, 8343–8345. [Google Scholar] [CrossRef] [PubMed]
- Corotti, R.D.P.; Cunha, B.B.; Barreto, R.C.; Conceição, A.L.C.; Kamikawachi, R.C. Diphenylalanine Nanotube Coated Fiber Bragg Grating for Methanol Vapor Detection. IEEE Sens. J. 2020, 20, 1290–1296. [Google Scholar] [CrossRef]
Publisher’s Note: MDPI stays neutral with regard to jurisdictional claims in published maps and institutional affiliations. |
© 2021 by the authors. Licensee MDPI, Basel, Switzerland. This article is an open access article distributed under the terms and conditions of the Creative Commons Attribution (CC BY) license (https://creativecommons.org/licenses/by/4.0/).