Article

Multichannel Fiber-Optic Silicon Fabry–Pérot Interferometric Bolometer System for Plasma Radiation Measurements

1
Department of Electrical and Computer Engineering, Michigan State University, East Lansing, MI 48824, USA
2
Department of Nuclear Engineering, University of Tennessee, Knoxville, TN 37996, USA
3
Commonwealth Fusion System, 148 Sidney Street, Cambridge, MA 02139, USA
4
Oak Ridge National Laboratory, Oak Ridge, TN 37831, USA
*
Author to whom correspondence should be addressed.
Photonics 2021, 8(9), 344; https://doi.org/10.3390/photonics8090344
Submission received: 19 July 2021 / Revised: 15 August 2021 / Accepted: 17 August 2021 / Published: 25 August 2021
(This article belongs to the Special Issue Fiber-Optic Sensors)

Abstract

:
A single-channel fiber-optic bolometer system based on a high-finesse silicon Fabry–Pérot interferometer (FPI) was previously reported, intended to measure plasma radiation from the magnetically confined fusion chamber. Recently, we developed a multichannel fiber-optic bolometer system with five bolometers multiplexed using a coarse wavelength division multiplexer (CWDM) and interrogated with a white-light system involving a superluminescent light-emission diode source and a high-speed spectrometer. One of the bolometers was used as the reference bolometer to compensate for the ambient temperature variations, and the other four bolometers were used for radiation measurement. The bolometers have a simple structure with a silicon pillar at the end of the single-mode fiber and a gold disk on the other side of the silicon pillar. They are also easy to fabricate without stringent requirements on the optical alignment. Analysis of the system optimization was performed to improve the noise performance and to mitigate the vibration effect that may present in the practical application. The system had a significantly enhanced measurement range compared to the previous high-finesse FPI bolometer system for measuring radiation. Test results performed in air using a 405 nm laser as the radiation source showed that the temperature resolution and the noise-equivalent power density of the sensing bolometers connected to each channel of the CWDM were, respectively, ~0.4 mK and ~0.1 W/m2, with a time constant of ~220 ms, which is comparable to the previous more complicated fiber-optic bolometer systems based on high-finesse FPIs that were interrogated using wavelength-scanning lasers.

Graphical Abstract

1. Introduction

Obtaining the temporal and spatial profiles of plasma radiation is important for analyzing plasma behaviors quantitatively in the fusion system. Due to the broad range of the plasma radiation spectrum that spans from soft X-ray to near infrared, bolometers that consist of an absorber and a thermometer are typically used for measuring the radiation of plasma in different types of fusion devices [1,2,3,4]. Various bolometers for thermal fusion applications have been developed in the past, including resistive bolometers, infrared imaging video bolometers, absolute extreme ultraviolet diode bolometers, fiber-optic bolometers, and ferro-electric bolometers [5]. Among them, fiber-optic bolometers have the unique advantage of immunity to electromagnetic interference that makes them particularly attractive for measuring radiation in magnetically confined fusion [5]. In addition, they have a small size and can potentially operate in an environment with elevated temperatures. Previously, we demonstrated fiber-optic bolometers based on high-finesse silicon Fabry–Pérot (FP) interferometers (FPIs) that shows promising noise performance [6,7]. The most recent system features a noise-equivalent power density (NEPD) of ~0.13 W/m2 and a time constant of 330 ms tested at around normal temperature and pressure [7]. As shown in Figure 1a, such a system typically employs two bolometers: one as the sensing bolometer for the radiation measurement and the other as the reference bolometer for removing the drift from environmental perturbations and laser wavelength drift. The bolometers have rather complicated structures, and precise optical alignment in fabrication is needed to achieve high finesse and good visibility of the FP fringes. The structure of the bolometer is shown schematically in the inset of Figure 1a. One side of the silicon pillar is coated with a high-reflection dielectric multi-layer thin-film coating or an ultrathin gold layer, and the other side is attached to a gold disk that functions as both a high-reflection mirror and an absorber. A collimator made by a short section of graded-index multimode fiber of appropriate length [8,9] is sandwiched between a single-mode fiber (SMF) and the dielectric mirror to expand the light beam from the SMF and combat the diffraction loss of light from the SMF. Temperature rise of the FPI from radiation can be measured by measuring the spectral shift of the FP fringes. The high-finesse design of the FPI results in narrow reflection spectral notches that typically cannot be resolved by a spectrometer in a white-light system. Both the sensing and the reference bolometers are interrogated by a distributed feedback (DFB) laser whose wavelength is scanned through current-injection wavelength modulation along with a photodetector. As wavelength scanning of the DFB laser is limited to a small range (~1.0 nm) that is smaller than the free spectral ranges (FSRs) of the FP cavities of the bolometers, precise control of the FP cavity length is needed to ensure that the reflection spectral notches of both bolometers (sensing and reference) are within the scanning range of the DFB laser. The complicated bolometer structure and the stringent requirements on the optical alignment and on the FP cavity length control impose significant challenges in bolometer fabrication and implementation in practice. Ambient temperature variations and radiation of higher power density may produce temperature changes in the bolometer head beyond the limit of the wavelength scanning range of the laser (a temperature change of ~12 °C will produce a shift of 1.0 nm of the FPI spectrum). The limitation in the measurement range can be more prominent when the bolometers are operated in a vacuum environment where the temperature rise is expected to be much higher due to the lack of heat transfer to the ambient air compared with the air environment. These drawbacks may render significant challenges in the practical applications of fiber-optic bolometers.
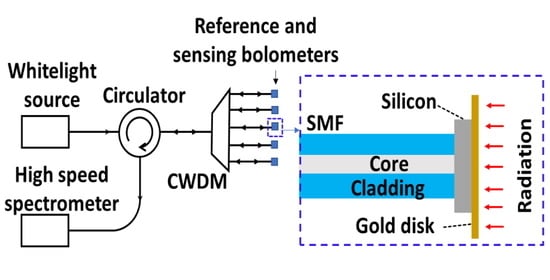
In this paper, we report a multi-channel fiber-optic bolometer system, as shown in Figure 1b, with five bolometers multiplexed using a coarse wavelength division multiplexer (CWDM) and interrogated using a single broadband light source and a high-speed spectrometer. The system can overcome many of the challenges described above. The bolometers here have much simpler structures fabricated by attaching a uncoated silicon pillar and a gold disk at the end of the SMF, as shown schematically in the inset of Figure 1b, which is easier to fabricate with reduced fabrication steps and less stringent requirement on the optical alignment compared to the earlier bolometers. The low-finesse design of the silicon FPI allows the use of the white-light system for interrogation whose wavelength range covers several FSRs of the fringes from the bolometer. It eliminates the need for the alignment of spectral notches of the reference and sensing bolometers as each bolometer is operated at a different wavelength range and can accommodate much larger environmental temperature variations. All five bolometers (four as sensing and one as reference) share a single light source and spectrometer (Figure 1b), which reduces the cost per channel. Although temperature measurement noise is higher compared to the DFB laser-based high-finesse bolometer system, an optimized design of the bolometer structure improves the its responsivity to radiation, ultimately leading to better NEPD performance (~0.1 W/m2 with a time constant of <250 ms tested at normal temperature and pressure). We describe the system design, including the power management of the CWDM challenges and the signal processing that led to the reported NEPD performance. We also study the system noise due to mechanical vibration and its mitigation through a polarization scrambler.

2. Bolometer Fabrication and Experimental Setup

Fabrication of the fiber-optic bolometers shown in Figure 1b has many steps common to those described in [7], and is outlined in Figure 2a. The silicon pillar was attached at the end of the SMF using UV-curable glue. The thickness and diameter of the silicon pillar were 100 and 150 μm, respectively. A 4-μm-thick, 600-μm-diameter gold disk was attached on the other side of the silicon pillar using the UV glue. Figure 2b shows the microscopic image of one of the fabricated bolometers. Scanning electron microscope images of the gold disk and reflection spectrum captured by a fiber-optic interrogator (Model: sm125, Micron Optics, Atlanta, GA, USA) in the wavelength range from 1510 to 1590 nm of typical fiber-optical bolometers are shown in Figure 2c,d respectively. The reflection spectrum shows an FSR of ~3 nm, consistent with the 100 μm cavity length, and a good fringe visibility of about 20 dB throughout the wavelength range.
The proposed five-channel fiber-optic bolometer system is schematically shown in more detail in Figure 2e. The light source (Model: DL-BP1-1501A, Ibsen Photonics, Farum, Denmark) was a superluminescent light-emission diode (SLED) centered at 1550 nm with an integrated fiber-optic circulator. The light from the SLED passed through a fiber-optic circulator, and its polarization was randomized using a 5 MHz polarization scrambler (Model: NOPS, Agiltron, Woburn, MA, USA) before the light arrived at an eight-channel CWDM and split into different channels. Five of them whose center wavelengths ranged from 1510 nm (Ch. 1) to 1590 nm (Ch. 5) with a spacing of 20 nm matched the spectral range of the spectrometer and were thus selected for the system. Each of the channels had a 3 dB bandwidth of ~13 nm and was connected to a fiber-optic bolometer. An attenuator was also used in each channel before the bolometer to adjust the optical power reflected from the bolometer. The light reflected from the five bolometers was combined using the same CWDM and, after passing through the polarization scrambler, was directed to a high-speed spectrometer based on diffractive gratings and a linear photodiode array (Model: IMON 512 OEM, Ibsen Photonics, Farum, Denmark) through the circulator. The spectrometer recorded the spectrum of the light at a frame rate of 1 kHz over a wavelength range from 1510 to 1595 nm. Note that Ch. 1 centered at 1510 nm and Ch. 5 centered at 1590 nm of the CWDM were only partially covered by the spectrometer. Bolometer connected to the CWDM Ch. 1 was used as the reference bolometer and the other four were used for radiation measurement.
Experiments to characterize the bolometer system performance were performed in two ways: one for noise performance analysis and the other for the response to radiation. A noise test was performed by placing all the bolometers in a sealed glass tube, as shown in Figure 2f, and data were recorded continuously without any radiation applied on the bolometers. To obtain the response to radiation, the light from a 405 nm DFB laser was used to simulate the radiation with the bolometers placed in the sealed holes of an aluminum block whose front side was covered by a glass plate that allowed the radiation to shine on to the gold disk of the fiber-optic bolometer. Radiation was applied only to the intended bolometer for the radiation test, while other bolometers were covered by opaque covers to shield them from the incident light, as shown in Figure 2g. To test the effect of mechanical vibration on the system performance, an electromagnetic shaker was used to introduce vibration in the fiber connected to the common port of the CWDM, as shown in Figure 2e.

3. Results

This section is divided into four parts. Parts 1–3 concern the noise performance and describe, respectively, the effects of the optical power distribution, the choice of fringe peaks or valleys for wavelength tracking, and the mechanical vibration on the temperature resolution of the fiber-optic bolometers. The results justify the use of the attenuator and polarization scrambler in the final setup. Part 4 concerns the characterization of the NEPD performance and the time constants of the fiber-optic bolometers.

3.1. Optical Power Management

One of the key components in the fiber-optic bolometer system that determines the noise performance of the system is the high-speed spectrometer. We found that the peak intensity of the signal output from the spectrometer and the exposure time set for the spectrometer can affect the noise performance of each of the channels. The exposure time of the spectrometer is the integration time of the on-chip charge amplifier in the photodiode array of the spectrometer that integrates the photodiode current from each pixel. Our results justify the use of attenuators to equalize the peak intensity of the spectrometer for the five channels for optimized overall noise performance.
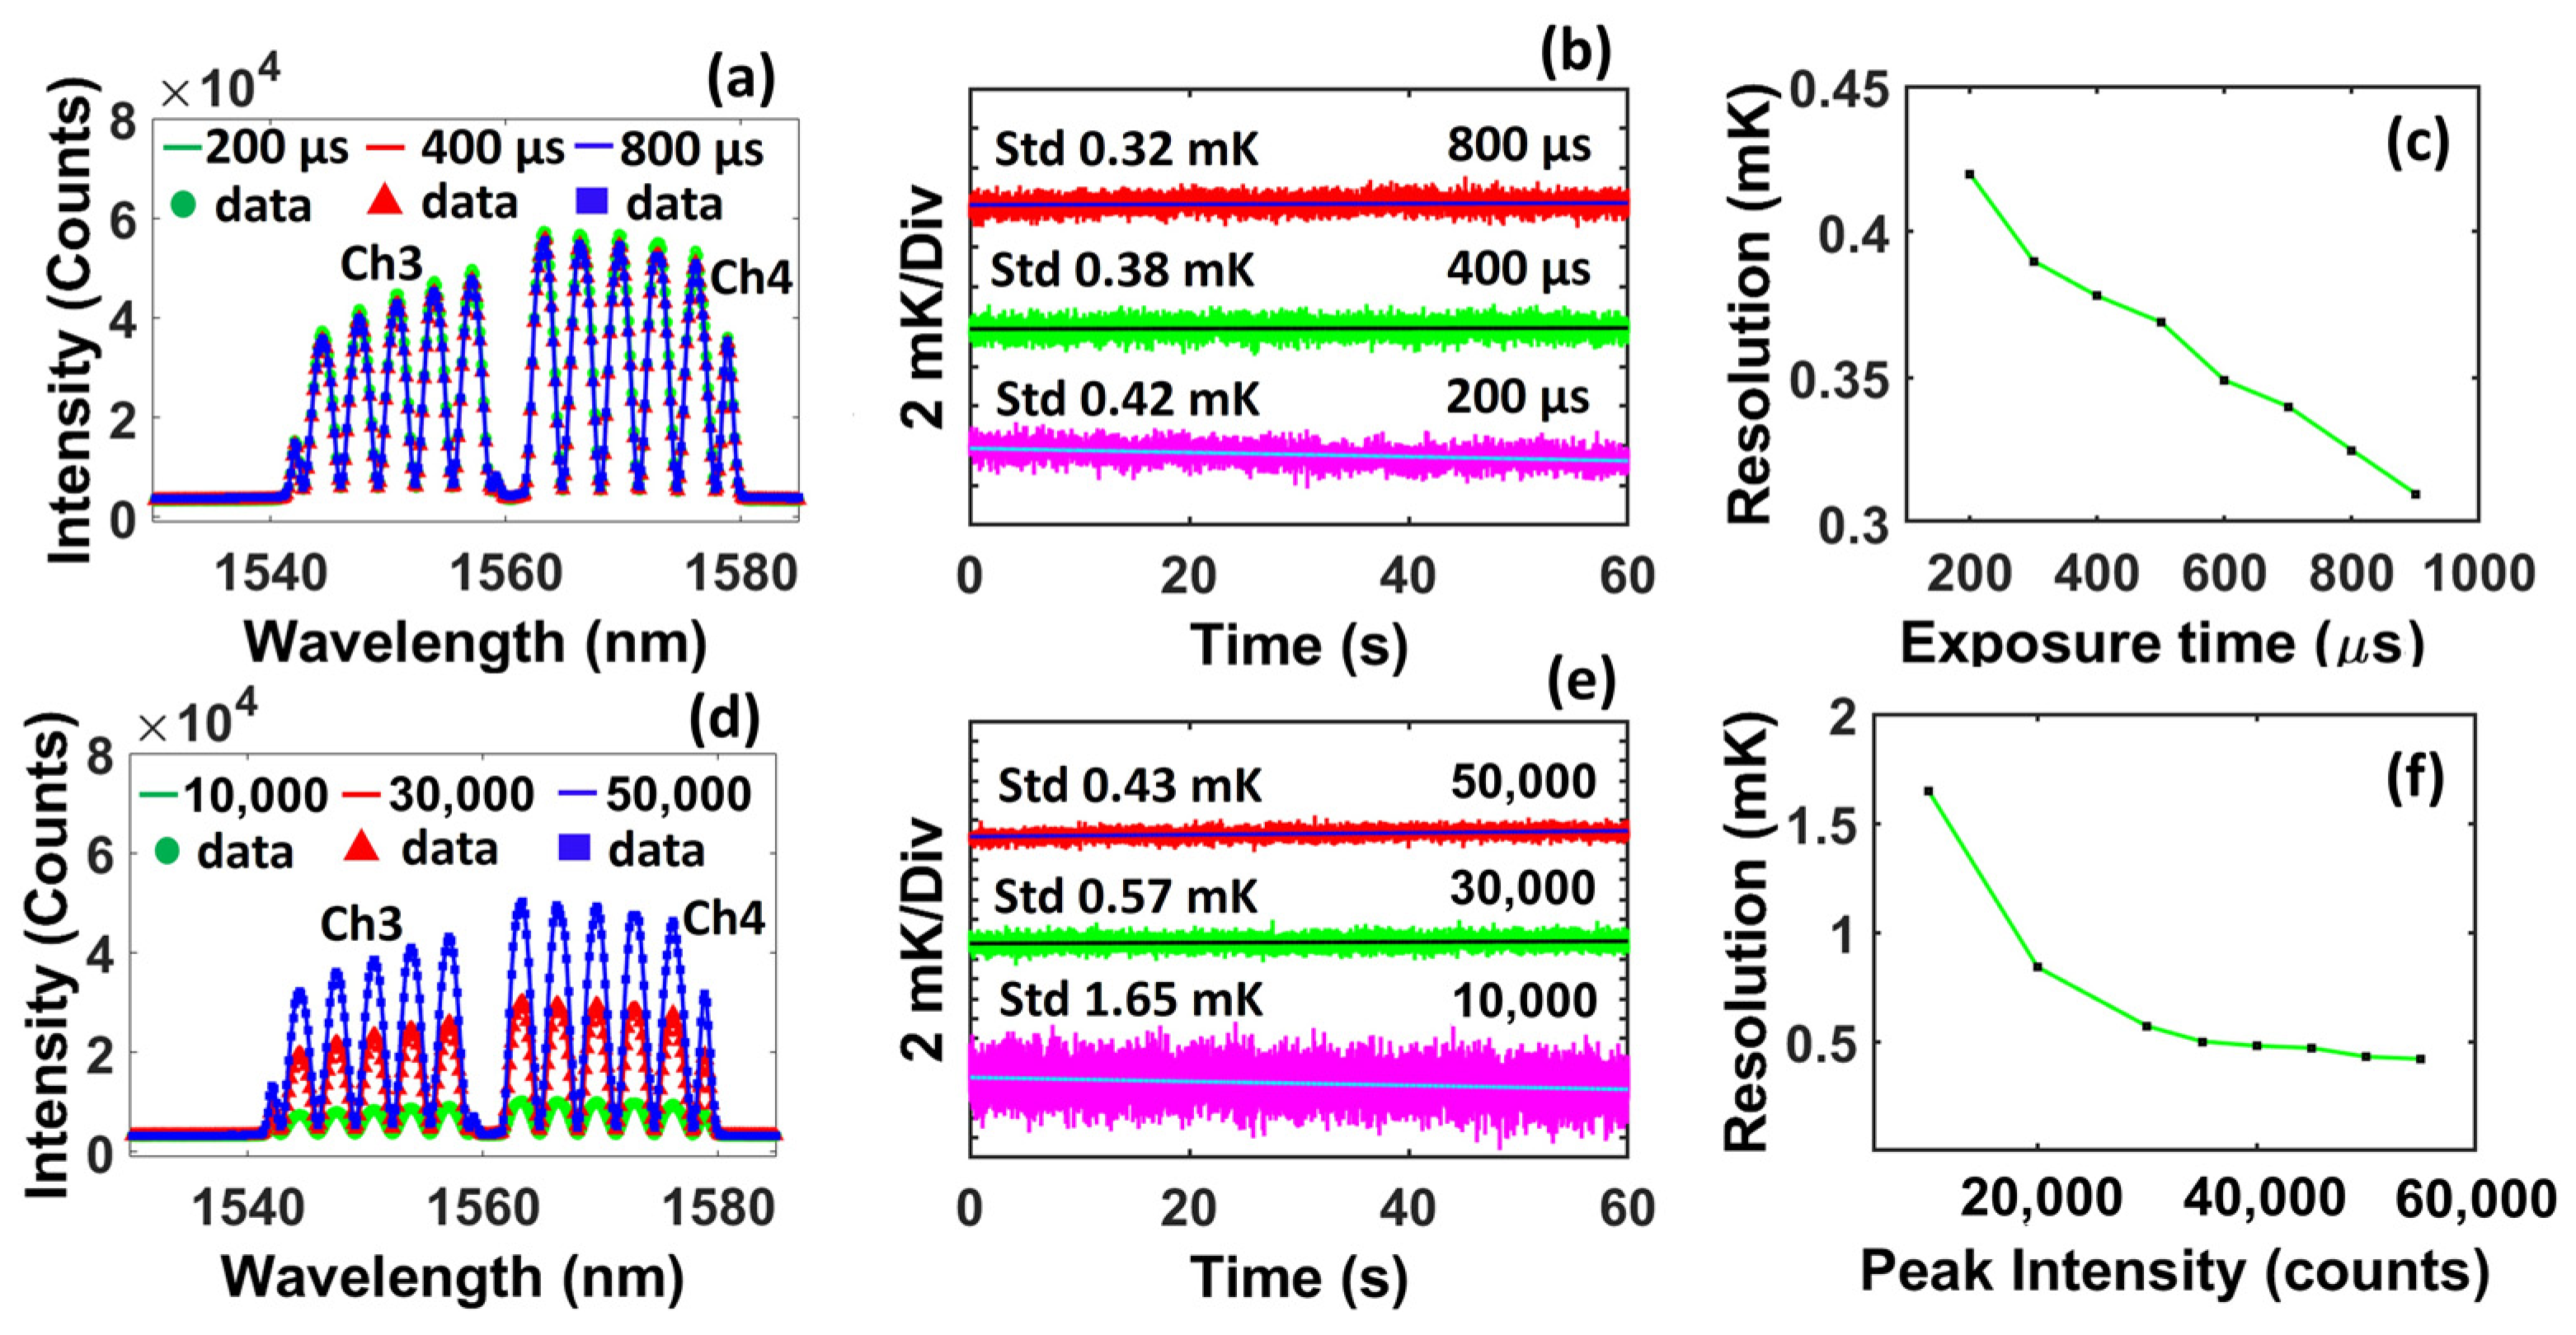
Specifically, we first studied the effect of the exposure time on the measurement resolution using Ch. 3 as an example. In this case, we increased the exposure time of the spectrometer from 200 to 900 μs in steps of 100 μs. Note that increasing the exposure time results in a larger gain of the on-chip charge amplifier that amplifies the photodiode current, leading to increased peak intensity of the spectrometer output. For each value of the exposure time, the peak intensity of the spectrum recorded by the spectrometer was maintained at a constant level of ~55,000 counts (close to the maximum output value of the spectrometer) by adjusting the attenuator on the channel. Figure 3a shows the reflection spectra measured by the spectrometer at three different exposure time values (200, 400, and 800 μs). For each measured spectrum, the wavelength position of each of the fringe valleys was found by fitting the data points around the valley with a sinusoidal function. Then, the shift of the average of the wavelength position of the five valleys within the wavelength range of the CWDM channel was found and converted to temperature variations using a responsivity of 84 pm/K at 1550 nm [10] (the responsivity was corrected using the center wavelength of the channel). To obtain the noise performance, the reflection spectrum was continuously recorded by the spectrometer for around 60 s at a frame rate of 1 kHz while the bolometer was kept in a sealed glass tube without applying radiation from a 405 nm laser. To remove the drift generated by the environmental temperature variation, the moving average with an averaging window size of 100 data points (corresponding to 0.1 s in time) of the temperature reading from the reference bolometer was subtracted from the reading of the sensing bolometer. Residual drift was removed by subtracting the linear temperature variation from the actual temperature variation in the fiber-optic bolometer. The standard deviation of the relative temperature variation was used to specify the resolution of the bolometer. The relative temperature variation in the fiber-optic bolometer connected to Ch. 4 is shown in Figure 3b when the exposure time of the spectrometer was set at 200, 400, and 800 μs. A resolution of 0.42, 0.38, and 0.32 mK was found for the exposure time of 200, 400, and 800 μs, respectively. Figure 3c shows the resolution of the fiber-optic bolometer vs. different exposure times of the spectrometer. It is seen that the value of the resolution reduced as the exposure time increased, which is expected as an increased exposure time corresponds to an increased integration time of the charge amplifier for each of the detector pixels in the photodetector array, resulting in reduced noise from the pixel output. In practice, the maximum exposure time that can be used is determined by the required measurement speed. We also noticed that the improvement in noise performance by increasing the exposure time was moderate. The value of resolution reduced from 0.42 to 0.31 mK when the exposure time increased from 200 to 900 μs.
Next, we studied the effect of the peak intensity from the spectrum output on the noise performance of the bolometer. In this case, the exposure time was set at 200 μs and maintained at this value during the experiment. The peak intensity of the spectrometer output was increased from 10,000 to 55,000 counts by adjusting the attenuation using an attenuator connected to the light source. Figure 3d shows the reflection spectra measured by the spectrometer with three different peak intensity levels (10,000, 30,000, and 50,000 counts). The resolution of the bolometer was characterized following the same process described above. The relative temperature variation measured by the bolometers connected to the Ch. 4 is shown for three different peak intensities in Figure 3e. A noise of 1.65, 0.57, and 0.43 mK was found when the maximum peak intensity counts were set to 10,000, 30,000, and 50,000, respectively. Figure 3f shows the bolometer resolution as a function of peak intensity. It shows that the value of resolution exponentially increased as the peak intensity reduced, and the resolution was strongly influenced by the peak intensity when the peak intensity was below ~35,000 counts. To achieve optimized measurement resolution, the peak intensity should be maintained at >35,000 counts.
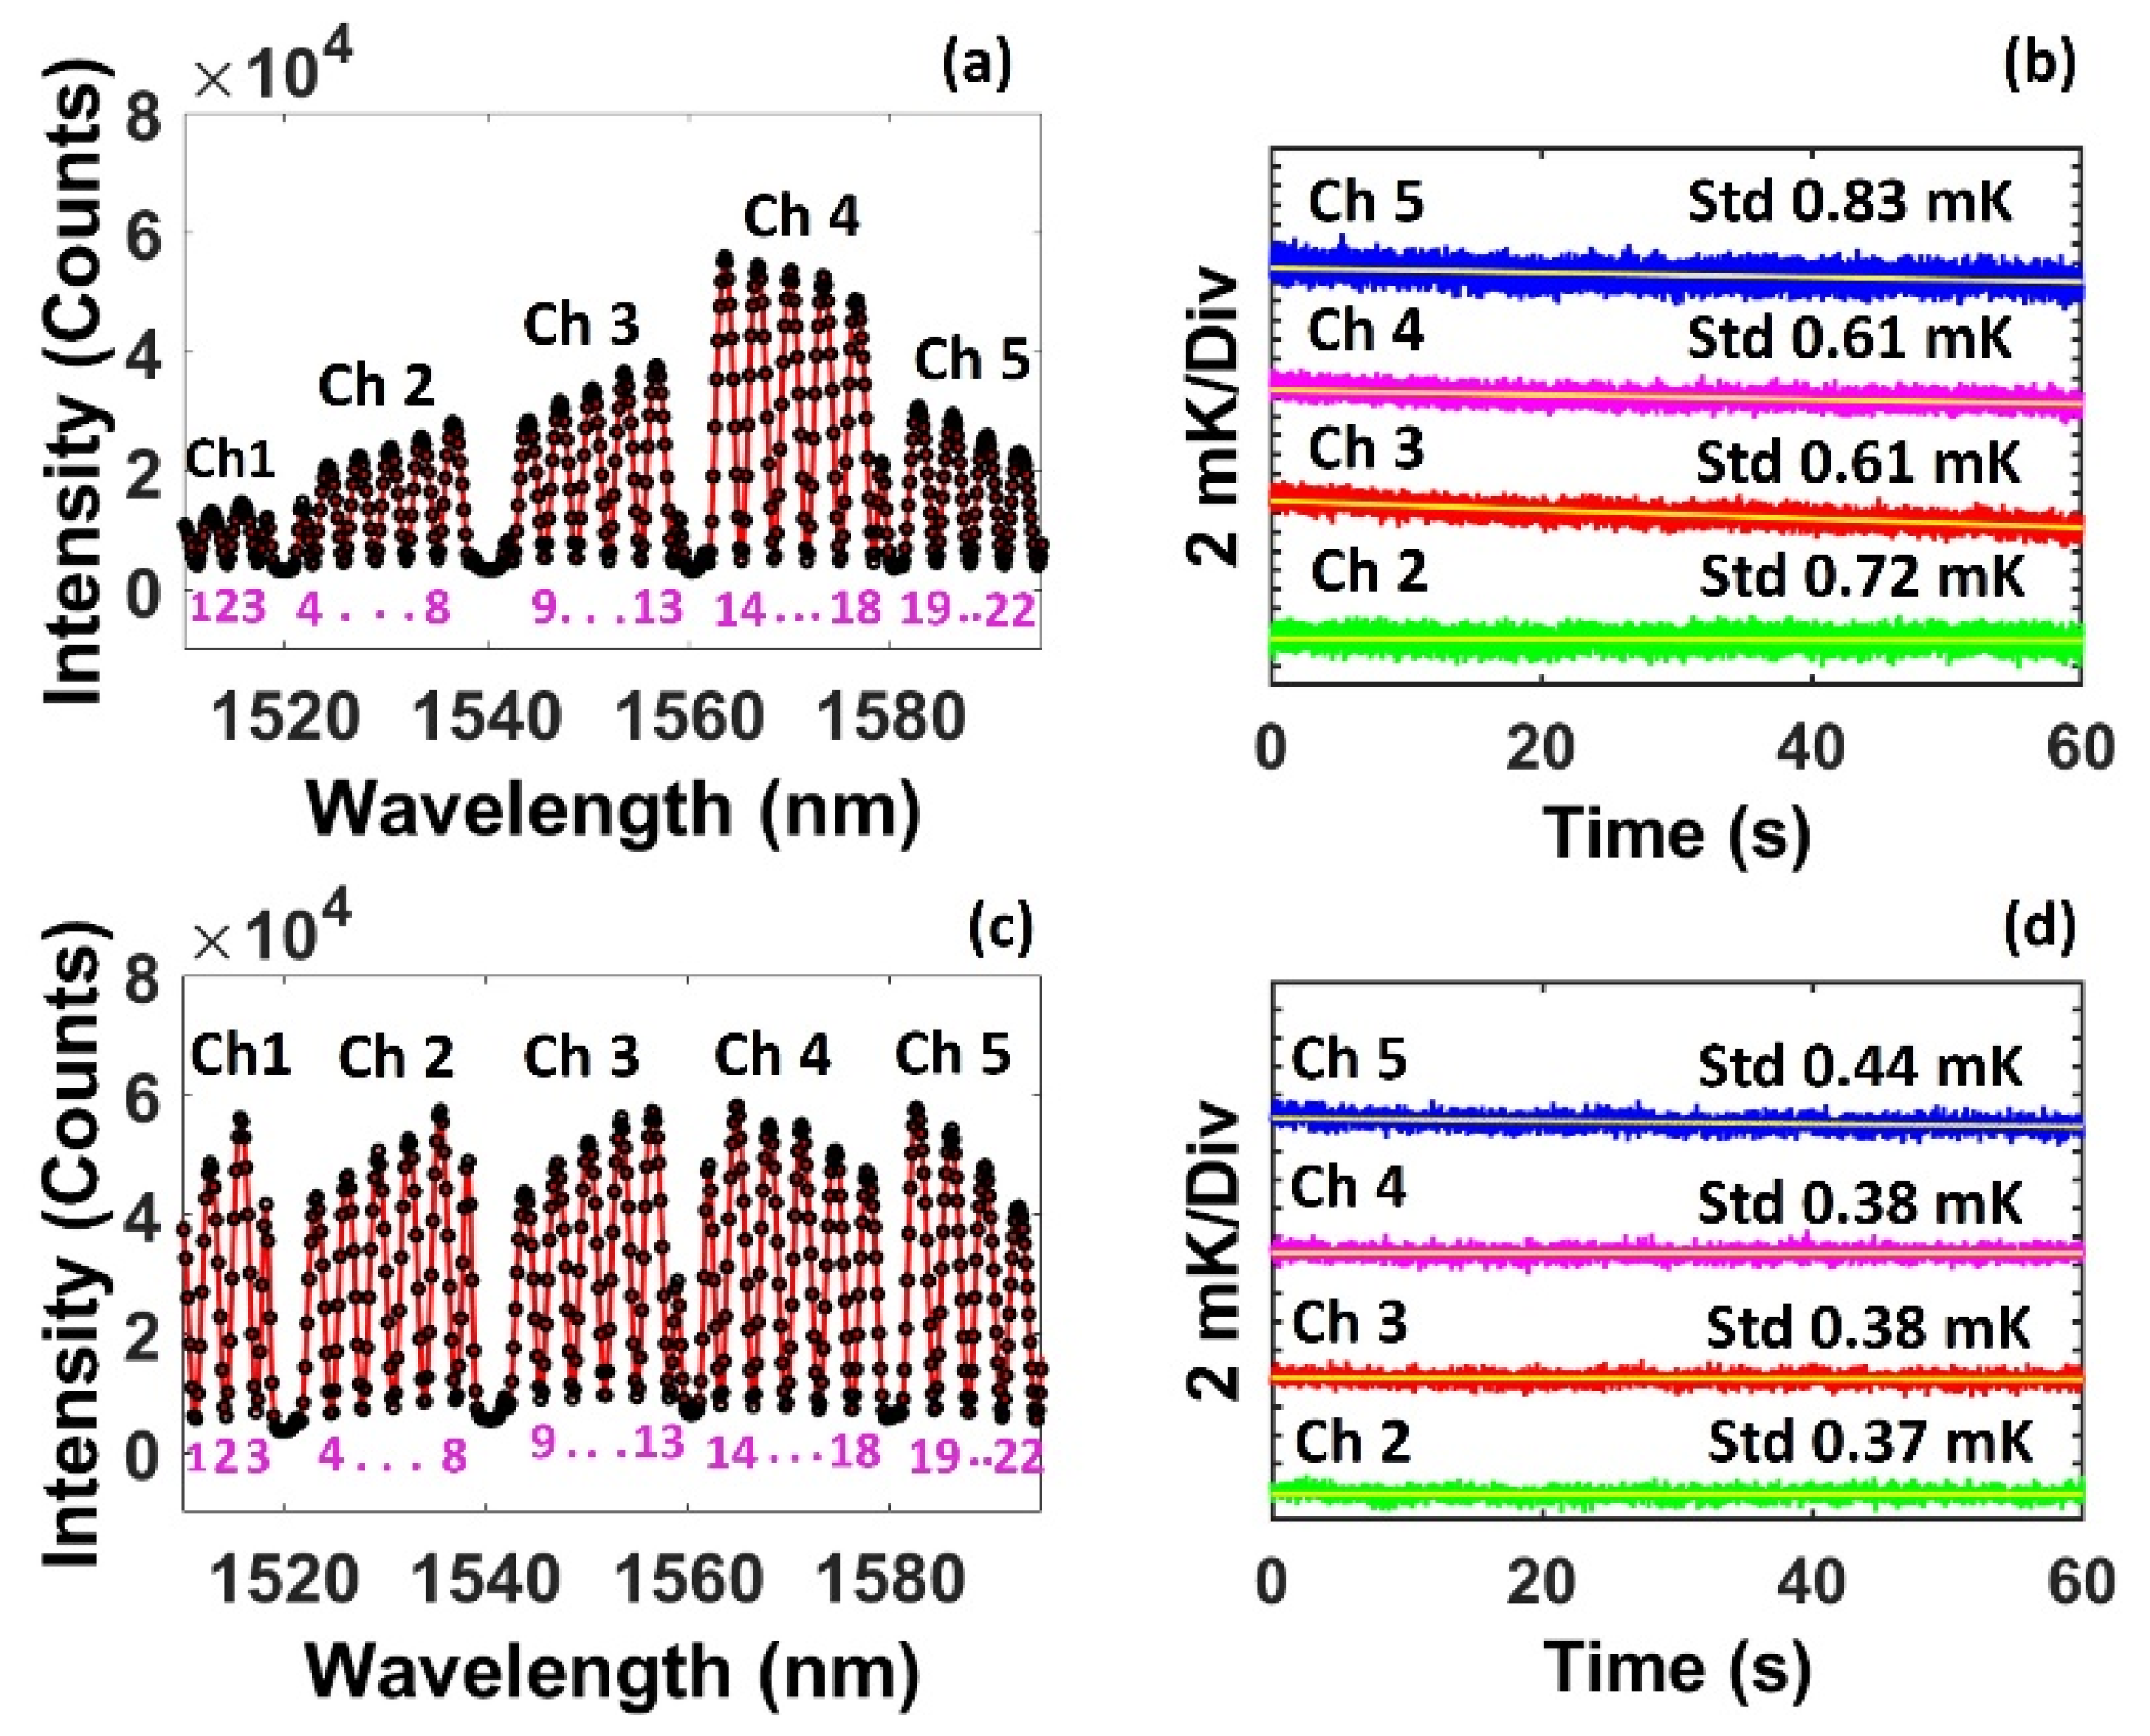
The light source and the spectrometer were shared by all five channels through the CWDM. Because of the non-uniform spectral profile of the light source and the variations in the reflection spectra of individual bolometers, the power spectral densities of the reflected light had large variations among the five channels without the attenuators. Figure 4a shows a spectral frame containing the signal from all five bolometers. The exposure time was set at ~50 μs to prevent the saturation of the spectrometer output for Ch. 4, which had the largest peak intensity at ~55,000 counts. The fringe valleys used for signal processing are also indicated by the numbers in the figure. The spectrum shows large discrepancies in the peak intensity among the five channels with average peak intensities below 35,000, the threshold above which the measurement resolution was not sensitive to the peak intensity, for Chs. 1, 2, and 5 and above the threshold for Chs. 3 and 4. Figure 4b shows the resolution of the four sensing bolometer channels (Chs. 2–5) after compensating for the environmental drift from the reference bolometer channel (Ch. 1). The result shows that Chs. 3 and 4 had similar resolutions of 0.61 mK. Although the peak intensity for Ch. 4 was higher than that for Ch. 3, they exhibited similar resolutions because the intensity of both channels exceeded the threshold of 35,000 counts, as shown in Figure 3d. The resolution increased to 0.72 mK for Ch. 2 and 0.83 mK for Ch. 5 due to the reduced peak intensity below 35,000 counts for these channels. It is worth noting that the number of fringe valleys available for signal processing for Ch. 5 was less than that for other channels connected to the sensing bolometers because of the limited wavelength range of the spectrometer. Five fringe valleys were used for Ch. 2, while only four valleys were available for Ch. 5. Thus, Ch. 5 showed a worse resolution despite its stronger peak intensity compared with Ch. 2.
Using the attenuators in the five channels, we adjusted the peak intensity of each of the channels and the exposure time of the spectrometer, which brought the peak intensities for the five channels to a similar level of 55,000 counts, as shown in Figure 4c. Reaching this maximum peak intensity for all the channels required a larger exposure time set for the spectrometer, which offered additional enhancement to the noise performance. Figure 4d shows the noise performance for this power-balanced configuration. The four sensing bolometers showed a similar measurement resolution around 0.4 mK (ranging between 0.37 and 0.44 mK), which was smaller than the case without attenuators shown in Figure 4b. The variation in the resolution is attributed to the difference in the power variations within each channel that cannot be balanced by the attenuator.

3.2. Difference in Tracking of Fringes Valleys and Fringe Peaks

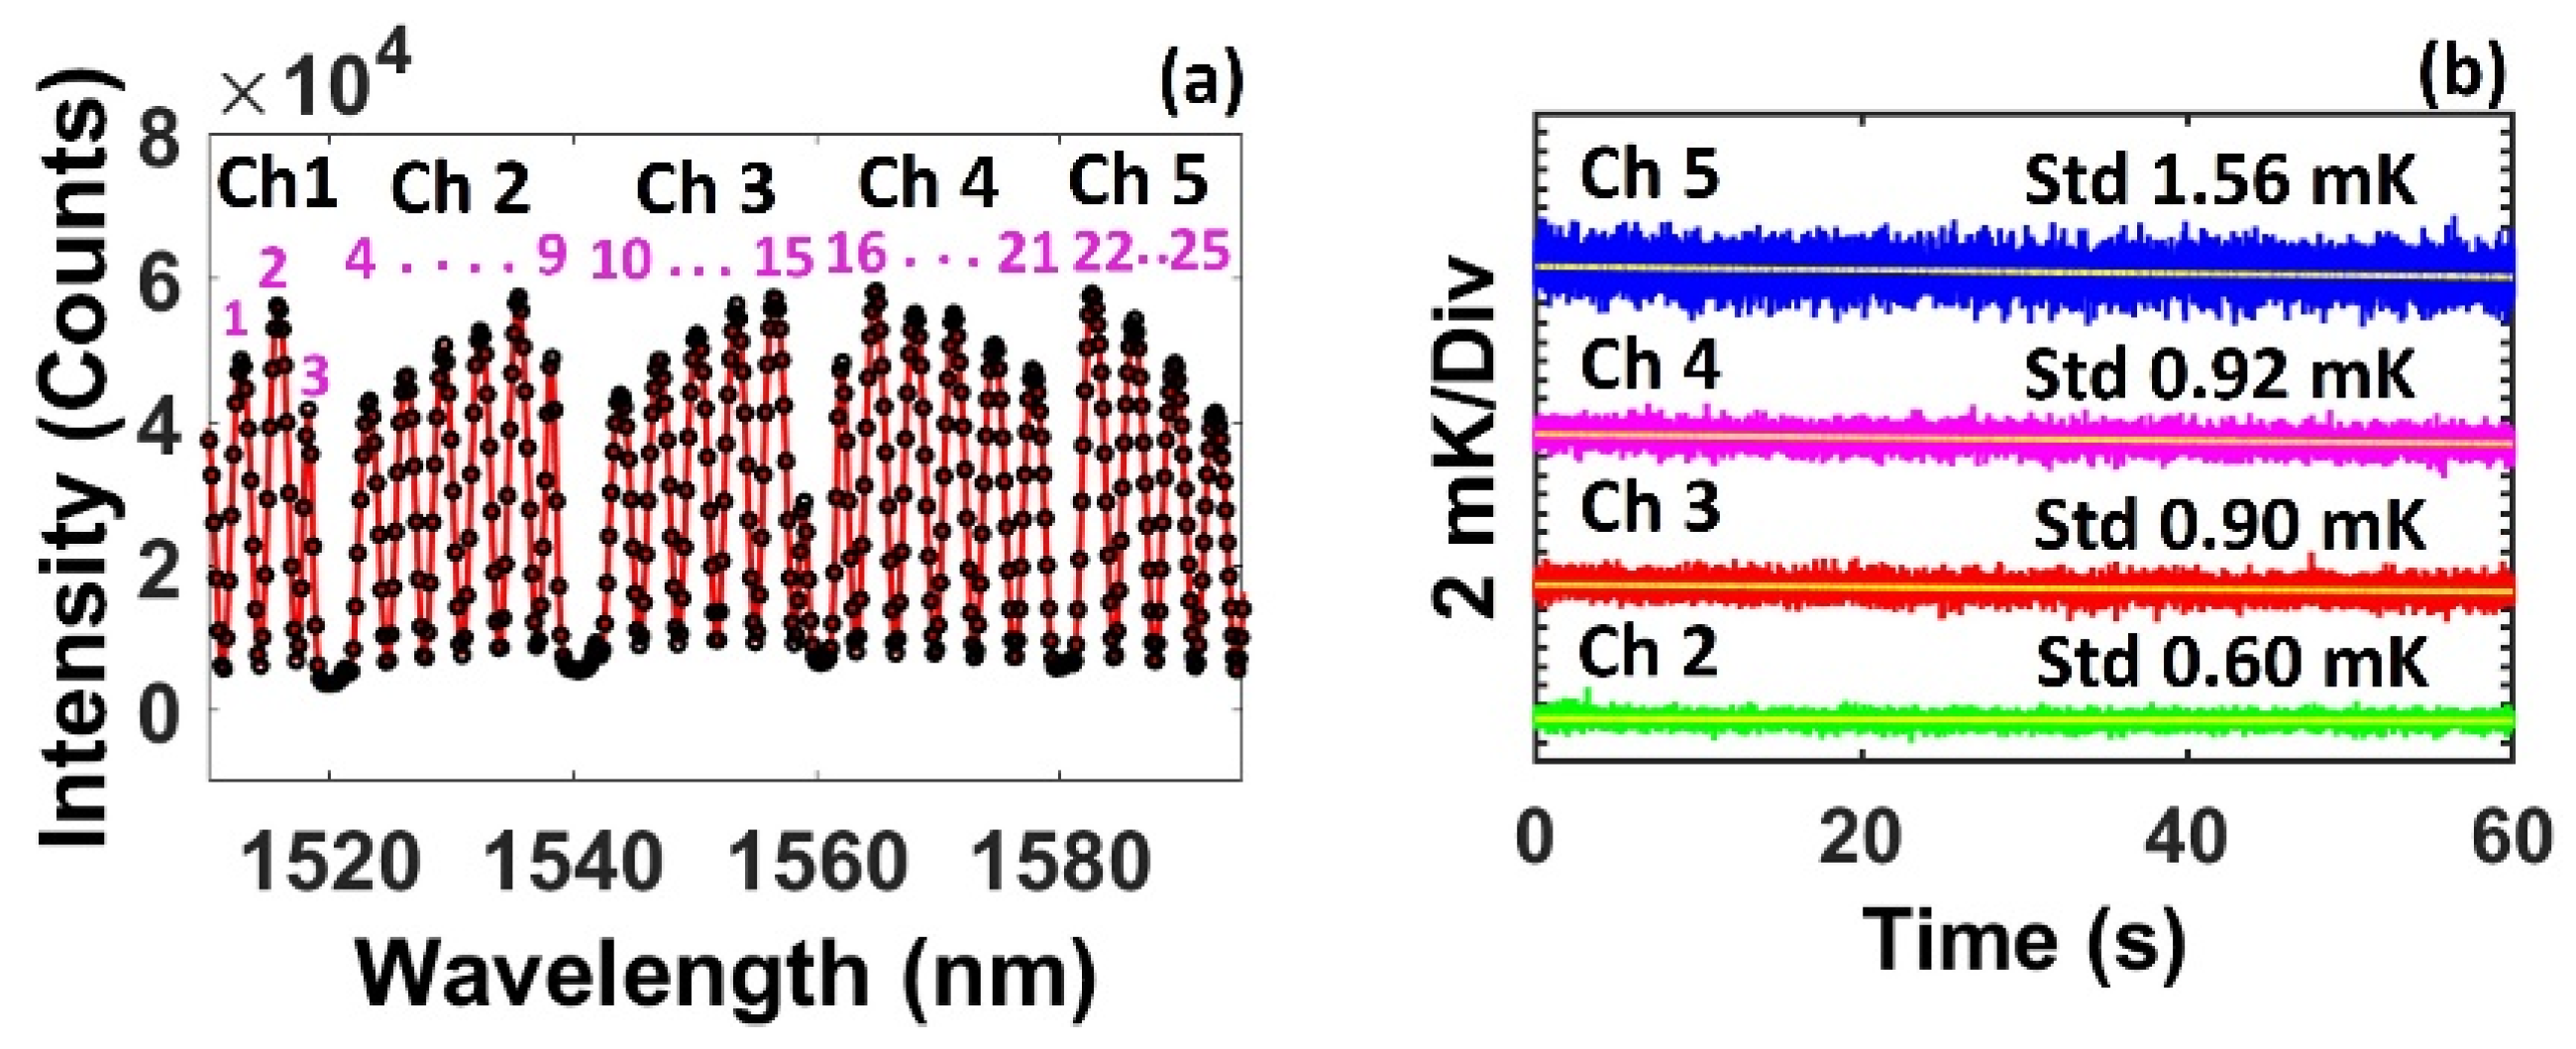
In theory, wavelength tracking can be performed on either fringe valleys or fringe peaks. However, we found that the choice of tracking valleys and tracking peaks has a large effect on the noise performance. Figure 5a represents the reflection spectrum for tracking the peaks for the five bolometers with a balanced peak intensity. Note that the spectrum is identical to that shown in Figure 4c. The number of peaks used for signal processing is identical to the number of valleys used for signal processing for Chs. 1 and 5; while the number of peaks is greater than the number of valleys by one for the other three channels (Chs. 2–4). The peak wavelength was found following the same algorithm used for finding the valley wavelength. Figure 5b shows the resolution for the four sensing bolometers using fringe peak tracking. Compared with valley tracking, peak tracking exhibited remarkably worse noise performance for all channels despite using more peaks than valleys in Chs. 2–4. The measurement resolutions also show large variations ranging from 0.60 mK for Ch. 2 to 1.56 mK for Ch. 5. The degradation in the noise performance from fringe valley tracking to peak tracking can be explained as follows: the noise of the pixel output is proportional to the light intensity; thus the pixels around the fringe peaks show larger noise than those around the valleys, resulting in larger variations in the results from the curve fitting using the data points around the peaks.

3.3. Effect of Mechanical Vibration

Large mechanical vibration can be present in a magnetic-confinement fusion system that may contaminate the signal from an optical diagnostic system. For example, it has been shown that mechanical vibration can cause movements up to 1 cm at frequencies of a few hertz for the interferometry measurement system on tokamaks [11,12]. Signal contamination from mechanical vibration is also a concern for the fiber-optic bolometer system. Silicon pillars that form the FP cavity in a bolometer may have a small birefringence due to the thermal stress and elastic strains of the silicon wafer from which the pillars are manufactured [13]. The birefringence makes the bolometer sensitive to light polarizations. Previously, we demonstrated that fiber-optic bolometers interrogated using linearly polarized light from a DFB laser show significant noise degradation from mechanical vibration that induces birefringence to the fiber and subsequently changes the polarization of the light in the fiber [14]. The light source used here is a SLED, which may have non-negligible degree of polarization. Therefore, it is important to study the effect of mechanical vibration on the noise performance of the system.
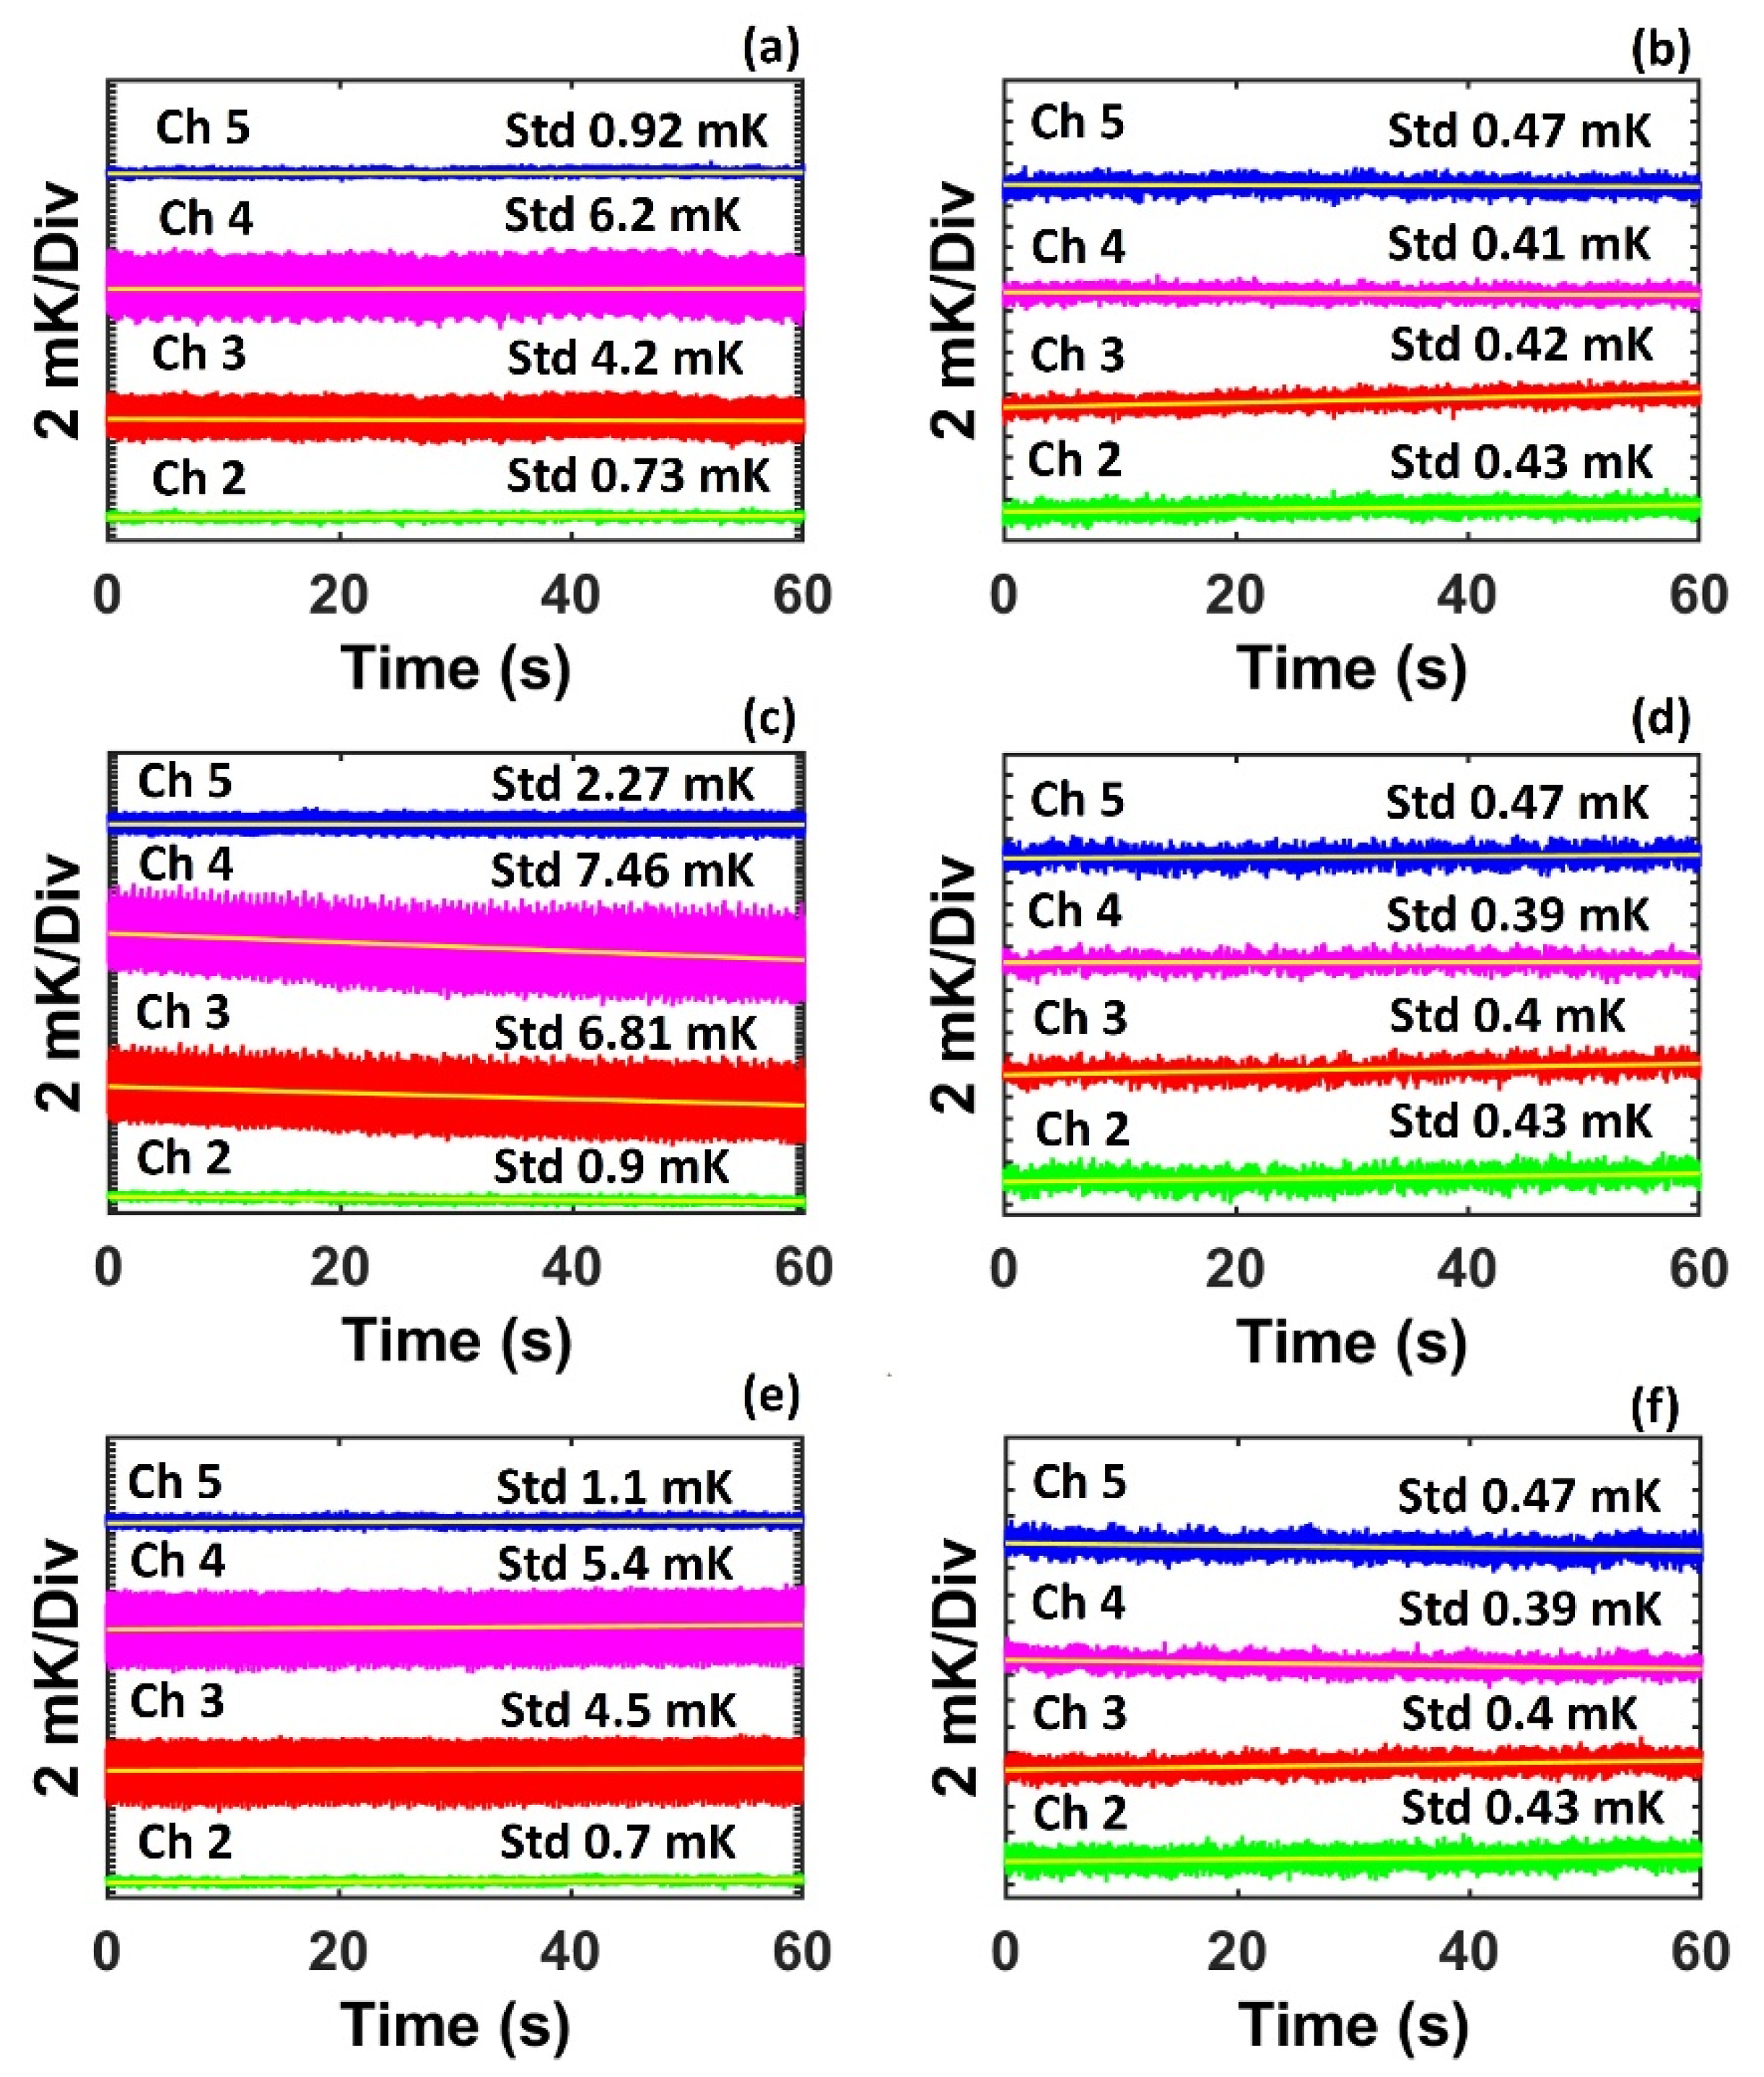
After optimizing the experimental setup with an attenuator to balance the peak intensity of the channels and using fringe valley tracking for signal processing, mechanical vibration was applied by using an electromagnetic shaker in the fiber before the CWDM. The vibration was applied using frequencies of 5, 10, and 100 Hz with peak-to-peak sinusoidal displacements of ~7, ~5, and ~1 mm, respectively. Figure 6a shows the relative temperature variation for the sensing bolometers in Chs. 2–5 in the case of the 5 Hz vibration applied on the fiber. It is seen that the vibration significantly degraded the noise performance with the temperature resolution being 0.73, 4.2, 6.2, and 0.92 mK for Chs. 2–5, respectively. It is believed that the degradation of noise performance is determined by the birefringence of the silicon pillars and the orientation of the light polarization relative to the principal axes of the birefringence, both of which are uncontrolled during the construction of the bolometer and during the operation of the bolometer system. Therefore, the level of performance degradation shows a great variation among the four sensing bolometers.
To mitigate the effect of the mechanical vibration, a polarization scrambler was used after the SLED to randomize the polarization state at a speed (5 MHz) much higher than the frame rate (1 kHz) of the spectrometer. Therefore, the light injected into the bolometer can be considered as unpolarized, which is insensitive to the changes in the birefringence induced by the mechanical vibration. Figure 6b shows the resolution after the polarization scrambler was applied when the fiber was experiencing the 5 Hz mechanical vibration. The results show that Chs. 2–5 had a much lower and similar noise level of ~0.43 mK (ranging between 0.41 and 0.47 mK), which is comparable to the noise performance when there was no vibration, as shown in Figure 4d.
A similar effect was found when vibration was applied at a frequency of 10 and 100 Hz. Noise levels were higher and non-uniform among the sensing bolometers with the application of vibration and without polarization scrambling; the noise levels reduced to ~0.42 mK, relatively uniformly for all bolometers after the use of the polarization scrambler, as shown in Figure 6c–f. The results show that the polarization scrambler is effective for mitigating the degradation from mechanical vibration.

3.4. NEPDs and Time Constants

The responsivities and time constants of the four sensing bolometers (Chs. 2–5) were characterized by exposing the bolometers to radiation from a 405 nm laser modulated by a square wave of 0.1 Hz with different levels of amplitude. Figure 7a–d shows the relative temperature changes of the bolometer when radiation with a power density amplitude of 74 W/m2 impinged on to the bolometers. The average temperature rise when the bolometers reached a steady state was 272 mK (range: 222–312 mK), corresponding to an average responsivity of 3.68 mK/(W/m2) (range: 3.0–4.2 mK/(W/m2)). The insets of Figure 6a–d show the close-up views of the responses at the transient in response to the step changes of the radiation. The time constant of each bolometer, which is a measure of the measurement speed of the bolometer, was found by the time it took for the temperature to fall to 63% of the overall temperature change during the cycle when the laser was switched off. The average time constant of the bolometer was 223 ms (range: 192–235 ms). The variations in the responsivity and the time constant among the four bolometers are believed to arise from different amounts of glue and/or from the variation in the gold disk sizes used to fabricate each of the bolometers that affect the thermal mass of the bolometers and the heat transfer process between the bolometers and the ambient air.
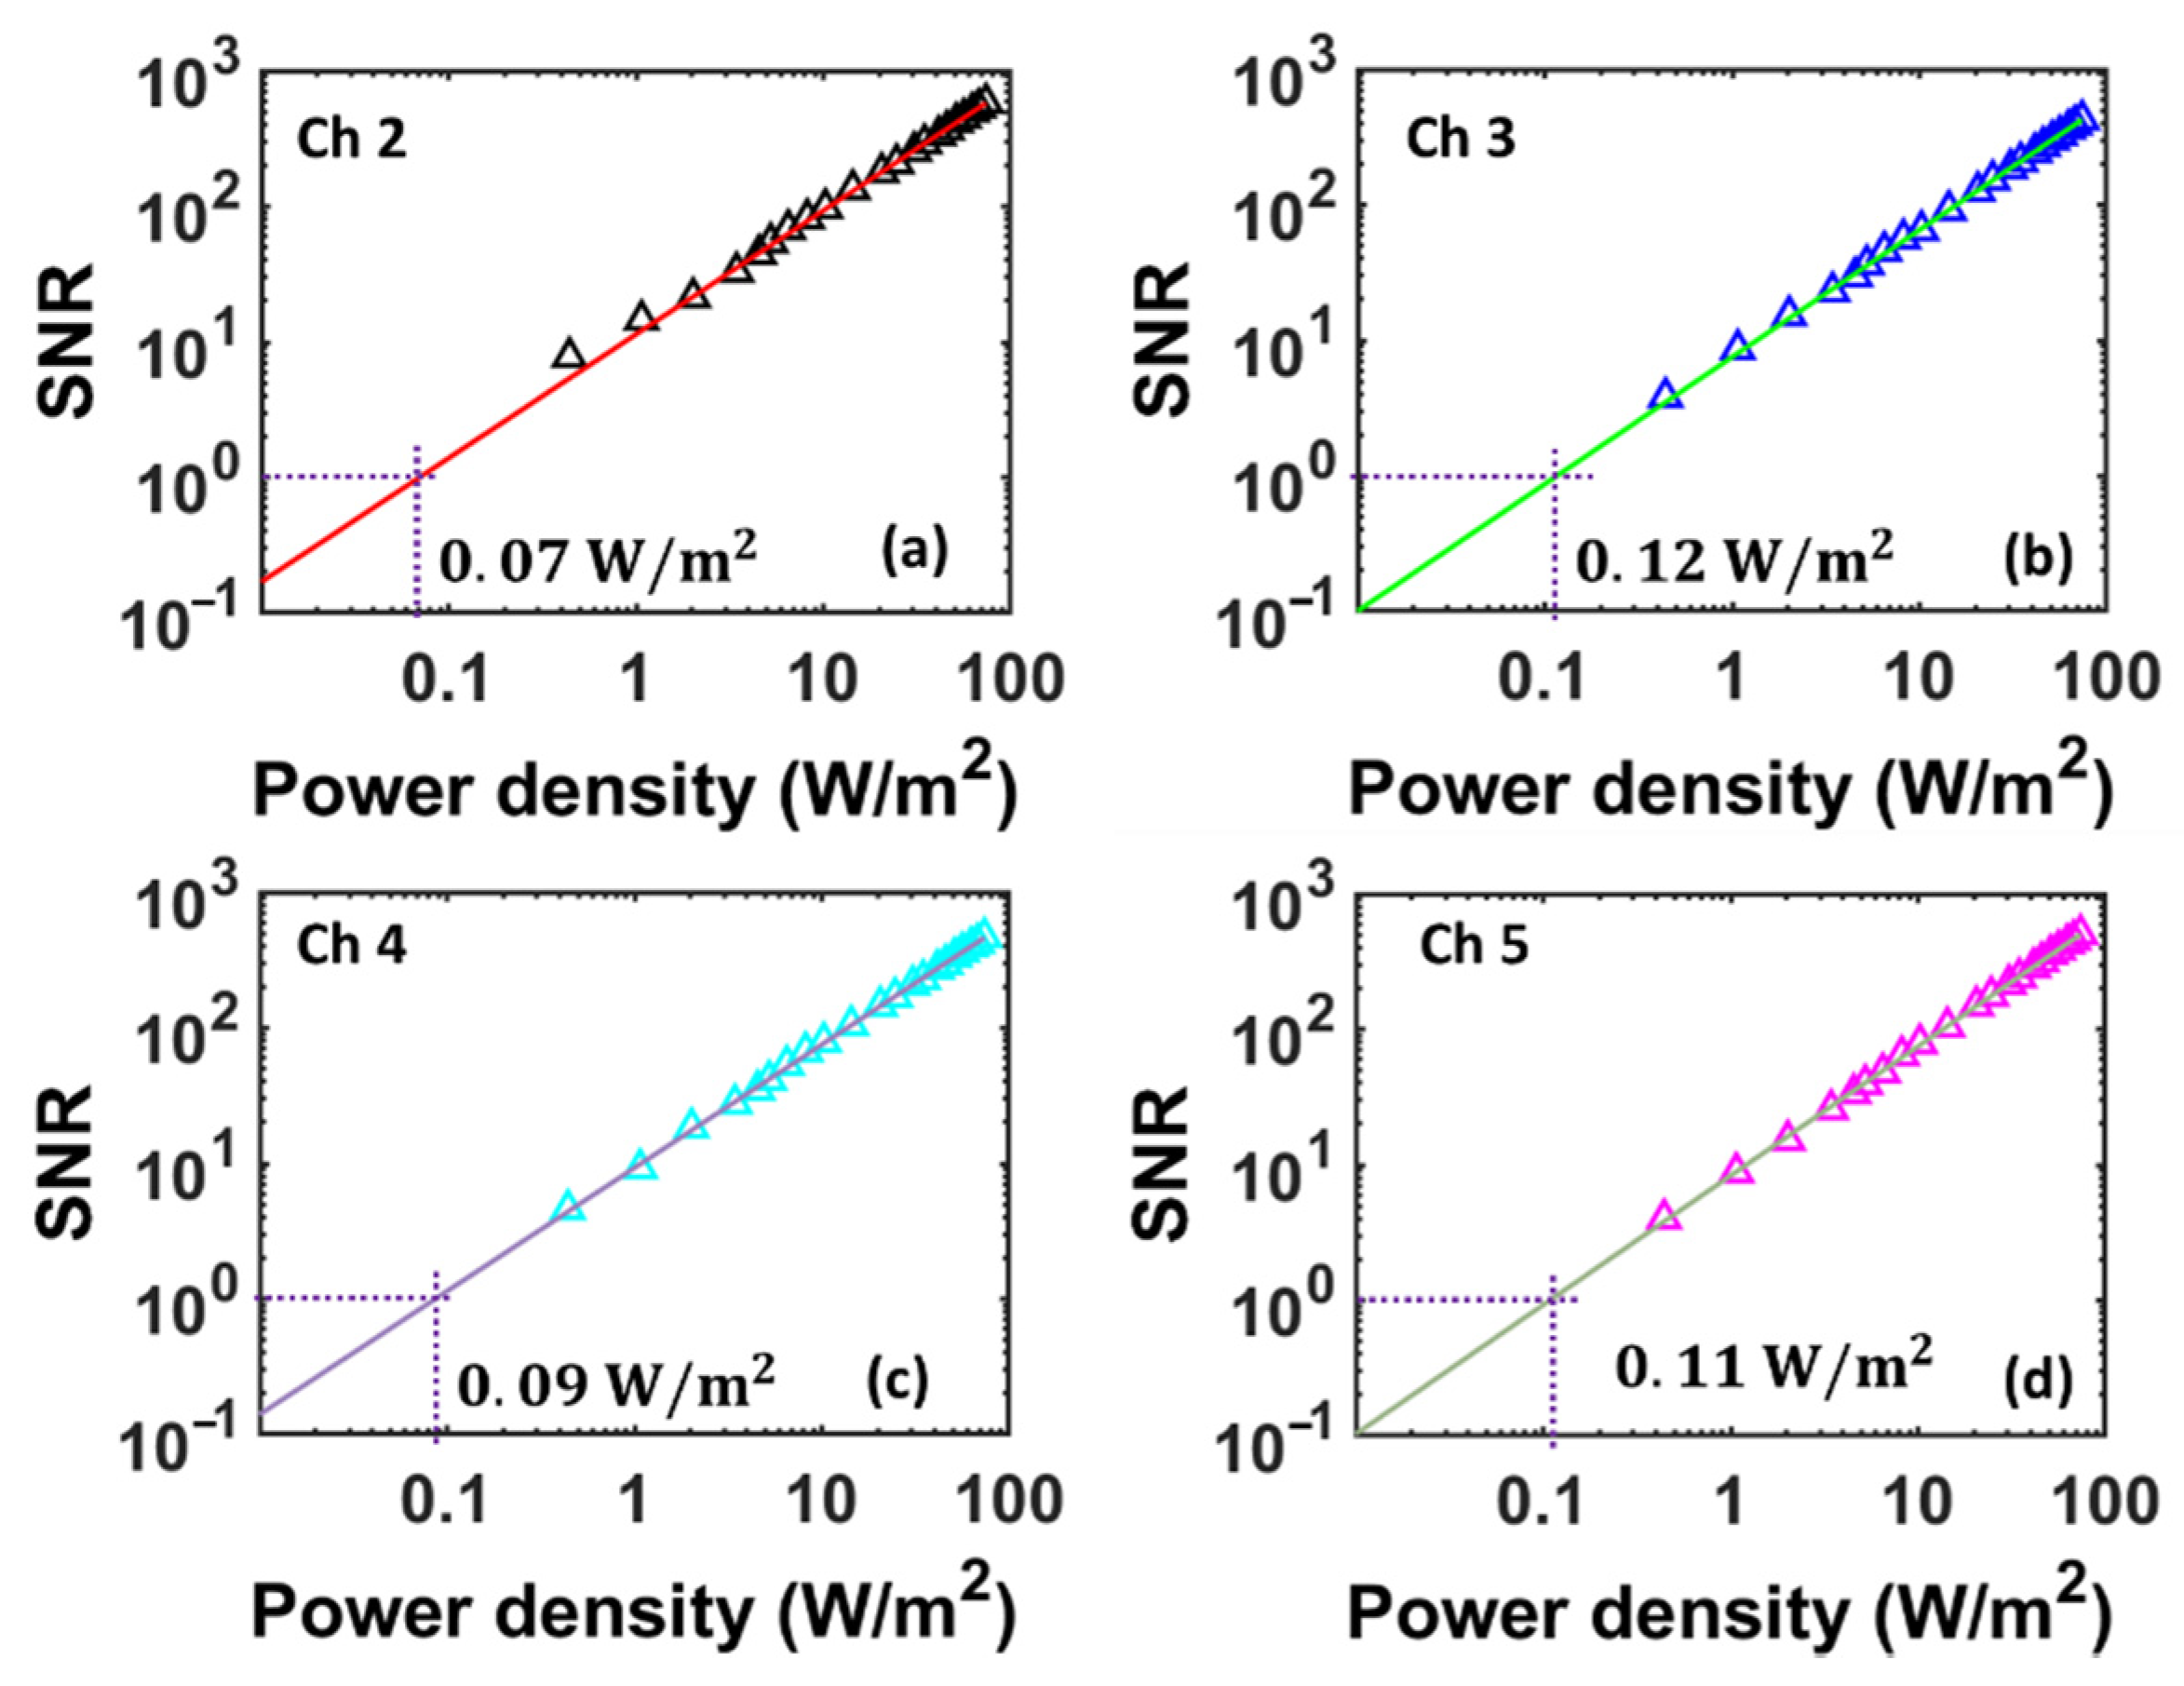
To characterize the NEPD for each bolometer, we exposed the bolometer with radiation of different levels of amplitude and calculated the signal-to-noise ratio (SNR) at each radiation level. The SNR was found by dividing the temperature rise from the radiation when the bolometer reached a steady state by 2 σ T , where σ T is the temperature resolution of the bolometer defined in Section 3.1, Section 3.2, Section 3.3 and Section 3.4. Figure 8a–d shows the SNR vs. power density for the four sensing bolometers. The NEPD is the power density level corresponding to a unity SNR, which can be found from the linear fitting line shown in Figure 8. The average NEPD for the four bolometers was 0.10 W/m2 (range: 0.07–0.12 W/m2), which is similar to the NEPD of the fiber-optic bolometer based on a high-finesse silicon FPI interrogated using a wavelength-scanning DFB laser [7]. Again, the variation in the NEPD among the sensing bolometers is attributed to the fabrication variations resulting in different thermal masses of bolometers.

4. Discussion

Several factors need to be considered in choosing the diameter and thickness of the silicon pillars used for fabrication of the fiber-optic bolometers. A silicon pillar with a smaller diameter will have a shorter response time. However, the diameter needs to be sufficiently large to provide a sufficient end surface for robust bonding between the silicon pillar and the relatively large gold disk. The thickness of the pillar determines the cavity length of the FPI and consequently the FSR of the FPI. Short pillars have coarse fringes that may result in reduced wavelength measurement resolution; while long pillars may result in dense fringes that cannot be resolved by the spectrometer.
Both the responsivity and the time constant of a fiber-optic bolometer are affected by the efficiency of the thermal pathways for the heat dissipation from the bolometer head to the surrounding environment. In this work, they were measured at around normal temperature and pressure, and the heat transfer involves the natural convection to the ambient air and the conduction to the fiber stub. The responsivity and the time constant characterized in these conditions may not be representative of the bolometers in a vacuum environment where there is no convection. However, they can be used for performance comparison with other fiber-optic bolometer systems that have been tested under similar conditions.

5. Conclusions

We report a multichannel fiber-optic bolometer system intended for measuring the plasma radiation from the fusion chamber. The system consists of five bolometers (one reference bolometer and four sensing bolometers) that are multiplexed using a CWDM and interrogated using a single light source and a high-speed spectrometer. System parameters are configured to achieve optimized noise performance and resistance to mechanical vibration. The experimental result suggests that the bolometers have an NEPD of ~0.1 W/m2 with a time constant of ~220 ms under normal temperature and pressure. These performances are comparable to the more complicated fiber-optic bolometer system based on high-finesse FPIs. This multichannel fiber-optic bolometer system offers simple bolometer fabrication, good noise performance, lower cost per channel, and large dynamic range, which makes it attractive for plasma radiation measurement in magnetic-confinement fusion systems.

Author Contributions

Conceptualization, M.H., M.L.R., M.S. and D.D.; formal analysis, N.U., Q.S. and S.L.; investigation, N.U. and Q.S; writing—original draft preparation, N.U. and M.H.; writing—review and editing, N.U., Q.S., S.L., M.L.R., D.D., M.S. and M.H.; supervision, M.L.R., D.D., M.S. and M.H.; project administration, M.S.; funding acquisition, M.L.R., D.D., M.S. and M.H. All authors have read and agreed to the published version of the manuscript.

Funding

This research was funded by the Department of Energy (contract no. DE-AC05-00OR22725). The work of M. L. Reinke was supported by the Commonwealth Fusion Systems.

Institutional Review Board Statement

Not applicable.

Informed Consent Statement

Not applicable.

Data Availability Statement

The data presented in this study are available on request from the corresponding author.

Acknowledgments

The authors thank Brian Wright and Karl Dersch from Michigan State University for assistance in device fabrication.

Conflicts of Interest

The authors declare no conflict of interest. The funders had no role in the design of the study; in the collection, analyses, or interpretation of data; in the writing of the manuscript; or in the decision to publish the results.

Abbreviations

FPIFabry–Pérot interferometer
CWDMCoarse wavelength division multiplexer
SLEDSuperluminescent light-emission diode
SMFSingle-mode fiber
NEPDNoise-equivalent power density
DFBDistributed feedback
FSRFree spectral range
UVUltraviolet
SNR Signal-to-noise ratio

References

  1. Meister, H.; Giannone, L.; Horton, L.; Raupp, G.; Zeidner, W.; Grunda, G.; Kalvin, S.; Fischer, U.; Serikov, A.; Stickel, S. The ITER bolometer diagnostic: Status and plans. Rev. Sci. Instrum. 2008, 79, 10F511. [Google Scholar] [CrossRef] [PubMed] [Green Version]
  2. Duan, Y.; Hu, L.; Mao, S.; Chen, K.; Lin, S.; Team, E.D. The resistive bolometer for radiated power measurement on EAST. Rev. Sci. Instrum. 2012, 83, 093501. [Google Scholar] [CrossRef] [PubMed]
  3. Ferreira, D.R.; Carvalho, P.J.; Carvalho, I.S.; Stuart, C.; Lomas, P.J.; Contributors, J. Monitoring the plasma radiation profile with real-time bolometer tomography at JET. Fusion Eng. Des. 2021, 164, 112179. [Google Scholar] [CrossRef]
  4. Lee, M.U.; Thatipamula, S.G.; Bae, S.; Kim, J.; Kim, J.; Lehnen, M.; Yun, G.S. Radiation measurement in plasma disruption by thin-foil infrared bolometer. Rev. Sci. Instrum. 2021, 92, 053536. [Google Scholar] [CrossRef] [PubMed]
  5. Meister, H.; Bernert, M.; Biel, W.; Han, M.; Ingesson, L.; Mukai, K.; Penzel, F.; Peterson, B.; Reichle, R.; Reinke, M. Bolometer developments in diagnostics for magnetic confinement fusion. J. Instrum. 2019, 14, C10004. [Google Scholar] [CrossRef]
  6. Sheng, Q.; Liu, G.; Reinke, M.L.; Han, M. A fiber-optic bolometer based on a high-finesse silicon Fabry-Pérot interferometer. Rev. Sci. Instrum. 2018, 89, 065002. [Google Scholar] [CrossRef] [PubMed]
  7. Uddin, N.; Sheng, Q.; Mitul, A.F.; Lee, S.; Reinke, M.L.; Donovan, D.; Shafer, M.; Han, M. Fiber-optic silicon Fabry-Perot interferometric bolometer with improved detection limit for magnetic confinement fusion. Rev. Sci. Instrum. 2021, 92, 023515. [Google Scholar] [CrossRef] [PubMed]
  8. Zhang, Y.; Li, Y.; Wei, T.; Lan, X.; Huang, Y.; Chen, G.; Xiao, H. Fringe visibility enhanced extrinsic Fabry-Perot interferometer using a graded index fiber collimator. IEEE Photonics J. 2010, 2, 469–481. [Google Scholar] [CrossRef]
  9. Emkey, W.; Jack, C. Analysis and evaluation of graded-index fiber lenses. J. Light. Technol. 1987, 5, 1156–1164. [Google Scholar] [CrossRef]
  10. Liu, G.; Han, M.; Hou, W. High-resolution and fast-response fiber-optic temperature sensor using silicon Fabry-Pérot cavity. Opt. Express 2015, 23, 7237–7247. [Google Scholar] [CrossRef] [Green Version]
  11. Carlstrom, T.; Ahlgren, D.; Crosbie, J. Real time, vibration compensated CO2 interferometer operation on the DIII-D tokamak. Rev. Sci. Instrum. 1988, 59, 1063–1066. [Google Scholar] [CrossRef]
  12. Bergerson, W.; Xu, P.; Irby, J.; Brower, D.; Ding, W.; Marmar, E. Far-infrared polarimetry diagnostic for measurement of internal magnetic field dynamics and fluctuations in the C-MOD Tokamak. Rev. Sci. Instrum. 2012, 83, 10E316. [Google Scholar] [CrossRef] [PubMed] [Green Version]
  13. Lederhandler, S. Infrared studies of birefringence in silicon. J. Appl. Phys. 1959, 30, 1631–1638. [Google Scholar] [CrossRef]
  14. Sheng, Q.; Liu, G.; Uddin, N.; Reinke, M.L.; Han, M. Fiber-Optic Silicon Fabry-Perot Interferometric Bolometer: The Influence of Mechanical Vibration and Magnetic Field. J. Light. Technol. 2020, 38, 2547–2554. [Google Scholar] [CrossRef]
Figure 1. (a) System configuration of a previously reported bolometer system (inset shows the bolometer structure based on a high-finesse FPI); PD: photodetector; HR: high reflection. (b) System configuration of the multichannel bolometer system reported here (inset shows the bolometer structure based on a low-finesse FPI used in this work).
Photonics 08 00344 g001
Figure 2. (a) Fabrication steps of the fiber-optic bolometers; (b) microscopic image of one of the fabricated bolometers; (c) scanning electron microscope image of the gold disk used to fabricate the bolometer shown in (b); (d) reflection spectrum of the bolometer measured by a fiber-optic sensor interrogator; (e) experimental setup for demonstrating and testing the multi-channel bolometer system; (f) bolometers in a sealed glass tube for noise test; and (g) bolometers sealed in an aluminum cube for radiation response measurement.
Photonics 08 00344 g002
Figure 3. (a,d) Reflection spectrum from the fiber-optic bolometers measured by the spectrometer at different exposure times and peak intensities, respectively; (b,e) relative temperature variation measured by the bolometers connected to Ch. 4 at different exposure time values and peak intensities, respectively; and (c,f) variation in the measurement resolution with exposure time values of the high-speed spectrometer and peak intensities, respectively.
Photonics 08 00344 g003
Figure 4. (a,c) Reflection spectrum from the fiber-optic bolometers captured by the spectrometer without the attenuator and with the power balanced by the attenuators, respectively; (b,d) relative temperature variation for Chs. 2–5 without the attenuator and with the power balanced by the attenuators, respectively.
Photonics 08 00344 g004
Figure 5. (a) Reflection spectrum from the fiber-optic bolometers captured by the spectrometer with the power balanced by the attenuators for peak tracking; (b) relative temperature variation for Chs. 2–5 found from peak tracking.
Photonics 08 00344 g005
Figure 6. (a,c,e) System noise under 5, 10, and 100 Hz vibration, respectively, without a polarization scrambler; (b,d,f) system noise 5, 10, and 100 Hz vibration, respectively, when the polarization scrambler was on.
Photonics 08 00344 g006
Figure 7. The response of the bolometers connected to Chs. 2 (a), 3 (b), 4 (c), and 5 (d) when each of them was exposed to a 0.1 Hz square wave power flux at ~74 W/m2. Insets are the close-up view of the falling transients of the responses.
Photonics 08 00344 g007
Figure 8. (ad) Measured SNR vs. power density for the bolometers connected to channels 2–5, respectively.
Photonics 08 00344 g008
Publisher’s Note: MDPI stays neutral with regard to jurisdictional claims in published maps and institutional affiliations.