Article

VOC Monitoring and Ozone Generation Potential Analysis Based on a Single-Photon Ionization Time-of-Flight Mass Spectrometer

1
Shandong Provincial Engineering and Technical Center of Light Manipulations & Shandong Provincial Key Laboratory of Optics and Photonic Device, School of Physics and Electronics, Shandong Normal University, Jinan 250358, China
2
Optoelectronic R & D Center, Anhui Kechuang Zhongguang Technology Co., Ltd., Hefei 230088, China
*
Author to whom correspondence should be addressed.
Photonics 2020, 7(3), 61; https://doi.org/10.3390/photonics7030061
Submission received: 31 July 2020 / Revised: 18 August 2020 / Accepted: 20 August 2020 / Published: 24 August 2020
(This article belongs to the Special Issue Recent Advances in the Study of Light Propagation in Optical Fibers)

Abstract

:
The single-photon ionization time-of-flight mass spectrometer (SPI-TOFMS), which has high sensitivity, high accuracy, and a short response time, is effective for the real-time monitoring of volatile organic compounds (VOCs). In this study, the theory and structural composition of the SPI-TOFMS are described. Its detection limit can reach parts per billion by volume (ppbv), the dynamic range is better than three orders of magnitude, and the response speed can reach milliseconds. The distribution of VOCs and the ozone generation contribution rate in the Hefei Economic Development Zone are analyzed using this instrument with a vehicle platform for online navigation detection. The experimental results showed that aromatics were the primary components of the total volatile organic compounds (TVOCs), and aromatics and alkenes contributed more to ozone formation in an industrial manufacturing area. This research indicates that the SPI-TOFMS can rapidly and accurately conduct online monitoring of VOCs in industrial development zones. In addition, it has been applied in the fields of atmospheric composition observation, environmental monitoring, and industrial VOC leakage monitoring.

Graphical Abstract

1. Introduction

Volatile organic compounds (VOCs) are a type of organic pollutant with a boiling point of 50–260 °C. VOCs react in the atmospheric troposphere and are significant precursors of ozone and secondary organic aerosols [1,2]. VOCs in high concentrations may have serious effects on human health and the atmospheric environment [3,4,5]. Therefore, the governments of all countries, as well as major organizations, have established strict standards for VOC emissions [6,7,8]. VOCs in the atmosphere are derived from vegetation and anthropogenic emissions. In addition to vegetation emissions, most anthropogenic VOCs are emitted from human activities, industrial processing, road transportation, solvent use, and volatilization. In industrial parks, anthropogenic VOC pollution sources primarily originate from corporate discharges without organization or permission, which may cause the gravest of environmental risks. Thus, the real-time monitoring of atmospheric VOCs and the identification of VOC categories and their distribution have become significant and arduous tasks in the field of pollution prevention and control.
Sensors [9,10], spectrometers [11], chromatography, and mass spectrometry are the primary methods used for the detection of VOCs. Widely used offline, VOC analytical techniques, such as gas chromatography (GC) [12] and gas chromatography mass spectrometry (GC-MS) [13], have the ability to detect a variety of VOCs at low cost [14]. However, these methods have shortcomings in that they have a poor ability to detect low quantities and are time-consuming [15]. Online mass spectrometry techniques primarily include proton transfer reaction mass spectrometry (PTR-MS) and single-photon ionization mass spectrometry. Ramón González-Méndez et al. [16] developed a PTR-MS device for trace explosive detection, and the experimental results showed that the entire detection cycle time of this technology could not be achieved within the ideal time of one minute. Furthermore, PTR-MS is the protonation of VOCs in the air using hydrated hydrogen ions, but the ionic reaction is affected by humidity, resulting in errors [17]. Hence, PTR-MS efficiently performs online monitoring of VOCs, but care must be taken regarding the influence of humidity on ionic reactions.
Single-photon ionization time-of-flight mass spectrometry (SPI-TOFMS) plays an essential role in the real-time monitoring of VOCs. This method has typically been applied in the environmental field due to its short detection time, soft ionization, high resolution ratio, accuracy, and reliability. Liu et al. [18] constructed a SPI-TOFMS for online monitoring of the actual smoke from waste incinerators for three months. Li et al. [19] combined SPI-TOFMS with a windowless RF- discharge (WLRF) lamp to detect the initial stage of the reaction between methanol and alkene. Wu et al. [20] assessed VOCs in sewage from different laboratory buildings and conducted automatic monitoring of pollutants. Sun et al. [21] conducted the online detection of VOCs in the Beijing atmosphere using SPI-TOFMS based on a vacuum ultraviolet lamp. Tonokura et al. [22], Gao et al. [15], and Huo et al. [23] researched a compact portable SPI-TOFMS to monitor aromatic compounds in the laboratory and VOCs in car engines, passenger decks, and benzene series, such as benzene, toluene, xylene, and chlorobenzene. These studies indicated that SPI-TOFMS has great application value in environmental research and monitoring, such as for atmosphere and smog chambers, combustion and pyrolysis off-gases, off-gases from food roasting, and other VOC sources [24]. In industrial parks, anthropogenic emissions of VOC pollution sources primarily originate from enterprises. Chen et al. [25] used SPI-TOFMS to detect VOCs in ten plastic enterprise workshops in the Pearl River Delta region of China. They placed instruments in a fixed position in each workshop, which was the central point, to collect air and analyze the concentrations of benzene series. However, it is still difficult to track and analyze VOC emission sources when the fixed monitoring site increases or decreases in VOC concentration. Obviously, VOC detection in industrial parks at fixed sites is not advisable. To effectively track VOC emission sources, mobile detection equipment is needed. Mobile laboratories are more suitable for detecting VOCs in cities and industrial parks [26].
In this study, a mobile detection device equipped with SPI-TOFMS is built to trace VOC distributions and emission sources over a large area. The components and construction of the SPI-TOFMS instrument are introduced in this paper. The navigation monitoring method with a VOC mass spectrometer is used to monitor the Hefei Economic Development Zone. In addition, to evaluate the ozone generation potential of different VOC components, VOC data are analyzed. The SPI-TOFMS with mobile detection technology will play a vital role in VOC pollution control in the future.

2. Instrumentation

2.1. Vehicle Platform

A vehicle platform from Anhui Kechuang Zhongguang Technology Co., Ltd., was modified using a car (IVECO, Naveco, Ltd., Nanjing, China) with a VOC mass spectrometer, an air conditioner, a meteorological parameter meter (PH-V-C), a power supply system, an uninterruptable power supply (UPS), and a shockproof platform. The vehicle platform had a lithium battery power supply system with no fewer than 3000 kW. This ensured a continuous navigation monitoring time of no less than eight hours. In addition, it was equipped with on-board high-power UPS backup power for instances when the external power grid power might fail. The vehicle was divided into three parts: a driving area, a working front compartment, and a rear equipment compartment. The meteorological system and sampling system areas had detachable structures, and they were placed on the top of the car for easy disassembly and installation. The VOC mass spectrometer, which was the SPI-TOFMS, was placed horizontally in the rear equipment compartment, at least 15 cm away from surrounding objects or walls for ventilation. The connection voltage of the host machine to the socket was an AC220 V/50 Hz. VOCs were then inhaled into the VOC mass spectrometer through the sampling port during navigation monitoring. The acquisition time could be controlled within 3–30 min and the sampling speed could reach up to 200 mL/min.

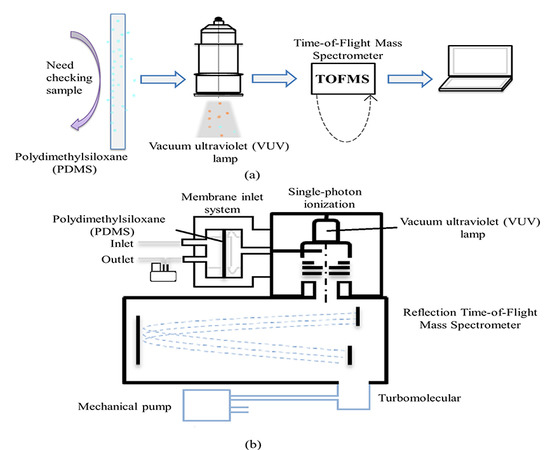
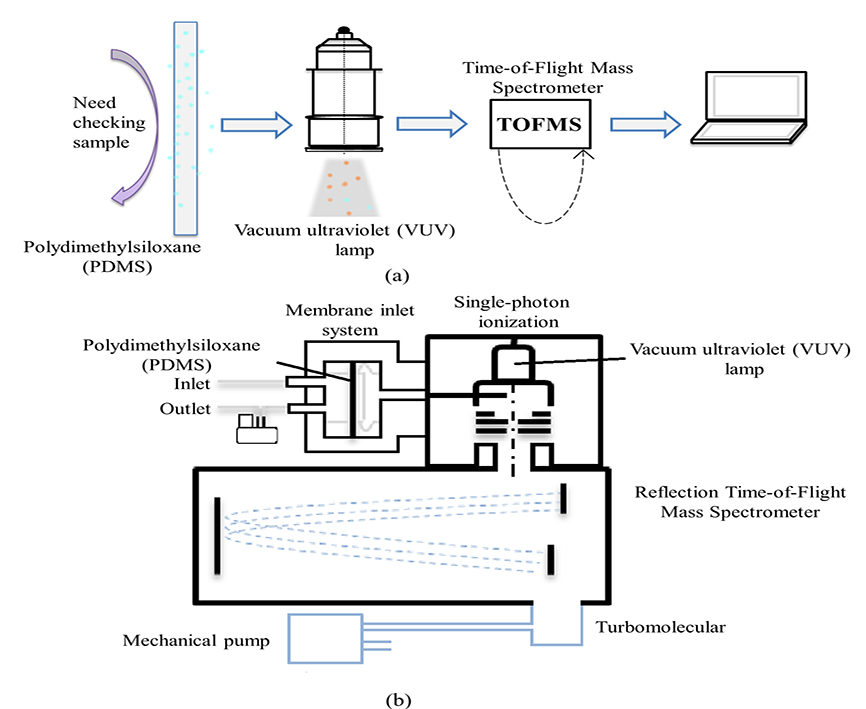
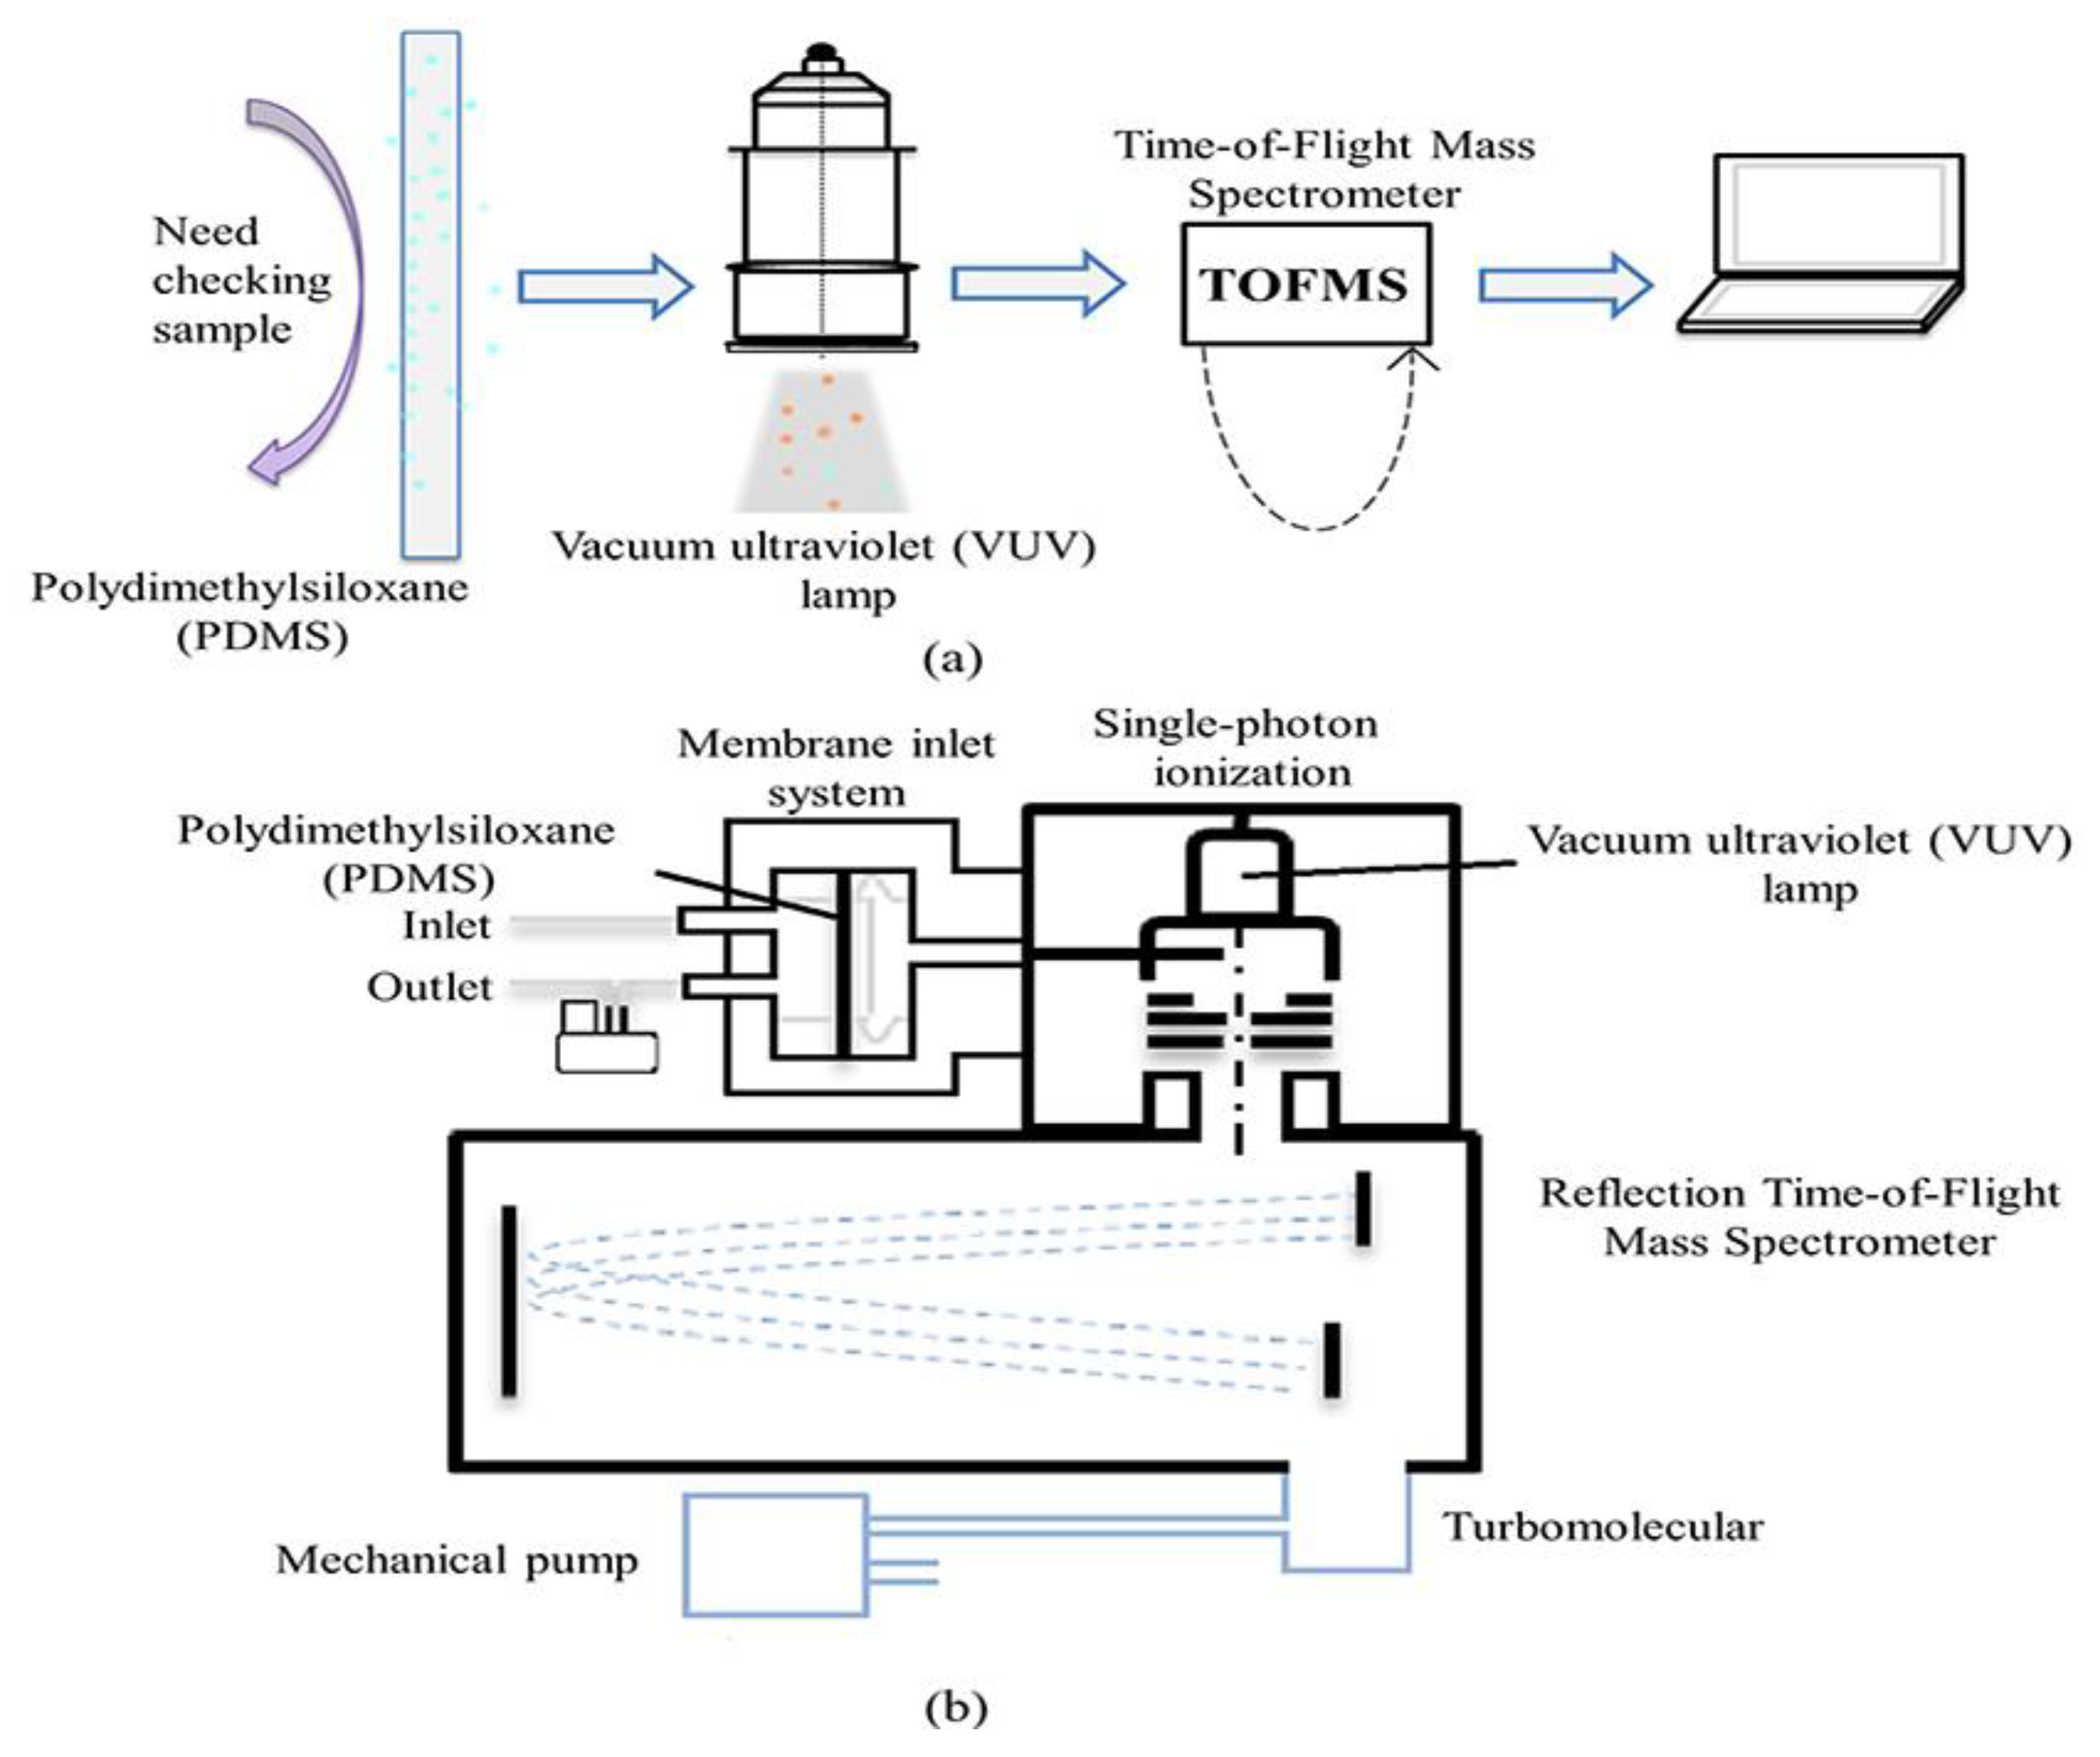
2.2. The SPI-TOFMS Instrument

The SPI-TOFMS instrument basically combines a membrane inlet system, single-photon ionization, and the reflection TOFMS. The schematic diagram is shown in Figure 1. The pumping system [27] of the instrument combines a scroll dry pump (SH110, Varian, Palo Alto, CA, USA) with a pumping speed of 110 L/min and a turbo molecular pump (V301, Varian, Palo Alto, CA, USA) with 270 L/s to ensure that the air pressure requirement is working properly. The primary vacuum is provided by the dry pump at a pressure of approximately 100–300 Pa, while the molecular pump can provide a vacuum of greater than 5 × 10⁻³ Pa to meet various analytical requirements. The dimension of the instrument is 658 mm × 446 mm × 580 mm, with a total weight of approximately 77 kg. Hence, it can be used for vehicle or mobile operation. It is widely used for the online monitoring of gas and liquid molecules with high-quality resolution. The dynamic range is better than three orders of magnitude, the response speed can reach milliseconds, and the detection speed is 100 spectra/s. The SPI-TOFMS system is equipped with a 2 GS/s KeysightU5309A high-speed data acquisition card, which can collect data efficiently and can also extend the data collection time. This equipment has been widely used in the industrial environment monitoring field, pollutant research, automobile exhaust emission research, and other fields [25].

2.2.1. The Membrane Inlet System

The most commonly used direct sample introduction technology involves a membrane inlet (MI) and capillary import (CI) [28]. Shi et al. [29] analyzed the MI and CI combined with a miniature mass spectrometer for VOC detection results. They found that MI provided better detection sensitivity for most VOCs. The sampling device is a membrane introduction system. A cross-sectional view of the system is shown in Figure 1b. The pressure at the front end of the MI is atmospheric. Gas is let into the PDMS membrane (Technical Production, Inc., St. Louis, MO, USA) by means of a micro vacuum pump (pumping speed 1 L/min). The membrane is a round silicone membrane with an effective diameter of 22 mm and a thickness of 50 μm and with selective adsorption. There is a pressure difference at the terminal. During the adsorption, diffusion, and desorption of the PDMS membrane, the VOC molecules selectively permeate from the surface of the membrane to the other side, then the molecules passing through the membrane are introduced into the ionization chamber through a stainless steel tube (aperture of 2 mm) for molecular ionization.

2.2.2. Single-Photon Ionization

Ionization is the first step in mass spectrometry, which not only determines the characteristics of the mass spectrometry but also largely determines the sensitivity and measurement accuracy of the mass spectrometer. The ionization method chosen in this study was a single-photon ionization (SPI). Compared with other ionization technologies such as electron ionization, the SPI provide simple spectra, has almost no fragments, and can achieve relatively selective ionization [30]. Hence, it is a good candidate for the detection and analysis of atmospheric VOCs.
The design of the SPI is shown in Figure 1b. It consists of a vacuum ultraviolet lamp, an ion transport zone, and an ion lens. The mechanism of the SPI is expressed by Equation (1):
M + h γ M + + e
The light source is the key component of photoelectric ionization, which determines to a great extent the detection range and ionization efficiency of the photoionization.
The SPI does not ionize bulk components of air, including N2, CO2, O2, and H2O [31,32], but does ionize a variety of organics and even some inorganics (e.g., NO, NO2, and H2S) [33,34]. To avoid the interference of the primary components in the atmosphere, a commercial low-pressure krypton discharge lamp (Cathodeon, Ltd., Cambridge, UK) was used to generate photons at 10.6 eV with a photon flux about 1011 photons/s. The lamp ion source could emit a maximum current of 2 mA. The lamp ion source has a simple structure, handy operation, stable emission energy, and a wide range of applications.
The photoionization process can ionize VOC molecules with an IP < 10.6 eV into molecular ions. It can then enter the resulting ions into the mass analyzer under the action of the transport electrode.

2.2.3. Time-of-Flight Mass Spectrometer

The SPI-TOFMS uses a vertical reflective time-of-flight mass analyzer to accelerate the ionized positive ions using the acceleration voltage to the reflection area. After the ions are reflected by the reflection area with a deflection angle, they are detected in the double-microchannel plate (microchannel plate, MCP, Φ = 50 mm). The schematic of the TOFMS [35] is presented in Figure 1b. The pressure of the mass spectrometer does not exceed 5 × 10⁻³ Pa. The quality range of the instrument is 1–500 amu and the quality accuracy is m/z = 100 ± 0.015 Th. Taking toluene as an example, the resolution has a full width at half maxima (FWHM) value greater than 500, and the detection limit can reach the level of ppb.
The TOFMS was developed originally from an apparatus designed by Dodonov et al. [36]. The principle of the time-of-flight mass spectrometer can be expressed by Equations (2)–(4):
E = 1 2 m v 2 = q U
v = 2 U m q
T = L v = L 2 U m q
When ions with the same charge are accelerated through the same electrostatic field, the same kinetic energy will be obtained. At a certain speed, ions enter the drift region, which has a length of L and no electric field. They then fly freely and finally reach the detection plane. The kinetic energy, flight speed, and flight time obtained by the particles are expressed by Equations (2)–(4), respectively.
Compared with other mass spectrometry techniques, the mass resolution of the reflective TOFMS can reach 5000–20,000 [37]. In addition, the TOFMS is fast and has a high sensitivity, a high resolution, and a wide mass range. It can quickly qualitatively analyze gas components, which is why TOFMS is widely used for the online monitoring of industrial VOCs.

3. Experiment

VOCs are an important source of secondary organic pollutants, such as ozone in winter. In order to quickly and comprehensively understand the distribution of regional pollutants, target key species, trace the source of pollutants in real time, and accurately determine polluted areas and industries (and even polluting enterprises), the VOC mass spectrometer was combined with GPS positioning, geographic information system (GIS) positioning, and the vehicle platform. Then, navigation monitoring was used to monitor the Hefei Economic Development Zone.
The pollution sources and the concentration distribution of VOCs in areas with higher pollution values based on monitoring data were then analyzed. Additionally, the ozone formation potential (OFP) was analyzed using the maximum incremental reactivity (MIR) coefficient and the equivalent propylene concentration method. The corresponding definition is shown in Equations (5) and (6):
O F P = [ V O C ] i × MIR
where [ V O C ] i is the concentration of a certain VOC in the atmospheric environment that is actually observed and MIR represents the maximum concentration of O3 that can be produced by increasing the concentration of the unit VOC at different VOC/NOx ratios in g O3/g VOCs, which uses Carter’s [38] experimental results:
C ( V O C s ) = V O C s × K OH ( V O C s ) K OH ( propylene )
where C ( V O C s ) represents the equivalent propylene concentration of VOCs; and K OH ( V O C s ) is the reaction rate constant of the VOCs and OH radical, which uses Atlinson’s [39] experimental results. K O H ( propylene ) is the reaction rate constant of propylene and the OH radical.

4. Results and Discussion

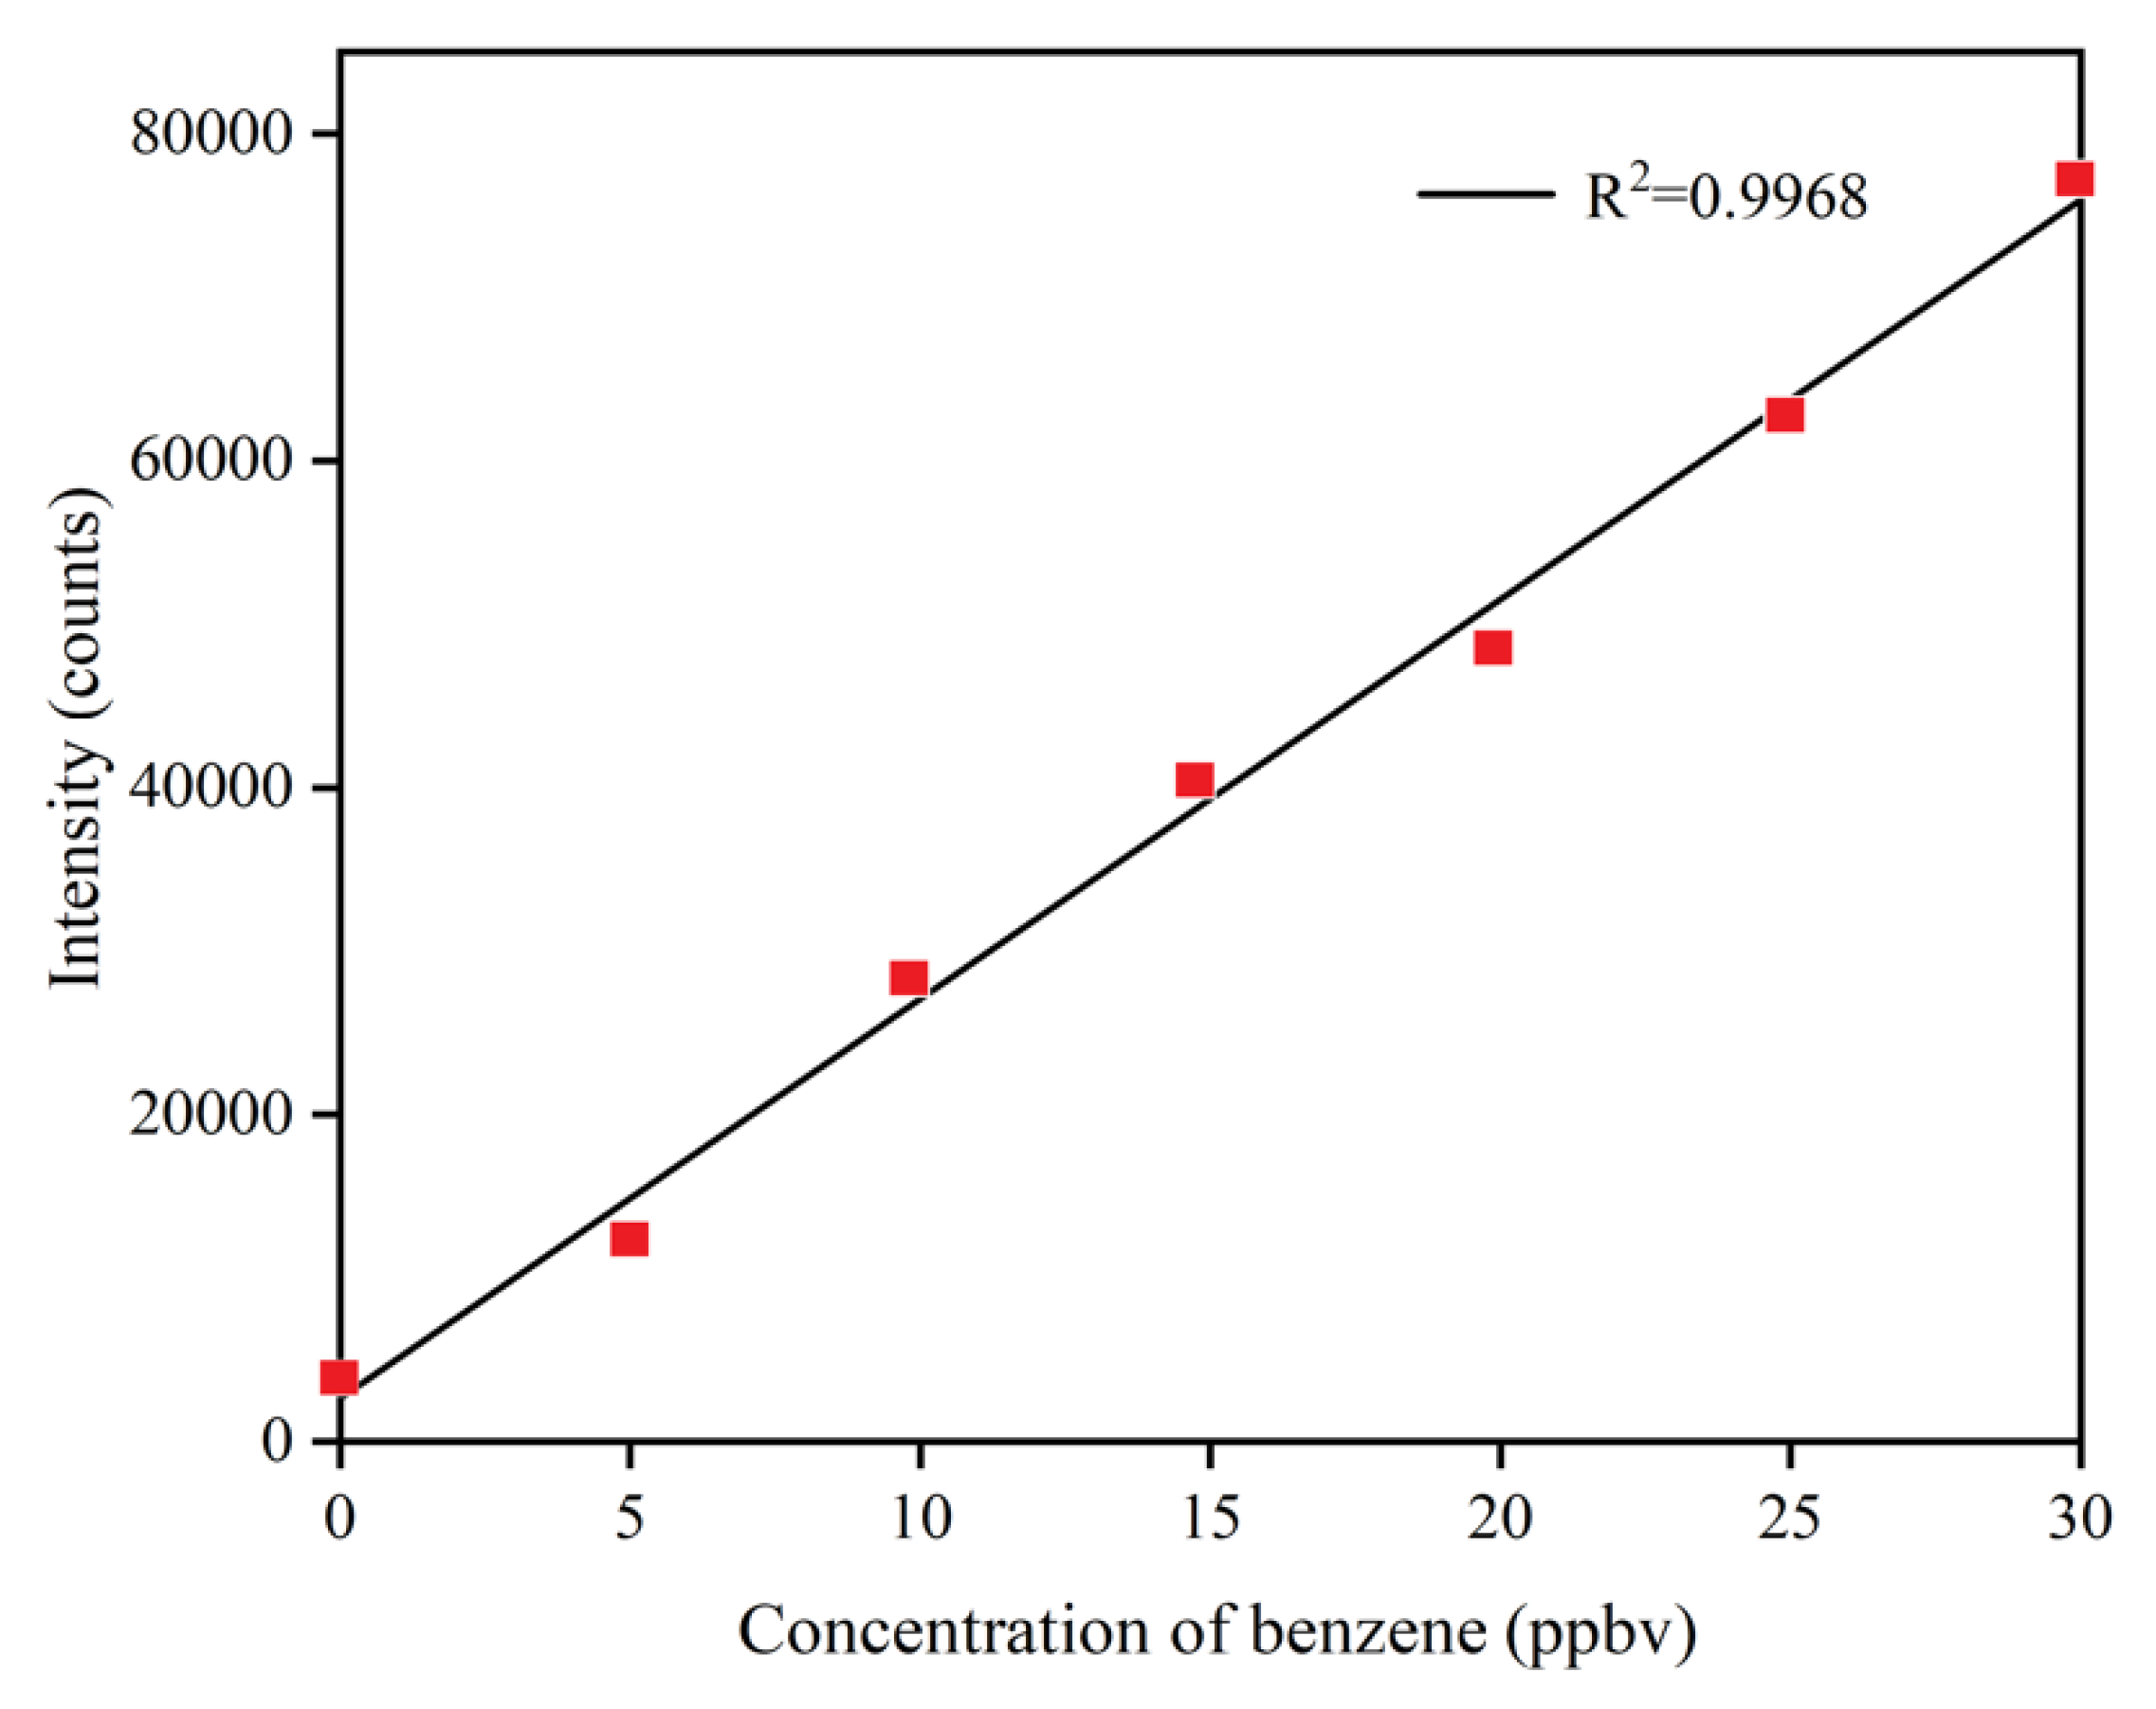
4.1. Performance of the SPI-TOFMS

The instrument was calibrated prior to navigation detection. Gas samples with different concentrations were obtained by mixing the standard gas mixture of the benzene content with N2 (99.999% purity). Figure 2 shows the calibration curve for benzene from 5 ppbv to 30 ppbv. The concentrations of benzene were 5 ppbv, 10 ppbv, 15 ppbv, 20 ppbv, 25 ppbv, and 30 ppbv. Taking benzene as an example, its linear range is three orders of magnitude and its regression coefficient R2 = 0.099686 is greater than 0.99, which indicates that the SPI-TOFMS analyzed the VOCs quantitatively.
In order to demonstrate the stability and accuracy of SPI-TOFMS in the quantitative detection of VOCs, benzene (30 ppbv), toluene (30 ppbv), chloroethane (30 ppbv), isoprene (40 ppbv), and pentanal (30 ppbv) were regarded as the detection objects, which were combined in a standard gas mixture. The measurement was repeated n times (n ≥ 8) and the relative standard deviation (RSD) and relative error were calculated. The actual concentration (Ys), the mean of the detected concentration ( Y ¯ ), the RSD, and the absolute value of relative error (δ) of each component are shown in Table 1.
As shown in Table 1, the RSD of each pollution compound is less than 5%, which indicates that the instrument is stable and valuable in online detection. The δ is below 5%, which indicates that the instrument has high accuracy for detection of VOCs. The instrument provides effective data support for tracking of VOC sources in cities and industrial parks. Therefore, the SPI-TOFMS meets the requirements for online VOC monitoring in cities and industrial parks.

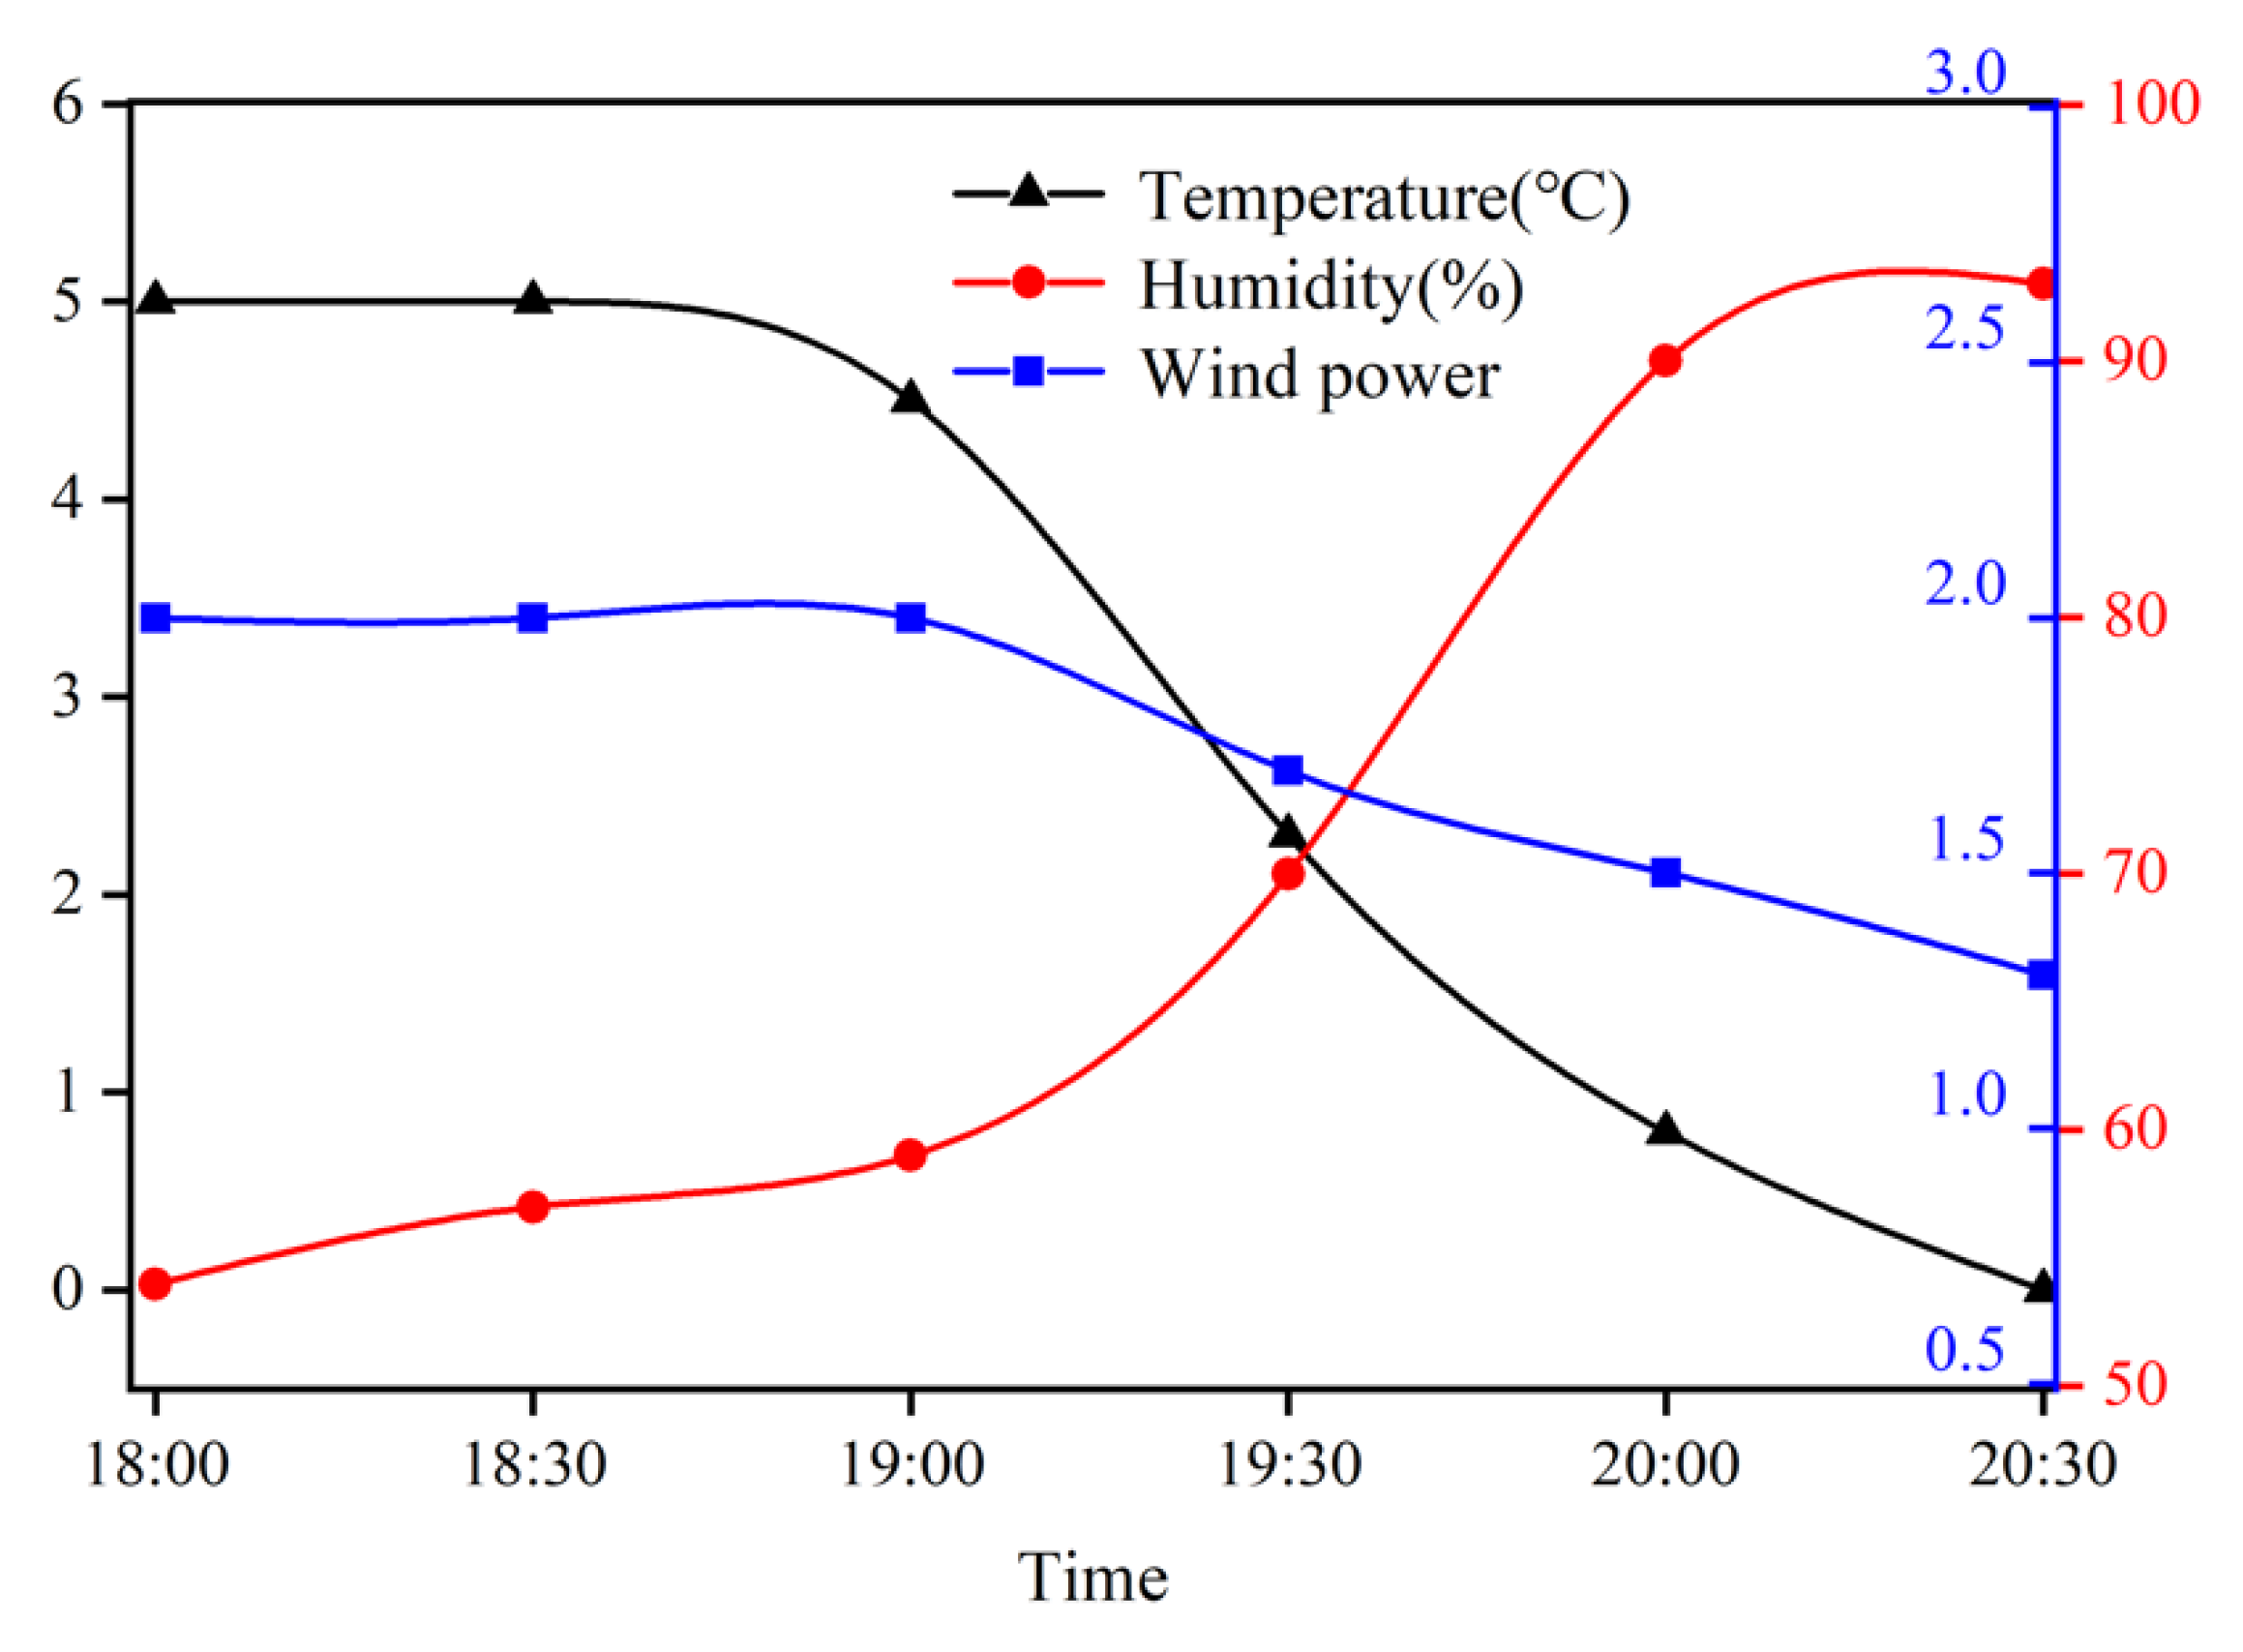
4.2. Environmental Factors

Figure 3 shows the outdoor environmental conditions in the Hefei Economic Development Zone during the navigation monitoring on 2 December 2019, which were collected from the meteorological parameter meter. Monitoring began at 18:31:33, and the VOC distribution along different routes was surveyed. The navigation monitoring lasted 1.3 h over a distance of 4.6 km. The temperature was approximately 5 °C, the humidity was approximately 50–60%, the wind direction changed from east to southeast, and the wind speed was level 2. The air conditioner in the vehicle platform provided the appropriate working conditions for the mass spectrometer.

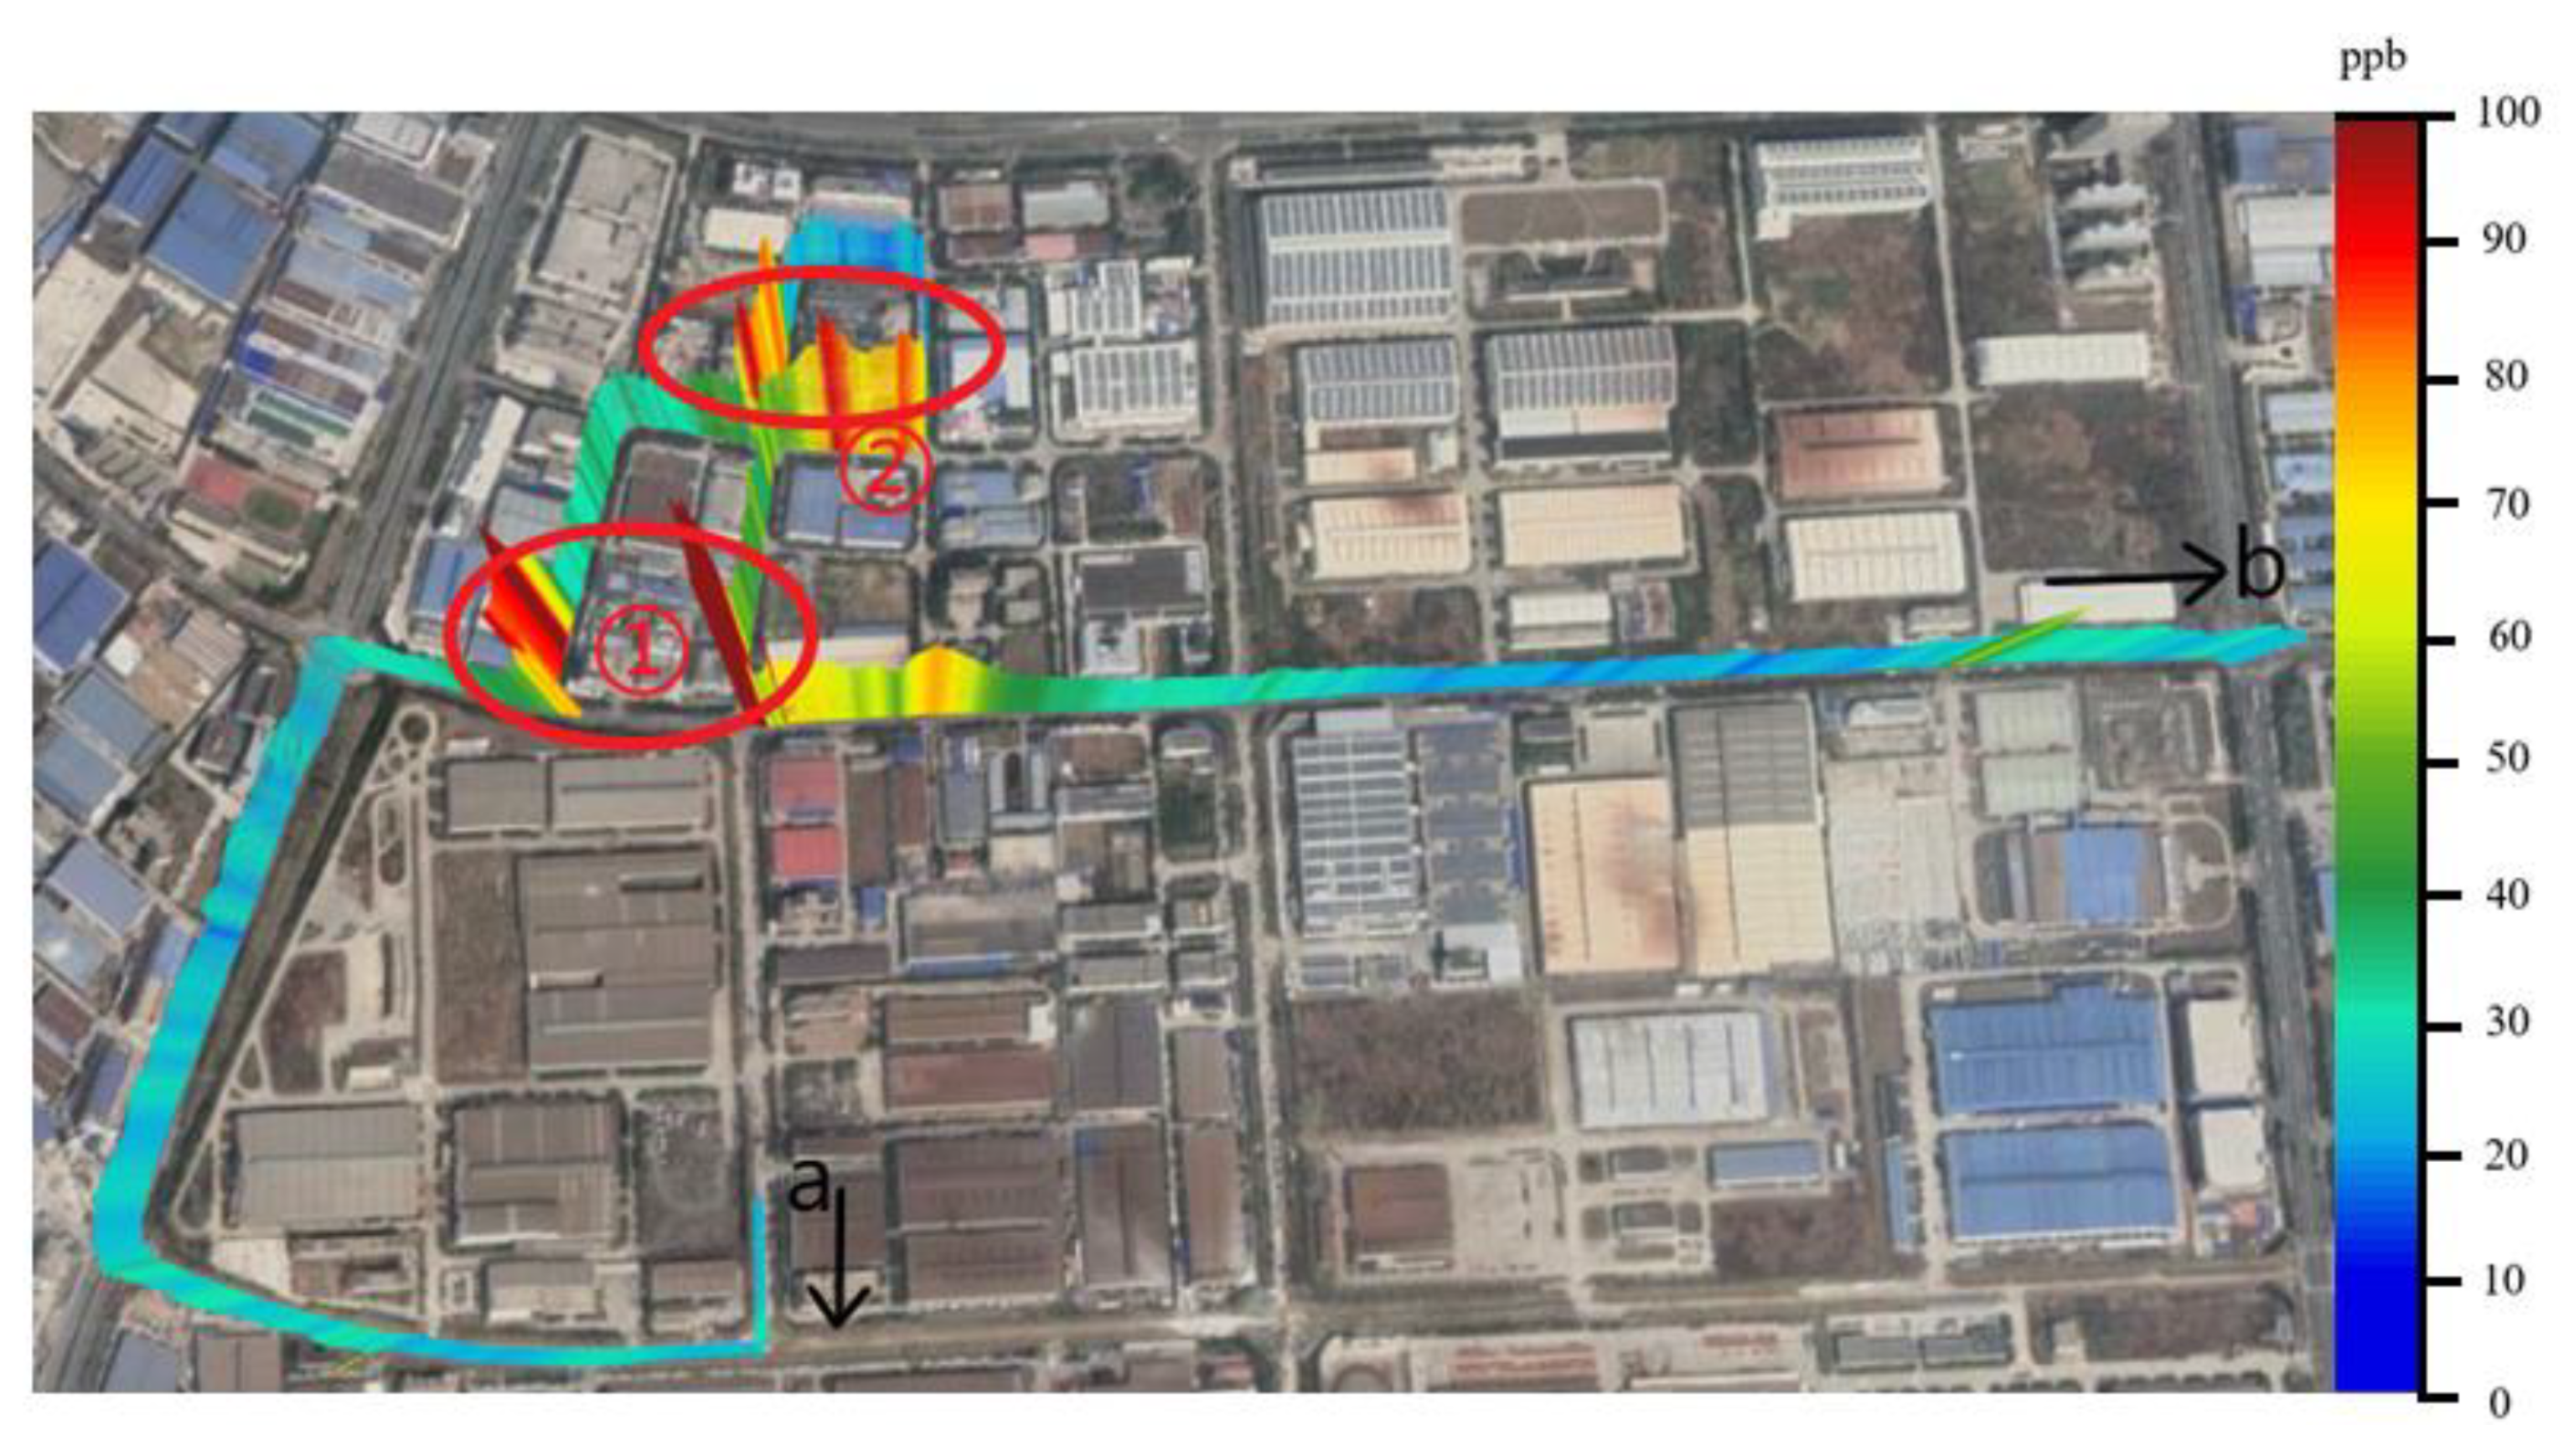
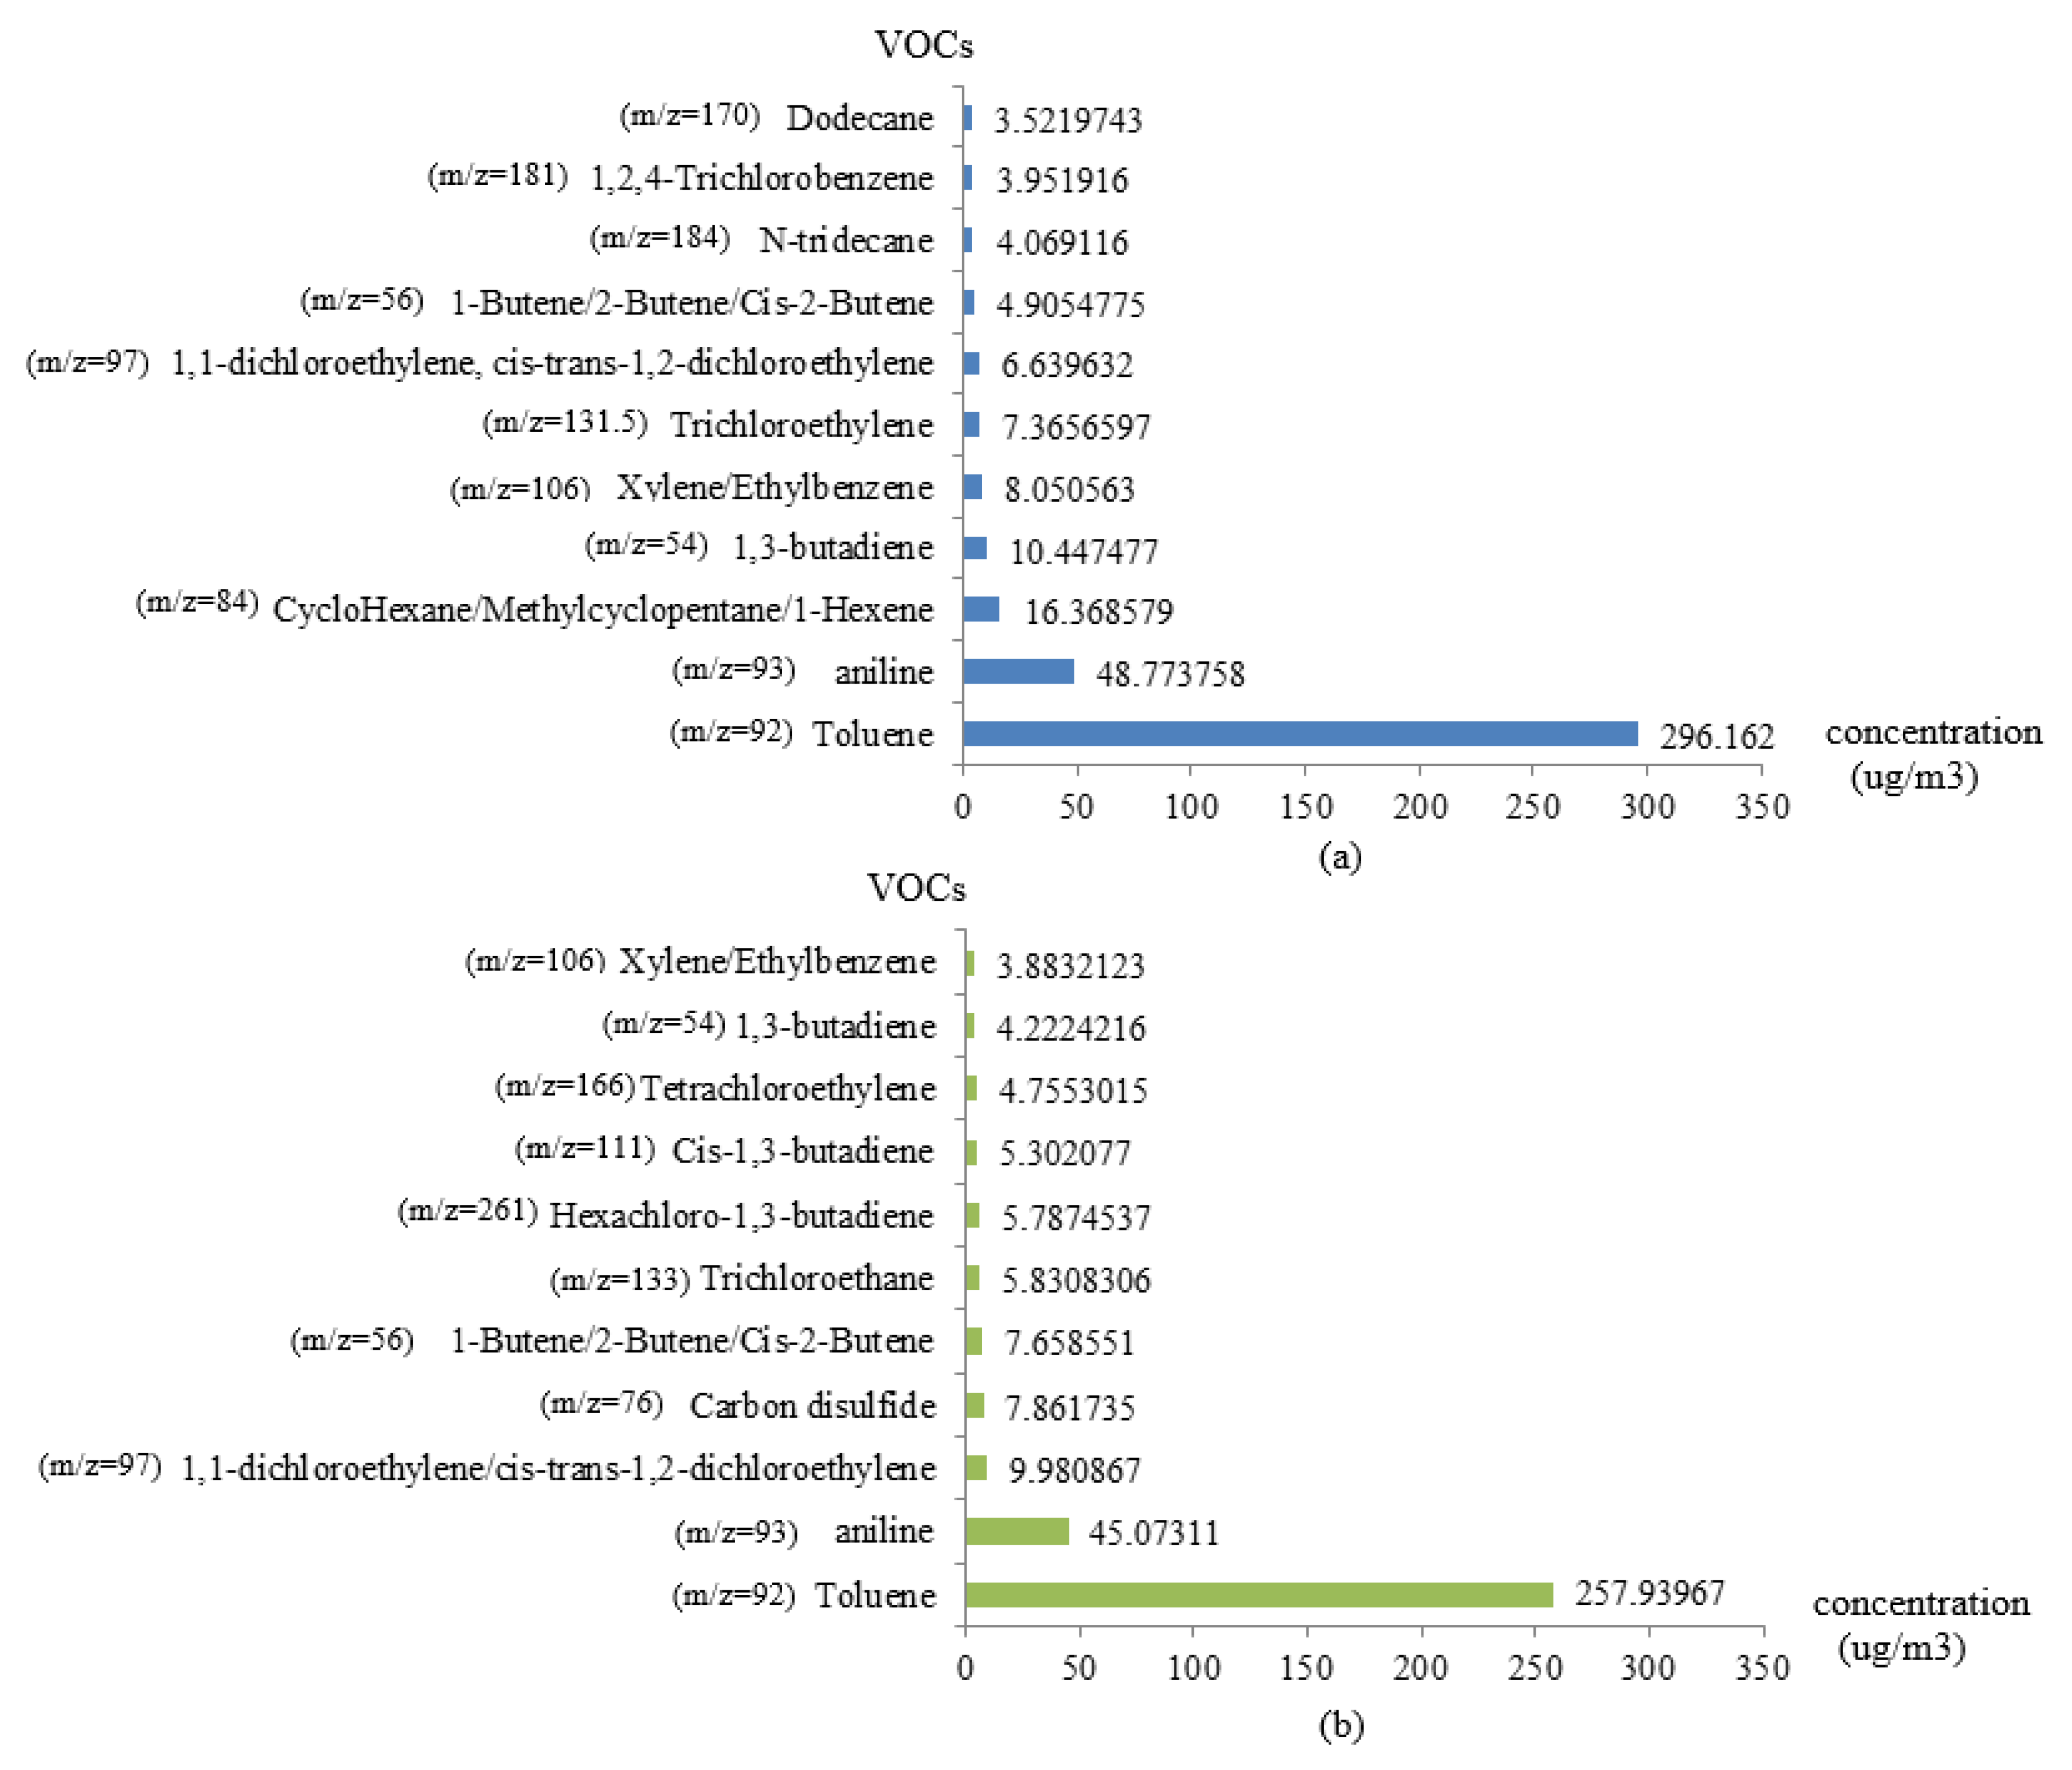
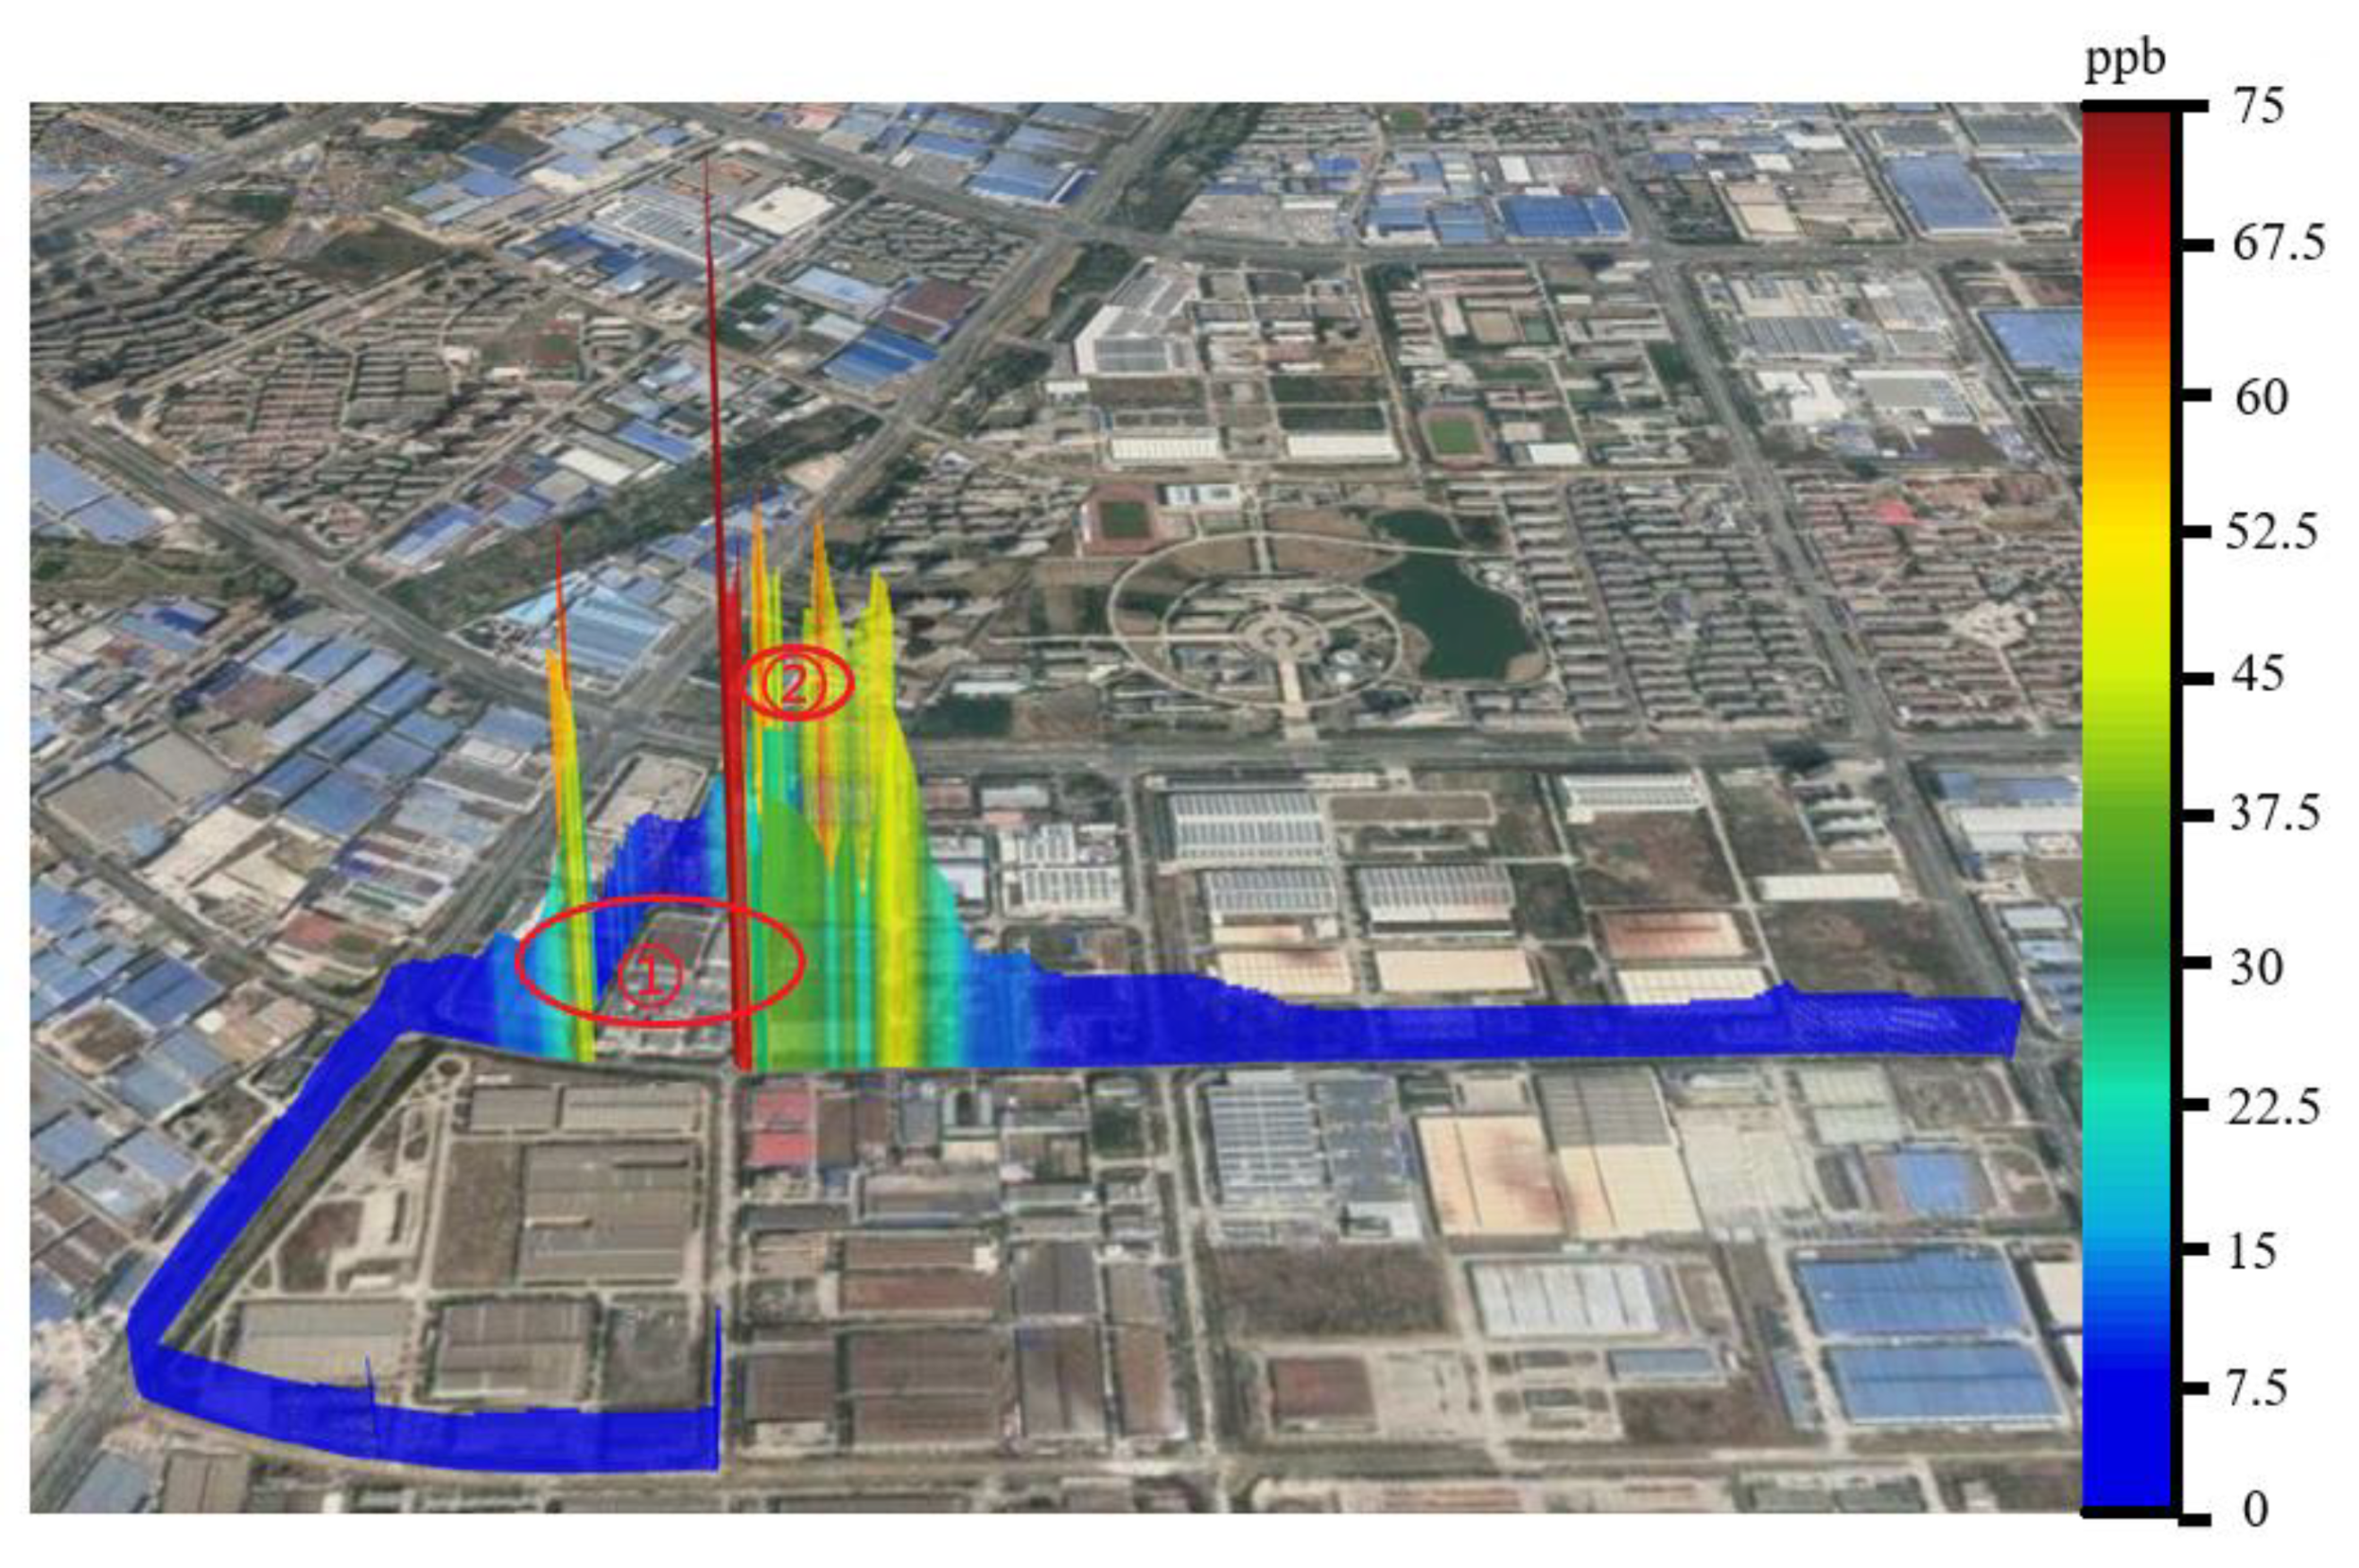
4.3. Analysis of the Navigation Monitoring Data

Figure 4 shows the VOC concentration results from the navigation monitoring. According to the map, two areas with higher VOC contents were found—near the Qianhui Pharmaceutical Industry building at the intersection of Tongkou Road and Wangke Road, and near the premises of Anhui Naxin Daily Necessities Co., Ltd., at the intersection of Lianli Road and Yuanmen Road, labeled 1 and 2, respectively, as shown in Figure 4.
Figure 5 shows the VOC distribution measured using the SPI-TOFMS. It should be noted that the SPI-TOFMS cannot distinguish isomers; hence, they were quantified under the assumptions of being fragmentation-free and containing no other contaminants that would contribute to the signal intensities of the TVOCs. Figure 5a shows the VOC distribution in the area with high VOC content near Qianhui Pharmaceutical. A total of 52 VOCs were measured, including aromatic hydrocarbon (68.44%), a hydrocarbon derivative (20.21%), alkane (6.36%), alkene (4.67%), and odorous gases, such as carbon disulfide (0.32%). The top 11 VOCs that contributed the most to the volume fraction of the TVOCs are shown in Figure 6a. Toluene is an important raw material for the organic chemical industry, and a series of toluene-derived intermediates are widely used in the production of medicine, daily necessities, and other products. Most of the aromatic hydrocarbons, such as toluene, xylene, and trimethylbenzene, are important raw materials for the organic chemical industry. In addition, hydrocarbon derivatives such as aniline, styrene, and ethylmercaptan can be used as raw materials for medical drugs and could help promote pharmaceutical industry production. According to the VOC component proportion table, it can be seen that aromatic hydrocarbons, amines, alkenes, and a small amount of alkanes were the primary components of the pollution. These are indispensable raw materials for the pharmaceutical industry. They are widely used in the production of medicines, daily necessities, and other products, and also play a role in promoting pharmaceutical industry production.
Figure 5b shows the distribution of VOCs in the area, with a high VOC content observed near the Naxin Daily Necessities premises. A total of 52 VOCs were measured, including aromatic hydrocarbons (64.52%), hydrocarbon derivatives (25.32%), alkanes (3.47%), alkenes (4.78%), and odorous gases, such as carbon disulfide (1.91%). The top 11 VOCs that contributed the most to the volume fraction of the TVOCs are shown in Figure 6b. The highest VOC content consisted of aromatic hydrocarbons. Toluene, amines, alkenes, and other substances with high contents are the raw materials of organic chemical products and daily necessities. These substances are used to manufacture dyes, pharmaceuticals, rayon fibers, viscose films, and other daily necessities.
The combined exploration results for the two areas showed that in the industrial manufacturing area, aromatic hydrocarbons were the components with the highest atmospheric organic content and which contributed the most to the volume fraction of the TVOCs. This was followed by hydrocarbon derivatives, which consisted of amines as the primary component, followed by alkenes and alkanes.
It is worth noting that toluene was the most abundant organic pollutant in the vicinity of the two enterprises. In response to this phenomenon, toluene was analyzed separately according to the test results. The concentration changes for toluene during the process of navigation detection are shown in Figure 7. It was found that only two manufacturing industries had higher toluene levels. The reason for this result is that toluene is a crucial raw material for industrial production, which can also be used to make xylene, a widely used solvent and additive. Excessive toluene not only does serious harm to the environment, but also causes damage to the body. It is critical to monitor toluene content in real time to prevent and control the leakage of low-volume industrial organic pollutants.

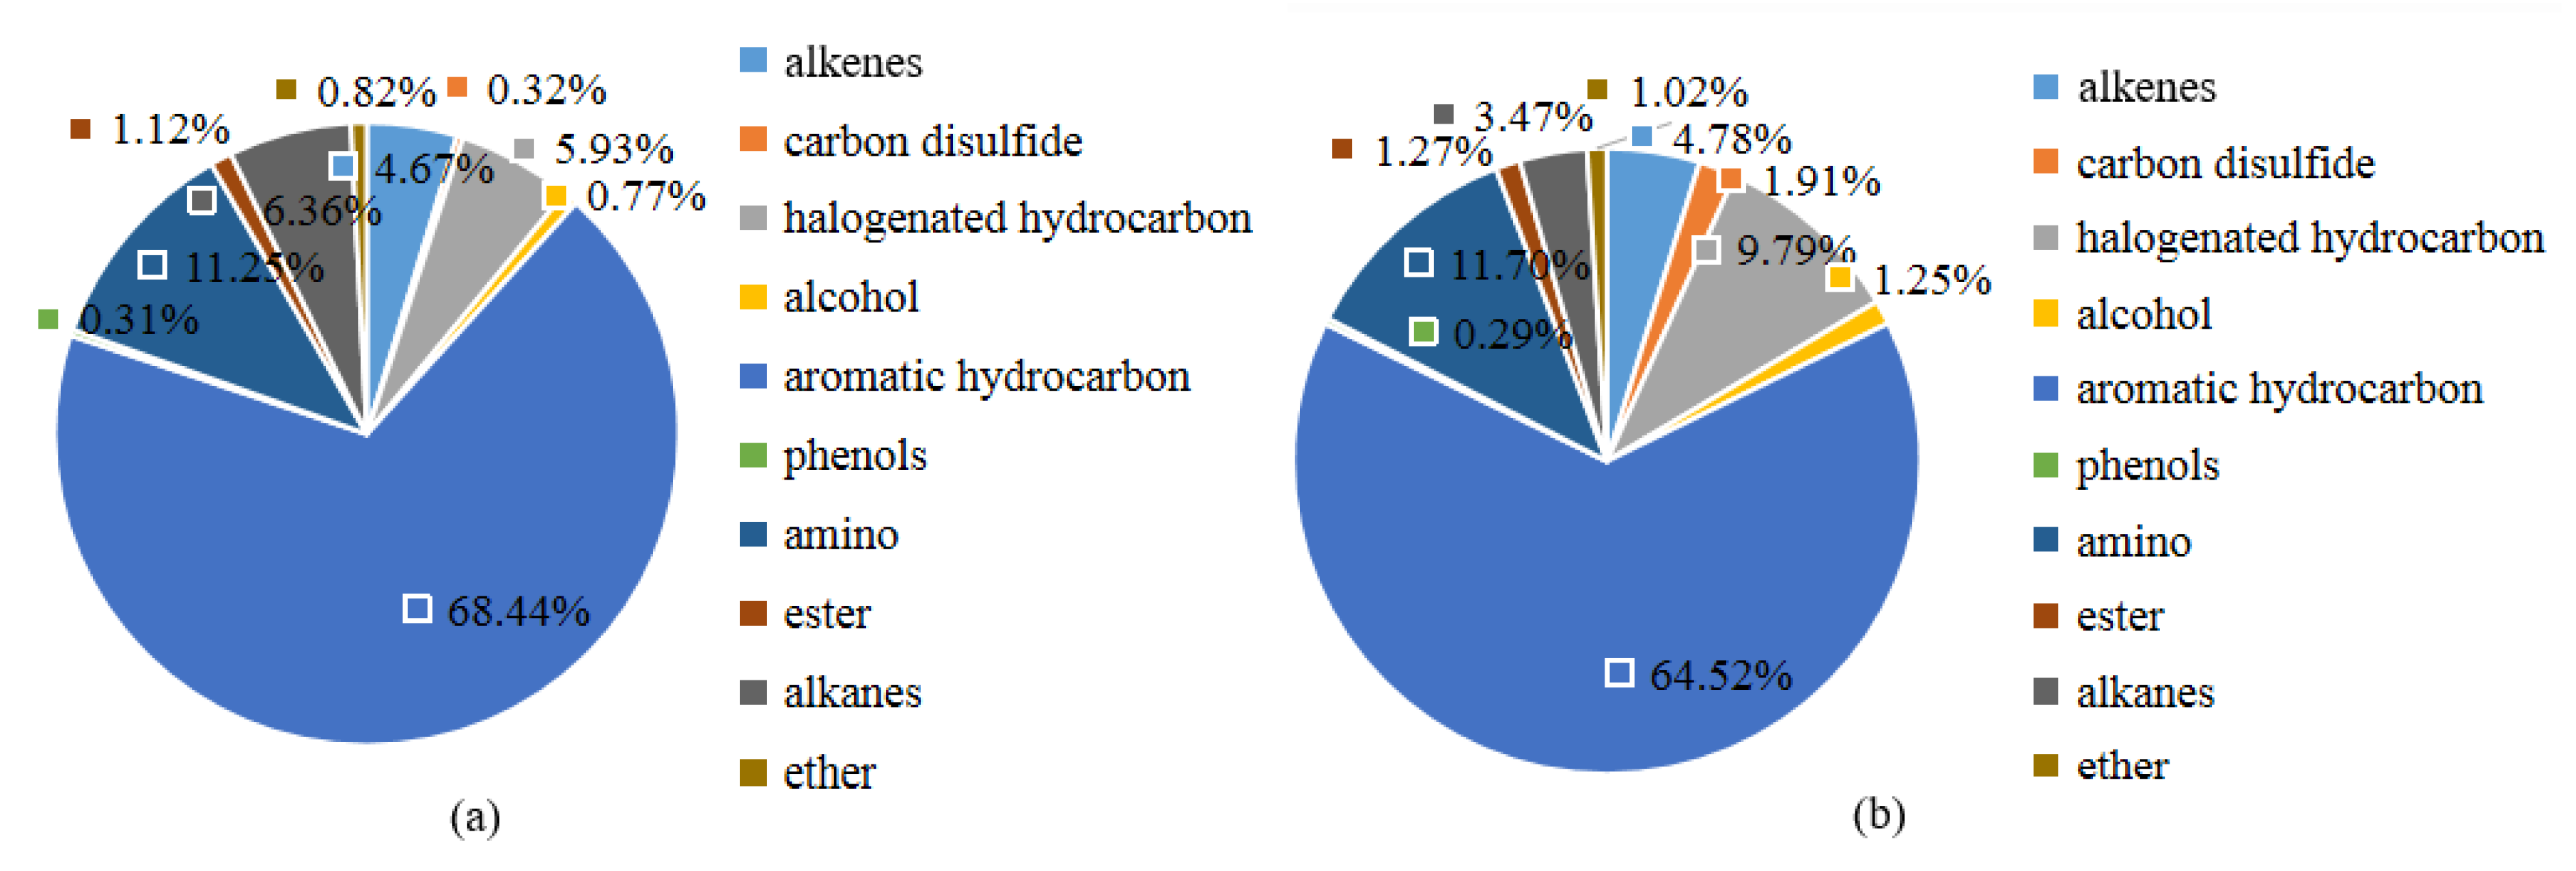
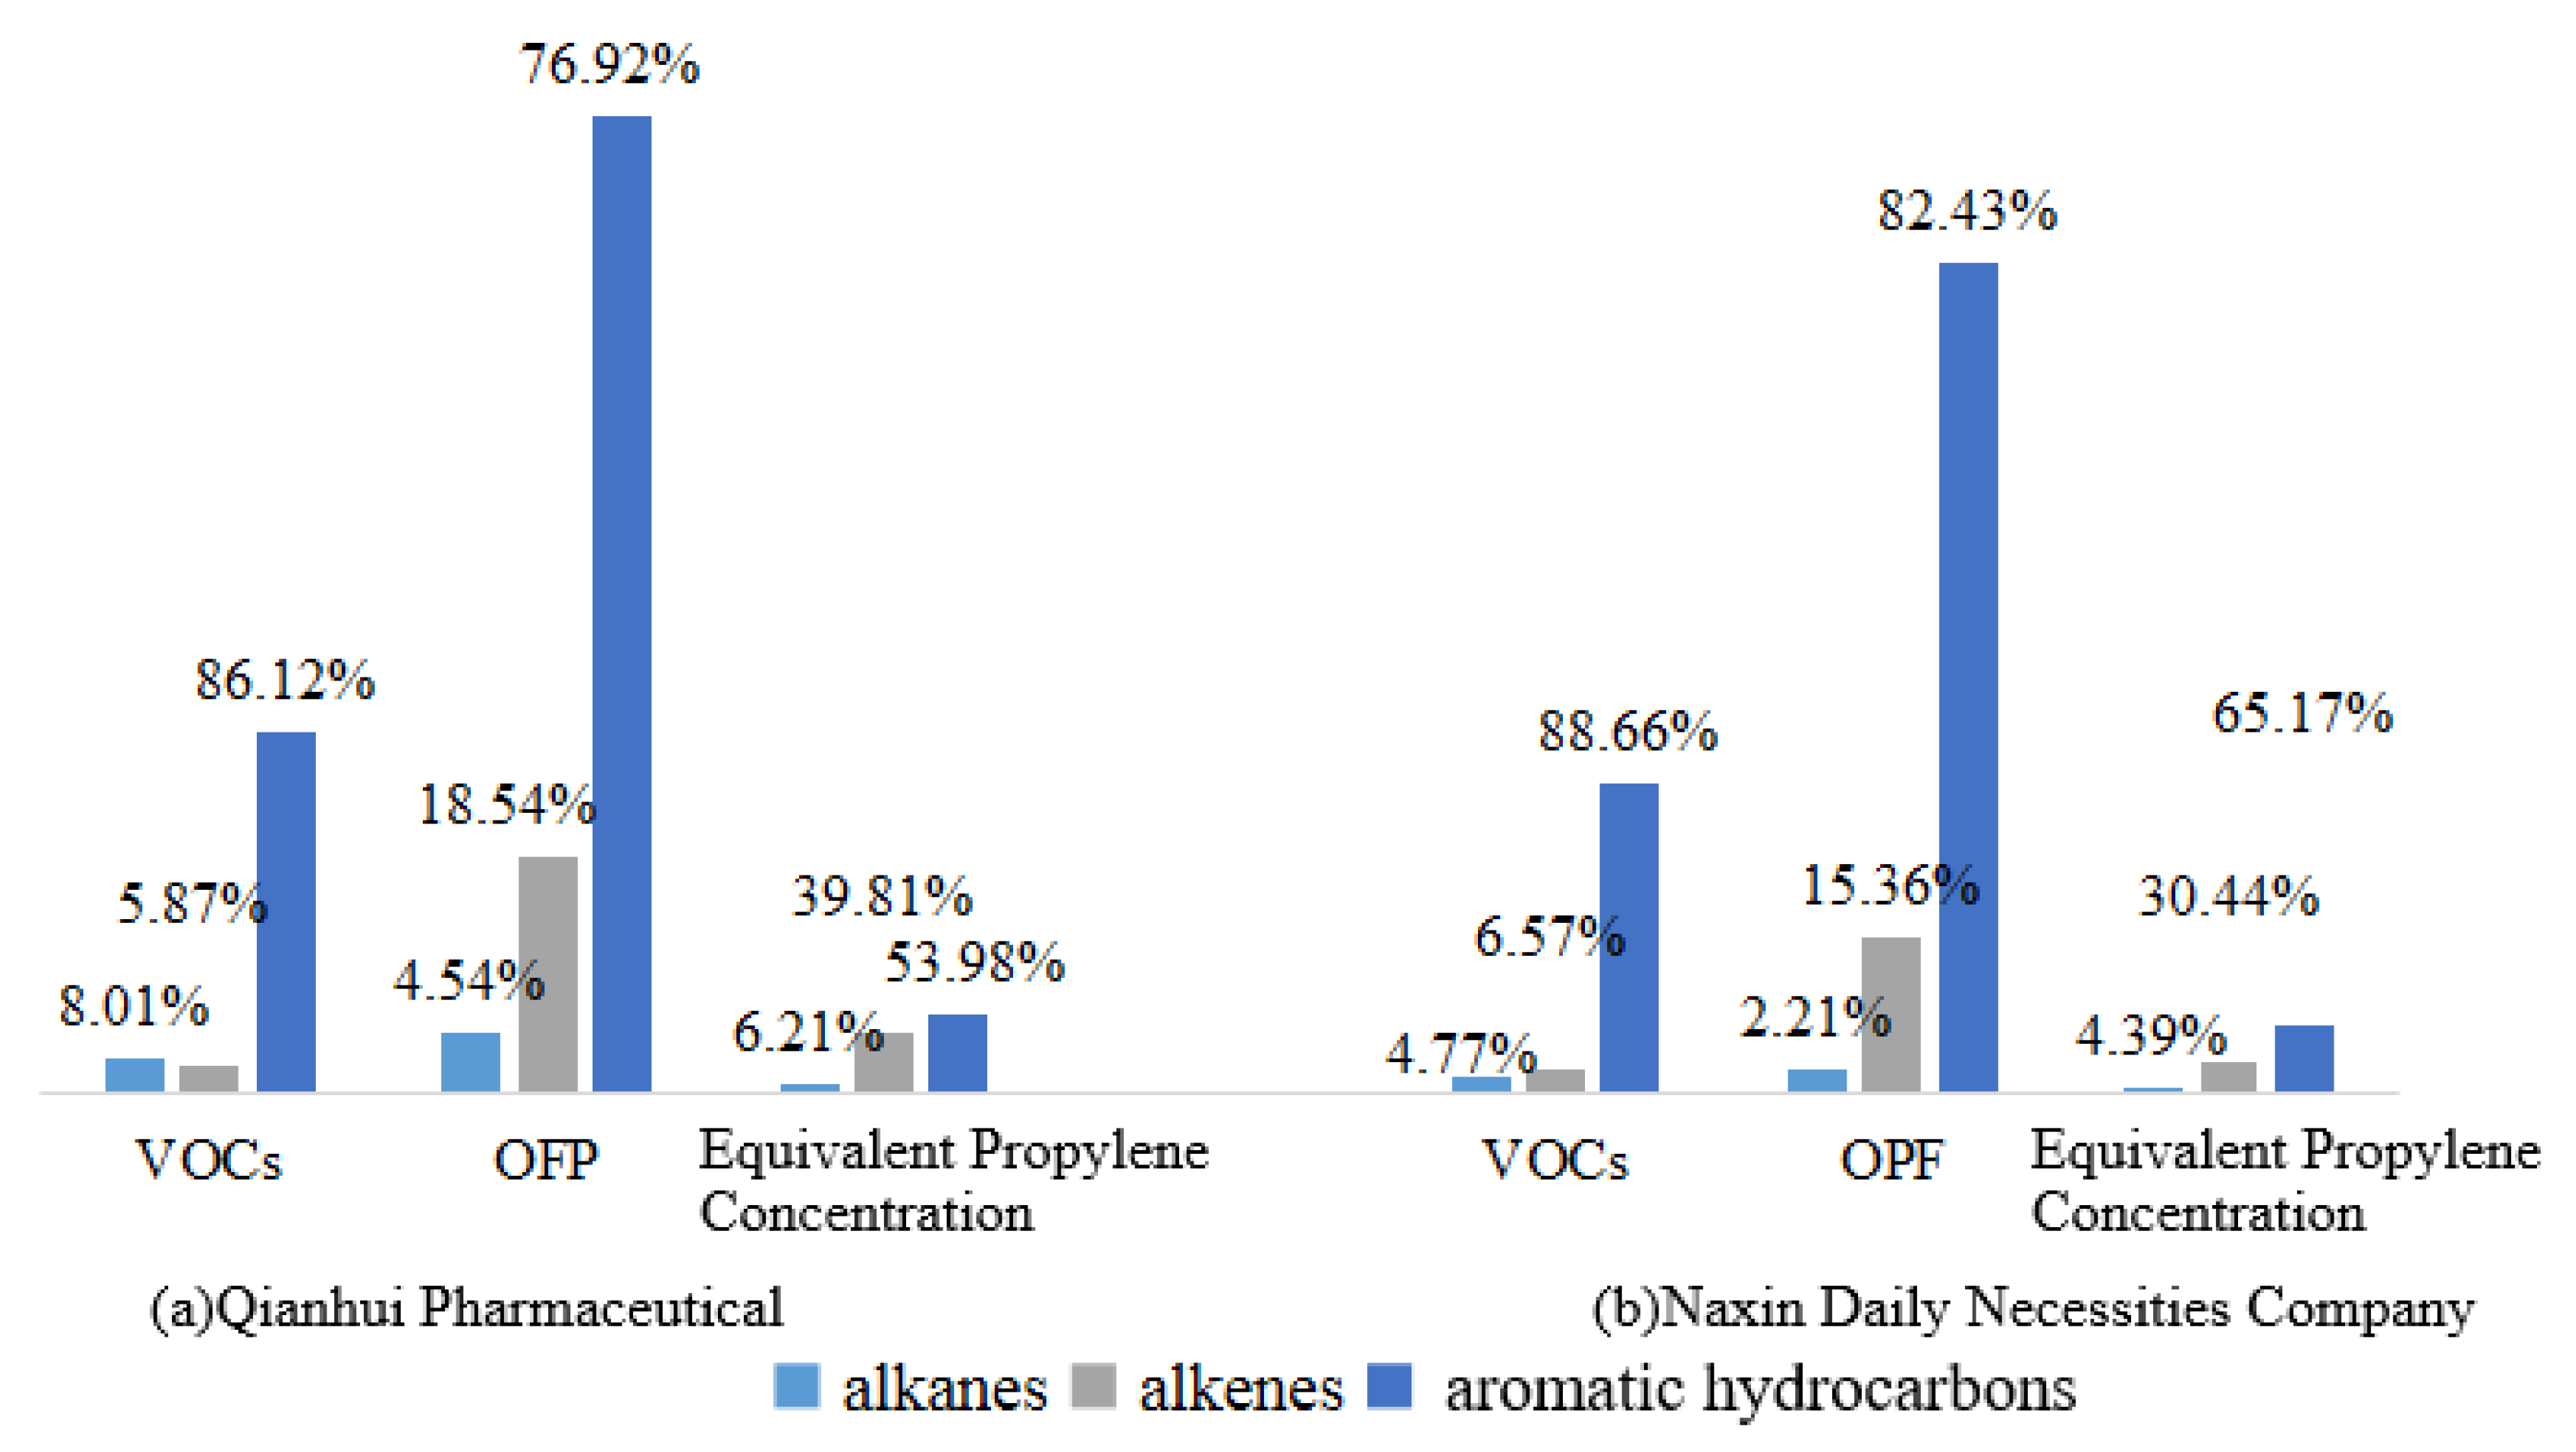
4.4. Analysis of the Contribution Rates of VOC Components to Ozone

According to the monitoring data, the VOC content was relatively high in the industrial manufacturing area. Alkane, alkenes, and aromatic hydrocarbon components are significant precursors for the formation of ozone and other pollutants [40,41]. The generation of the photochemical pollutant ozone in the troposphere is closely related to the concentration and change in VOCs. Based on the data obtained by the SPI-TOFMS navigation monitoring, the MIR coefficient method and the equivalent propylene concentration were used to evaluate the contributions of different VOC species, such as alkanes, alkenes, and aromatics, to ozone formation.
As shown in Table 2, based on the MIR coefficient method, the OFP values and equivalent propylene concentrations of alkanes, alkenes, and aromatic hydrocarbons in the two regions were analyzed. Since the MIR coefficients and the reaction rate constant of the VOCs and OH radical(KOH) were not mentioned in the references, they were not calculated. In addition, the VOC data obtained using the mass spectrometry detection system do not distinguish isomers, and if isomers were assumed to have the same concentration as the VOC concentration, the contribution rate to ozone could be artificially overestimated. Therefore, the maximum OFP and minimum OFP values were provided in this analysis, in addition to the average equivalent propylene concentrations of VOCs.
According to Table 2 and Figure 8a, the volume fraction for aromatic hydrocarbons accounted for the largest proportion of the TVOCs at 86.12%. However, the average contribution of the OFP was 76.92%, while the contribution to the equivalent propylene concentration was 53.98%. The volume fraction of alkane in the TVOCs was 8.01% near the Qianhui Pharmaceutical premises, but the average contribution to the OFP was 4.54% and the contribution to the equivalent propylene concentration was 6.2%. The alkenes accounted for the smallest volume fraction of the TVOCs at 5.87%, but their average contribution to the OFP was 18.54% and their contribution to the equivalent propylene concentration was 53.98%. By comparing the ozone generation potential and the equivalent propylene concentration, it was found that at the same volume fraction, the contribution rate of alkenes to ozone was the highest.
Similarly, near the Naxin Daily Necessities premises, the volume fraction of aromatic hydrocarbons accounted for the largest proportion of the TVOCs at 88.66%, but its average contribution to the OFP was 82.43% and its contribution to the equivalent propylene concentration was 65.17%. The proportion of the alkene volume fraction to the TVOCs was 6.57%; however, its average contribution to the OFP was 15.36% and its contribution to the equivalent propylene concentration was 30.44%.
The VOC monitoring results for the two study areas showed that aromatic hydrocarbons were the primary volume component of the TVOCs and contributed the most to the potential for ozone formation. This is because most aromatic hydrocarbons and their derivatives can be used as raw materials for industrial production. Compared with the ozone formation potential percentages for various environmental VOCs in China mentioned by Zhang [7], the results of this study were consistent with previous findings, showing that aromatic hydrocarbons contributed most to ozone formation, followed by alkenes and alkanes. However, according to the corresponding OFP and the equivalent propylene concentration, it was found that the molecular reactivity of VOCs in aromatic hydrocarbons was lower than that of alkenes. Even though the alkenes occupied a relatively low volume of the TVOCs, the MIR coefficient was much greater than those of the aromatic hydrocarbons and alkanes. Therefore, the contribution rate of alkenes to the ozone generation potential cannot be ignored. It can be assumed that under the condition of equal volume fractions, the equivalent propylene concentration of the alkenes would have the most significant contribution, which is also the most active component in atmospheric photochemical reactions, contributing the most to ozone generation.
In the industrial zone, aromatics, alkenes, and alkanes are raw materials used in the organic chemical industry and in production of our daily necessities. The volatilization and leakage of organic matter from enterprises in the industrial zone led to the high content of VOCs in the area and the formation of pollutants such as ozone through photochemical reactions. Therefore, it is necessary to conduct real-time online monitoring of VOCs in industrial areas, strengthen the control of pollution sources, and conduct overall regional control to minimize the impact of industrial emissions on atmospheric pollution. One of the limitations of this study is that SPI-TOFMS cannot distinguish VOC isomers. Improving the membrane inlet systems and enhancing the development of high light intensity ionization sources would further enhance the instrument’s performance. In addition, monitoring should be combined with real-time meteorological conditions to prevent VOCs from forming regional diffusions under the influence of wind and other factors due to various seasonal climatic conditions. The above limitations will be important directions for our future research.

5. Conclusions

In this study, a measurement method was proposed with high sensitivity and high-quality mass resolution for monitoring of VOCs, which utilized SPI-TOFMS with navigation monitoring for quick online detection of VOCs. The instrument was able track VOC emission sources in cities and industrial parks and image the VOC distribution. The results illustrated that the VOC mass spectrometer not only meets the practical needs for online monitoring of atmospheric VOCs and pollution pattern recognition in industrial zones, but also predicts the potential for secondary pollutants, such as ozone, according to the detection data. This instrument is of great significance for tracking of pollution sources in cities and industrial zones, achieving the effective control of VOCs and precise emission reductions.

Author Contributions

Data curation, Y.Z. (Yurong Zhang); formal analysis, J.G., X.W., and M.D.; methodology, Y.Z. (Yurong Zhang); project administration, Y.Z. (Yuefeng Zhao); validation, H.L. and Y.W.; writing—original draft, Y.Z. (Yurong Zhang); writing—review and editing, Y.Z. (Yuefeng Zhao), Y.Z. (Yurong Zhang), K.C., Y.C., and J.P. All authors have read and agreed to the published version of the manuscript.

Funding

This research received no external funding.

Conflicts of Interest

The authors declare no conflict of interest.

References

  1. Jenkin, M.E.; Clemitshaw, K.C. Ozone and other secondary photochemical pollutants: Chemical processes governing their formation in the planetary boundary layer. Atmos. Environ. 2000, 34, 2499–2527. [Google Scholar] [CrossRef]
  2. Jenkin, M.E.; Derwent, R.G.; Wallington, T.J. Photochemical ozone creation potentials for volatile organic compounds: Rationalization and estimation. Atmos. Environ. 2017, 163, 128–137. [Google Scholar] [CrossRef]
  3. Kjærgaard, S.K.; Mølhave, L.; Pedersen, O.F. Human reactions to a mixture of indoor air volatile organic compounds. Atmos. Environ. Part A 1991, 25, 1417–1426. [Google Scholar] [CrossRef]
  4. Shusterman, D. The effects of air pollutants and irritants on the upper airway. Proc. Am. Thorac. Soc. 2011, 8, 101–105. [Google Scholar] [CrossRef] [PubMed]
  5. Wu, D.; Ding, X.; Li, Q.; Sun, J.; Huang, C.; Yao, L.; Wang, X.; Ye, X.; Chen, Y.; He, H.; et al. Pollutants emitted from typical chinese vessels: Potential contributions to ozone and secondary organic aerosols. J. Clean. Prod. 2019, 238, 117862. [Google Scholar] [CrossRef]
  6. Zhang, G.; Hao, Z.; Jiang, M.; Wang, H. Study on foreign regulations and standards of stationary sources VOCs emission control. Huanjing Kexue 2011, 32, 3501–3508. [Google Scholar] [PubMed]
  7. Zhang, X.; Xue, Z.; Li, H.; Yan, L.; Yang, Y.; Wang, Y.; Duan, J.; Li, L.; Chai, F.; Cheng, M.; et al. Ambient volatile organic compounds pollution in China. J. Environ. Sci. 2017, 55, 69–75. [Google Scholar] [CrossRef] [PubMed]
  8. Tsai, W.-T. A comparative study on the statutory and technical regulations for controlling indoor volatile organic compounds in Taiwan and Japan. Atmosphere 2018, 9, 195. [Google Scholar] [CrossRef] [Green Version]
  9. Spinelle, L.; Gerboles, M.; Kok, G.; Persijn, S.; Sauerwald, T. Review of portable and low-cost sensors for the ambient air monitoring of benzene and other volatile organic compounds. Sensors 2017, 17, 1520. [Google Scholar] [CrossRef] [Green Version]
  10. Szulczyński, B.; Gębicki, J. Currently commercially available chemical sensors employed for detection of volatile organic compounds in outdoor and indoor air. Environments 2017, 4, 21. [Google Scholar] [CrossRef] [Green Version]
  11. Zhang, E.J.; Teng, C.C.; van Kessel, T.G.; Klein, L.; Muralidhar, R.; Wysocki, G.; Green, W.M.J. Field deployment of a portable optical spectrometer for methane fugitive emissions monitoring on oil and gas well pads. Sensors 2019, 19, 2707. [Google Scholar] [CrossRef] [PubMed] [Green Version]
  12. Xu, X.; Van Stee, L.L.P.; Williams, J.; Beens, J.; Adahchour, M.; Vreuls, R.J.J.; Brinkman, U.A.T.; Lelieveld, J. Comprehensive two-dimensional gas chromatography (GC × GC) measurements of volatile organic compounds in the atmosphere. Atmos. Chem. Phys. 2003, 3, 665–682. [Google Scholar] [CrossRef] [Green Version]
  13. Wang, Y.; Xu, X.; Yin, L.; Cheng, H.; Mao, T.; Zhang, K.; Lin, W.; Meng, Z.; Palasota, J. Coupling of comprehensive two-dimensional gas chromatography with quadrupole mass spectrometry: Application to the identification of atmospheric volatile organic compounds. J. Chromatogr. A 2014, 1361, 229–239. [Google Scholar] [CrossRef] [PubMed]
  14. Liu, Y.; Sun, B.; Zhang, H. Progress in research on on-line monitoring techniques for volatile organic compounds in ambient air. Chem. Ind. Eng. Prog. 2008, 27, 648–653. [Google Scholar]
  15. Gao, W.; Tan, G.; Hong, Y.; Li, M.; Nian, H.; Guo, C.; Huang, Z.; Fu, Z.; Dong, J.; Xu, X.; et al. Development of portable single photon ionization time-of-flight mass spectrometer combined with membrane inlet. Int. J. Mass Spectrom. 2013, 334, 8–12. [Google Scholar] [CrossRef]
  16. González-Méndez, R.; Reich, D.F.; Mullock, S.J.; Corlett, C.A.; Mayhew, C.A. Development and use of a thermal desorption unit and proton transfer reaction mass spectrometry for trace explosive detection: Determination of the instrumental limits of detection and an investigation of memory effects. Int. J. Mass Spectrom. 2015, 385, 13–18. [Google Scholar] [CrossRef]
  17. Kari, E.; Miettinen, P.; Yli-Pirilä, P.; Virtanen, A.; Faiola, C.L. PTR-TOF-MS product ion distributions and humidity-dependence of biogenic volatile organic compounds. Int. J. Mass Spectrom. 2018, 430, 87–97. [Google Scholar] [CrossRef]
  18. Liu, W.; Jiang, J.; Hou, K.; Wang, W.; Qi, Y.; Wang, Y.; Xie, Y.; Hua, L.; Li, H. Online monitoring of trace chlorinated benzenes in flue gas of municipal solid waste incinerator by windowless VUV lamp single photon ionization TOFMS coupled with automatic enrichment system. Talanta 2016, 161, 693–699. [Google Scholar] [CrossRef] [Green Version]
  19. Li, Q.; Hua, L.; Xie, Y.; Jiang, J.; Li, H.; Hou, K.; Tian, D.; Li, H. Single photon ionization time-of-flight mass spectrometry with a windowless RF-discharge lamp for high temporal resolution monitoring of the initial stage of methanol-to-olefins reaction. Analyst 2019, 144, 1104–1109. [Google Scholar] [CrossRef]
  20. Wu, C.; Liu, W.; Jiang, J.; Wang, Y.; Hou, K.; Li, H. An in-source helical membrane inlet single photon ionization time-of-flight mass spectrometer for automatic monitoring of trace VOCs in water. Talanta 2019, 192, 46–51. [Google Scholar] [CrossRef]
  21. Sun, W.Q.; Shu, J.N.; Zhang, P.; Li, Z.; Li, N.N.; Liang, M.; Yang, B. Real-time monitoring of trace-level VOCs by an ultrasensitive lamp-based VUV photoionization mass spectrometer. Atmos. Meas. Tech. 2015, 8, 4637–4643. [Google Scholar] [CrossRef] [Green Version]
  22. Tonokura, K.; Kanno, N.; Yamamoto, Y.; Yamada, H. Development of a compact laser-based single photon ionization time-of-flight mass spectrometer. Int. J. Mass Spectrom. 2010, 290, 9–13. [Google Scholar] [CrossRef]
  23. Huo, L.; Gao, W.; Su, H.; Tan, G.; Mai, Z.; Huang, Z. Development of high sensitive online vacuum ultraviolet single-photon ionization time-of-flight mass spectrometer for VOCs. J. Chin. Mass Spectrom. Soc. 2018, 39, 171–179. [Google Scholar]
  24. Sun, W.Q.; Zhang, Y.; Fang, S.X. Application of vacuum ultraviolet single-photon ionization mass spectrometer in online analysis of volatile organic compounds. Chin. J. Anal. Chem. 2019, 47, 976–984. [Google Scholar] [CrossRef]
  25. Chen, Y.; Tan, G.; Mai, Z.; Zhou, D.; Zhong, Y.; Li, X.; Gao, W.; Huang, Z. Monitoring VOCs of plastic company by single photon ionization time-of-flight mass spectrometry. J. Atmos. Environ. Opt. 2017, 12, 66–73. [Google Scholar]
  26. Liang, Q.; Bao, X.; Sun, Q.; Zhang, Q.; Zou, X.; Huang, C.; Shen, C.; Chu, Y. Imaging VOC distribution in cities and tracing VOC emission sources with a novel mobile proton transfer reaction mass spectrometer. Environ. Pollut. 2020, 265, 114628. [Google Scholar] [CrossRef]
  27. Tan, G.; Gao, W.; Hong, Y.; Huang, Z.; Li, M.; Dong, J.; Chen, P.; Fu, Z.; Zhou, Z. Development of high sensitivity membrane introduction mass spectrometer for on-line detecting VOC. Mod. Sci. Instrum. 2011, 10, 59–62. [Google Scholar]
  28. Han, W.; Xu, G.; Gao, Y.; Huang, C.; Zhao, X.; Qian, J.; Wang, Y.; Yang, P. Progress in field-portable and miniature mass spectrometry. J. Chin. Mass Spectrom. Soc. 2007, 28, 242–252. [Google Scholar]
  29. Shi, W.; Lu, X.; Zhang, J.; Zhao, J.; Yang, L.; Yu, Q.; Wang, X. Comparison of membrane inlet and capillary introduction miniature mass spectrometry for liquid analysis. Polymers 2019, 11, 567. [Google Scholar] [CrossRef] [Green Version]
  30. Tan, G.; Gao, W.; Huang, Z.; Hong, Y.; Fu, Z.; Dong, J.; Cheng, P.; Zhou, Z. Vacuum ultraviolet single-photon ionization time-of-flight mass spectrometer. Chin. J. Anal. Chem. 2011, 39, 1470–1475. [Google Scholar] [CrossRef]
  31. Kanno, N.; Tonokura, K. Vacuum ultraviolet photoionization mass spectra and cross-sections for volatile organic compounds at 10.5 eV. Appl. Spectrosc. 2007, 61, 896–902. [Google Scholar] [CrossRef] [PubMed]
  32. Kronebusch, P.L.; Berkowitz, J. Photodissociative ionization in the 21–41 eV region: O2, N2, CO, NO, CO2, H2O, NH3 and CH4. Int. J. Mass Spectrom. Ion Phys. 1976, 22, 283–306. [Google Scholar] [CrossRef]
  33. Majety, V.P.; Scrinzi, A. Photo-ionization of noble gases: A demonstration of hybrid coupled channels approach. Photonics 2015, 2, 93–103. [Google Scholar] [CrossRef]
  34. Mühlberger, F.; Streibel, T.; Wieser, J.; Ulrich, A.; Zimmermann, R. Single photon ionization time-of-flight mass spectrometry with a pulsed electron beam pumped excimer VUV lamp for on-Line gas analysis: Setup and first results on cigarette smoke and human breath. Anal. Chem. 2005, 77, 7408–7414. [Google Scholar] [CrossRef] [PubMed]
  35. Gao, W.; Huang, Z.; Nian, H.; Shen, X.; Wang, P.; Hu, S.; Li, M.; Cheng, P.; Dong, J.; Xu, X.; et al. A novel gas analysis system for metallurgical materials based on time-of-flight mass spectrometry. Int. J. Mass Spectrom. 2010, 294, 77–82. [Google Scholar] [CrossRef]
  36. Dodonov, A.F.; Kozlovski, V.I.; Soulimenkov, I.V.; Raznikov, V.V.; Loboda, A.V.; Zhen, Z.; Horwath, T.; Wollnik, H. High-resolution electrospray ionization orthogonal-injection time-of-flight mass spectrometer. Eur. J. Mass Spectrom. 2000, 6, 481–490. [Google Scholar] [CrossRef]
  37. Li, Z.; Wei, J.; Zhang, B. Laser mass specreometry: Principles and applications in environmental monitoring. Chin. J. Quantum Electron. 2001, 18, 1–8. [Google Scholar]
  38. Carter, W.P.L. Development of ozone reactivity scales for volatile organic compounds. Air Waste 1994, 44, 881–899. [Google Scholar] [CrossRef] [Green Version]
  39. Atlinson, R.; Arey, J. Atmospheric degradation of volatile organic compounds. Chem. Rev. 2003, 103, 4605–4638. [Google Scholar] [CrossRef]
  40. Zeng, P.; Guo, H.; Liang, S.; Hu, K.; Huang, Z.; Hu, Y.; Wang, Z.; Cheng, H.; Lyu, X. Ambient volatile organic compounds and their contributions to ozone formation in Wuhan. Environ. Sci. Technol. 2018, 41, 117–124. [Google Scholar]
  41. Lin, X.; Zhu, B.; An, J.; Yang, H. Potential contribution of secondary organic aerosols and ozone of VOCs in the northern suburb of Nanjing. China Environ. Sci. 2015, 35, 976–986. [Google Scholar]
Figure 1. The SPI-TOFMS schematic diagram. (a) The schematic for the simple principle component and (b) the schematic cross-sectional diagram for each part of the SPI-TOFMS.
Photonics 07 00061 g001
Figure 2. Calibration curve of benzene from 5 ppbv, 10 ppbv, 15 ppbv, 20 ppbv, 25 ppbv and 30 ppbv.
Photonics 07 00061 g002
Figure 3. The environmental conditions during the navigation monitoring.
Photonics 07 00061 g003
Figure 4. Distribution of the total VOCs (TVOCs) from the navigation monitoring. The height of the cylinder represents the concentration of TVOCs; the color indicates the relative concentration. The navigation detection route began from a and ended at b. The route was Baizhang Road–Wuyun Road–Penglai Road–Tangkou Road–Wangke Road–Shuanglong Road–Lianli Road–Shuanglong Road–Lianli Road–Tangkou Road.
Photonics 07 00061 g004
Figure 5. The VOC content distribution. (a) The content distribution of VOCs near Qianhui Pharmaceutical. (b) The content distribution of VOCs near the Naxin Daily Necessities store. Note: The SPI-TOFMS cannot distinguish isomers when measuring VOCs.
Photonics 07 00061 g005
Figure 6. Substances with higher VOC concentrations in both study areas. (a) The navigation data near the Qianhui Pharmaceutical premises. (b) The navigation data near the Naxin Daily Necessities premises.
Photonics 07 00061 g006
Figure 7. The concentration changes in toluene during the process of navigation detection. (The height of the cylinder represents the concentration of toluene; the color indicates the relative concentration.).
Photonics 07 00061 g007
Figure 8. The VOC distributions, the OFP values, and the equivalent propylene concentration percentages of alkanes, alkenes, and aromatic hydrocarbons. (The OPF in Figure 8 is derived from the average value of the maximum and minimum OPF in Table 2.).
Photonics 07 00061 g008
Table 1. The repeatability and relative error of each target component.
Compoundsm/zActual Concentration (ppbv)Mean of the Detected Concentration (ppbv)Relative Standard Deviation (%)Absolute Value of Relative Error (%)
Benzene783029.2023.112.66
Toluene923029.1493.242.80
Chloroethane64.53028.7872.454.04
Isoprene684040.1972.190.49
Pentanal863031.0421.223.47
Table 2. The different VOC contents, the ozone formation potential (OFP) values, and equivalent propylene concentrations in the two study areas.
Qianhui PharmaceuticalNaxin Daily Necessities Company
VOCs (μg/m3)OPF min (×10−9)OPF max (×10−9)C(VOCs) * (×10−9)VOCs (μg/m3)OPF min (×10−9)OPF max (×10−9)C(VOCs) * (×10−9)
Alkanes28.8736.0163.107.7314.3215.8422.493.88
Alkenes21.19191.92213.1449.5619.71126.18140.9226.92
Aromatic hydrocarbons310.52822.59858.0167.21266.03707.95725.0357.62
Note: C(VOCs) *: C(VOCs) represent the equivalent propylene concentration of VOCs. Due to the presence of VOC isomers, the equivalent propylene concentration was calculated according to the average of the maximum and the minimum VOC concentrations.

