Abstract
A liquid-sealed single-mode–no-core–single-mode (SNS) structure fiber temperature sensor based on polyvinyl alcohol (PVA) partial replacement coating is proposed. Using a liquid-sealed glass capillary structure, the PVA solution is introduced into the SNS structure and avoids its influence by environmental humidity. Temperature can be obtained by measuring the shift of the multimode interference spectrum, which is affected by the thermal optical effect of the PVA solution. Through theoretical simulation of the sensor, the optimal NCF fiber length and coating stripped length are obtained by comprehensively considering the transmitted loss and output spectrum signal-to-noise ratio (SNR). The optimal PVA solution concentration is selected by measuring the thermo-optic coefficient (TOC) and refractive index (RI). Based on the theoretical optimization results, a PVA solution-coated SNS fiber optic temperature sensor is experimentally fabricated, and temperature-sensing characteristics are measured within −3.6 to 73.2 °C. The experimental results show that the sensor has a high sensitivity (nm/°C, maximum is 21.713 nm/°C) and has a resolution of 10−3 °C. has a stable negative linear relationship with temperature, and the correlation coefficient of the fitting curve exceeds 95%. The temperature cycling experiment and long-term stability test show that the temperature sensor has good repeatability and stability. The experimental results also show the nonlinear relationship between the temperature measurement range and sensitivity, clarify the important factors affecting the response performance of fiber temperature sensors, and provide important reference values for optical fiber temperature sensors.
1. Introduction
Accurate temperature measurement is critical in artificial intelligence, healthcare, industrial manufacturing, agriculture, scientific research, and aerospace. As process standards in these fields become increasingly refined and stringent, there is a growing demand for high-precision temperature sensors with both high sensitivity and fast response. Optical fiber sensors, known for precise measurement, fast signal transmission, robustness, and design flexibility, are widely used in biomedicine and health monitoring. At present, current research focuses on the fiber grating sensor [1,2], fiber optic interferometric sensors [3,4], the Sagnac Loop interferometer (SLI) [5,6,7] and the single-mode-multimode-single-mode (SMS) fiber optic structure sensor [8,9]. Among these, SMS structure optical fiber sensors have been widely used due to their low cost, simple structure, and fast response speed [10,11]. In the SMS structure, the multimode interference (MMI) effect generates a transmission spectrum with characteristic peaks affected by the external environment. As early as 2006, Li E. et al. proposed a reflective SMS-based temperature sensor but the measured sensitivity was only 15 pm/°C [12]. The reason for this is that the acrylate coating of multimode fiber (MMF) has a low thermo-optic coefficient (TOC), and the quartz body of the optical fiber has a low thermal expansion coefficient. No-core fiber (NCF) is a type of multimode fiber (MMF) with a uniform RI. In sensing applications, NCF (without coating) is regarded as the equivalent core, and the external environment and the coating are considered as the equivalent cladding, thus constructing a new MMF. Replacing MMF with NCF in SMS fiber temperature sensors forms a single-mode–no-core–single-mode (SNS) structure, enhancing accuracy and response speed [13,14,15,16]. However, the inherent sensitivity of the SNS structure fiber temperature sensor is less than 68 pm/°C [8,12]. Although the bent SMS structure can improve the sensitivity up to 44.26 pm/°C [17], the low TOC of the acrylate coating is still the main limitation of the temperature-sensing property. By using the reflection index (RI) standard liquid as the cladding, the temperature sensitivity of SNS structure can be improved to 360 pm/°C in the temperature range from 25 to 80 °C [15]. In 2014, Sun et al. demonstrated an SNS fiber structure encapsulated into a deionized water-filled cylindrical aluminum alloy shell. A temperature sensitivity of about 358 pm/°C benefits the larger TOC difference between water and the fiber core [18]. Therefore, removing the NCF coating and applying a material that has a higher TOC and thermal expansion coefficient can further improve the sensitivity.
Many functional materials can be applied to optical fiber temperature sensors, such as metals (Bi and In) [19], chalcogenide fiber [20], custom polyurethane–acrylate (PUA) [21], index-matching gels (Thorlabs, g608n) [22], polymethyl methacrylate (PMMA) [23], polydimethylsiloxane (PDMS) [24], and polyvinyl alcohol (PVA) [25]. Among them, PVA has the advantages of low cost, easy access, non-toxicity, and biodegradability, and is often found in the form of temperature-sensing materials and substrates in the research of optical fiber temperature sensors [26,27]. In addition, the abundant hydroxyl functional groups in PVA molecules confer strong absorption in the near-infrared (NIR) band [28] and a high thermoluminescence coefficient. However, solid PVA is a powdery flocculent, loose in texture, and low in thermal conductivity. The optical fiber has very poor adsorption of PVA powder, and the two cannot form a compact structure. Moreover, PVA is extremely sensitive to humidity and is prone to water absorption or water loss [29]. The heat transfer coefficient and thermo-optical effect of PVA with different water content are quite different. Optical fiber temperature sensors with PVA are highly susceptible to temperature and humidity crosstalk, with cross-sensitivities [10,30,31]. To prevent the liquid used as the cladding material from being affected by humidity, a liquid seal structure is a simple and effective technical solution [16,32,33]. R. Zhang et al. fabricated a SMS-based temperature sensor with an NCF cladding of glycerol–water mixture and a packing shell made of glass [34]. The measured temperature sensitivity of this liquid-sealed fiber structure was −453.4 pm/°C, which is limited by the low RI and TOC of the glycerol–water mixture. In comparison, PVA solutions exhibit higher refractive indices and higher thermal-optical coefficients. Utilizing liquid-sealed PVA solutions might improve the temperature-sensing sensitivity of SNS structures. Moreover, PVA significantly influences the temperature of ice nucleation [35], allowing the temperature-sensing range of this structure to extend to minus degrees.
In this work, an SNS liquid-sealed fiber temperature sensor based on MMI, thermo-optic effect, and thermal expansion effect is proposed. By replacing the partial coating with PVA solution as equivalent cladding, the sensing structure achieves high TOC and thermal conductivity [12,34]. The liquid-sealed SNS structure fiber temperature sensor is theoretically analyzed to obtain the optimal fiber structure and PVA solution concentration. The optimal NCF fiber length and PVA-cladding length are optimized, which influence the transmission loss and the SNR. The thermal-optical coefficient of PVA solutions of different concentrations is measured experimentally. A 20 mg/mL PVA solution is selected as the SNS structure coating material to be filled into the capillary tube by considering its fluidity and RI. Based on theoretical optimization, an SNS-structured fiber temperature sensor with liquid-sealed PVA cladding is fabricated and measured. As temperature increases, the sensor’s output spectrum exhibits a blue shift. Within the typical range of 35.9 to 39.9 °C, the temperature sensitivity is 6.97 nm/°C. After three temperature cycling experiments and a one-hour long-term stability test, the output wavelength drift is less than 0.5 nm, corresponding to a temperature drift of less than 0.07 °C. The sensor demonstrates excellent repeatability and long-term stability. Within the range of −3.6 to 73.2 °C, the sensor’s maximum temperature sensitivity is 21.173 nm/°C. Experimental results indicate that the sensor’s sensitivity exhibits a quadratic relationship with measured temperature, with sensitivity increasing as temperature rises. Thanks to PVA’s excellent freeze resistance and the liquid-sealed structure’s resistance to dehydration, the sensor can operate in low-temperature environments. Due to experimental limitations, sensor performance tests were not conducted at higher or lower temperatures. A comparison with previously reported liquid-sealed SNS structure fiber temperature sensors revealed that the sensor reported in this work exhibits improved sensitivity. The partially stripped cladding structure of the liquid-sealed sensor, as well as the relationship between sensing sensitivity and test temperature, provide theoretical basis and experimental references for designing high-sensitivity fiber temperature sensors.
2. Experimental and Methods
As shown in Figure 1, the linear SNS sensing structure of the liquid-sealed temperature sensor is achieved by splicing single-mode fiber (SMF) sections to both ends of an NCF with partially removed coating. The fabrication process of the sensor is illustrated in Figure 2. The SNS structure is constructed by fusing SMFs (SMF-28e, Corning Inc. (Corning, NY, USA)) to both ends of the NCF (CL-0/125, YOFC (Wuhan, China)), the partial coating of which is stripped, as depicted in Figure 2a. The cladding and coating diameters of NCF are 125 and 245 m, respectively. The cladding refractive index (RI) of NCF is 1.444 at 1550 nm. In Figure 2b, a high borosilicate glass capillary (RM-D3-100, Nantong Surui Experimental Equipment Co. (Nantong, China)) is nested over the NCF, ensuring it completely covers the stripped portion of the NCF. The RI of the capillary is 1.47, and the inner diameter is 300 m. As shown in Figure 2c, the capillary is then filled with PVA solution using a syringe, ensuring the solution is evenly distributed without air bubbles. The concentration of the PVA solution is 20 mg/mL. This PVA solution is prepared by dissolving PVA powder (088-20,17-88, Ningxia Dadi Recycling Development Co. (Shizuishan, China)) in deionized water. The PVA solution is gradually heated to 90 °C in a water bath and maintained for 1 h. During this process, an ultrasonic instrument was used to assist in treating the solution, utilizing cavitation and mechanical vibration effects to promote the uniform dispersion of PVA in the solution. Both ends of the capillary are sealed by the UV glue after the PVA solution is injected into the capillary. Then, the capillary tube is exposed to UV radiation for 3 min to ensure the adhesive is completely cured, which is shown in Figure 2d.
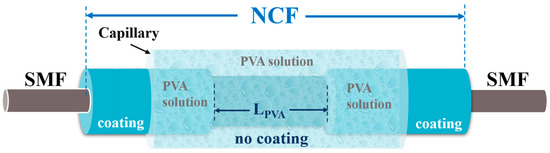
Figure 1.
Schematic diagram of SNS structure fiber temperature sensor based on MMI with PVA liquid partial replacement cladding.
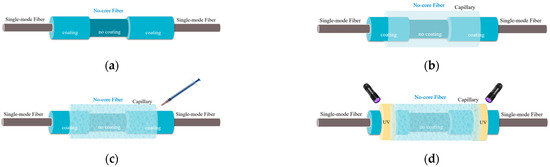
Figure 2.
Schematic diagram of the fabrication process of the sensor: (a) procedure 1; (b) procedure 2; (c) procedure 3; (d) procedure 4.
Figure 3 illustrates the experimental setup for an SNS liquid-sealed optical fiber temperature sensor. One end of the sensor is connected to an ASE light source, providing stable broad-spectrum input light in the 1520 nm to 1560 nm band. The other end is connected to an optical spectrum analyzer (OSA, YOKOGAWA (Tokyo, Japan), AD6370D), which receives and analyzes the spectral information of the output light. The thermoelectric cooler (TEC), powered by a DC power supply (HY3020B), provides a controlled variable-temperature environment. The thermal probe and the optical fiber sensor are placed on the TEC’s upper surface with thermal grease applied between them. Increasing TEC voltage raises ambient temperature, causing rapid blue shifts in output spectra. For reliable data, wait 3 min after each voltage adjustment for temperature stabilization before recording the thermal probe measurements and output spectrum. During this process, the sensor’s response relationship to temperature is calibrated, with the correlation adjusted based on multiple experimental results.
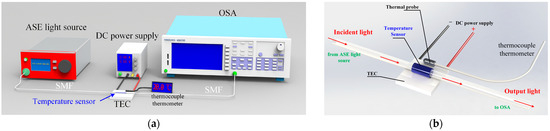
Figure 3.
Temperature measurement experimental setup: (a) physical diagram; (b) schematic diagram.
Sensing Principle and Structure Optimization
Figure 4a shows a schematic diagram of the simulation model of the SNS fiber temperature sensor with partial PVA cladding. A segment of NCF is spliced between two pieces of SMF. The diameters of SMF and NCF are 8 and 125 μm, respectively. The length of the NCF is marked as LNCF, which affects the strength of multimode interference effects in the structure [10]. Assuming that the NA of the NCF is 0.22, the RI of the core and the coating layer of the NCF are set to 1.444 and 1.427, respectively. The RI of the core of the SMF is set to be the same as that of the NCF to simplify the simulation, and the RI of the coating can be obtained as 1.442 according to its NA of 0.08. The coating layer of NCF is partly stripped to achieve contact between the core and PVA solution. The stripping length, labeled LPVA, affects the additional mode mismatch loss for the RI of the PVA solution, which is lower than that of the coating layer. To avoid water loss and solidification of the PVA solution, a glass capillary tube is placed over the SNS structure. The diameter of the capillary is 300 μm and its RI is 1.470. At the same time, both ends of the capillary are filled with cured UV glue. The length of the capillary is smaller than the length of the NCF coating layer, which can avoid the UV glue contacting with the fiber core and affecting the light propagation. The above waveguide structure is simulated using the beam propagation method (BPM) to vary the incident light wavelength in the range of 1520−1570 nm, and the output transmission spectra can be calculated. In the simulation, the grid is divided by a quarter wavelength and the material dispersion properties are ignored.
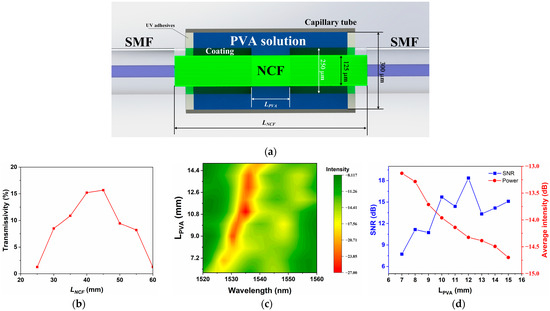
Figure 4.
(a) The simulated mode of the SNS fiber temperature sensor with partial PVA cladding. (b) Effects of on transmissivity; (c) effects of on output spectral intensity; (d) effects of on output spectral SNR and average spectrum intensity.
When the incident light enters the NCF in the SNS structure, high-order mode lights are excited and coupled with each other during the transmission process. Ignore the rapidly decaying radiation mode and only consider the time-domain stable transmission mode. Due to the different optical path lengths of the higher-order modes, a multimode interference (MMI) effect occurs in the output SMF. According to the MMI effect [10,11,13], the output light intensity of the SNS fiber sensor can be viewed as the interference between the two modes of the NCF cladding (equivalent core) and the environment cladding (equivalent cladding). The transmitted light intensities of the NCF cladding and environment cladding are denoted as and , respectively. The intensity of the total transmitted spectrum is expressed as
where is the phase difference between the core and cladding modes, which can be expressed as
where is the effective sensing length of the SNS structure, which is the NCF fiber length in this work, and is the wavelength of incident light, and and are the effective refractive indices of the NCF cladding and environment cladding, respectively. In partially coating stripped NCF, the is determined jointly by the RIs of the PVA solution and the coating layer , which is shown as Equation (3). The parameters α and β are determined by the total length of the NCF and the stripped length of the NCF, which represent the contributions of the PVA solution and coating layer to the effective RI of the cladding. According to the partial PVA solution coating structure, α and β can be expressed as LPVA/LNCF and (LNCF − LPVA)/LNCF, respectively.
The PVA material exhibits a thermo-optical effect as the temperature rises [26,29], decreasing the RI of the filled PVA solution. The NCF coating material also has this property. The RI of the filled PVA solution () and the coating layer at the measured temperature T can be expressed as Equations (4) and (5), respectively.
The and are the RI of the PVA solution and coating layer at room temperature ( = 23 °C). and are the thermotropic coefficients of them. Furthermore, due to the sealing effect of the capillary, the liquid pressure in the capillary can affect the RI of the elastic coating layer as the temperature rises [16,29]. The RI change caused by the liquid-sealing effect is represented by . Compared with temperature, the RI change caused by pressure in the liquid-sealed structure is much smaller [34].Assuming that the optical field transmitted in the SMF follows a Gaussian distribution, its field distribution is represented as . denote the coordinates of radial, angular, and axial directions, respectively. When the fundamental mode is input into the NCF through a fusion point (z = 0) from the SMF, ignoring the reflected loss at the fusion point and the power coupled to the radiation mode, the fundamental mode will decompose into a series of guided modes in the NCF, which can be expressed as Equation (6) [36,37]:
N is the number of excited modes in the NCF. represents the optical field distribution of the nth order guided mode in the NCF. represents the weight assigned to the nth order guided mode among all excitation modes [37]. The thermo-optic effect of the equivalent cladding causes the NA of the NCF to vary with temperature, further altering the number of modes excited in the NCF. For instance, with a structural parameter LPVA of 1.25 cm and LNCF of 4.5 cm, the NA and the number of excited modes N of NCF can be established using Equations (7) and (8) [37]. Considering only the thermo-optical efficiency of 20 mg/mL PVA solution (the relationship between its refractive index and temperature is illustrated in Figure 5b later), the calculated NA and N are about 0.2749 and 9700 when the temperature is 20 °C, respectively. At a temperature of 30 °C, the NA rises to 0.2990, with the total number of excitation modes reaching around 11,484.
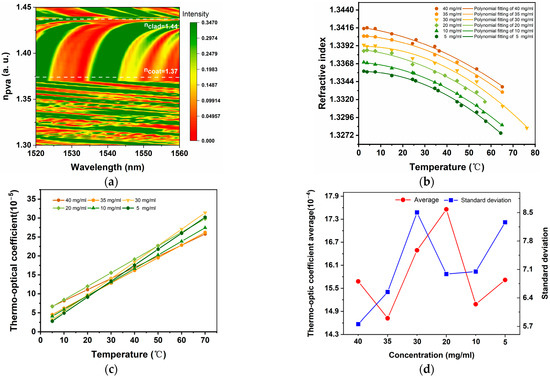
Figure 5.
(a) Output spectrum of PVA solutions at different concentrations; (b) refractive index of the PVA solution changes with temperature; (c) thermo-optical coefficient of a PVA solution that varies with temperature; (d) thermo-optical average and standard deviation coefficient.
As the number of superimposed modes increases, the multimode interference phenomenon at the end of the NCF alters, allowing for the extraction of temperature change information based on the variations in its output spectrum. When the number of modes increases, the multimode interference phenomenon can be equated to a change in the relative phase difference between the cladding light and the core light. When the phase difference meets the condition , is a positive integer, and for destructive interference, the characteristic peak (dip) wavelength is
According to the above equation, the wavelength of the resonance dip changes due to thermal expansion, refraction, and thermo-optical effects. The temperature can be measured by detuning the drift of the wavelength, and the temperature sensitivity can be expressed as Equation (9). When the temperature rises, the characteristic peak (dip) moves toward the short-wave direction (blue shift), and there is an obvious correlation between the characteristic peak drift in the output spectrum and the temperature change, which provides a theoretical basis for this temperature sensor.
According to theoretical analysis, the amount of change in the equivalent RI of the sensor is influenced by the dimensions of the sensing structure and the RI of the aqueous PVA solution covering the cladding. Both NCF length () and coating removal length () should be optimized to enhance the sensing property. In the SNS structure, the electric field intensity along the light propagation direction repeats periodically with the Talbot length. At the self-imaging point, the optical energy coupled into the next segment of the SMF is at its maximum. The 1550 nm light field intensity distribution in the NCF of the SNS structure is simulated. The RI of PVA and the coating (PTFE) are taken as their typical value of 1.339 and 1.370, respectively. The stripped length of NCF is set to 1.25 cm for simulation analysis. The simulated relationship between transmittance and NCF fiber length is shown in Figure 4b, while the stripping length is kept constant. Proper retention of the coating layer can help reduce the transmission losses. When the length is 4.5 cm, the highest transmittance of 15.6% is obtained, and the in the experiment is set to 4.5 cm.
Furthermore, the stripping length is the contact length of NCF with PVA solution, which not only affects transmission loss but also affects the output signal-to-noise ratio (SNR). Figure 4c shows the simulated output spectra with the stripped length of the NCF () varied in the range of 0.7 to 1.5 cm. The is set to 4.5 cm in this calculation. The characteristic peak wavelength () shifts to longer wavelengths with increases. Due to the difference in RIs of PVA and coating, there will be corresponding differences in the numerical aperture of the areas covered by them. This leads to spatial movement of the self-imaging point and frequency domain shift of the transmitted wavelength. Considering the signal’s readability, the relative SNR, which means the intensity ratio of the characteristic peak and the noise near it, is simulated and analyzed. The simulated results of the SNR and the loss with varied are plotted in Figure 4d. The SNR exhibits a wave-like increase followed by a decrease, reaching its maximum value when is 1.2 cm, but the increase in reduces the average intensity of the output signal. The stripping length of the NCF coating layer is selected as 1.2 cm by balancing the signal-to-noise ratio and loss. The PVA solution covering the NCF influences the equivalent RI of the cladding of the sensing structure and affects the morphology of the characteristic peaks in the output spectrum directly. The concentration of the PVA solution is the key factor determining its RI and TOC. The output spectra corresponding to the sensing structure with the above-optimized structure parameters are theoretically analyzed to obtain the optimal concentration. The output spectrum with varied RI of the PVA in the range from 1.3 to 1.45 is shown in Figure 5a. When the is between the RI of the NCF cladding and that of the coating layer, the characteristic dips of the output spectrum show an obvious blue shift with decreasing . The closer the is to the NCF cladding RI, the faster the characteristic wavelength changes. Once the value reduces below 1.37 (the RI of the coating), the characteristic spectrum will no longer be obvious, and the characteristic spectrum will red-shift as the decreases. Therefore, it is important to accurately measure the RI of the PVA solution.
The RI of PVA solution is related to its concentration, and it is crucial to prepare a PVA solution of appropriate concentration. PVA (088-20, 17-88) was purchased from Ningxia Dadi Recycling Development Co. (Shizuishan, China). All reagents were used in this work without further purification. Ultra-pure water was used in the whole experiment. Taking 20 mg/mL PVA solution as an example, the preparation process was as follows: Initially, 200 mg of PVA powder was accurately weighed using an electronic balance and added to a 10 mL volumetric flask. Room temperature deionized water was then slowly added to the volumetric flask until the water level reached the graduation line on the flask’s neck. After sealing the flask, it was left at room temperature for 24 h to allow the PVA powder to pre-wet and solubilize adequately in cold water. Subsequently, the flask was placed in a water bath, gradually heated to 90 °C, and maintained at this temperature for one hour. During this process, an ultrasonic instrument was used to assist in treating the solution, utilizing cavitation and mechanical vibration effects to promote the uniform dispersion of PVA in the solution, ensuring complete dissolution and the formation of a homogeneous and stable solution system. Finally, the prepared PVA solution was transferred to a sample tube and kept sealed at room temperature.
As shown in Figure 5b, the RI of PVA solutions at various concentrations and temperatures is precisely measured, and the corresponding variation curves are plotted. During the experiment, the concentration of the PVA solution was gradually increased from 5 to 50 mg/mL. Multiple sets of data points were randomly selected within the temperature range of 20 to 80 °C for testing to ensure that the experimental results comprehensively reflect the real conditions under different operating situations. The experimental findings indicate that at a constant temperature, the refractive index of the PVA solution incrementally increases with the concentration. The temperature as a function of the RI of the PVA solution under each concentration is determined using the polynomial fitting method, which is shown in Figure 5b. The thermo-optical coefficient variation curves of PVA solutions at different temperatures and concentrations are plotted in Figure 5c. With the gradual increase in temperature, the thermo-optical coefficient of the PVA solution also increases. Within the temperature range of 5–70 °C, 20 mg/mL and 30 mg/mL PVA solution exhibit a high TOC, and Figure 5d demonstrates 20 mg/mL PVA solution has a larger average and smaller standard deviation in thermo-optical coefficients. Additionally, when the concentration is high, the fluidity of the PVA solution significantly worsens, which can increase the complexity and difficulty of operations during the preparation of the sensor structure. Therefore, 20 mg/mL is selected as the concentration of the PVA solution for subsequent experiments.
3. Results
The temperature-sensing properties of the liquid-sealed fiber sensor are experimentally analyzed. As shown in Figure 6a,b, with the gradual increase in temperature, the characteristic peaks of the output light are blue-shifted, and the wavelengths of these peaks show a strong response to the temperature changes, demonstrating a clear negative linear relationship with the temperature. This experimental result is consistent with the theoretical analysis and simulation results discussed in the previous section, strongly verifying the theoretical model’s accuracy and the experimental design’s reasonableness. The output spectrum changes with temperature are depicted in Figure 6c. As the temperature rises, the blue shift of the characteristic valley is accompanied by a decrease in the modulation depth from 10.1 to 2.4 dB. On the one hand, this is due to the rapid decrease in the intensity of the input light at its spectral fringes. On the other hand, as seen on the output spectrum, a relatively weak modulation signal, which comes from multimode interference in the NCF core, is superimposed on the stronger core-cladding interference signal. This superposition leads to a decrease in the SNR of the output spectrum. The use of the FFT-based signal filtering technique is expected to improve the output SNR [38,39]. Considering that the current data are sufficient to obtain information about the drift of the spectrum with temperature, we did not further process the signal with FFT filtering. To demonstrate the repeatability and reliability of the sensor’s performance, the wavelength of the characteristic peak at each temperature point was independently measured five times. The measurement errors were recorded and plotted as error bars in Figure 6d. Due to their high temperature sensitivity, the error bars are displayed relatively small in the figure. The maximum error was only 0.3 nm and the average measurement error was 0.21 nm over five repeated experiments. Through weighted polynomial fitting, a response relationship between temperature and the wavelength of the characteristic peak is established, with the fitted regression being 99.84%, as shown in Figure 6d and Equation (11):
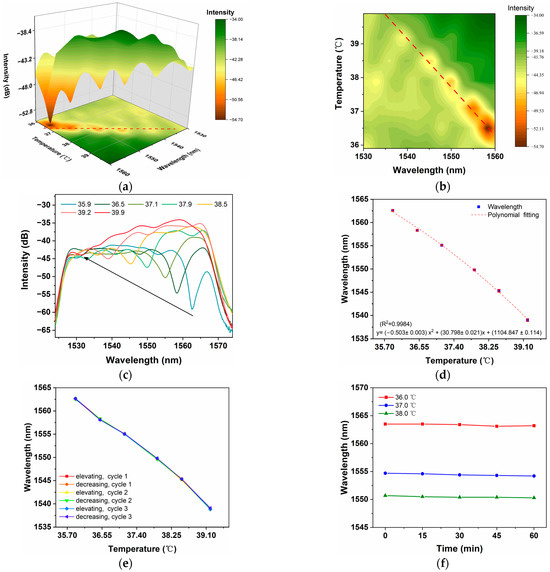
Figure 6.
(a) Three-dimensional plot of temperature versus output light spectrum; (b) 2D plot of temperature versus output light spectrum; (c) output trend graph of light intensity as a function of temperature; (d) response between sensor temperature and wavelength offset of characteristic peaks. (e) The wavelength changes recorded during the three-cycling experiment. (f) The long-term stability of the sensor in one hour.
The 95% confidence intervals for the fitted parameters of the quadratic, primary, and constant terms are [−0.513, −0.493], [30.731, 30.865], and [1104.484, 1105.210], respectively.
Based on the above data and modeling, the temperature sensitivity is calculated to be approximately 6.97 nm/°C for this temperature range. A temperature cycling experiment is conducted to evaluate the stability of the sensor. The measured temperature is adjusted between 35.9 and 39.9 °C, and repeated three times. The wavelength changes recorded during the six times of elevating and decreasing temperature are shown in Figure 6e. The wavelength variation trend is almost the same, with a maximum wavelength shift of 0.3 nm. It was observed that the output optical spectrum could be accurately and quickly restored to its original state before the temperature change, which fully demonstrated the excellent reversibility of the sensor. Meanwhile, three representative temperature values (36 °C, 37 °C, and 38 °C), ranging from 35.9 to 39.9 °C, were selected to evaluate the long-term stability of the sensor, with results presented in Figure 6f. The DC power supply is adjusted to maintain the specified temperature, and the sensor operated for one hour with output wavelengths recorded at 15 min intervals. Over prolonged operation, the output wavelength exhibits a slight decrease and tends to drift towards shorter wavelengths as temperature increases. The maximum temperature drift of the output wavelength is approximately 0.5 nm over one hour, correlating with a measured temperature drift of roughly 0.07 °C. The temperature drift may result from inaccuracies in temperature control. The sensor exhibits comparable levels of temperature drift and measurement error, suggesting it possesses good long-term stability.
The range of measured temperatures has been further expanded to explore the sensing properties across multiple temperature bands. The response capability of the sensing structure varies under different wavelength conditions according to Equation (2). To minimize the error in response performance of the temperature measurement, reduce the dependence on the light source, and facilitate subsequent sensor network applications, we opted for a fixed wavelength range of 1530 nm to 1560 nm for experimental research. Figure 7a shows the corresponding output spectrum of 15 representative temperature segments that were randomly selected for measurement within the large temperature range of −3.6 °C to 73.2 °C. The response relationship and sensitivity of the sensor at each temperature range were also accurately fitted and calibrated, as shown in Figure 7b. The demonstrates a consistent negative linear relationship with temperature across all temperature bands, and the sensitivity shows a gradual increasing trend with rising temperature. The temperature sensitivity exhibits a sharp decrease from 4.209 nm/°C to 3.946 nm/°C in the temperature range of −3.6 °C to 4 °C, with a decrease rate of approximately 0.331 nm/°C2, as shown in Figure 7c. Around 0 °C to 4 °C, with the increase in temperature, the volume of PVA aqueous solution decreases due to the ant expansion characteristics, the pressure on the NCF coating decreases, the equivalent shear stress of the cladding decreases, and the equivalent refractive index change of the sensing structure caused by stress birefringence decreases, so that the sensitivity of the sensor decreases. In the temperature range of 4.3 °C to 13.3 °C, sensitivity increases sharply from 4.367 nm/°C to 6.117 nm/°C, with an increase rate of about 0.238 nm/°C2. Between 14.8 °C and 23.2 °C, the sensor sensitivity fluctuates slightly, showing a modest decreasing trend from 5.844 nm/°C to 5.433 nm/°C, with a decrease rate of 0.071 nm/°C2. It may be attributed to the pronounced thermal expansion of PVA in this temperature interval, and the corresponding increase in the diameter and length of the NCF cladding, which interact and lead to a brief decrease in sensor sensitivity. From 28.8 °C to 48.2 °C, the sensor sensitivity gradually increases from 5.132 nm/°C to 8.387 nm/°C, with an increase rate of about 0.203 nm/°C2. The significant thermal expansion of the NCF cladding layer in this temperature range effectively offsets the effects of changes in the core diameter, while the increase in core length also enhances the sensitivity of the sensor. From 51.6 °C to 73.2 °C, the sensor sensitivity increases rapidly from 9.131 nm/°C to 21.713 nm/°C, with an increase rate of about 0.628 nm/°C2, during which the thermo-optic effect of PVA predominates.
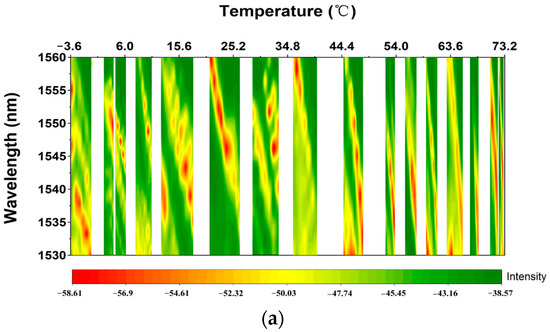
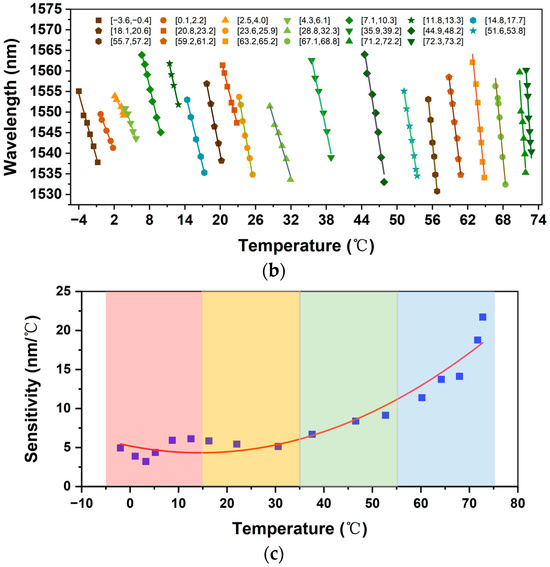
Figure 7.
(a) Output spectrum; (b) fitting response relationship between wavelength and temperature; (c) fitting response of sensitivity to temperature.
Throughout the warming process, the changes in sensor sensitivity are consistent with the theoretical analysis provided above, compared to the traditional temperature sensors with a pure SNS structure, which only have a temperature sensitivity of 11.4 pm/°C due to the low thermal expansion coefficient of quartz [17]. The liquid-sealed SNS structure fiber temperature sensor in this work successfully enhances the sensor sensitivity to the nm/°C order of magnitude. This sensor reaches the maximum sensitivity of 21.713 nm/°C in the range [72.3, 73.2] °C. The fitted curves obtained across multiple temperature bands have R2 (Coefficient of Determination, COD) values and Pearson’s r coefficients are listed in Table 1. The R2 (Coefficient of Determination) values are greater than 0.95, and Pearson’s r coefficients range from −1 to −0.975. These data confirm an extremely strong negative correlation between temperature and the wavelength of the characteristic peaks. This fitting curve can be used for predicting and accurately measuring temperatures. Given that the wavelength accuracy of the spectrometer used is 0.02 nm, this sensor accurately measures temperature with a resolution of the order of 10−3 °C when the range permits. This level of accuracy is highly competitive in the field of optical fiber temperature sensing and can meet the demands of many application scenarios that require high accuracy. The experimental results demonstrate that high temperature sensitivity can indeed be achieved using a liquid-sealed SNS structure, with the capillary and liquid filling of the structure playing a pivotal role. The sensing structure designed in this work leverages the strong thermos-optic effect of PVA and the thermal expansion of the aqueous solution to achieve high temperature sensitivity. The thin capillary tubes wrapped radially around the NCF reduce the liquid-filled volume, and the pronounced capillarity enhances the influence of liquid volume changes on sensor sensitivity significantly. However, the observed decrease in sensor sensitivity with increasing temperature between 0 and 4 °C may be due to the abnormal expansion property of the aqueous solution within this temperature range. The anomalous expansion property of water causes structural changes between water molecules with the gradual increase in temperature in a low-temperature environment. This, in turn, affects the physical properties of the PVA solution and its interaction with the sensing structure, ultimately leading to a downward trend in sensor sensitivity. However, this characteristic enables the sensor to achieve relatively high sensitivity in low-temperature environments, providing certain advantages and potential for its application in specific low-temperature scenarios.

Table 1.
The fitted curves obtained across multiple temperature bands have R2 (Coefficient of Determination) values and Pearson’s r coefficients.
The relevant research results of fiber temperature sensors based on MMI effect, the material thermo-optical effect, and the thermal expansion effect are compared, as shown in Table 2. Interferometric temperature sensors based on quartz fibers, such as FPI and SLI, have a wide temperature measurement range and can measure extremely low and high temperatures. However, their sensitivity is limited by the low TOC of quartz fibers, and there is cross-interference between strain and RI [3,4,5,8]. The microstructures such as conical SMS or C-shaped microfibers, and the interaction between the evanescent field and the external environment is enhanced, thereby improving sensitivity [17,19,25,29,31]. However, this approach results in weaker mechanical strength and more complex processing techniques. For simple SMS structures, the intrinsic temperature sensitivity is not high enough [8,12]. However, by applying a functional material coating with a high TOC, sensitivity can be effectively enhanced. However, difficult-to-control solid coating RI and the complex manufacturing process are challenging, limiting sensitivity optimization [15,21,22,27]. By utilizing a liquid-sealed structure to obtain a liquid coating layer, an SNS fiber temperature sensor can be constructed. On one hand, this fully leverages the high TOC and easily adjustable RI characteristics of the solution. On the other hand, it reduces manufacturing complexity, making it an effective method for achieving high sensitivity and a wide temperature measurement range. The temperature-sensing sensitivity of the liquid-sealed structure is significantly improved [16]. Further, by reducing the core size of the NCF fiber and enhancing the intrinsic temperature sensitivity of the SNS structure [8,12], selecting a liquid that closely matches the RI of the NCF fiber can improve temperature-sensing sensitivity [16,32,33,34]. However, as shown in the comparison results, while the liquid-sealed structure achieves high sensitivity, its temperature measurement range is limited by the chemical stability of the liquid-sealed material. At low temperatures, some materials may fail or solidify, such as glycerol [32], which exhibits significant performance degradation below 20 °C. At high temperatures, some materials may expand, leading to nonlinearity [33]. The low freezing point and high-temperature stability of PVA solution enable the temperature measurement range of the sensor described in this work. The proposed SNS liquid-sealed fiber temperature sensor in this work, which partially replaces the coating layer with PVA, has a maximum sensitivity at the nm/°C level, with the highest sensitivity reaching 21.713 nm/°C. In particular, it can work below 0 °C, due to the anti-water condensation properties of the PVA solution. At the same time, because of the liquid-sealed structure, this sensor can prevent PVA from losing water in the air. Moreover, due to its resolution at the 10−3 °C level, it has broad application prospects in the field of monitoring minute temperature changes, such as measuring minute temperature changes in biomedicine and chemical reactions, monitoring circuit overloads, and monitoring the normalizing and annealing processes of steel. The PVA’s environmentally friendly and non-toxic characteristics make this sensor particularly suitable for biomedicine, food processing, and environmental monitoring, providing a safe and reliable temperature measurement solution for these critical fields.
Table 2.
Typical temperature-sensing performance of different optical fiber structures.
4. Conclusions
A fiber temperature sensor that integrates MMI, thermo-optic, and thermal expansion effects is designed. This sensor employs PVA, a material with a high TOC, partially substituting the coating layer within an SNS fiber structure. The liquid-sealed structure uses capillary glass tubes and UV adhesive, enhancing the precision and stability of temperature measurements. Experimental results demonstrate that the sensor maintains excellent performance at low temperature −3.6 °C and high temperature 73.2 °C, displaying a significant sensitivity increase to the nm/°C level, a resolution of the order of 10−3 °C, and superior accuracy compared to traditional optical fiber sensors. The sensor exhibits robust performance characteristics, including good accuracy, repeatability, and stability under diverse environmental conditions, making it highly suitable for widespread practical applications. The strong infrared light absorption by PVA, confirmed through targeted experiments, supports the sensor’s operational principle and elucidates the underlying performance mechanisms. The optimization of systematic parameters such as NCF length, coating layer peeling length, and PVA solution concentration effectively enhances and balances performance indices like SNR, spectral intensity, and sensitivity. However, the proposed sensor has several limitations. The sensor is only capable of point-wise temperature sensing limited to the surface of the capillary, although spatial temperature distribution can be achieved through a network of sensors. Despite the liquid-sealed configuration inherently mitigating humidity-induced interference, dedicated characterization of humidity-dependent performance remains unaddressed. The SNR is constrained by the lack of FFT-based demodulation for interference signals. Although the operating temperature range exceeds that of conventional fiber temperature sensors due to PVA’s low-temperature compatibility, instability in the low-temperature regime persists, which can be alleviated through reasonable selection of materials and optimization of structure. These limitations will be systematically addressed in subsequent investigations. Nevertheless, this work not only verifies the innovative design and performance advantages of the PVA-coated SNS fiberoptic temperature sensor but also contributes to the theoretical and practical advancements in the field.
Author Contributions
Conceptualization, X.B., C.T. and S.C.; software, X.B.; validation, S.C. and C.T.; investigation, Z.Z.; writing—original draft preparation, C.T.; writing—review and editing, X.B. and S.C. All authors have read and agreed to the published version of the manuscript.
Funding
This work was supported by the National Natural Science Foundation of China (62265013), and the Natural Science Foundation of Inner Mongolia Autonomous Region of China (2025LHMS01001).
Institutional Review Board Statement
Not applicable.
Informed Consent Statement
Not applicable.
Data Availability Statement
Data will be made available on request.
Conflicts of Interest
The authors declare no conflicts of interest.
References
- Zhang, S.; Deng, S.; Geng, T.; Sun, C.; Niu, H.; Li, X.; Wang, Z.; Li, X.; Ma, Y.; Yang, W.; et al. A Miniature Ultra Long Period Fiber Grating for Simultaneous Measurement of Axial Strain and Temperature. Opt. Laser Technol. 2020, 126, 106121. [Google Scholar] [CrossRef]
- Gonzalez-Reyna, M.A.; Alvarado-Mendez, E.; Estudillo-Ayala, J.M.; Vargas-Rodriguez, E.; Sosa-Morales, M.E.; Sier-ra-Hernandez, J.M.; Jauregui-Vazquez, D.; Rojas-Laguna, R. Laser Temperature Sensor Based on a Fiber Bragg Grating. IEEE Photon. Technol. Lett. 2015, 27, 1141–1144. [Google Scholar] [CrossRef]
- Hu, Y.; Lin, Q.; Yan, F.; Xiao, L.; Ni, L.; Liang, W.; Chen, L.; Liu, G.; Chen, Y.; Luo, Y.; et al. Simultaneous Measurement of the Refractive Index and Temperature Based on a Hybrid Fiber Interferometer. IEEE Sens. J. 2020, 20, 13411–13417. [Google Scholar] [CrossRef]
- Statkiewicz-Barabach, G.; Mergo, P.; Urbanczyk, W. Bragg Grating-Based Fabry–Perot Interferometer Fabricated in a Polymer Fiber for Sensing with Improved Resolution. J. Opt. 2017, 19, 015609. [Google Scholar] [CrossRef]
- Cai, M.; Chen, H.; Shi, R.; Li, H.; Zhang, S.; Jia, S.; Hu, J.; Li, S. Cryogenic temperature sensor based on fiber optic Sagnac interferometer with a panda polarization-maintaining fiber. Opt. Laser Technol. 2025, 180, 111477. [Google Scholar] [CrossRef]
- Shao, L.; Hu, J.; Lu, H.; Du, J.; Wu, T.; Wang, Y. High-Sensitivity Temperature Sensor Based on Polarization Maintaining Fiber Sagnac Loop. Photonic Sens. 2019, 9, 25–32. [Google Scholar] [CrossRef]
- Pizzaia, J.P.L.; Castellani, C.E.S.; Leal-Junior, A.G. Highly Sensitive Temperature Sensing Based on a Birefringent Fiber Sagnac Loop. Opt. Fiber Technol. 2022, 72, 102949. [Google Scholar] [CrossRef]
- Wang, J.; Wang, L.; Su, X.; Xiao, R.; Cheng, H. Temperature, Stress, Refractive Index and Humidity Multi Parameter Highly Integrated Optical Fiber Sensor. Opt. Laser Technol. 2022, 152, 108086. [Google Scholar] [CrossRef]
- Sakata, H.; Kosaka, F.; Hayakawa, K. Broadly Tunable Tm/Ho-Codoped Fiber Lasers Based on Temperature-Sensitive Single-Mode–Multimode–Single-Mode Fiber Structures. Appl. Opt. 2020, 59, 4016–4021. [Google Scholar] [CrossRef]
- Wu, Q.; Qu, Y.; Liu, J.; Yuan, J.; Wan, S.-P.; Wu, T.; He, X.-D.; Liu, B.; Liu, D.; Ma, Y.; et al. Singlemode-Multimode-Singlemode Fiber Structures for Sensing Applications—A Review. IEEE Sens. J. 2021, 21, 12734–12751. [Google Scholar] [CrossRef]
- Wang, K.; Dong, X.; Köhler, M.H.; Kienle, P.; Bian, Q.; Jakobi, M.; Koch, A.W. Advances in Optical Fiber Sensors Based on Multimode Interference (MMI): A Review. IEEE Sens. J. 2021, 21, 132–142. [Google Scholar] [CrossRef]
- Li, E.; Wang, X.; Zhang, C. Fiber-optic temperature sensor based on interference of selective higher-order modes. Appl. Phys. Lett. 2006, 89, 091119. [Google Scholar] [CrossRef]
- Zhao, Y.; Zhao, J.; Zhao, Q. Review of No-Core Optical Fiber Sensor and Applications. Sens. Actuators Phys. 2020, 313, 112160. [Google Scholar] [CrossRef]
- Silva, S.; Pachon, E.G.P.; Franco, M.A.R.; Jorge, P.; Santos, J.L.; Malcata, F.X.; Cordeiro, C.M.B.; Frazao, O. Curvature and Temperature Discrimination Using Multimode Interference Fiber Optic Structures—A Proof of Concept. J. Light. Technol. 2012, 30, 3569–3575. [Google Scholar] [CrossRef]
- Silva, S.; Pachon, E.G.P.; Franco, M.A.R.; Hayashi, J.G.; Malcata, F.X.; Frazão, O.; Jorge, P.; Cordeiro, C.M.B. Ultrahigh-Sensitivity Temperature Fiber Sensor Based on Multimode Interference. Appl. Opt. 2012, 51, 3236–3242. [Google Scholar] [CrossRef] [PubMed]
- Ling, C.; Li, J.; Wang, Y.; Chen, H.; Gu, L.; Ding, Y. Structure Optimization of a Liquid-Sealed SNS Fiber Optic Temperature Sensor. Opt. Laser Technol. 2023, 162, 109290. [Google Scholar] [CrossRef]
- Wu, Q.; Semenova, Y.; Hatta, A.M.; Wang, P.; Farrell, G. Bent SMS fibre structure for temperature measurement. Electron. Lett. 2010, 46, 1769. [Google Scholar] [CrossRef]
- Sun, H.; Hu, M.; Rong, Q.; Du, Y.; Yang, H.; Qiao, X. High sensitivity optical fiber temperature sensor based on the temperature cross-sensitivity feature of RI-sensitive device. Opt. Commun. 2014, 323, 28–31. [Google Scholar] [CrossRef]
- Reyes-Vera, E.; Cordeiro, C.M.B.; Torres, P. Highly sensitive temperature sensor using a Sagnac loop interferometer based on a side-hole photonic crystal fiber filled with metal. Appl. Opt. 2017, 56, 156–162. [Google Scholar] [CrossRef]
- She, L.; Wang, P.; Sun, W.; Wang, X.; Yang, W.; Brambilla, G.; Farrell, G. A Chalcogenide Multimode Interferometric Temperature Sensor Operating at a Wavelength of 2 μm. IEEE Sens. J. 2017, 17, 1721–1726. [Google Scholar] [CrossRef]
- Zhang, Y.; Xue, L.; Wang, T.; Yang, L.; Zhu, B.; Zhang, Q. High Performance Temperature Sensing of Single Mode-Multimode-Single Mode Fiber With Thermo-Optic Polymer as Cladding of Multimode Fiber Segment. IEEE Sens. J. 2014, 14, 1143–1147. [Google Scholar] [CrossRef]
- Sakata, H.; Okada, K.; Mochizuki, J. Highly Sensitive Temperature Sensor Based on Multimode-Interference Fiber Structure with Gel Cladding. Microw. Opt. Technol. Lett. 2021, 63, 1647–1651. [Google Scholar] [CrossRef]
- Chen, Y.; Hu, Y.; Yan, F.; Xiao, L.; Huang, J.; Ni, L.; Liang, W.; Liu, G.-S.; Chen, L.; Luo, Y.; et al. Ultrahigh-Sensitive and Compact Temperature Sensor Based on No-Core Fiber with PMMA Coating. Opt. Express 2021, 29, 37591–37601. [Google Scholar] [CrossRef]
- Chen, Q.; Yang, W.; Zhang, L.; Li, C.; Guan, C.; Xiong, Y.; Yang, Y.; Li, L. The fiber temperature sensor with PDMS sensitization based on the T-MFM fiber structure. Opt. Fiber Technol. 2021, 67, 102701. [Google Scholar] [CrossRef]
- Teng, C.; Liu, Y.; Min, R.; Hu, X.; Qin, Z.; Deng, H.; Yuan, L. An MMF–HCF Reflective SPR Sensor for Simultaneous Measurement of Temperature and Relative Humidity. IEEE Sens. J. 2023, 23, 21301–21307. [Google Scholar] [CrossRef]
- Chen, L.; Xu, Y.; Liu, Y.; Wang, J.; Chen, J.; Chang, X.; Zhu, Y. Flexible and Transparent Electronic Skin Sensor with Sensing Capabilities for Pressure, Temperature, and Humidity. ACS Appl. Mater. Interfaces 2023, 15, 24923–24932. [Google Scholar] [CrossRef] [PubMed]
- Al-Hayali, S.K.; Al-Janabi, A.H. All Fiber-Optic Temperature Sensor Based on Cladding Etched No-Core Fiber Coated with Nanostructured Copper Oxide-Polyvinyl Alcohol Thin Film. Optik 2020, 220, 165154. [Google Scholar] [CrossRef]
- Guirguis, O.W.; Moselhey, M.T.H. Optical Study of Poly(Vinyl Alcohol)/Hydroxypropyl Methylcellulose Blends. J. Mater. Sci. 2011, 46, 5775–5789. [Google Scholar] [CrossRef]
- Chen, T.; Jiang, H.; Xia, H.; Luo, H.; Xie, K. U-Shaped Microfiber Sensor Coated with PVA Nanofibers for the Simultaneous Measurement of Humidity and Temperature. Sens. Actuators B Chem. 2023, 378, 133203. [Google Scholar] [CrossRef]
- Tong, R.; Zhao, Y.; Zheng, H.; Xia, F. Simultaneous Measurement of Temperature and Relative Humidity by Compact Mach-Zehnder Interferometer and Fabry-Perot Interferometer. Measurement 2020, 155, 107499. [Google Scholar] [CrossRef]
- Li, F.; Li, X.-G.; Zhou, X.; Zhang, Y.-N.; Lv, R.-Q.; Zhao, Y.; Xie, L.-S.; Nguyen, L.V.; Ebendorff-Heidepriem, H.; Warren-Smith, S.C. Simultaneous Measurement of Temperature and Relative Humidity Using Cascaded C-Shaped Fabry-Perot Interferometers. J. Light. Technol. 2022, 40, 1209–1215. [Google Scholar] [CrossRef]
- Hu, P.; Chen, Z.; Yang, M.; Yang, J.; Zhong, C. Highly Sensitive Liquid-Sealed Multimode Fiber Interferometric Temperature Sensor. Sens. Actuators A Phys. 2015, 223, 114–118. [Google Scholar] [CrossRef]
- Ling, C.; Wang, Y.; Li, J.; Chen, H.; Ding, Y. Numerical and Experimental Study on Temperature Measurement Performance of SNS Fiber Optic Sensor with Liquid-Sealed. Opt. Fiber Technol. 2022, 73, 103042. [Google Scholar] [CrossRef]
- Zhang, R.; Liu, T.; Han, Q.; Chen, Y.; Li, L.; Yao, X.S. Temperature Cross-Sensitivity Characteristics of Singlemode–Multimode–Singlemode Fiber Structure. Rev. Sci. Instrum. 2015, 86, 013108. [Google Scholar] [CrossRef]
- Ogawa, S.; Koga, M.; Osanai, S. Anomalous ice nucleation behavior in aqueous polyvinyl alcohol solutions. Chem. Phys. Lett. 2009, 48, 86–89. [Google Scholar] [CrossRef][Green Version]
- Zhu, X.; Schulzgen, A.; Li, H.; Li, L.; Han, L.; Moloney, J.V.; Peyghambarian, N. Detailed investigation of self-imaging in largecore multimode optical fibers for application in fiber lasers and amplifiers. Opt. Express 2008, 16, 16632–16645. [Google Scholar] [CrossRef]
- Mohammed, W.S.; Smith, P.W.E.; Gu, X. All-fiber multimode interference bandpass filter. Opt. Lett. 2006, 31, 2547–2549. [Google Scholar] [CrossRef] [PubMed]
- Jiang, Y. Fourier Transform White-Light Interferometry for the Measurement of Fiber-Optic Extrinsic Fabry–Pérot Interferometric Sensors. IEEE Photon. Technol. Lett. 2008, 30, 75–77. [Google Scholar] [CrossRef]
- Yang, B.; Yang, B.; Zhang, J.; Yin, Y.; Niu, Y.; Ding, M. A sensing peak identification Method for fiber extrinsic Fabry–Perot interferometric refractive index sensing. Sensors 2019, 19, 96. [Google Scholar] [CrossRef] [PubMed]
Disclaimer/Publisher’s Note: The statements, opinions and data contained in all publications are solely those of the individual author(s) and contributor(s) and not of MDPI and/or the editor(s). MDPI and/or the editor(s) disclaim responsibility for any injury to people or property resulting from any ideas, methods, instructions or products referred to in the content. |
© 2025 by the authors. Licensee MDPI, Basel, Switzerland. This article is an open access article distributed under the terms and conditions of the Creative Commons Attribution (CC BY) license (https://creativecommons.org/licenses/by/4.0/).