Article

Upconversion and Color Tunability in Er3+–Tm3+–Yb3+ Tri-Doped Fluorophosphate Glasses

by
Fernando Rivera-López
1,*,
Palamandala Babu
2,
Vemula Venkatramu
3 and
Víctor Lavín
4
1
Departamento de Ingeniería Industrial, Escuela Superior de Ingeniería y Tecnología, Universidad de La Laguna, Apdo. 456, E-38200 San Cristóbal de La Laguna, Santa Cruz de Tenerife, Spain
2
Department of Physics, NTR Government Degree College, Vayalpad 517 299, India
3
Department of Physics, Yogi Vemana University, Kadapa 516 005, India
4
Departamento de Física, IUdEA, and MALTA Consolider Team, Universidad de La Laguna, Apdo. 456, E-38200 San Cristóbal de La Laguna, Santa Cruz de Tenerife, Spain
*
Author to whom correspondence should be addressed.
Photonics 2025, 12(8), 745; https://doi.org/10.3390/photonics12080745
Submission received: 5 June 2025 / Revised: 16 July 2025 / Accepted: 22 July 2025 / Published: 24 July 2025

Abstract

A series of Er3+–Tm3+–Yb3+ tri-doped fluorophosphate glasses with different molar compositions were synthesized using the conventional melt-quenching technique, and their optical properties were measured and analyzed. Under laser excitation at 980 nm, blue, green and red upconverted emissions were observed at around 475, 545 and 660 nm, respectively. Based on the results and the energy level diagrams, energy transfer processes were proposed to explain the population mechanisms of the emitting levels. A final characterization was developed within the framework of the CIE 1931 chromaticity coordinate diagram. Varying the doping concentrations of the optically active rare-earth ions, as well as the laser pumping power, enabled modulation of the three primary colors, resulting in blue, green and relatively close to white light emissions. This tunability of the upconverted emissions highlights the potential of these fluorophosphate glasses as tunable optical devices, laser systems and visual show effects.

1. Introduction

During the last few years, the study of materials doped with optically active trivalent rare-earth (RE3+) ions has attracted much interest due to their potential in photonic applications, such as solid-state lasers [1,2], color displays [3,4,5] or optical amplifiers [6]. One of the features of RE3+ ions is their ability to convert near-infrared (NIR) energy into visible light, a process known as upconversion [7,8,9,10,11,12]. Among all RE3+ dopants, trivalent Erbium (Er3+) is a very interesting ion that can be excited with commercial low-cost diode lasers at around 800, 860 and 980 nm. Its intermediate low-energy metastable levels, with long lifetimes, allow green and red upconverted emissions to be obtained at around 550 and 650 nm, respectively. Another interesting ion is trivalent Thulium (Tm3+), with a very intense blue emission at around 475 nm. For both optically active ions, upconverted emissions can be enhanced by the addition of the trivalent Ytterbium (Yb3+) ion, which acts as an efficient sensitizer for the upconversion mechanisms [13]. Regarding the state of the art, it is worth highlighting the studies on Er3+–Tm3+–Yb3+ tri-doped samples, such as those performed on oxides [14,15,16,17,18], phosphates [19,20], fluorides [21,22,23] and fluorophosphates [24]. In these systems, the right combination of blue, green and red emissions, originating from Er3+ and Tm3+ ions, can be modulated through the relative concentrations of the ions or the pump power excitation, which is of particular interest for optical technologies.
Fluorophosphate glasses doped with RE3+ ions, such as Er3+, Tm3+ and Yb3+, offer significant advantages over conventional phosphate or metaphosphate glasses, as well as over oxide and fluoride glasses for optical and photonic applications. First, the fluorophosphate matrix combines the favorable structural and chemical properties of phosphate glasses with the low vibrational energy characteristic of fluoride bonds [25], lower than those of oxides, resulting in reduced absorption losses due to non-radiative relaxation processes. This enables higher light emission efficiency and better protection of the excited states of the dopant ions, which is crucial for the efficiency of processes such as upconversion [24]. In contrast, phosphate and metaphosphate glasses exhibit a higher density of high-energy vibrational states due to P–O–P bonds [1], which decreases the emission efficiency of the RE3+ ions. Therefore, fluorophosphate glasses doped with these ions stand out as superior materials for the development of advanced optical devices, such as fiber amplifiers, lasers and white lighting, where material efficiency and stability are paramount. These reasons constitute the rationale for choosing fluorophosphate over other hosts, along with the scarcity of reports on upconversion luminescence color tunability in Er3+, Tm3+ and Yb3+ tri-doped fluorophosphate glasses.
Among the various possible combinations to obtain a fluorophosphates glass, the following combination was selected for synthesis: P2O5, 17 K2O, (11-x/2-y/2) BaO, 9 Al2O3, 6 BaF2, 2 Yb2O3, x Er2O3 and y Tm2O3. P2O5 based glasses have the advantages of high transparency [26], a low melting temperature [21,27] and good thermal stability and chemical durability [28]. Another advantage of phosphate glasses is that they can be easily fabricated into different shapes and sizes. As for the possible components, the incorporation of potassium oxide (K2O) reduces the melting temperature, barium oxide (BaO) enhances the mechanical properties, which is very important for fiber production [29], and the addition of aluminum trioxide (Al2O3) increases chemical stability [30]. However, a disadvantage when phosphate glasses are employed as a laser host is that they have large thermal expansion and their phonon energies are relatively high. The addition of barium fluoride (BaF2) leads to a decrease in the OH free group [31], thus reducing the phonon energy and, consequently, the non-radiative de-excitation processes involving optically active ions.
In this work, fluorophosphate glasses with a fixed Yb2O3 concentration and different concentrations of Er2O3 and Tm2O3 were synthesized. The upconverted luminescence of these glasses were studied in detail under 980 nm laser excitation. According to the Commission Internationale de I’Eclairage (CIE) 1931 chromaticity diagram, the upconverted emissions were characterized in order to study the potential interest of this fluorophosphate glass for photonic applications.

2. Materials and Methods

Glasses with chemical compositions (in mol%) of (55-x/2-y/2) P2O5, 17 K2O, (11-x/2-y/2) BaO, 9 Al2O3, 6 BaF2, 2 Yb2O3, x Er2O3 and y Tm2O3 (where x and y ranges from 0.01 to 1) were prepared by the well-known melt-quenching technique at room temperature. The precursor oxides and fluoride were well grounded in an agate mortar with a pestle. The batch composition taken in a platinum crucible was placed in a furnace and melted at a temperature range of 1323–1373 K (1050–1100 °C) for 1 h, poured onto a preheated brass plate and finally annealed at 623 K (350 °C) for 10 h in order to remove the thermal strains. The samples were then carefully polished with silicon carbide abrasive paper and a polishing film for optical measurements. All samples showed a very homogeneous structure and transparency. The composition and labels of the samples are given in Table 1.
X-ray Diffraction (XRD) analyses were carried out in a PANalytical Empyrean diffractometer using a Cu anode CuKα1,2 radiation (λKα1 = 1.5406 Å and λKα2 = 1.5444 Å). The measurements were recorded at 0.02626° intervals throughout the 5–80 2θ range. To acquire Scanning Electron Microscopy (SEM) and Energy-Dispersive X-ray Spectroscopy (EDS) images, a ZEISS EVO 15 electron microscope, with an acceleration of 15 kV, was used. The sample surface was coated with a thin layer of carbon.
Absorption spectra were measured using a spectrophotometer (Cary5000). Upconverted luminescence spectra were measured by excitation with a commercial continuous-wave (cw) diode laser at 980 nm (CNI Laser, model MDL-III-80-2W). The RE3+ ion emissions were focused onto a 0.18 m focal length single-grating monochromator (Jobin Yvon Triax 180), with a resolution of 0.5 nm, and were then detected with a photomultiplier tube (Hamamatsu R-928). All measurements were made at room temperature and were corrected for the spectral response of the equipment.

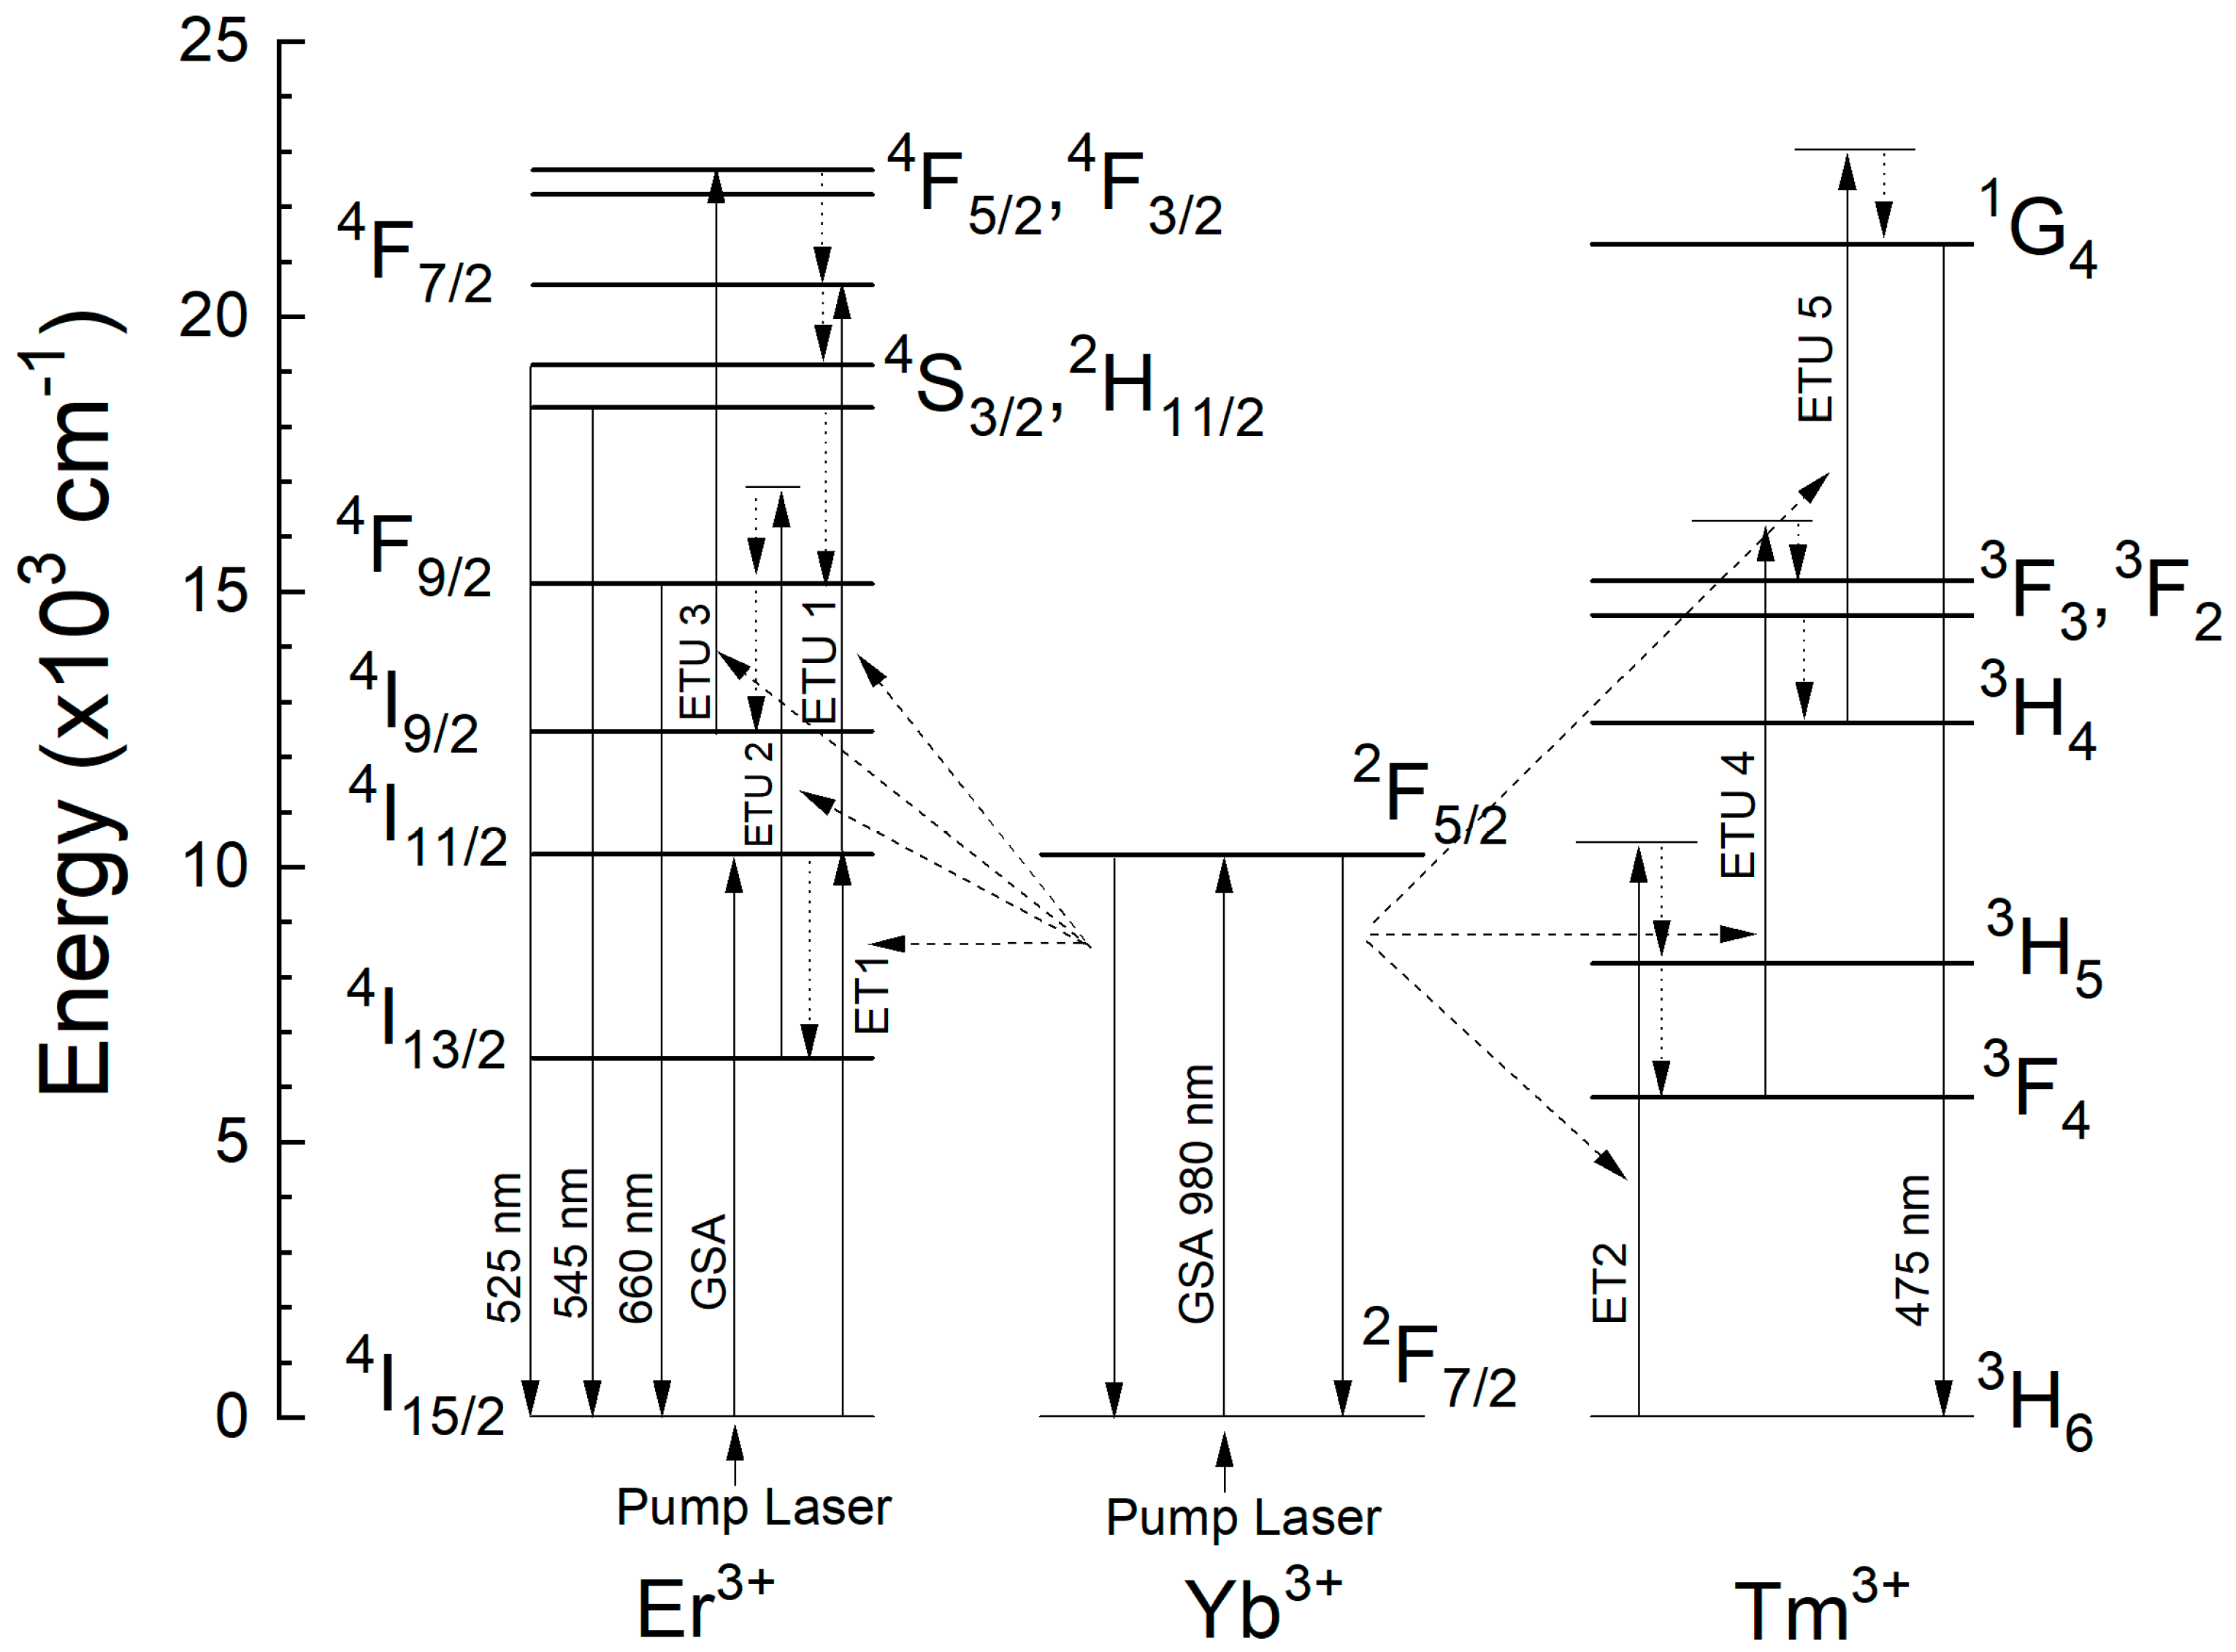
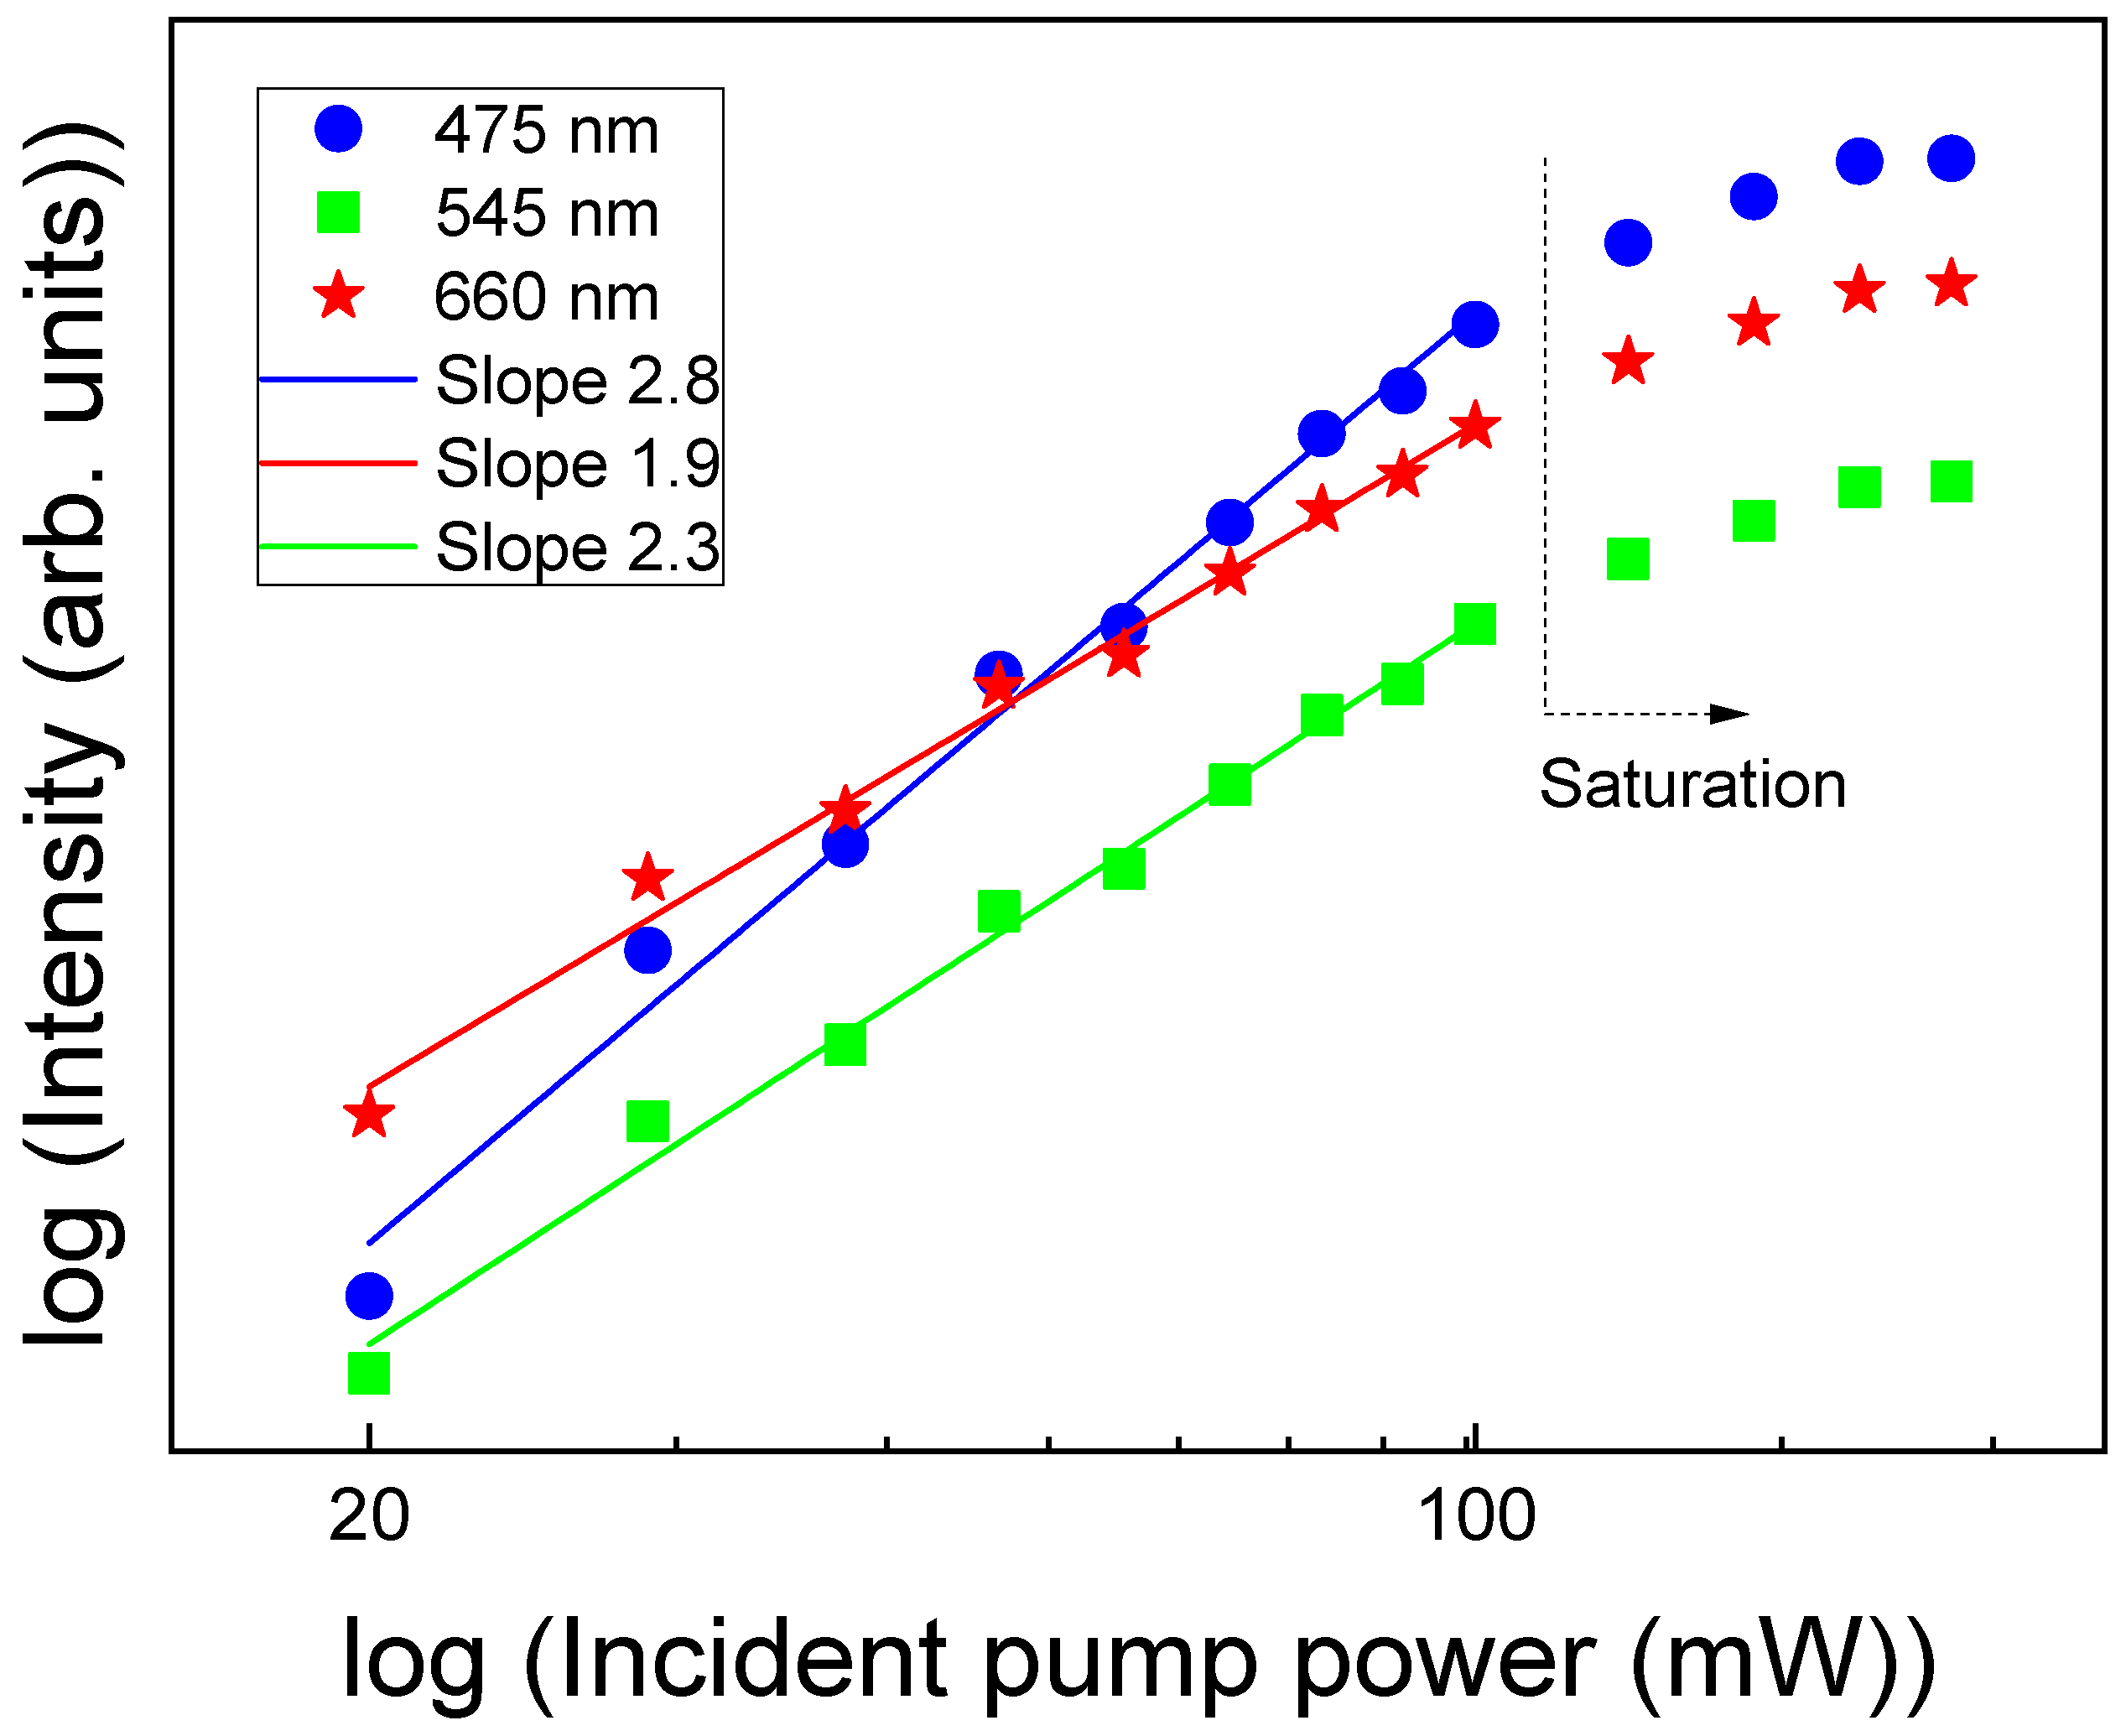
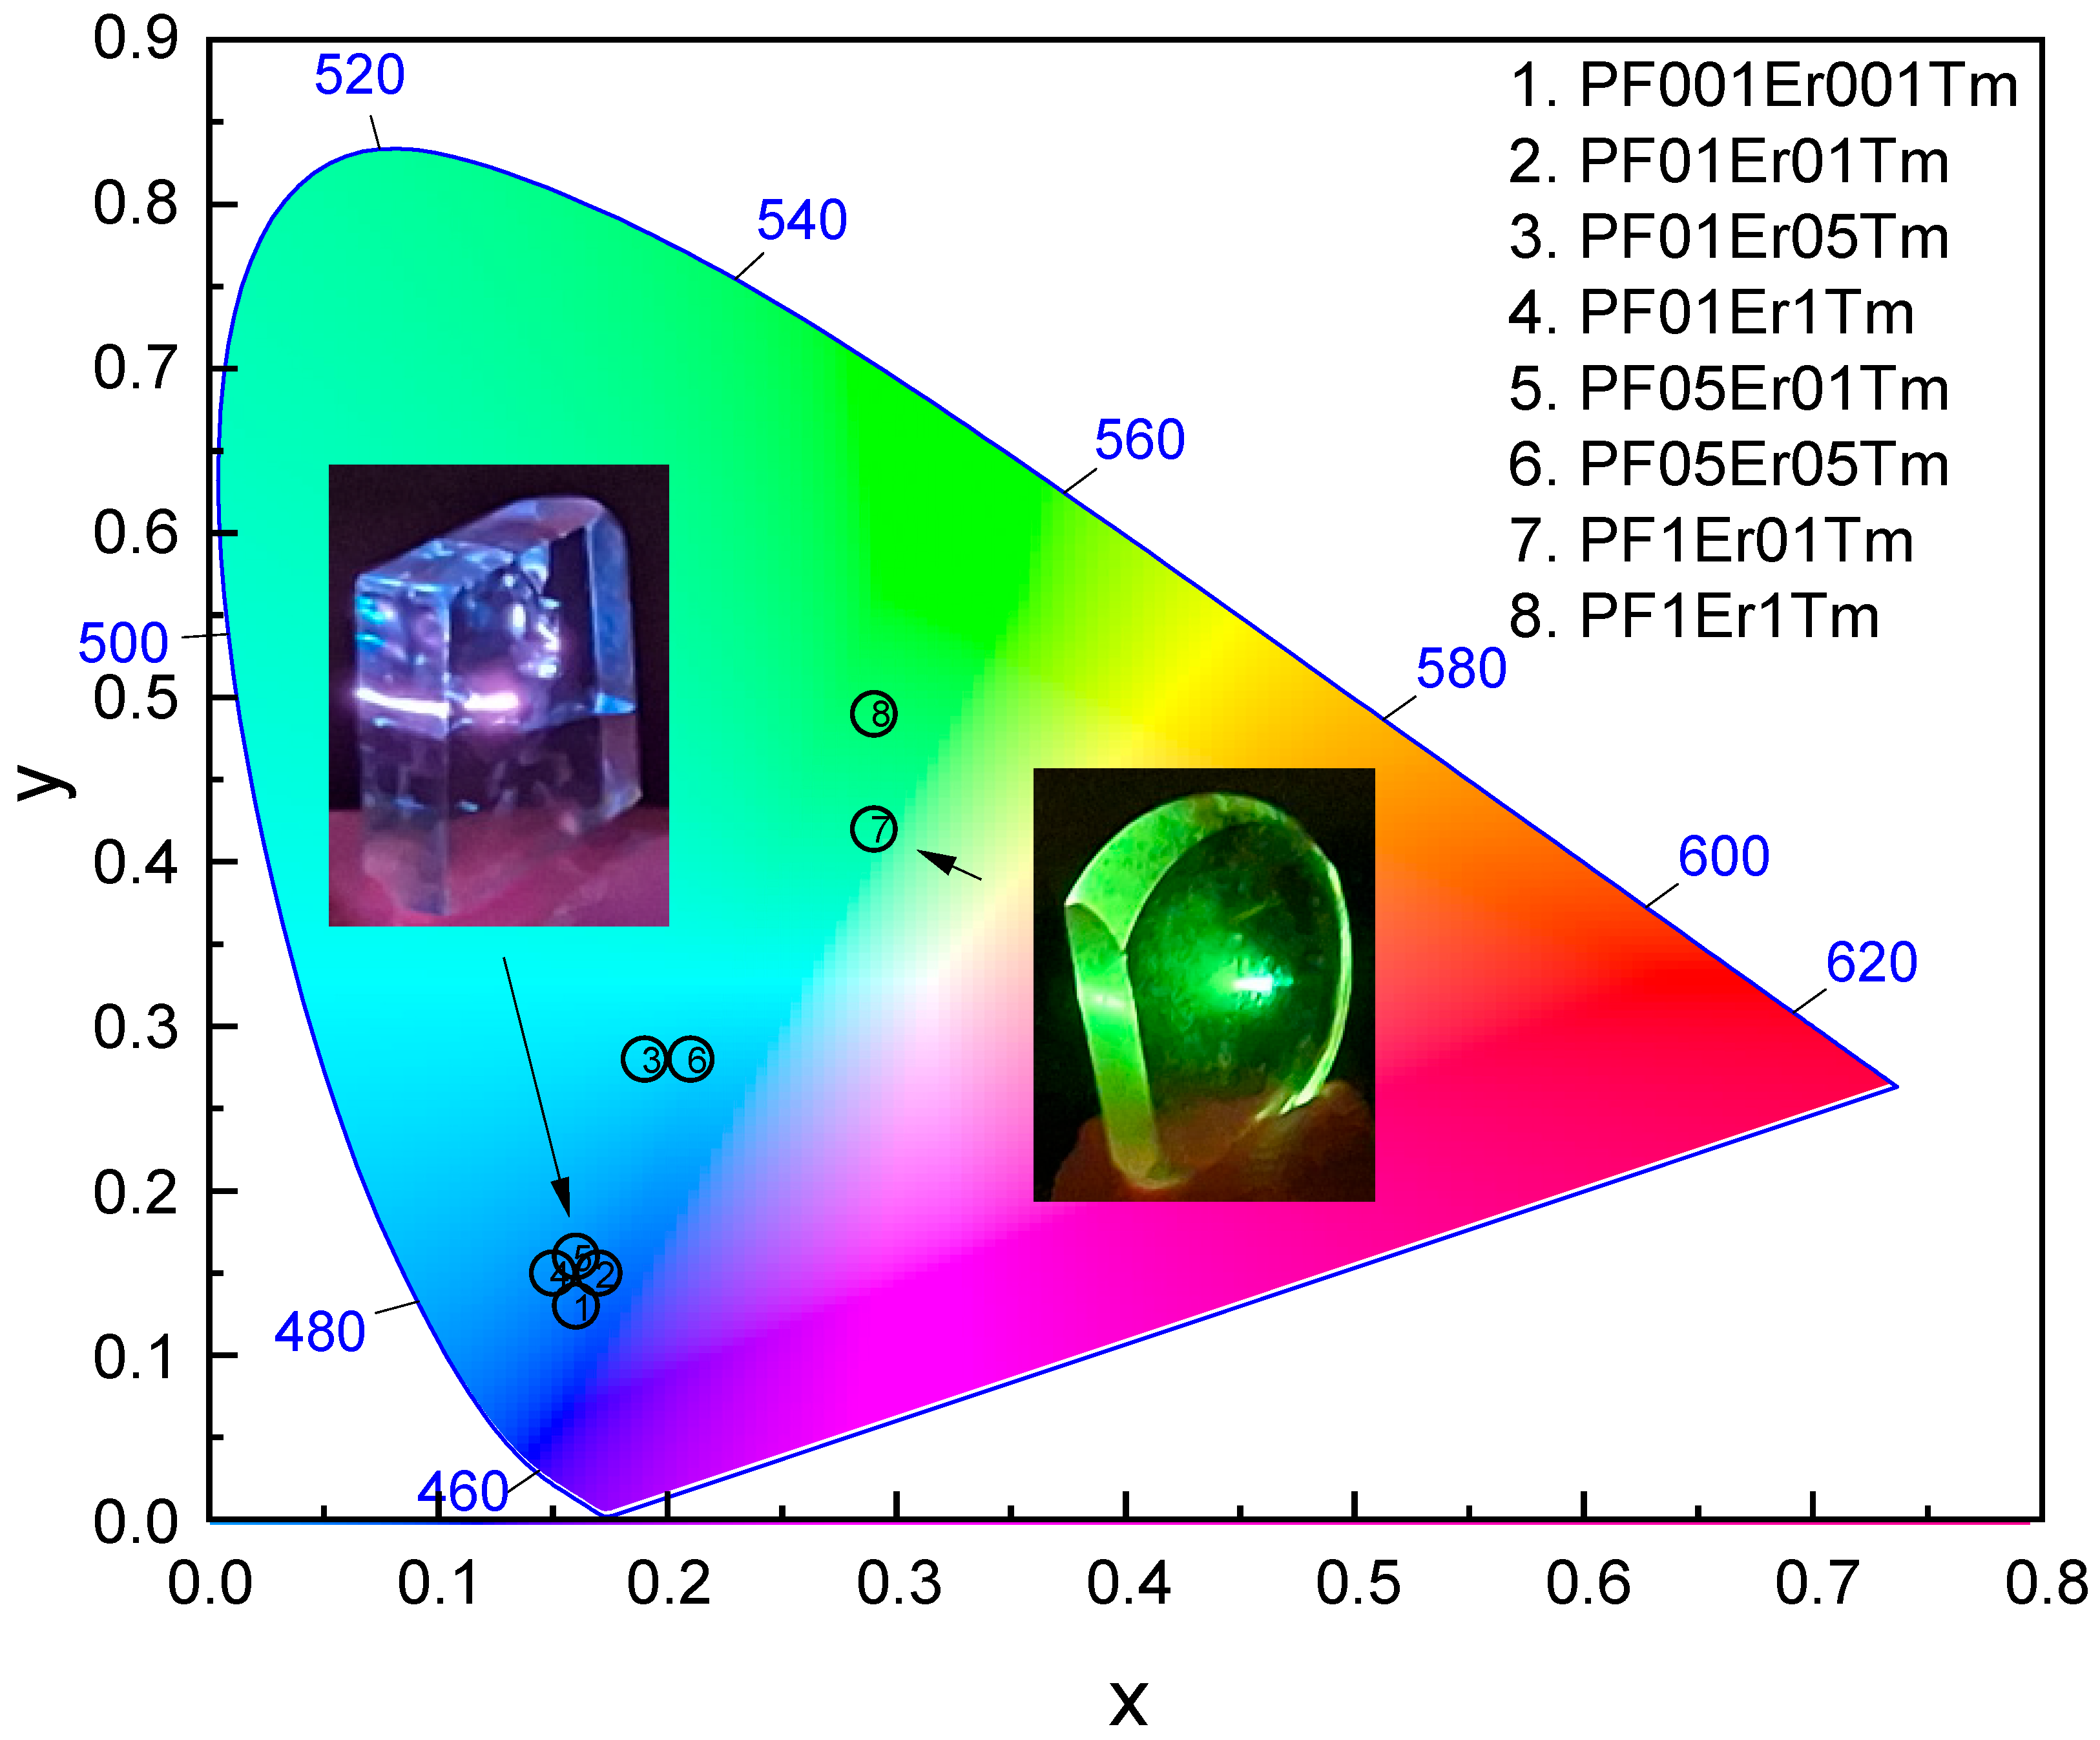
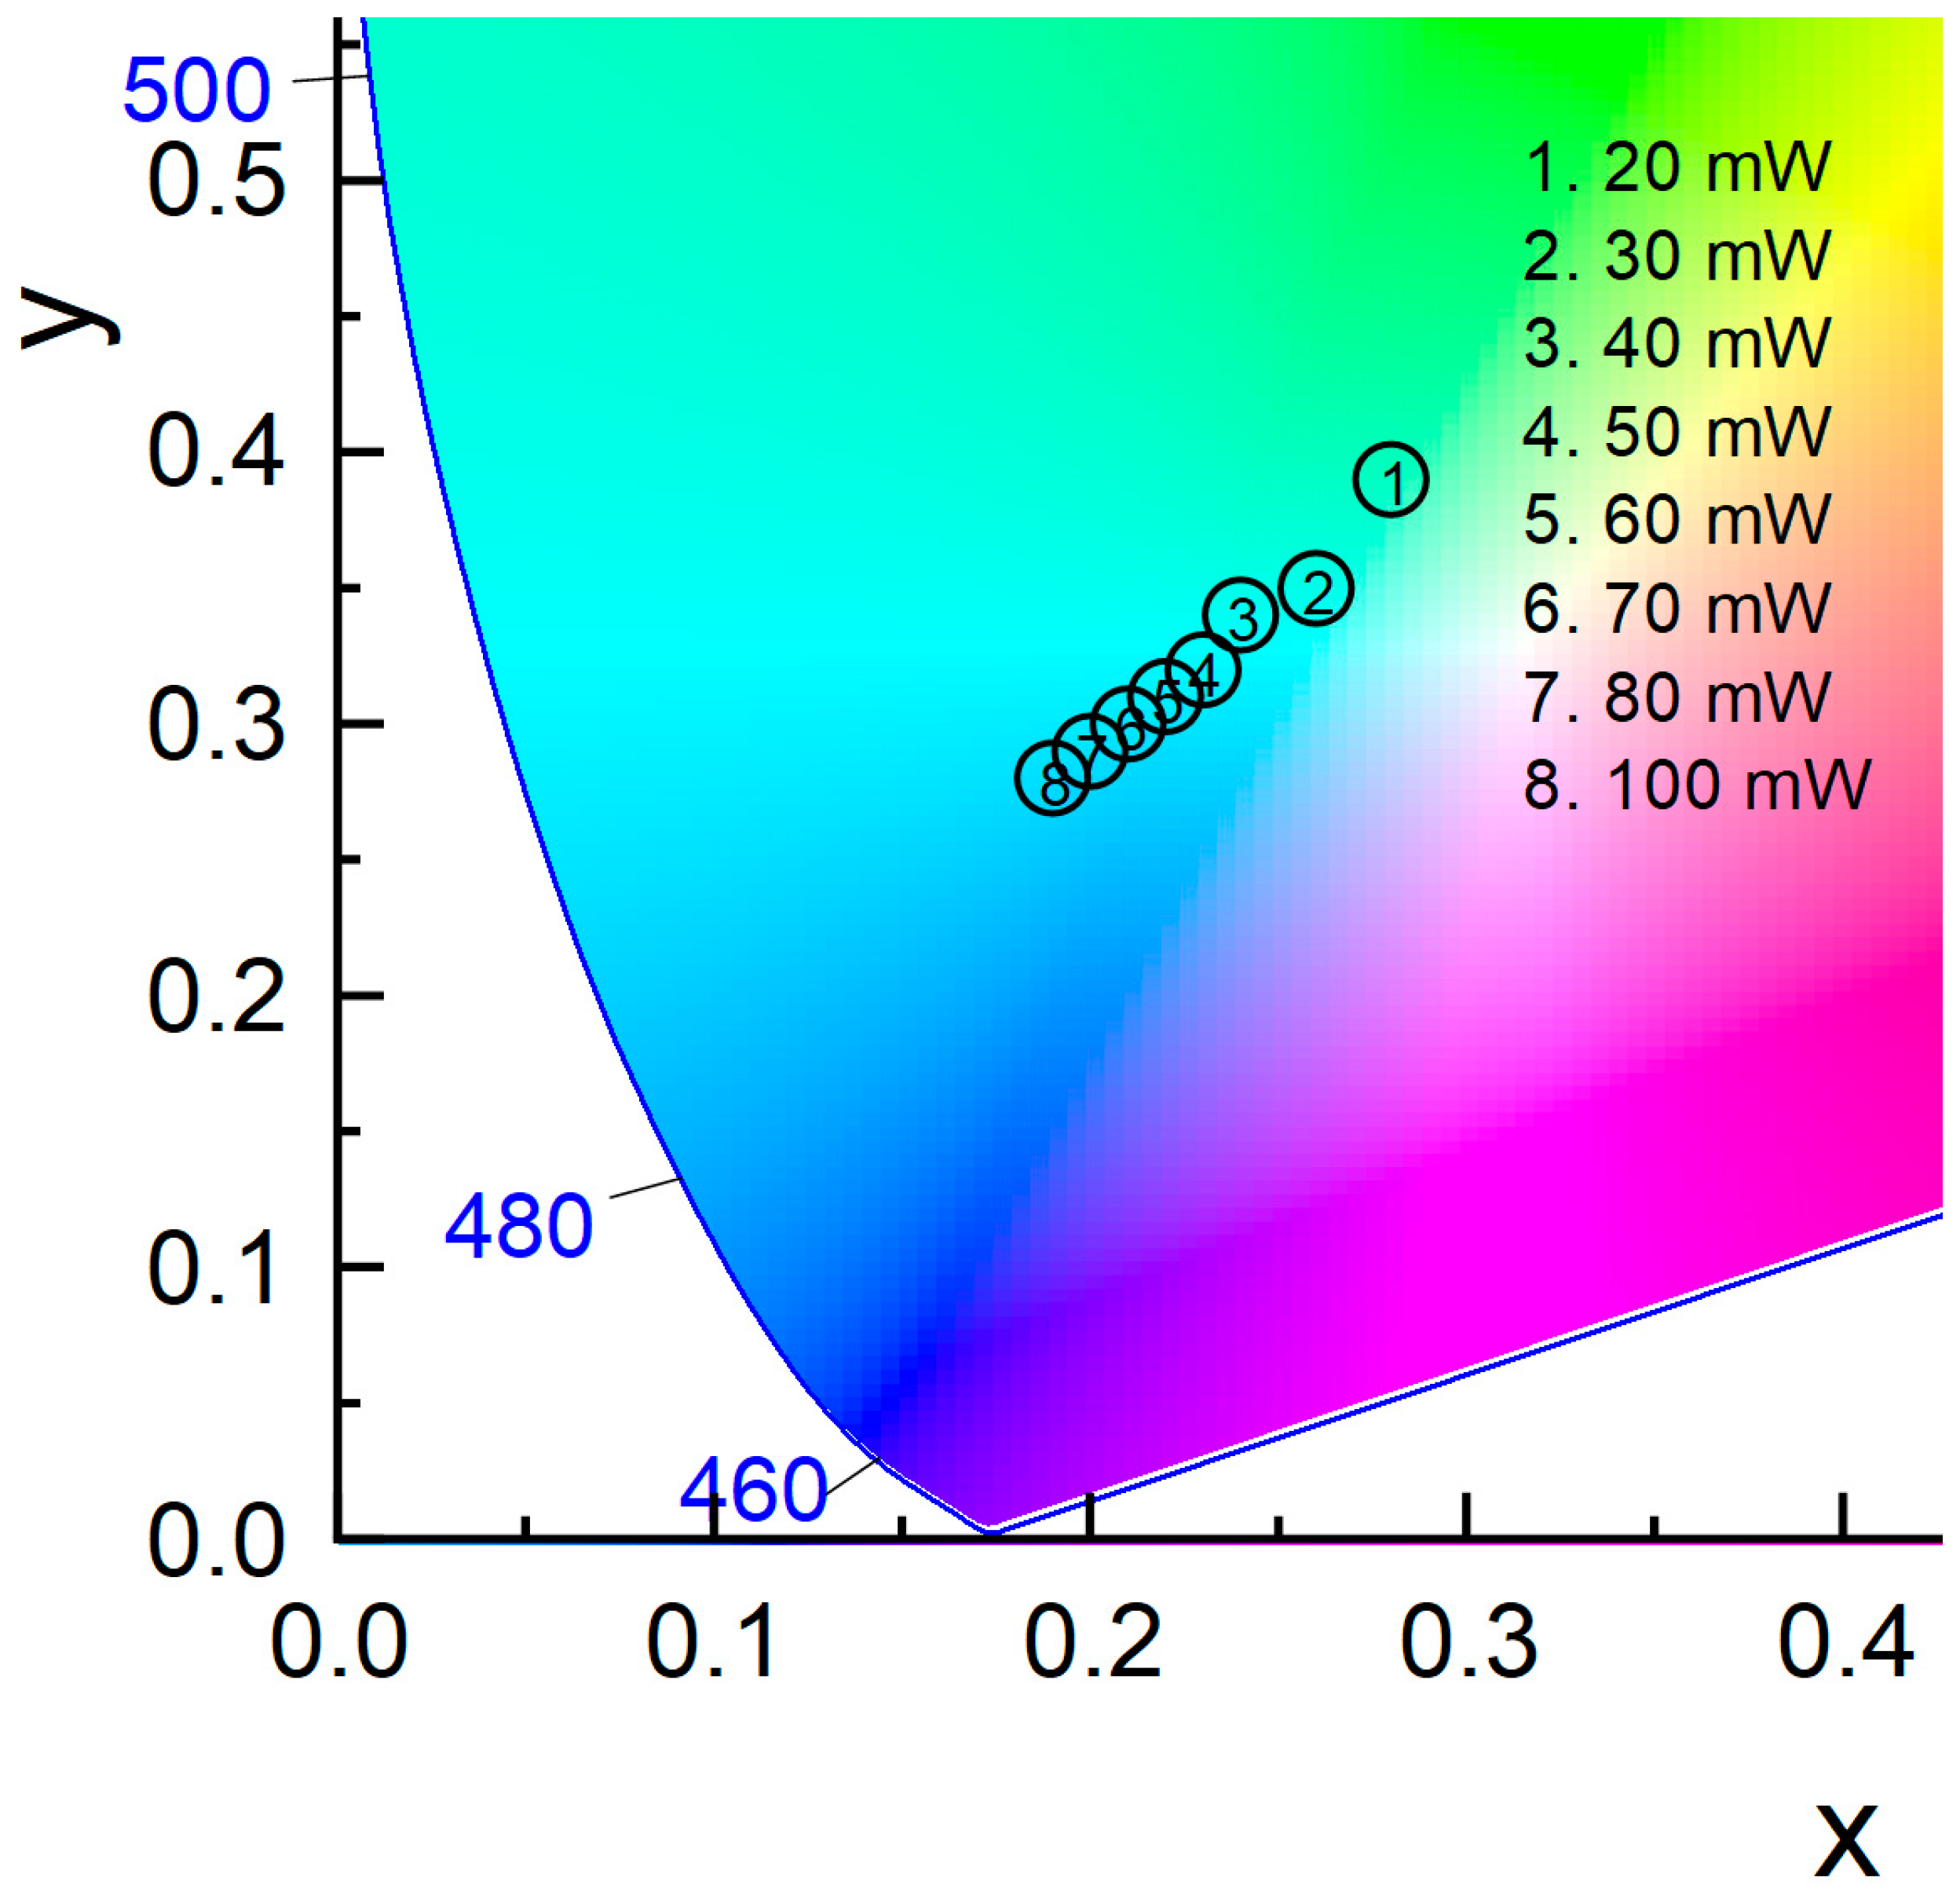
3. Results and Discussion

XRD analyses were performed to investigate the internal structure. As can be observed in Figure 1, the resulting diffractogram exhibits a broad halo centered at around 27 2θ (°), which is characteristic of an amorphous structure. Non-crystalline materials display diffuse X-ray scattering due to their disordered structure and the absence of long-range translational symmetry. The absence of sharp Bragg peaks confirms the lack of a long-range atomic order, supporting the vitreous nature of these fluorophosphate samples.
Complementary to XRD, a morphological analysis was carried out using SEM and EDS mapping. As can be seen in Figure 2, SEM and EDS images reveal a homogeneous and uniform morphology, with no evidence of phase separation, porosity, clusters or crystallite formation. Furthermore, elemental mapping confirms an even distribution of the constituent elements across the samples, consistent with a well-mixed glassy matrix. These results further support the structural uniformity and amorphous nature of the glass. The homogeneous dispersion of RE3+ ions in the glass matrix prevents concentration quenching and promotes efficient energy transfer processes. Moreover, this finding is particularly significant, as it allows the excitation of the samples regardless of the specific region being excited, ensuring that the luminescence response remains independent of the excitation area.
The intraconfigurational transitions observed in the absorption spectrum of the fluorophosphate glass doped with 2 mol% of Yb2O3, 1 mol% of Er2O3 and 1 mol% of Tm2O3 (PF1Er1Tm sample) are presented in Figure 3. The transitions start from the 4I15/2 ground state to the multiplets of the Er3+ ion (labeled in green), and from the 3H6 ground state to the multiplets of the Tm3+ ion (labeled in blue). In addition, the only intraconfigurational f-f absorption band for the Yb3+ ion is the 2F7/22F5/2 transition at the beginning of the NIR range, with a maximum at 975 nm (labeled in red).
The upconverted luminescence spectra from 300 to 700 nm were obtained after exciting the tri-doped samples with a cw 980 nm diode laser, in resonance with the 2F7/22F5/2 absorption transition of the Yb3+ ions and the 4I15/24I11/2 transition of the Er3+ ions. The obtained results for all the samples are shown in Figure 4, in which three clear upconverted emission bands in the blue, green and red ranges are observed. The blue band, centered at around 475 nm, can be attributed to the 1G43H6 transition of the Tm3+ ions, whereas the green emission is composed of two thermalized bands of Er3+, related to the hypersensitive 2H11/24I15/2 transition at 525 nm and the 4S3/24I15/2 transition at 545 nm. Finally, the red emission, centered at 660 nm, is associated with the 4F9/24I15/2 transition of the Er3+ ions. All relevant electronic f-f transitions of these RE3+ ions and their partial energy level diagrams are shown in Figure 5. As can be seen in Figure 4, when the Er3+ concentration increases, green and red emissions also increase, whereas the blue emission is favored when the Tm3+ ion concentration increases. In the case of the PF1Er01Tm sample, a green emission in the vicinity of white light was observed by the naked eye.
With the aim of investigating the mechanisms involved in the population of the emitting levels, the upconverted emission intensities were measured as a function of the laser pumping power. The emission intensity, Iem, is proportional to the n-th power of the incident laser pump power, Ppump, according to the following expression [32]:
I e m = P p u m p n
where n represents the number of photons absorbed per upconverted photon emitted. Figure 6 shows a double logarithmic plot of the integrated emission intensities of the blue, green and red upconverted emissions as a function of the incident laser pump power.
Linear least squares fitting of the experimental results to Equation (1) were calculated up to 100 mW. Powers higher than 100 mW were not considered because saturation occurs, and the proportionality of Equation (1) is valid only for unsaturated upconverted emissions. Based on these fits, slopes of 2.8, 2.3 and 1.9 were obtained for the blue, green and red upconverted emissions, respectively, indicating that three photons are required for blue emission, whereas two photons are required for red emission [33]. The slope of 2.3 for the green emission could be attributed to the involvement of three photons, which is different from the usual two photons reported by other authors, such as Pavitra et al., Shi et al. and Chen et al. [34,35,36], but is consistent with the findings reported by Bai et al., Li et al. and Hassairi et al. [37,38,39].
The change in slopes may be attributed to the saturation of the excited states of the Er3+ and Tm3+ ions, resulting from efficient energy transfer from the Yb3+ ions. Furthermore, as shown in Figure 6, saturation occurs at approximately the same excitation power for all three emissions, suggesting that it could be associated with the saturation of Yb3+ ion absorption. These phenomena result in a decrease in energy transfer upconversion (ETU) luminescence. Moreover, the increase in laser power raises the temperature, which may promote non-radiative processes, resulting in a loss of useful energy and contributing to saturation. It should be noted that in our experiments, the samples were subjected to continuous laser excitation of up to 300 mW over an extended period of 1 h. During this time, we carefully monitored the samples and their emission intensities, and no photobleaching or degradation was observed. The emissions remained stable throughout the irradiation period, indicating that these glasses maintain their luminescent properties under conditions relevant to their practical use.
According to these results, a possible population scheme was proposed in the simplified energy level diagram in Figure 5. First, the green and red upconverted emissions from the Er3+ ions were analyzed. Since the absorption cross-section of the Yb3+ ion at 980 nm is larger than that of the Er3+ ion, together with the fact that the concentration of Yb3+ ions is significantly higher, the Er3+ ions can be considered to be initially populated by energy transfer from neighboring Yb3+ ions, rather than through a ground state absorption (GSA) process. This first energy transfer process, denoted as ET1, involves a cross-relaxation mechanism with a Yb3+ ion at the excited 2F5/2 level and an Er3+ ion at the 4I15/2 ground state. The Yb3+ ion de-excitates to the ground state, transferring the transition energy to the Er3+ ion, which reaches the 4I11/2 metastable level according to the (2F5/2,4I15/2)→(2F7/2,4I11/2) scheme. In the following steps, the thermally coupled green emitting (2H11/2,4S3/2) levels can be populated via ETU and excited state absorption (ESA). For the samples co-doped with Yb3+ ions, ETU mechanisms can be considered predominant with respect to ESA [40]. For a two photon process, ETU1 is considered, where the 4F7/2 state of the Er3+ ions is populated after an energy transfer form Yb3+ ions, following the (2F5/2,4I11/2)→(2F7/2,4F7/2) cross-relaxation scheme. Subsequent non-radiative relaxation from the 4F7/2 level feeds the 4S3/2, 2H11/2 and 4F9/2 emitting levels. However, a three photon process must be taken into account based on the dependence of the green emission on the laser pumping power. In this case, after populating the 4I11/2 level, via ET1, a non-radiative relaxation feeds the 4I13/2 level. From this state, the ETU2 process takes place following the (2F5/2,4I13/2)→(2F7/2,4F9/2) cross-relaxation scheme, from which non-radiative de-excitation populates the 4I9/2 level. The third photon is absorbed from the 4I9/2 level, where the ETU3 process takes place, feeding the 4F5/2 level according to the (2F5/2,4I9/2)→(2F7/2,4F5/2) scheme. Finally, the subsequent non-radiative de-excitations populate the thermally-coupled green-emitting (2H11/2,4S3/2) levels.
For the blue emission, the population of Tm3+ ions occurs via energy transfer because there are no Stark levels in resonance with the laser excitation at 980 nm. The process for populating the 1G4 emitting level can be described as a phonon-assisted energy transfer mechanism involving three laser photons. After cw laser excitation at 980 nm, the Yb3+ ions are promoted to the 2F5/2 level, from which a non-resonant energy transfer to a neighboring Tm3+ ion, denoted as ET2, populates the 3H5 level following the (2F5/2,3H6)→(2F7/2,3H5) scheme. From the 3H5 level, non-radiative relaxation feeds the lower 3F4 level, and then a second non-resonant energy transfer, labeled as ETU4, takes place according to the (2F5/2,3F4)→(2F7/2,3F3) cross-relaxation scheme. Subsequent multi-phonon de-excitation from the 3F3 and 3F2 levels populates the 3H4 level, from which a third non-resonant energy transfer, labeled as ETU5 and associated with the (2F5/2,3H4)→(2F7/2,1G4) mechanism, populates the 1G4 level from which blue emission is produced after radiative de-excitation to the ground state.
It is worth noting that increasing concentrations of Tm3+ and Er3+ ions also lead to an increase in the energy transfer probabilities from the emitting levels, which means a decrease in the efficiency of the upconverted emissions. There are several cross-relaxation energy transfer channels between Tm3+ ions involving the blue emitting level, as well as between Er3+ ions involving the green and red emitting levels, which are fully described in the literature [41,42]. In addition, there are inter-ion resonant, or quasi-resonant, cross-relaxation channel energy transfer mechanisms between the different doped ions that also contribute to increases in this non-radiative de-excitation, such as:
Tm3+-Er3+ CR1: (1G4,4I15/2)→(3H6,4F7/2)
Tm3+-Er3+ CR2: (1G4,4I15/2)→(3F4,4F9/2)
Tm3+-Er3+ CR3: (1G4,4I15/2)→(3H5,4I9/2)
Er3+-Tm3+ CR4: (4S3/2,3H6)→(4I11/2,3H5)
Er3+-Tm3+ CR5: (4S3/2,3H6)→(4I9/2,3F4)
Er3+-Tm3+ CR6: (4F9/2,3H6)→(4I13/2,3H5)
Er3+-Tm3+ CR7: (4F9/2,3H6)→(3H6,3F3)
which force a compromise between the concentration levels and the maximum upconterved emission of photons in the blue, green and red ranges of visible light.
Within the framework of the CIE 1931, the XY chromaticity coordinate graph for the study of the color purity of the glass sample emissions was plotted (Figure 7). The CIE 1931 plot comprises a triangle where the position in the diagram is known the chromaticity point. The chromatic coordinates (x, y), presented in Table 2, were evaluated using the following expressions:
x = X X + Y + Z . y = Y X + Y + Z . z = Z X + Y + Z
X = I ( λ ) x d λ
Y = I ( λ ) y d λ
Z = I ( λ ) z d λ
where X, Y and Z represent the tristimulus values; λ corresponds to the wavelength; ( x , y , z ) are the three color-matching functions; and I(λ) represents the emission spectra of the samples. Table 2 presents the (x, y) chromaticity coordinates for the samples under laser excitation at 980 nm and with a laser pumping power of 100 mW.
As can be observed in Figure 7, at 100 mW laser power excitation, the PF1Er1Tm and PF1Er01Tm samples fall close to the green region. The samples PF001Er001Tm, PF01Er01Tm, PF01Er1Tm and PF05Er01Tm fall in the blue region, whereas PF05Er05Tm and PF01Er05Tm are relatively close to the white region. This behavior depends on the balance of blue, green and red emissions, which is influenced by the Er3+ and Tm3+ concentrations.
In order to study the color tunability, the upconverted emissions were recorded under varying levels of laser pumping power. Figure 8 represents the CIE 1931 chromaticity diagram as a function of the laser pumping power for sample PF01Er05Tm. Table 3 shows, for this sample, the dependence of the chromaticity coordinates (x, y) on the excitation power, ranging from 20 to 200 mW.
From Figure 8, as the pumping power increases, the x and y values decrease, whereas the z value increases. The chromaticity coordinates (x, y) change from (0.28, 0.39) at 20 mW to (0.19, 0.28) at 100 mW. At a laser power above 100 mW, no changes are observed as a consequence of the saturation effect. Figure 8 shows that increasing the excitation power shifts the chromaticity coordinates towards the blue region in the color diagram. This is due to the increase in blue emission as the pumping power increases, in good agreement with observations by Pavitra et al. [34] in SrY2O4 nanocrystalline phosphors. As can be seen, the obtained values cover a wide region, indicating that light can be modulated by adjusting the pumping power.
Continuing the comparison with other results reported in the literature, these glasses, with a lower power range than other studies, such as Ca9Y(PO4)7 phosphor [19], cover a wider region of the chromaticity diagram than NaNbO3 nanocrystals [16] and SrY2O4 nanocrystalline phosphors [34]. By varying the concentrations of optically active ions, broad emission tuning is achieved, spanning from the green to the blue region. This range is comparable to that reported by Liang et al. for fluorosilicate glasses [43], with the difference that their samples exhibited emissions from the blue region up to the upper blue region. The results obtained in our study are comparable to those reported in the literature. Although we were unable to generate pure white light from our samples, improved color tunability was achieved by varying both the concentration of the active ions and the excitation pump power.

4. Conclusions

Er3+–Tm3+–Yb3+ tri-doped phosphate glasses, with different RE3+ concentrations, were synthesized using a conventional melt-quenching technique. Under cw laser excitation at 980 nm, intense blue, green and red upconverted emissions were observed. The intensities of these emissions depend on the concentrations of the optically active ions. For these samples, the combination of primary colors produced blue and green light, and in some cases, light in the vicinity of white, as observed in the CIE 1931 chromaticity diagram. In addition, varying the laser pumping power enables modulation of the light. In view of these results, Er3+–Tm3+–Yb3+ tri-doped fluorophosphate glasses can be considered materials with great potential for application in various optical technologies, such as color displays, upconversion lasers, tunable lasers and show effects.

Author Contributions

Conceptualization, F.R.-L. and V.L.; methodology, F.R.-L., P.B. and V.V.; formal analysis, F.R.-L. and V.L.; investigation, F.R.-L. and V.L.; writing—original draft preparation, F.R.-L.; writing—review and editing, F.R.-L., P.B., V.V. and V.L.; supervision. F.R.-L. and V.L.; funding acquisition, F.R.-L. and V.L. All authors have read and agreed to the published version of the manuscript.

Funding

This work was partially supported by the Plan Propio de Investigación 2022 of the Universidad de La Laguna through Proyectos Dirigidos por Noveles Investigadores/as (2022/20258) and by the Proyecto ProID2024010034, funded by the Agencia Canaria de Investigación, Innovación y Sociedad de la Información (ACIISI) and by the Fondo Europeo de Desarrollo Regional (FEDER).

Institutional Review Board Statement

Not applicable.

Informed Consent Statement

Not applicable.

Data Availability Statement

The data that support the findings of this study are available on request from the corresponding author.

Acknowledgments

Fernando Rivera-López acknowledges support from the Plan Propio de Investigación 2022 of the Universidad de La Laguna through the Proyectos Dirigidos por Noveles Investigadores/as (2022/20258). Fernando Rivera-López and Victor Lavin are grateful for the financial support of the Project ProID2024010034 by theAgencia Canaria de Investigación, Innovación y Sociedad de la Información (ACIISI) and the Fondo Europeo de Desarrollo Regional (FEDER). Vemula Venkatramu is grateful to RUSA 2.0 for the sanction of Research Project-43, dated 1 June 2024, under component-10: Research, Innovation and Quality Improvement.

Conflicts of Interest

The authors declare no conflicts of interest.

References

  1. Rivera-López, F.; Babu, P.; Basavapoornima, C.; Jayasankar, C.K.; Lavín, V. Efficient Nd3+→Yb3+ energy transfer processes in high phonon energy phosphate glasses for 1.0 μm Yb3+ laser. J. Appl. Phys. 2011, 109, 123514. [Google Scholar] [CrossRef]
  2. Rivera-López, F.; Lavín, V. Upconversion/back-transfer losses and emission dynamics in Nd3+-Yb3+ co-doped phosphate glasses for multiple pump channel laser. J. Non-Cryst. Solids 2018, 489, 84–90. [Google Scholar] [CrossRef]
  3. Pattnaik, S.; Mondal, M.; Mukhopadhyay, L.; Rai, V.K. Trivalent lanthanide doped orthovanadate phosphors for efficient upconversion. Mater. Today Proc. 2019, 46, 6363–6366. [Google Scholar] [CrossRef]
  4. Wu, X.; Zhao, X.; Ren, Q.; Du, L.; Pei, M.; Hai, O. Triple luminescent center energy transfer enables color tuning in Na3Y. Polyhedron 2022, 225, 116047. [Google Scholar] [CrossRef]
  5. Babu, P.; Jang, K.H.; Kim, E.S.; Shi, L.; Seo, H.J.; Rivera-López, F.; Rodríguez-Mendoza, U.R.; Lavín, V.; Vijaya, R.; Jayasankar, C.K.; et al. Spectral investigations on Dy3+-doped transparent oxyfluoride glasses and nanocrystalline glass ceramics. J. Appl. Phys. 2009, 105, 013516. [Google Scholar] [CrossRef]
  6. Rivera-López, F.; Babu, P.; Jyothi, L.; Rodríguez-Mendoza, U.R.; Martín, I.R.; Jayasankar, C.K.; Lavín, V. Er3+–Yb3+ codoped phosphate glasses used for an efficient 1.5μm broadband gain medium. Opt. Mater. 2012, 34, 1235–1240. [Google Scholar] [CrossRef]
  7. Auzel, F. Upconversion and Anti-Stokes Processes with f and d Ions in Solids. Chem. Rev. 2004, 104, 139–173. [Google Scholar] [CrossRef] [PubMed]
  8. Rivera-López, F.; Torres, M.E.; de Cos, G.G. Upconversion and cooperative luminescence in YBO3:Yb3+–Er3+. Mater. Today Commun. 2021, 27, 102434. [Google Scholar] [CrossRef]
  9. Gaponenko, N.V.; Staskov, N.I.; Sudnik, L.V.; Vityaz, P.A.; Luchanok, A.R.; Karnilava, Y.D.; Lashkovskaya, E.I.; Stepikhova, M.V.; Yablonskiy, A.N.; Zhivulko, V.D.; et al. Upconversion Luminescence from Sol-Gel-Derived Erbium- and Ytterbium-Doped BaTiO3 Film Structures and the Target Form. Photonics 2023, 10, 359. [Google Scholar] [CrossRef]
  10. Pominova, D.; Proydakova, V.; Romanishkin, I.; Kuznetsov, S.; Linkov, K.; Tabachkova, N.; Ryabova, A. NaGdF4:Yb, Tm Upconversion Nanoparticles for Bioimaging in Shortwave-Infrared Range: Study of Energy Transfer Processes and Composition Optimization. Photonics 2024, 11, 38. [Google Scholar] [CrossRef]
  11. Sola, D.; Miguel, A.; Arias-Egido, E.; Peña, J.I. Spectroscopy and near-infrared to visible upconversion of Er3+ ions in aluminosilicate glasses manufactured with controlled optical transmission. Appl. Sci. 2021, 11, 1137. [Google Scholar] [CrossRef]
  12. Zi, Y.; Huang, A.; Zhao, H.; Bai, X.; Xu, Z.; Ullah, A.; Liu, Y.; Cun, Y.; Song, Z.; Qiu, J.; et al. Efficient Reversible Upconversion Luminescence Modulation based on Photochromism of Lanthanides-Doped BaMgSiO4 Glass Ceramics Toward Optical Storage Application. Laser Photonics Rev. 2024, 18, 2400882. [Google Scholar] [CrossRef]
  13. Patra, A.; Friend, C.S.; Kapoor, R.; Prasad, P.N. Upconversion in Er3+:ZrO2 Nanocrystals. J. Phys. Chem. B 2002, 106, 1909–1912. [Google Scholar] [CrossRef]
  14. Yang, J.; Zhang, C.; Peng, C.; Li, C.; Wang, L.; Chai, R.; Lin, J. Controllable Red, Green, Green, Blue (RGB) and bright white upconversion luminescence of Lu2O3:Yb3+/Er 3+/Tm3+ nanocrystals through single laser excitation at 980 nm. Chem. A Eur. J. 2009, 15, 4649–4655. [Google Scholar] [CrossRef] [PubMed]
  15. Zheng, K.; Zhang, D.; Zhao, D.; Liu, N.; Shi, F.; Qin, W. Bright white upconversion emission from Yb3+, Er3+, and Tm3+-codoped Gd2O3 nanotubes. Phys. Chem. Chem. Phys. 2010, 12, 7620–7625. [Google Scholar] [CrossRef] [PubMed]
  16. Kumar, U.U.; Vijaya, N.; Oliva, J.; Jacinto, C.; de La Rosa, E.; Jayasankar, C.K. Multicolor upconversion emission and color tunability in Tm3+/Er3+/Yb3+ Tri-Doped NaNbO3 nanocrystals. Mater. Express 2012, 2, 294–302. [Google Scholar] [CrossRef]
  17. Yan, D.; Zhu, J.; Wu, H.; Yang, Z.; Qiu, J.; Song, Z.; Yu, X.; Yang, Y.; Zhou, D.; Yin, Z.; et al. Energy transfer and photoluminescence modification in Yb-Er-Tm triply doped Y2Ti2O7 upconversion inverse opal. J. Mater. Chem. 2012, 22, 18558–18563. [Google Scholar] [CrossRef]
  18. Carmo, F.F.D.; Nascimento, J.P.C.D.; Façanha, M.X.; Sales, T.O.; Santos, W.Q.; Gouveia-Neto, A.S.; Jacinto, C.; Sombra, A.S.B. White light upconversion emission and color tunability in Er3+/Tm3+/Yb3+ tri-doped YNbO4 phosphor. J. Lumin. 2018, 204, 676–684. [Google Scholar] [CrossRef]
  19. Du, S.; Wang, D.; Wang, Y.; Xin, S.; Qiang, Q.; Ma, X. Synthesis and up-conversion luminescence of Yb3+/Er3+/Tm3+ doped Ca9Y(PO4)7. New J. Chem. 2015, 39, 5605–5611. [Google Scholar] [CrossRef]
  20. Hassairi, M.A.; Hernández, A.G.; Dammak, M.; Zambon, D.; Chadeyron, G.; Mahiou, R. Tuning white upconversion emission in GdPO4:Er/Yb/Tm phosphors. J. Lumin. 2018, 203, 707–713. [Google Scholar] [CrossRef]
  21. Li, X.; Xiao, Z.; Luo, M.; Dong, X.; Du, T.; Wang, Y. Low melting glasses in ZnO-Fe2O3-P2O5 system with high chemical durability and thermal stability for sealing or waste immobilization. J. Non-Cryst. Solids 2017, 469, 62–69. [Google Scholar] [CrossRef]
  22. Zhu, S.; Xie, X.; Han, L.; Li, H.; Shi, C.; Yang, Y.; Sun, J. Co-doped NaYF4:Yb/Er/Tm upconversion luminescent coating to enhance the efficiency of photovoltaic cells. Phys. Chem. Chem. Phys. 2024, 26, 17882–17891. [Google Scholar] [CrossRef] [PubMed]
  23. Li, J.; Wang, Y.; Zhang, X.; Li, L.; Hao, H. Up-converting luminescence and temperature sensing of Er3+/Tm3+/Yb3+ co-doped NaYF4 phosphors operating in visible and the first biological window range. Nanomaterials 2021, 11, 2660. [Google Scholar] [CrossRef] [PubMed]
  24. Liao, M.; Hu, L.; Fang, Y.; Zhang, J.; Sun, H.; Xu, S.; Zhang, L. Upconversion properties of Er3+, Yb3+ and Tm3+ codoped fluorophosphate glasses. Spectrochim. Acta–Part A Mol. Biomol. Spectrosc. 2007, 68, 531–535. [Google Scholar] [CrossRef] [PubMed]
  25. Cao, X.; Wang, P.; Wan, R.; Guo, C.; Tian, S. Structural insight of fluorophosphate glasses through F/O ratio: Case study of Raman and NMR spectra. J. Non-Cryst. Solids 2024, 637, 123065. [Google Scholar] [CrossRef]
  26. Kaewjaeng, S.; Chanthima, N.; Thongdang, J.; Reungsri, S.; Kothan, S.; Kaewkhao, J. Synthesis and radiation properties of Li2O-BaO-Bi2O3-P2O5 glasses. Mater. Today Proc. 2018, 43, 2544–2553. [Google Scholar] [CrossRef]
  27. Liu, W.; Pan, Y.T.; Zhang, J.; Zhang, L.; Moya, J.S.; Cabal, B.; Wang, D.Y. Low-melting phosphate glasses as flame-retardant synergists to epoxy: Barrier effects vs flame retardancy. Polym. Degrad. Stab. 2021, 185, 109495. [Google Scholar] [CrossRef]
  28. Shi, X.Z.; Gu, Y.; Liu, T.Y.; Jiang, Z.H.; Li, R.; Zeng, F. Effect of different P2O5/SnF2 ratios on the structure and properties of phosphate glass. J. Non-Cryst. Solids 2022, 578, 121350. [Google Scholar] [CrossRef]
  29. Kityk, I.V.; Wasylak, J.; Kucharski, J.; Dorosz, D. PbO-Bi2O3-Ga2O3 -BaO-Dy3+ glasses for IR luminescence. J. Non-Cryst. Solids 2002, 297, 285–289. [Google Scholar] [CrossRef]
  30. Obaton, A.F.; Labbé, C.; Le Boulanger, P.; Elouadi, B.; Boulon, G. Excited state absorption in Yb3+ -Er3+ -codoped phosphate glasses (ZnO-Al2O3-La2O3-P2O5) around the 4I13/24I15/2 emission spectral range. Spectrochim. Acta Part A Mol. Biomol. Spectrosc. 1999, 55, 263–271. [Google Scholar] [CrossRef]
  31. Lesniak, M.; Mach, G.; Starzyk, B.; Baranowska, A.; Bik, M.; Kochanowicz, M.; Zmojda, J.; Miluski, P.; Sitarz, M.; Dorosz, D. Investigation of the structure in oxyfluoride TeO2–P2O5 based glasses with the various BaF2 content. J. Mol. Struct. 2020, 1217, 128452. [Google Scholar] [CrossRef]
  32. Pollnau, M.; Gamelin, D.; Lüthi, S.; Güdel, H.; Hehlen, M. Power dependence of upconversion luminescence in lanthanide and transition-metal-ion systems. Phys. Rev. B Condens. Matter Mater. Phys. 2000, 61, 3337–3346. [Google Scholar] [CrossRef]
  33. Jacinto, C.; Vermelho, M.V.D.; Gouveia, E.A.; De Araujo, M.T.; Udo, P.T.; Astrath, N.G.C.; Baesso, M.L. Pump-power-controlled luminescence switching in Yb3+ Tm3+ codoped water-free low silica calcium aluminosilicate glasses. Appl. Phys. Lett. 2007, 91, 2007–2009. [Google Scholar] [CrossRef]
  34. Pavitra, E.; Raju, G.S.R.; Oh, J.H.; Yu, J.S. Pump power induced tunable upconversion emissions from Er3+/Tm3+/Yb3+ ions tri-doped SrY2O4 nanocrystalline phosphors. New J. Chem. 2014, 38, 3413–3420. [Google Scholar] [CrossRef]
  35. Shi, L.; Li, C.; Shen, Q.; Qiu, Z. White upconversion emission in Er3+/Yb3+/Tm3+ codoped LiTaO3 polycrystals. J. Alloys Compd. 2014, 591, 105–109. [Google Scholar] [CrossRef]
  36. Chen, X.; Zhang, B.; Qian, X.; Wang, J.; Zheng, L.; Hou, J.; Fang, Y.; Su, L. Upconversion color tunability and white light generation in Yb3+/Er3+/Tm3+ tri-doped CaF2 single crystals. Opt. Mater. 2019, 90, 40–45. [Google Scholar] [CrossRef]
  37. Bai, Y.; Wang, Y.; Peng, G.; Zhang, W.; Wang, Y.; Yang, K.; Zhang, X.; Song, Y. Enhanced white light emission in Er/Tm/Yb/Li codoped Y2O3 nanocrystals. Opt. Commun. 2009, 282, 1922–1924. [Google Scholar] [CrossRef]
  38. Li, Y.; Zhang, J.; Luo, Y.; Zhang, X.; Hao, Z.; Wang, X. Color control and white light generation of upconversion luminescence by operating dopant concentrations and pump densities in Yb3+, Er3+ and Tm3+ tri-doped Lu2O3 nanocrystals. J. Mater. Chem. 2011, 21, 2895–2900. [Google Scholar] [CrossRef]
  39. Hassairi, M.A.; Dammak, M.; Zambon, D.; Chadeyron, G.; Mahiou, R. Red–green–blue upconversion luminescence and energy transfer in Yb3+/Er3+/Tm3+ doped YP5O14 ultraphosphates. J. Lumin. 2017, 181, 393–399. [Google Scholar] [CrossRef]
  40. Li, Y.; Zhang, Y.; Hong, G.; Yu, Y. Upconversion luminescence of Y2O3:Er3+, Yb3+ nanoparticles prepared by a homogeneous precipitation method. J. Rare Earths 2008, 26, 450–454. [Google Scholar] [CrossRef]
  41. Zhang, Y.; Xu, S.; Li, X.; Sun, J.; Zhang, J.; Zheng, H.; Zhong, H.; Hua, R.; Xia, H.; Chen, B. Concentration quenching of blue upconversion luminescence in Tm3+/Yb3+ co-doped Gd2(WO4)3 phosphors under 980 and 808 nm excitation. J. Alloys Compd. 2017, 709, 147–157. [Google Scholar] [CrossRef]
  42. Venkatramu, V.; León-Luis, S.F.; Rodríguez-Mendoza, U.R.; Monteseguro, V.; Manjón, F.J.; Lozano-Gorrín, A.D.; Valiente, R.; Navarro-Urrios, D.; Jayasankar, C.K.; Muñoz, A.; et al. Synthesis, structure and luminescence of Er3+-doped Y3Ga5O12 nano-garnets. J. Mater. Chem. 2012, 22, 13788–13799. [Google Scholar] [CrossRef]
  43. Liang, H.; Lei, W.; Liu, S.; Zhang, P.; Luo, Z.; Lu, A. Color tunable up-conversion luminescence characteristics of Yb3+-Er3+-Tm3+ tri-doped fluorosilicate glass potentially used in WLED field. Opt. Mater. 2021, 119, 111320. [Google Scholar] [CrossRef]
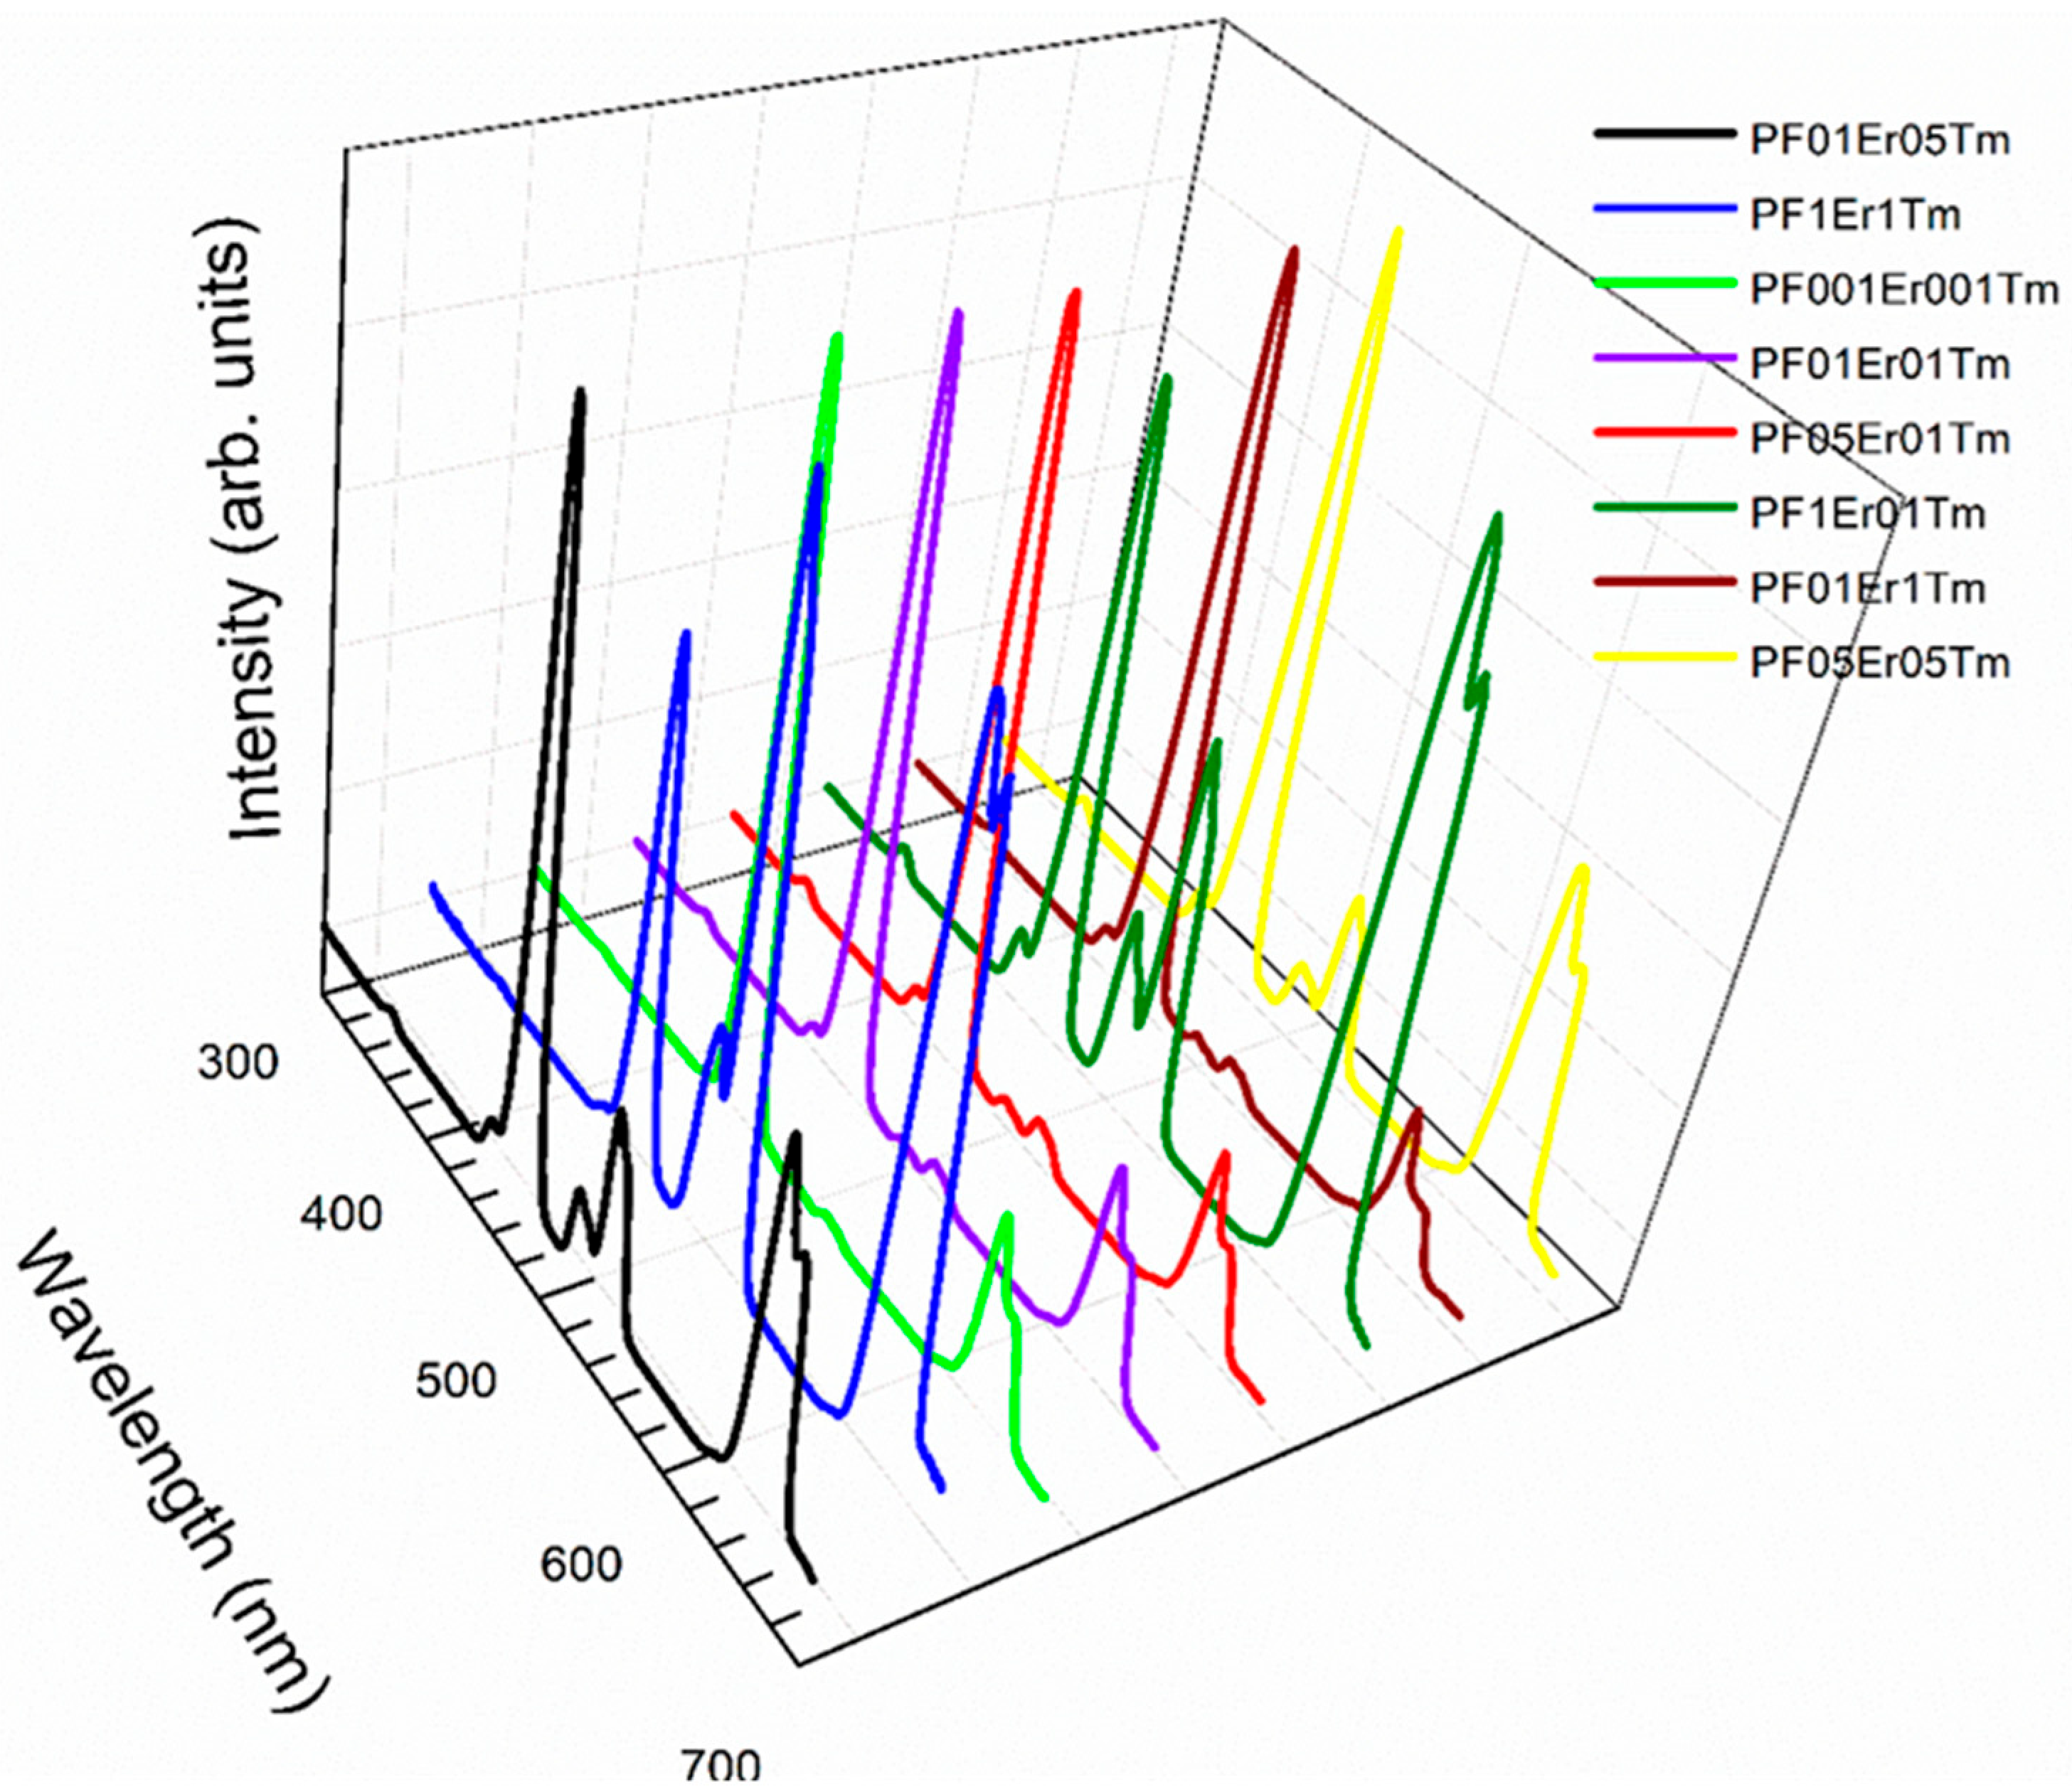
Figure 1. XRD of the fluorophosphate glass doped with 2 mol% of Yb2O3, 0.5 mol% of Er2O3 and 0.5 mol% of Tm2O3.
Photonics 12 00745 g001
Figure 2. SEM and EDS images of the fluorophosphate glass doped with 2 mol% of Yb2O3, 0.5 mol% of Er2O3 and 0.5 mol% of Tm2O3.
Photonics 12 00745 g002
Figure 3. Absorption spectrum of the fluorophosphate glass doped with 2 mol% of Yb2O3, 1 mol% of Er2O3 and 1 mol% of Tm2O3. The transitions start from the 4I15/2 ground state to the multiplets of the Er3+ ion (labeled in green), and from the 3H6 ground state to the multiplets of the Tm3+ ion (labeled in blue). The only intraconfigurational f-f absorption band for the Yb3+ ion is the 2F7/22F5/2 transition (labeled in red).
Photonics 12 00745 g003
Figure 4. Upconverted emission spectra of Er3+–Tm3+–Yb3+ tri-doped fluorophosphate glasses under cw laser excitation at 980 nm.
Photonics 12 00745 g004
Figure 5. Partial energy level diagrams of the Er3+, Tm3+ and Yb3+ ions showing the possible energy transfer upconversion mechanisms after cw laser excitation at 980 nm. Labels of the observed upconverted emission bands are also shown.
Photonics 12 00745 g005
Figure 6. Double logarithmic plot of the integrated emission intensities of the red (stars), green (squares) and blue (circles) upconverted emissions as a function of the incident laser pumping power at 980 nm.
Photonics 12 00745 g006
Figure 7. Representation on the CIE 1931 diagram of the chromaticity coordinates associated with the upconverted emissions of fluorophosphate glasses (power = 100 mW). The sample emitting green corresponds to PF1Er01Tm, and the one emitting blue is PF05Er01Tm.
Photonics 12 00745 g007
Figure 8. Representation on the CIE 1931 diagram of the chromaticity coordinates associated with the upconverted emissions of sample PF01Er05Tm, varying the laser power from 20 to 100 mW.
Photonics 12 00745 g008
Table 1. Composition and labels of the fluorophosphate glasses.
Glass Composition (mol%)Label
54.99 P2O5 -17 K2O -10.99 BaO- 9 Al2O3 -6 BaF2 -2 Yb2O3 -0.01 Er2O3 -0.01 Tm2O3PF001Er001Tm
54.90 P2O5 -17 K2O -10.90 BaO -9 Al2O3 -6 BaF2 -2 Yb2O3 -0.1 Er2O3 -0.1 Tm2O3PF01Er01Tm
54.00 P2O5 -17 K2O -10.00 BaO -9 Al2O3 -6 BaF2 -2 Yb2O3 -1 Er2O3 -1 Tm2O3PF1Er1Tm
54.50 P2O5 -17 K2O -10.50 BaO -9 Al2O3 -6 BaF2 -2 Yb2O3 -0.5 Er2O3 -0.5 Tm2O3PF05Er05Tm
54.45 P2O5 -17 K2O -10.45 BaO -9 Al2O3 -6 BaF2 -2 Yb2O3 -0.1 Er2O3 -1 Tm2O3PF01Er1Tm
54.70 P2O5 -17 K2O -10.70 BaO -9 Al2O3 -6 BaF2 -2 Yb2O3 -0.1 Er2O3 -0.5 Tm2O3PF01Er05Tm
54.45 P2O5 -17 K2O -10.45 BaO -9 Al2O3 -6 BaF2 -2 Yb2O3 -1 Er2O3 -0.1 Tm2O3PF1Er01Tm
54.70 P2O5 -17 K2O -10.70 BaO -9 Al2O3 -6 BaF2 -2 Yb2O3 -0.5 Er2O3 -0.1 Tm2O3PF05Er01Tm
Table 2. Chromaticity coordinates (x, y) for all samples under excitation at 980 nm and 100 mW power.
SampleChromaticity Coordinates
PF001Er001Tmx = 0.16, y = 0.13
PF01Er01Tmx = 0.17, y = 0.15
PF1Er1Tmx = 0.29, y = 0.49
PF05Er05Tmx = 0.21, y = 0.28
PF01Er1Tmx = 0.15, y = 0.15
PF01Er05Tmx = 0.19, y = 0.28
PF1Er01Tmx = 0.29, y = 0.42
PF05Er01Tmx = 0.16, y = 0.16
Table 3. Dependence of chromaticity coordinates (x, y) on excitation power for the PF01Er05Tm sample, varying the laser pump power from 20 to 200 mW.
Power (mW)Chromaticity Coordinates
20x = 0.28, y = 0.39
30x = 0.26, y = 0.35
40x = 0.24, y = 0.34
50x = 0.23, y = 0.32
60x = 0.22, y = 0.31
70x = 0.21, y = 0.30
80x = 0.20, y = 0.29
90x = 0.20, y = 0.29
100x = 0.19, y = 0.28
125x = 0.19, y = 0.27
150x = 0.19, y = 0.27
175x = 0.19, y = 0.27
200x = 0.19, y = 0.27
Disclaimer/Publisher’s Note: The statements, opinions and data contained in all publications are solely those of the individual author(s) and contributor(s) and not of MDPI and/or the editor(s). MDPI and/or the editor(s) disclaim responsibility for any injury to people or property resulting from any ideas, methods, instructions or products referred to in the content.

