Article

Optical Characteristics of GaAs Spherical Quantum Dots Based on Single and Double Quartic Anharmonic Potentials: The Role of Structural Parameters

1
Physics Department, College of Science, Qassim University, Buraydah 52571, Saudi Arabia
2
Physics Department, College of Science of Dammam, Imam Abdulrahman Bin Faisal University, P.O. Box 1982, Dammam 31441, Saudi Arabia
3
Physics Department, Faculty of Applied Science, Umm AL-Qura University, P.O. Box 715, Makkah 24382, Saudi Arabia
4
Nanomaterials Technology Unit, Basic and Applied Scientific Research Center (BASRC), Physics Department, College of Science of Dammam, Imam Abdulrahman Bin Faisal University, P.O. Box 1982, Dammam 31441, Saudi Arabia
5
Department of Physics, Faculty of Science, Sivas Cumhuriyet University, 58140 Sivas, Türkiye
6
Nanophotonics Application and Research Center, Sivas Cumhuriyet University, 58140 Sivas, Türkiye
7
College of Science, Jinling Institute of Technology, 99 Hongjing Avenue, Nanjing 211169, China
*
Author to whom correspondence should be addressed.
Photonics 2025, 12(7), 675; https://doi.org/10.3390/photonics12070675
Submission received: 10 June 2025 / Revised: 1 July 2025 / Accepted: 1 July 2025 / Published: 4 July 2025
(This article belongs to the Special Issue Recent Progress in Integrated Photonics)

Abstract

This is a numerical investigation of optical and electronic characteristics of GaAs spherical quantum dots based on single and double quartic potentials and presenting a hydrogenic impurity at their center. The radial Schrödinger equation was solved using the finite difference method (FDM) to obtain the energy levels and the wavefunctions. These physical quantities were then used to compute the dipole matrix elements, the total optical absorption coefficient (TOAC), and the binding energies. The impact of the structural parameters in the confining potentials on the red and blue shifts of the TOAC is discussed in the presence and absence of hydrogenic impurity. Our results indicate that the structural parameter k in both potentials plays a crucial role in tuning the TOAC. In the case of single quartic potential, increasing k produces a blue shift; however, its augmentation in the case of double quartic potential displays a blue shift at first, and then a red shift. Furthermore, the augmentation of the parameter k can control the binding energies of the two lowest states, ( 1 s ) and ( 1 p ). In fact, enlarging this parameter reduces the binding energies and converges them to constant values. In general, the modification of the potential’s parameters, which can engender two shapes of confining potentials (single quartic and double quartic), enables the experimenters to control the desired energy levels and consequently to adjust and select the suitable TOAC between the two lowest energy states (ground ( 1 s ) and first excited ( 1 p )).

1. Introduction

It is well known that the harmonic oscillator potential (HOP) with different dimensions is considered the highest significant model that is largely studied in quantum mechanics problems [1,2,3,4,5,6,7,8,9]. Its importance is due to its excellent results in describing molecular vibrations between molecules around their equilibrium positions. Furthermore, the quantum systems under HOP generally present exact analytical solutions in one, two, and three dimensions. Recent studies have demonstrated that in many cases the motion is not a simple harmonic oscillation, and adding anharmonic potential to the harmonic one improved the explanation of the molecular vibrations [6,7,8,9,10,11]. The general form of anharmonic oscillator potential (AOP) as presented in different studies contains higher order terms such as the single and double quartic, the sextic, and the octic. The incorporation of these terms within the HOP improves the performance of the potential, especially when it describes larger displacement between molecules where simple oscillation is no longer efficient.
In recent years, many research works have concentrated on the electronic and optical properties of quantum systems based on anharmonic potentials in molecular and solid-state physics. Some of these works explored numerically [12,13,14,15,16,17,18], and others were analytical [19,20,21]. For instance, diatomic molecules are considered to be oscillating systems. In these systems, the nuclei motions usually present non-periodic oscillations, and they are often described by combining harmonic and anharmonic potentials. In this regard, when investigating the diatomic molecules’ motion in quantum mechanics, the anharmonic potential illustrating the electrostatic interaction between atoms must involve higher-order terms such as sextic, quartic, and even decatic. Additionally, anharmonic potentials with higher anharmonicity have demonstrated a crucial role in studying quantum tunneling problems and molecular spectra [21,22,23,24,25,26,27,28]. Furthermore, recent experimental results have proposed that the confinement in spherical QDs can be better described by an anharmonic potential with a finite depth rather than a harmonic one [25,26]. The importance of anharmonic potential is not limited to solid state physics, but is also found in nuclear physics. For instance, Hamad et al. studied the critical fluctuations in the ground and excited states using a model based on anharmonic potential [29]. They proved that the quartic, sextic, and octic anharmonic oscillators can be used to describe yrast and non-yrast energy sequences in many even–even atoms such as 100Mo, 146Ba, and 226Ra. The impact of variable electron mass on the optical properties in anharmonic oscillators was studied by Sakiroglu et al. [10]. They demonstrated that the energy levels and their separations can be modified due to the position dependence of the effective mass. Yucel et al. investigated the influence of an applied laser field on the optical properties in anharmonic oscillators with higher-order anharmonicity [9]. They also discussed the impact of the structural parameters such as the different sizes and coupling between the wells on the red and blue shift of the optical absorption. In our previous works [30,31], we studied the binding energies and optical absorption in spherical quantum dots based on power-exponential and Woods–Saxon potentials. Those potentials are largely employed to describe anharmonic interactions, especially in diatomic molecules. However, yrast and non-yrast energy sequences in even–even atoms such as 100Mo, 146Ba, and 226Ra are better modelized by anharmonic potentials with higher orders, such as the single and double quartic oscillators.
In this context, the binding energy, electronic and optical properties of spherical GaAs quantum dots with single and double quartic potentials and in the presence of on-center hydrogenic impurity are investigated in the present study by changing the structural parameters governing the geometric shape of the confining potential.

2. Theory

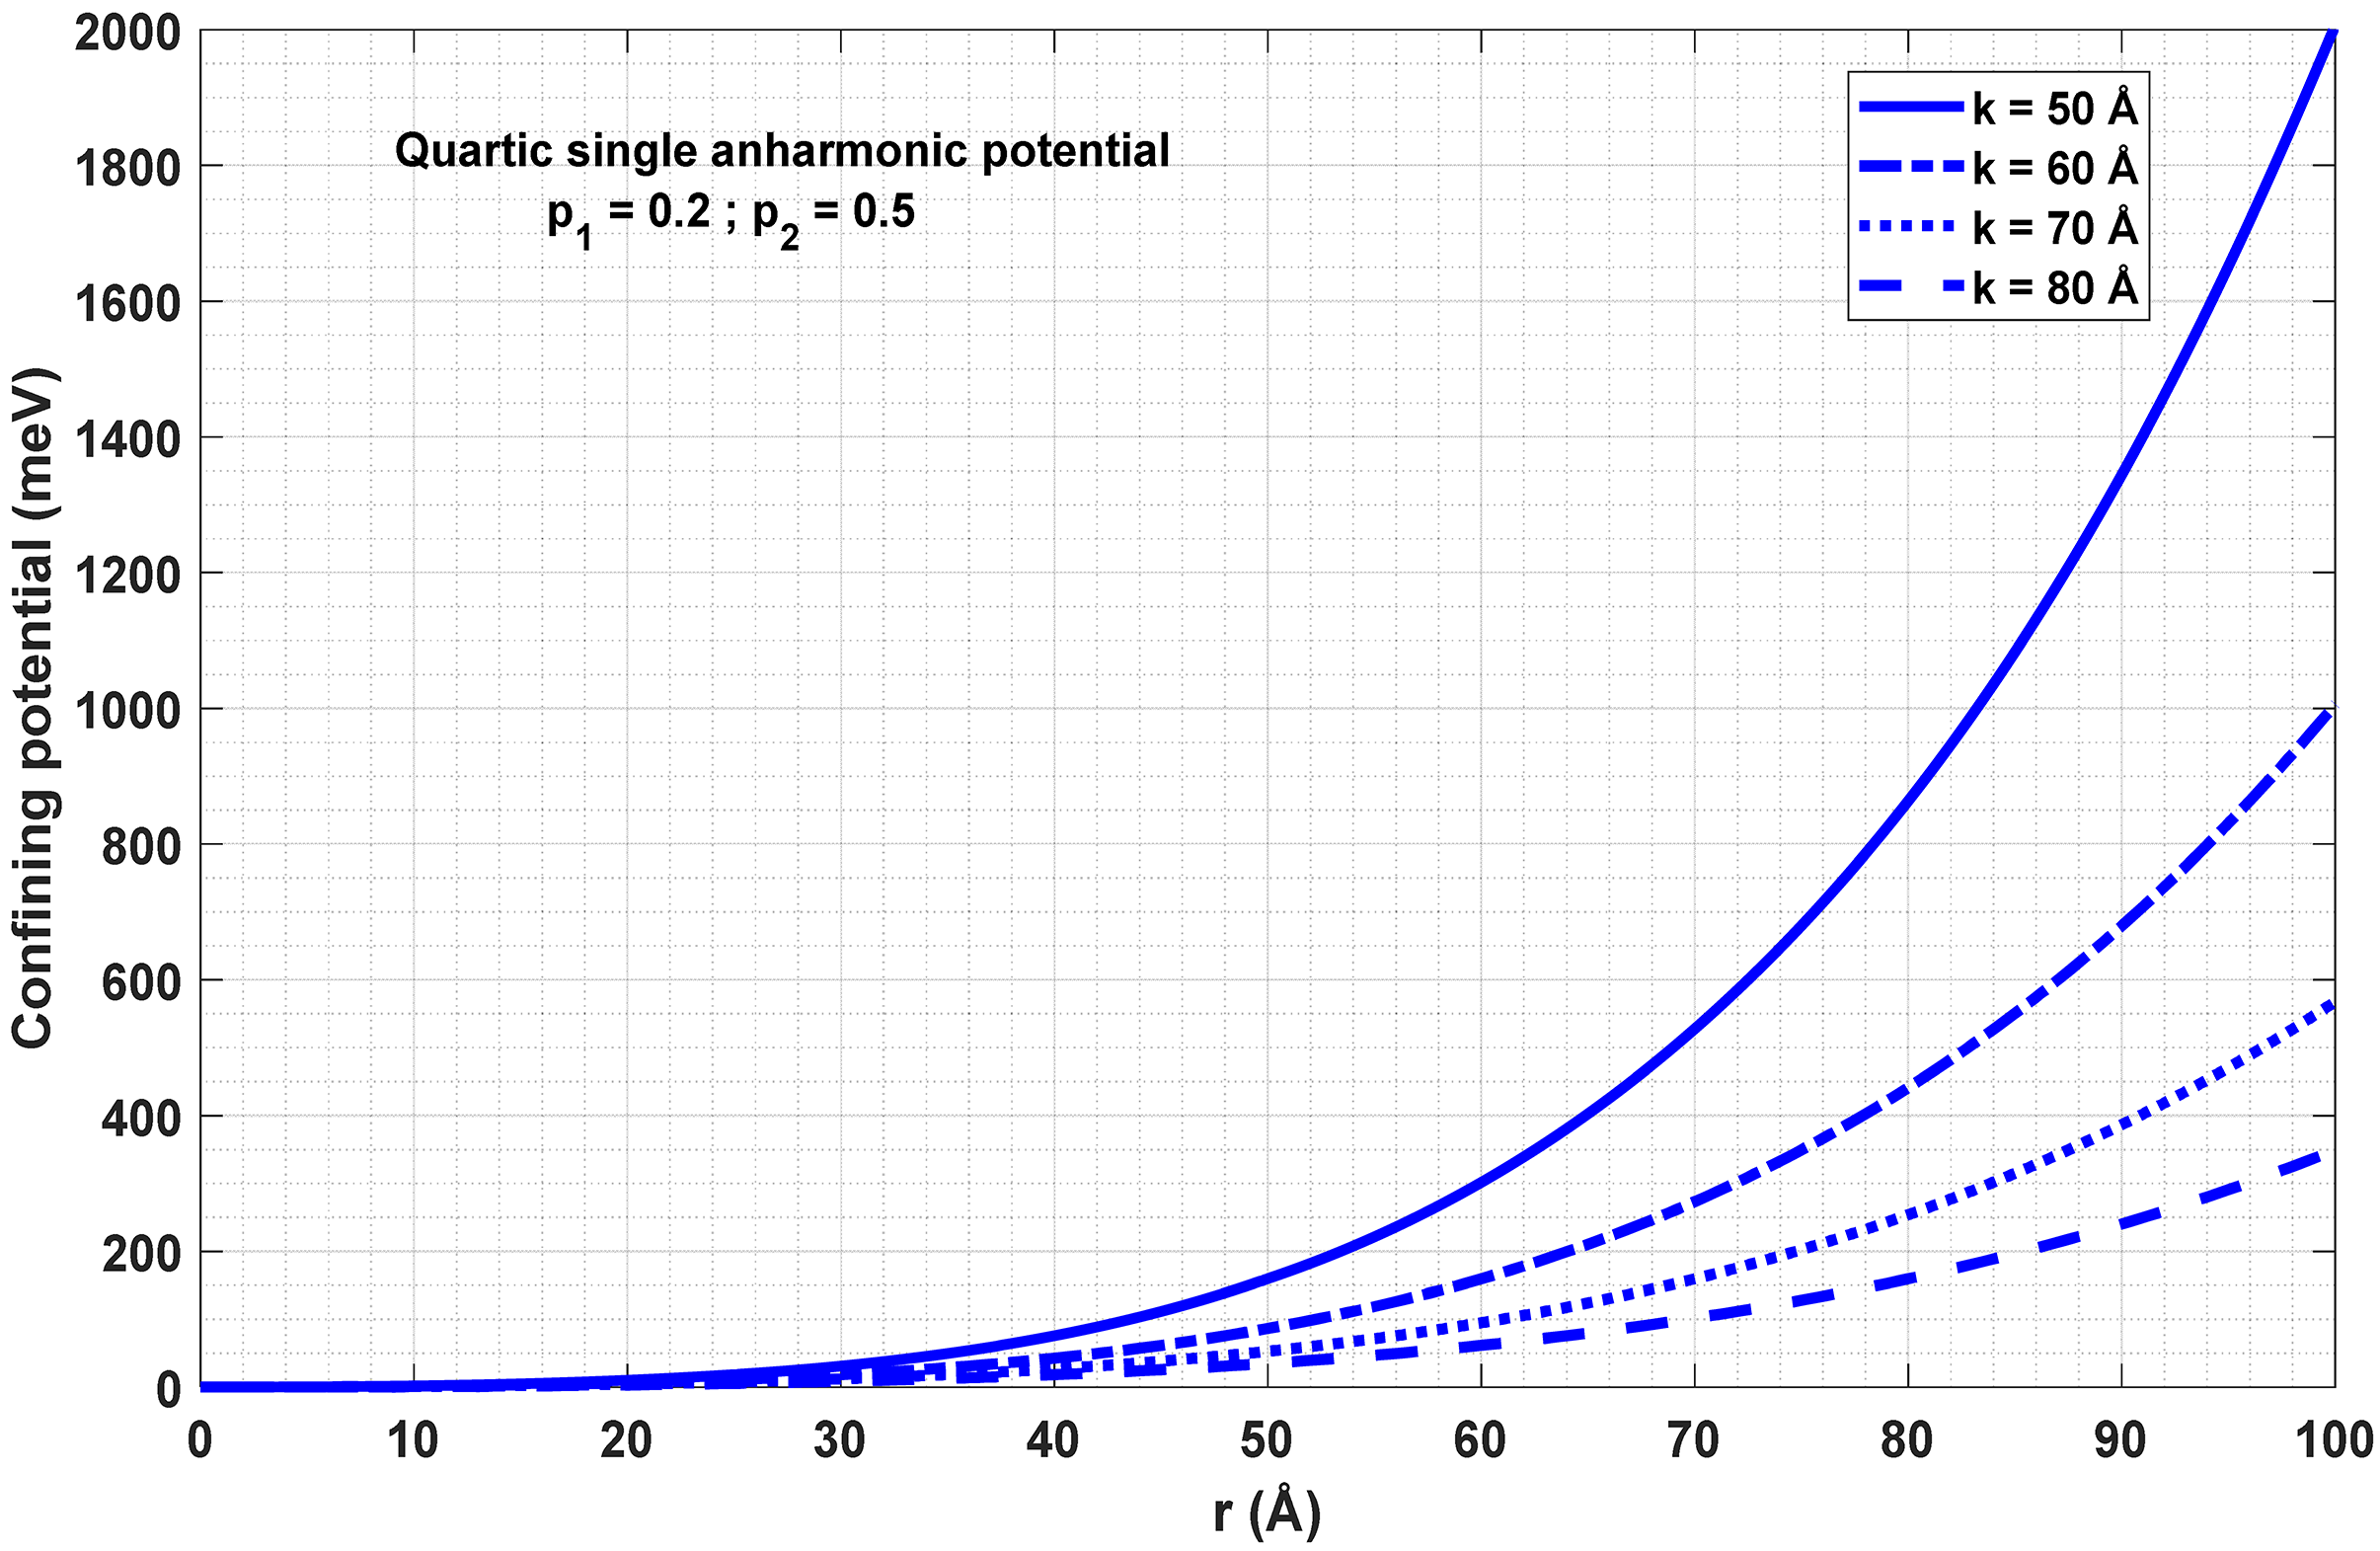
2.1. Single and Double Quartic Potential Profiles

In this section, we first aim to present the geometrical forms of the studied confining potentials, which are the single and double quartic potentials. Their profiles’ dependence on the structural parameters enables us to predict the spatial expansion of the 1s and 1p wavefunctions, as well as the tendency of their associated energies. This is essential when the studied system is a perfect spherical quantum dot (QD) displaying a spherical symmetry. Given the presence of this symmetry, the electron wavefunctions and their associated densities are computed by simply solving the radial part of the Schrödinger equation (RSE). This latter depends mainly on the geometric form of the potential. Allowing that the energy interval between the sub-band energy levels denotes a key aspect in the optical absorption, their tunability and control is made mandatory by applying external fields, varying the QD dimensions, or altering the confining potential’s parameters. Herein, we consider a single and double quartic potential derived from the general form of the anharmonic potential by varying the parameters p 1 and p 2 as well as the variable k . Its analytical expression is given by the following expression [10]:
V Q u a r t i c r = V c p 1 r k 2 + p 2 r k 4
V c represents the conduction band discontinuity between AlGaAs and GaAs semiconductors. p 1 , p 2 , and k are considered to be parameters of simulation. In Figure 1, we display the single quartic anharmonic potential for different values of the parameter k . This potential was obtained by selecting p 1 and p 2 equal to 0.2 and 0.5, respectively. The parabolicity of the potential increases with k , especially for a larger radius ( r > 30   ) , which in turn affects the distribution of the energy levels E n l and their radial wavefunctions R n l ( r ) and the (TOAC) between the 1s and 1p states.
By selecting different values of the structural parameters than those used before, we can generate the double quartic confining potential. In the case where the parameters p 1 and p 2 are equal to 1 and 0.3 , respectively, the anharmonic potential presents a parabolic barrier centered at the origin of the quantum dot separating two quantum wells (left and right). Since the potential is symmetric with respect to ( r = 0 ) , in Figure 2 we represent only its form for positive radius r . By examining Figure 2, we can observe that the augmentation of k widens the parabolicity of the confining potential without affecting its minimum value, which is around 200   m e V .

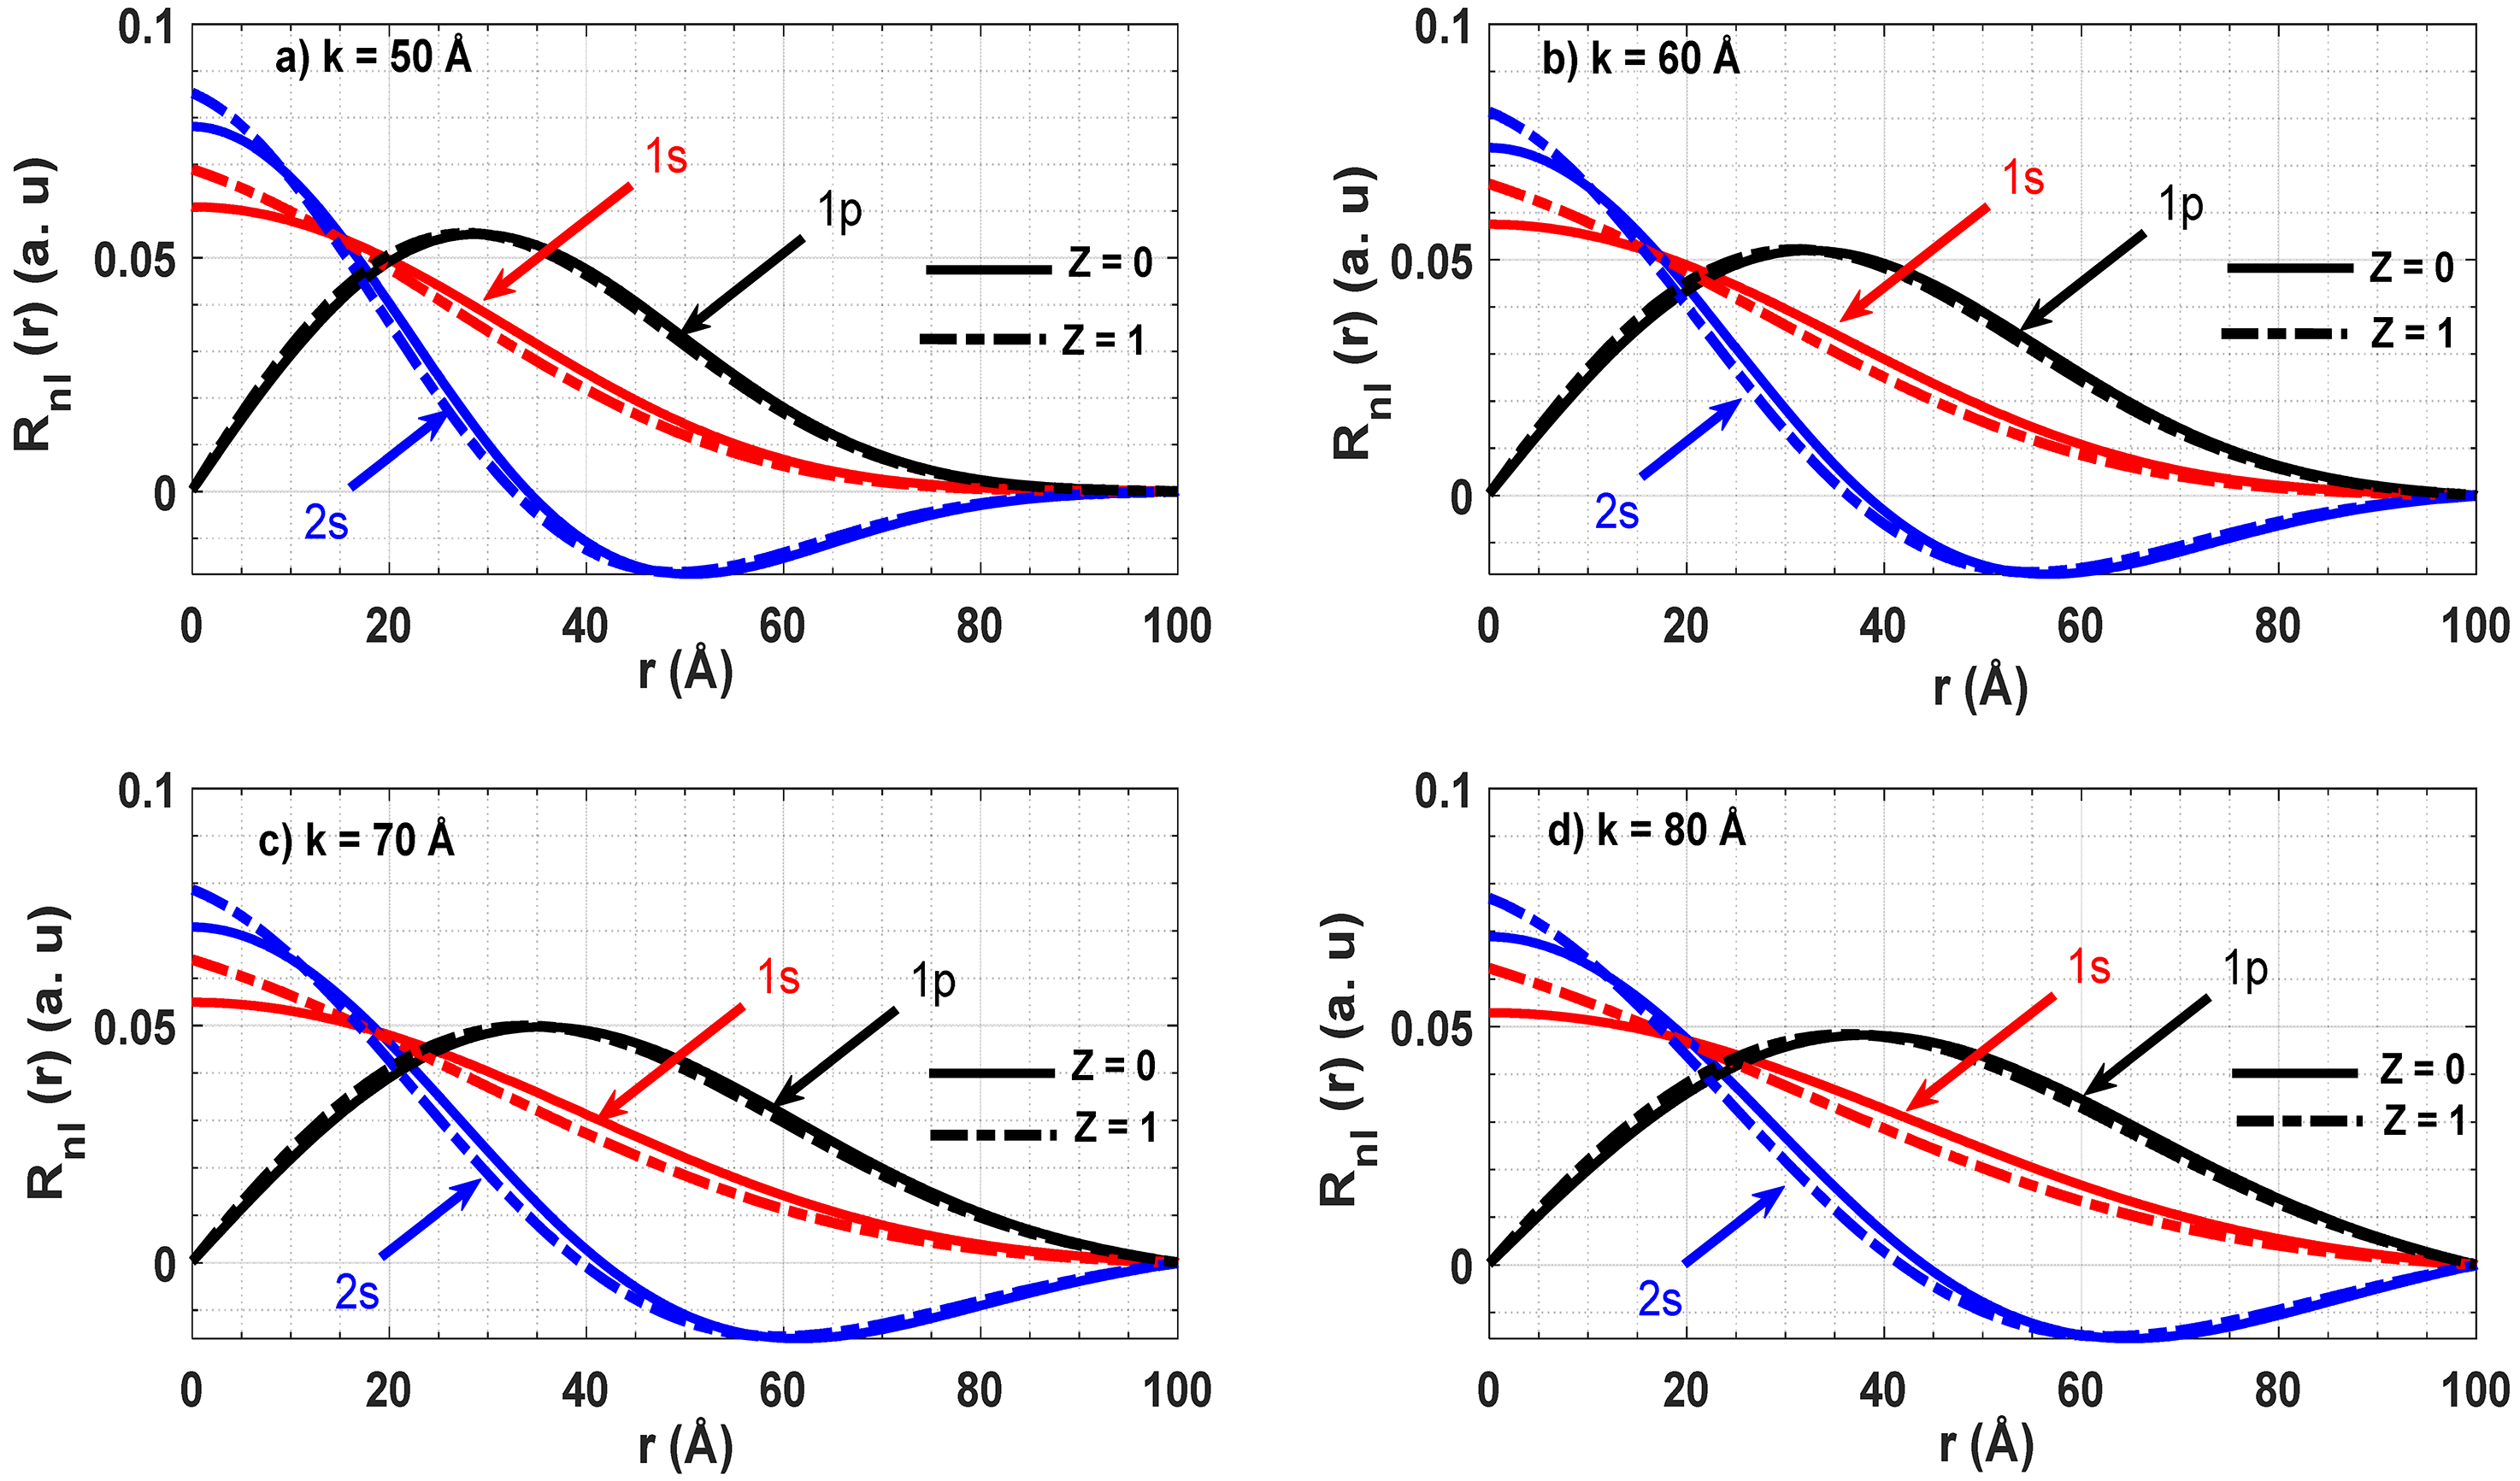
2.2. Radial Schrödinger’s Equations

Retaining the quartic potential term showed by Equation (1), the different wavefunctions R n l r and energy levels E n l of the spherical GaAs QD can be computed numerically by solving the following equation [30,31]:
2 2 r 1 m * r r + l l + 1 2 2 m * r r 2 Z e 2 ε r + V Q u a r t i c r R n l r = E n l R n l r
In the above equation, represents the reduced Planck constant, m * r stands for the position-dependent mass of the electron, ε denotes the dielectric constant, Z represents the impurity charge, and l stands for the angular quantum number.
The first term of Equation (2) denotes the kinetic energy of the free electron, the second term denotes the centrifugal potential, and the quartic potential energy is described by the last term of Equation (2). The attractive potential between the free electron and hydrogenic impurity is denoted by the term Z   e 2 ε   r . The numerical procedure consists of discretizing Equation (2) using the (FDM) method and transforming it to a linear problem of the type ξ u = α u . α and u   represent E n l and R n l r , respectively. On the other hand, ξ is a tridiagonal matrix [30,31].
ξ i j = 2 m * r 2 + l l + 1 m * r j · r 2 + V A n h a r m o n i c j ,   i f   j = i 2 2 m * r j r 2 2 m * r 2 ,   i f   j = i 1 2 2 m * r r 2 2 m * r 2 ,   i f   j = i + 1 0   ; o t h e r w i s e
where r j = j r ,   j = 1 , , N , and r = R N denotes the step of discretization. The dimension of matrix ξ is ( N × N ) . In all our simulations, we have taken N = 1200 .
In agreement with Fermi’s golden rule, the TOAC between two states (initial and final) can be derived using the next expression [30,31,32]:
α ω = β ω M i f 2 δ E f E i ω
with
β = 16 π 2 γ F S N i f n r V c o n
In our study, the delta function is approximated by the Lorentzian function [32]:
δ E f E i ω = Γ π E f E i ω 2 + Γ 2
Through the next sections of the paper, the final state ( f = 2 ) is the 1p state and the initial state ( i = 1 ) is 1s; consequently, the square value of the dipole matrix element M i f 2 in Equation (4) is represented by M 12 2 , and given by the following expression [32]:
M 12 2 = 1 3 0 R f r r 3 R i r d r 2
where R f r and R i r represent the radial wavefunction of the final (1p) and initial (1s) states, respectively. The factor 1 3 comes from the integration of the spherical harmonics.
The atomic units were used in the present simulation [33,34,35,36]; therefore, the Bohr radius and Rydberg energy are equal to 1 a B 100   and 1 R y 5.6   m e V , respectively. The other parameters are V c = 0.228   e V ; R = 200   ; ε = 13.11 ε 0 ;   m * = 0.067 m 0 ;   and   Γ = 3   m e V .

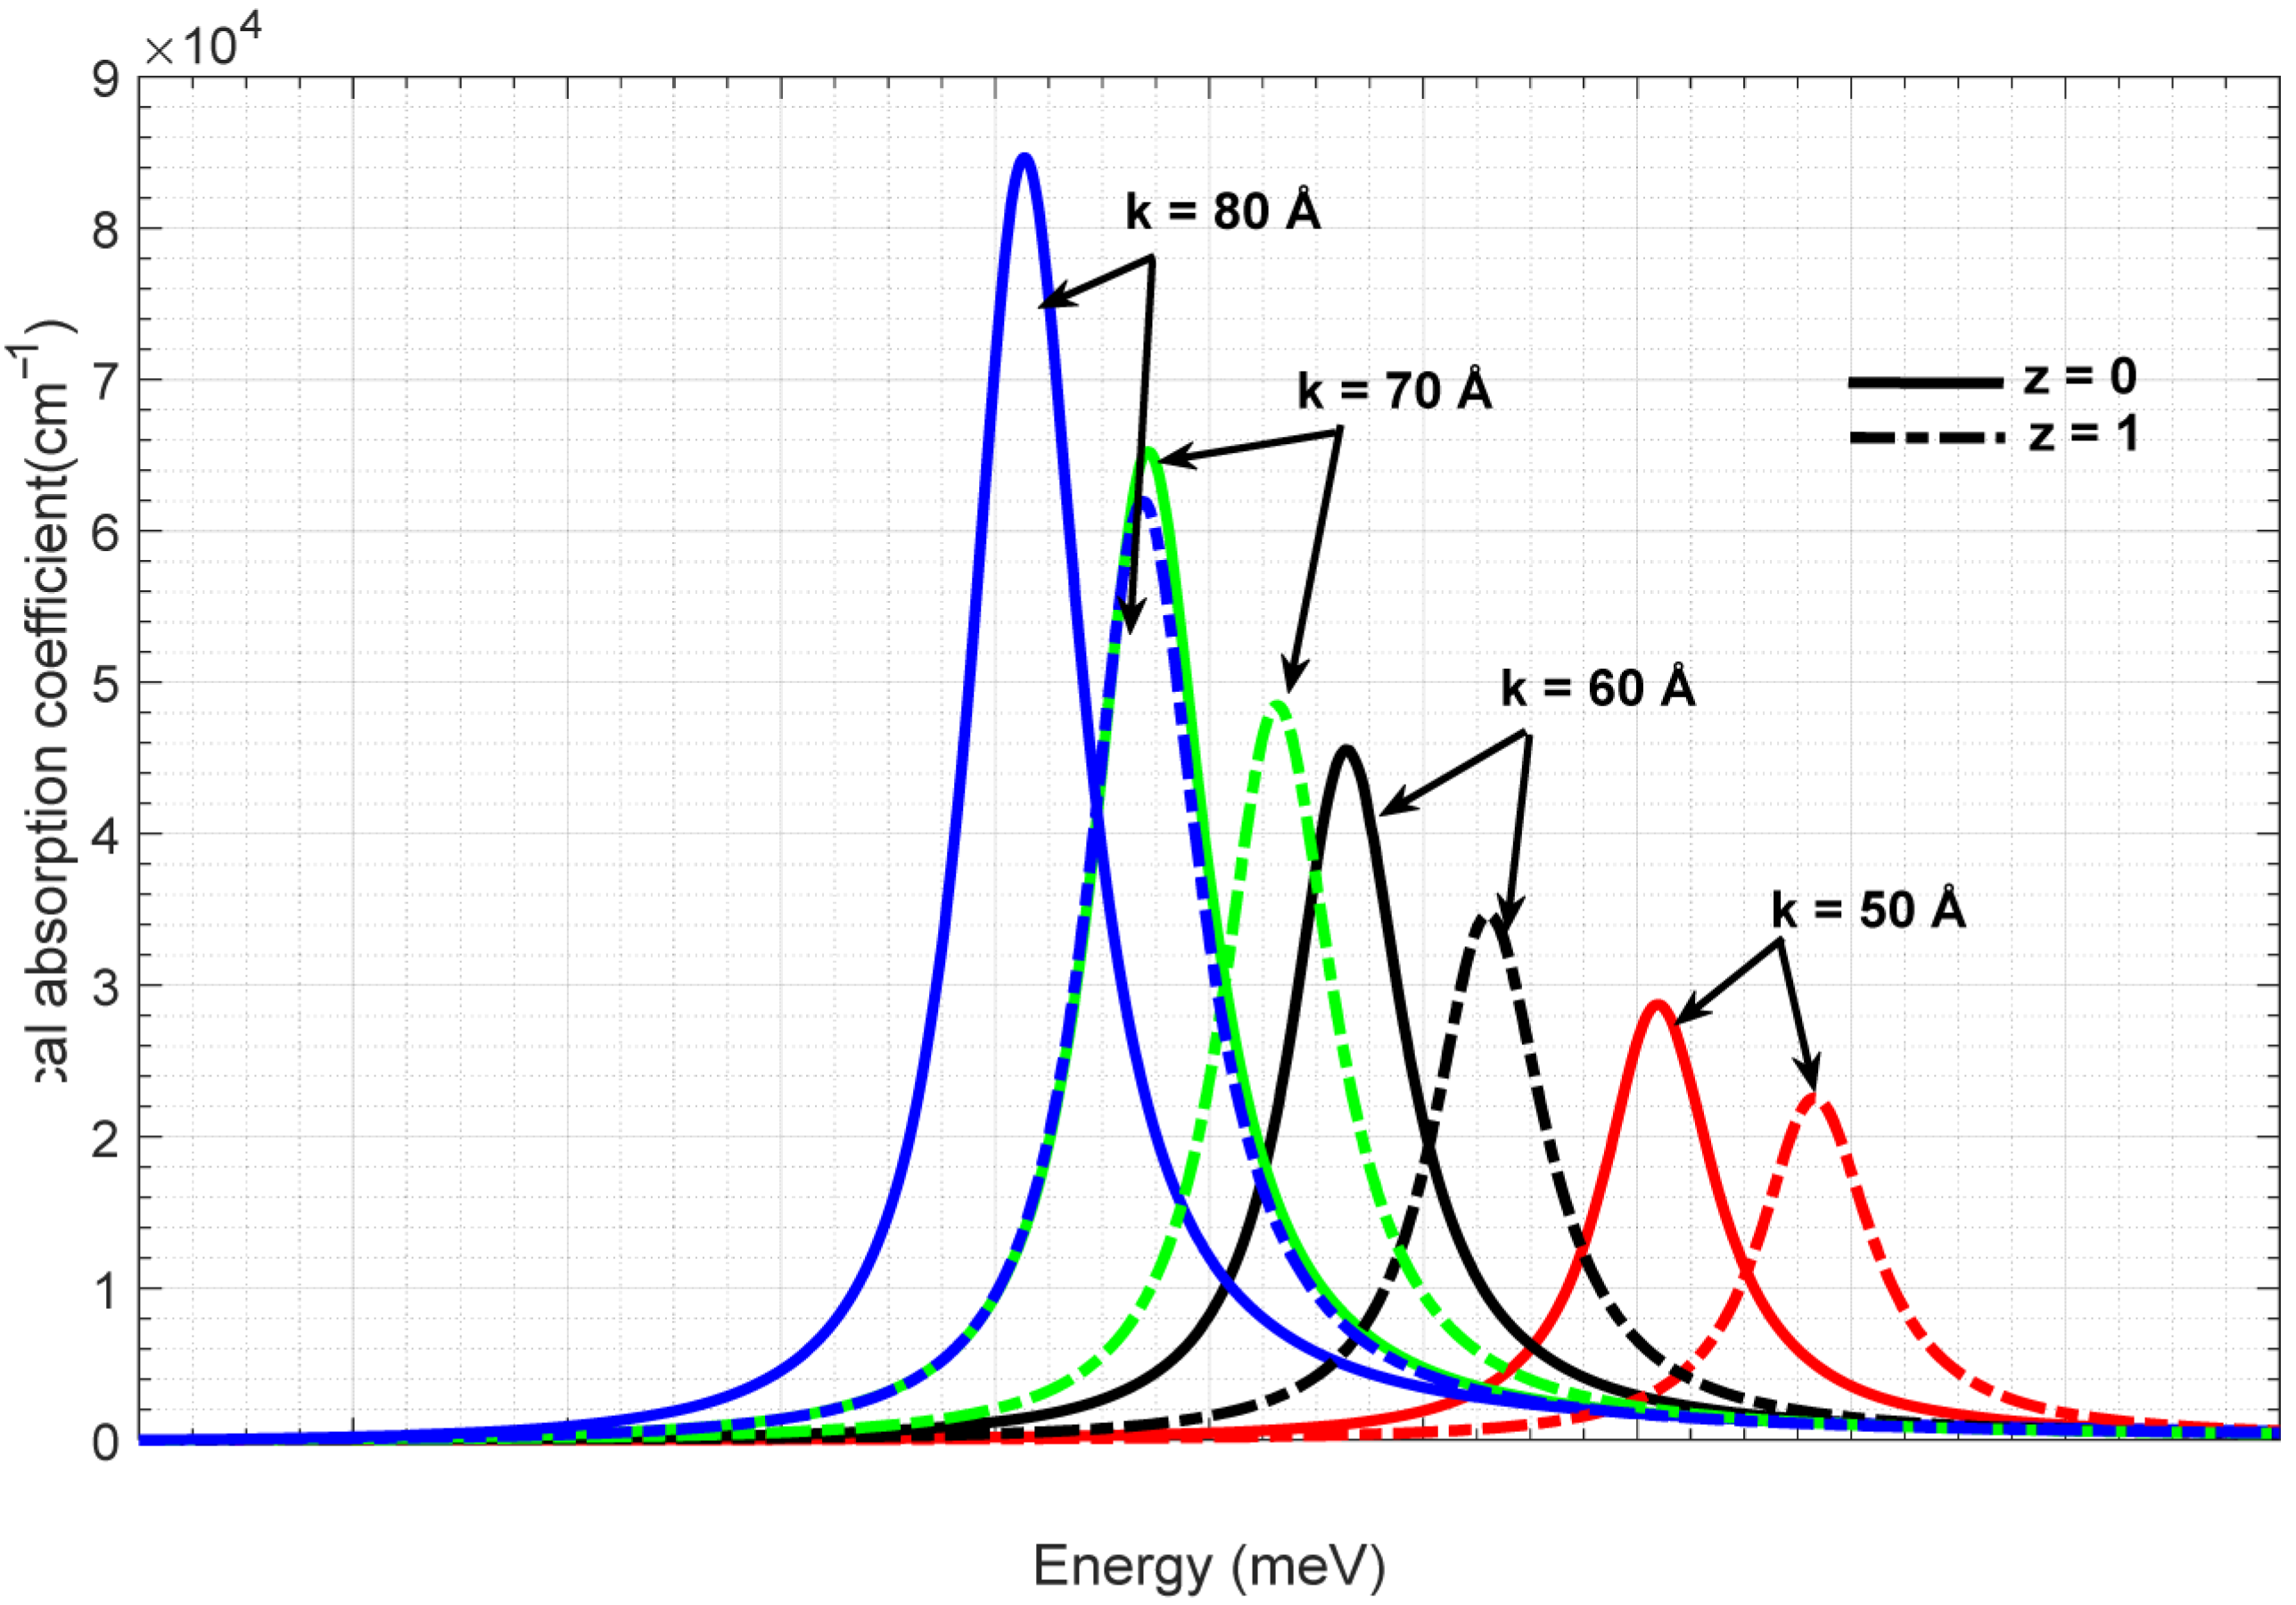
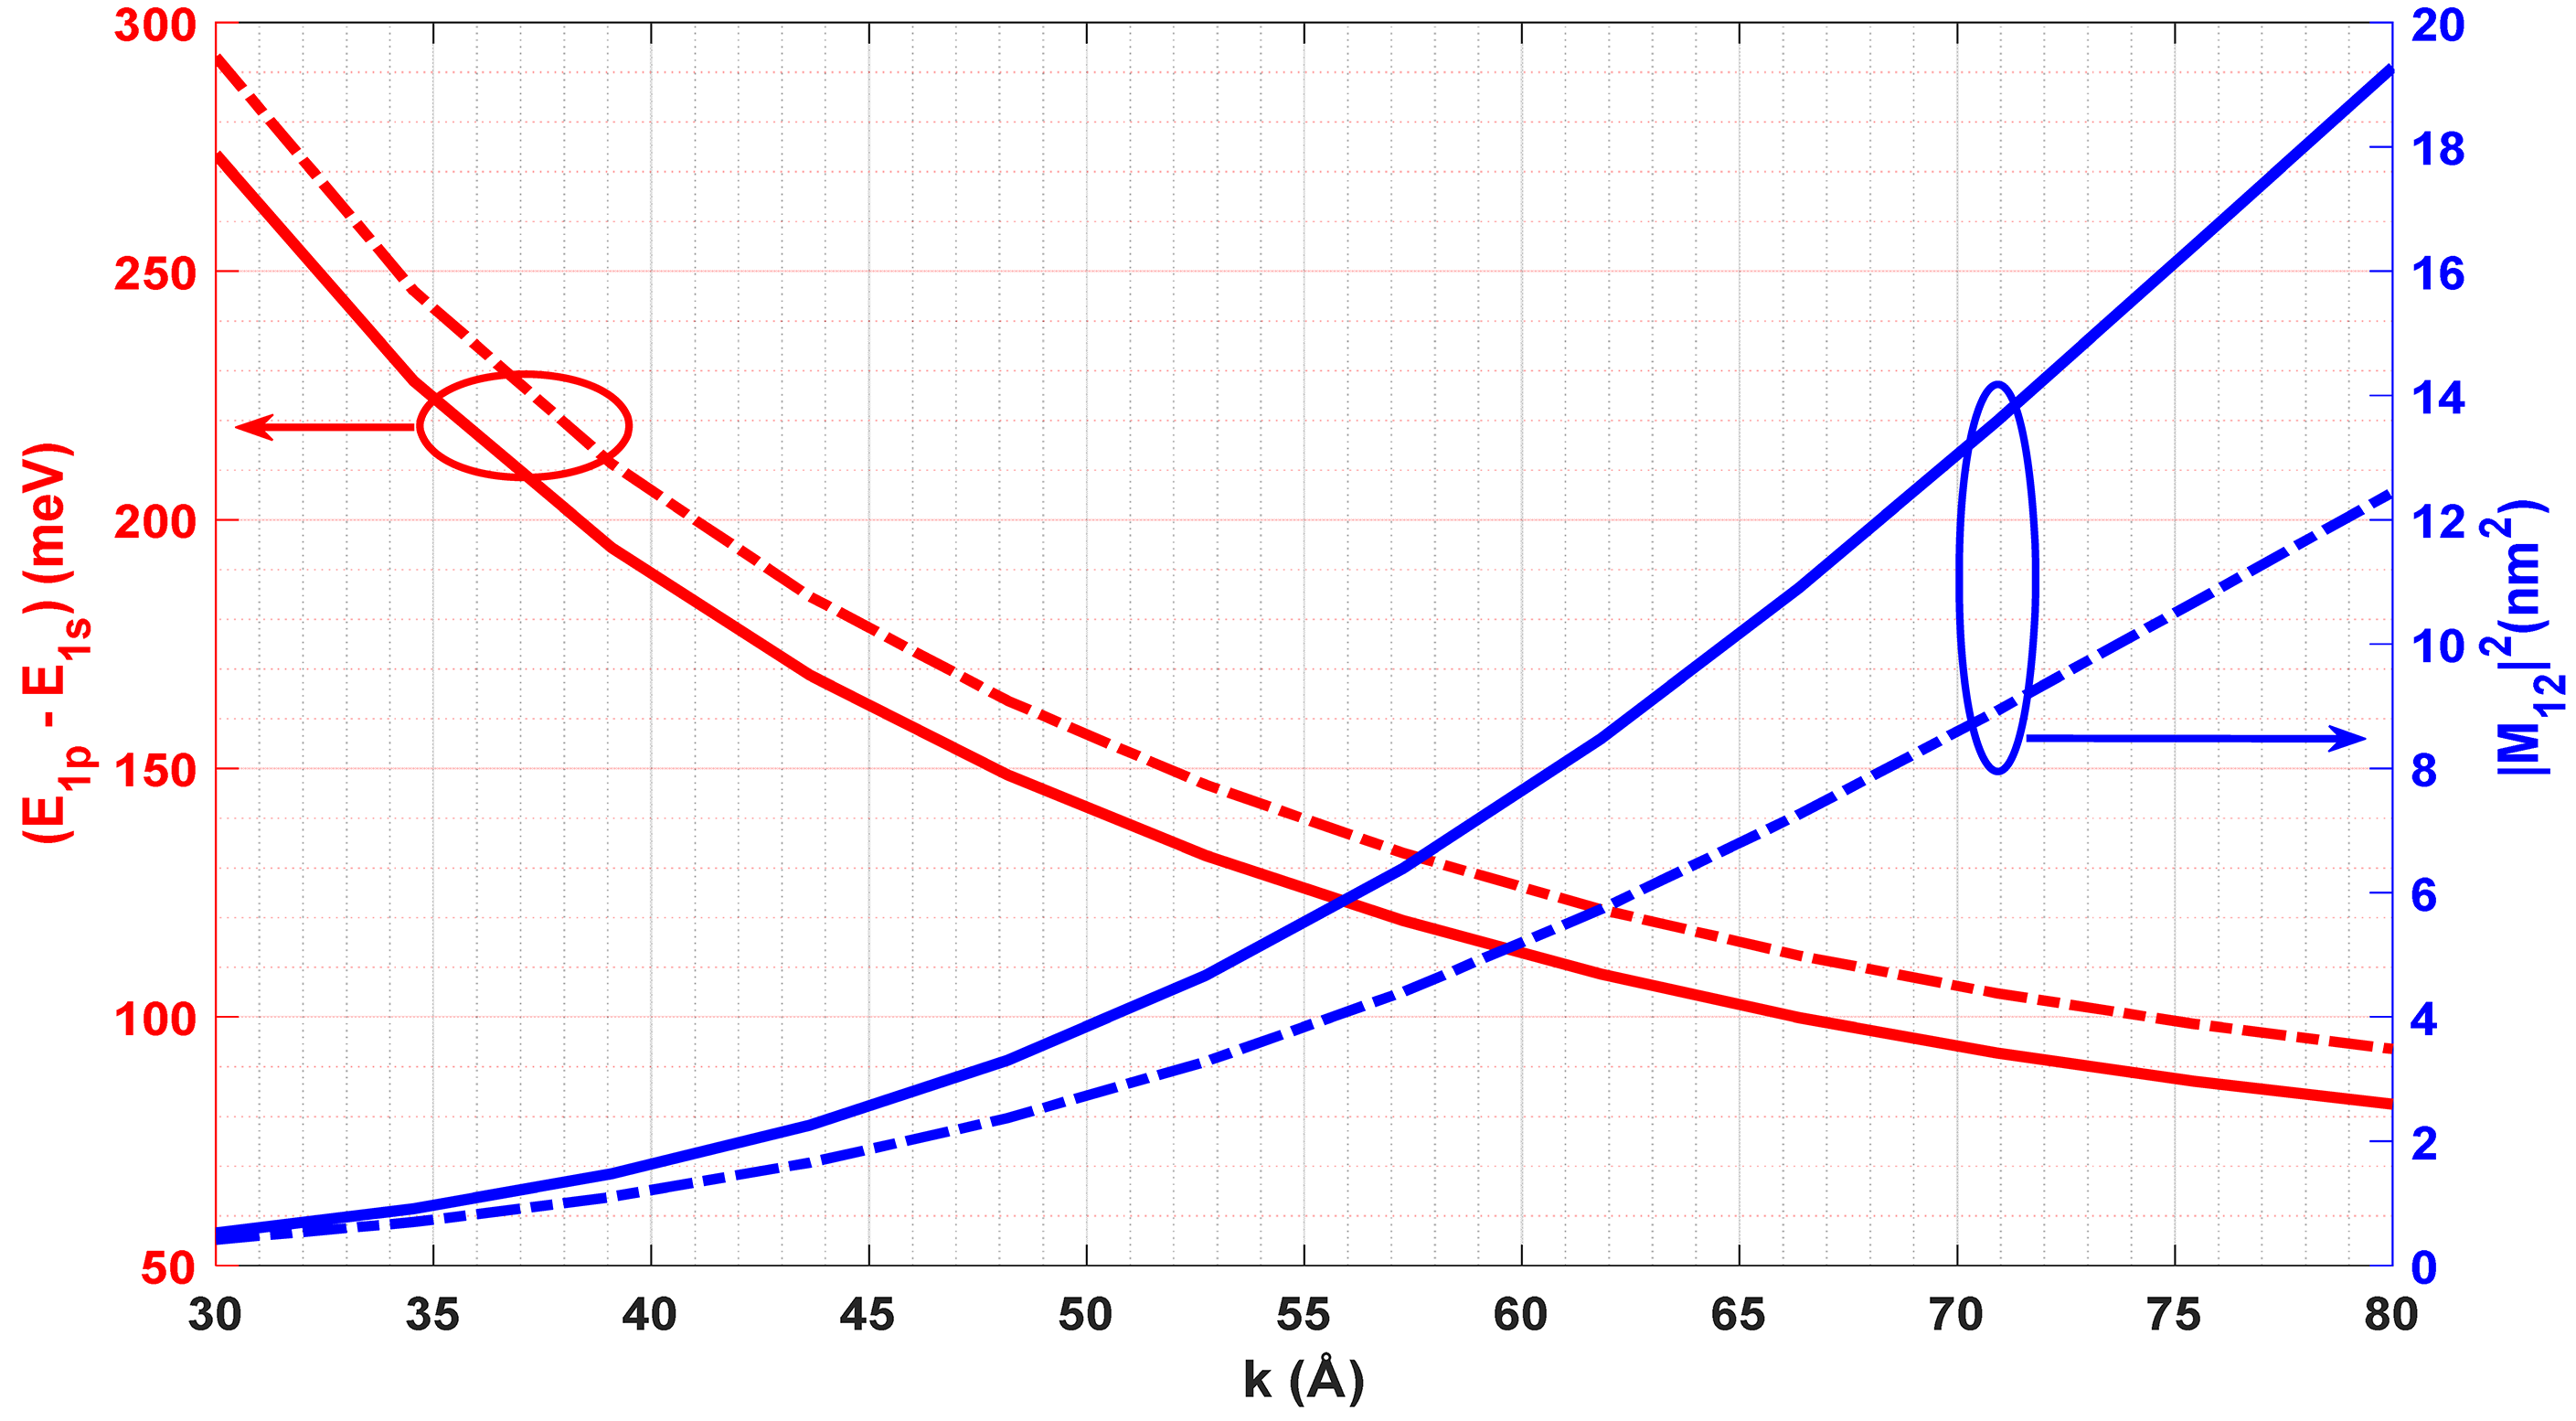
3. Results and Discussion

3.1. Single Quartic Anharmonic Oscillator

To highlight the parabolicity impact on the energy levels and to give further ideas on the energy levels’ tendency when we increment the parameter k , in Figure 3, we plot the lower four levels ( E 1 s ,   E 2 s ,   E 1 p ,   and   E 2 p ) depending on k . It is clear that all the energy levels decrease upon augmenting k , which is legitimate since the potential widens its width, giving greater confinement and consequently lowering all the confined energy states (see Figure 1). In addition, we observed that the energy levels in the presence of hydrogenic impurity were less than those without its presence. The small energetic shift introduced by the presence of the hydrogenic impurity is due to attraction between impurity and free electrons.
Since the optical absorption coefficient α 1 s 1 p of the transition 1 s   1 p is at the core of the present study, in Figure 4, we plot its variation as a function of the incident photon energy for four values of k . It appears that the absorption peak moves to lower energies by incrementing k suffering; therefore, red-shift behavior is obtained. Furthermore, the absorption’s amplitude rises from 3 × 10 4   c m 1 for k = 50 to 8 × 10 4   c m 1 for k = 80 . The jump in amplitude and shift to the red of α 1 s 1 p is explained by the variation in E 1 p E 1 s and the dipole matrix element (DME) given by the change in M 12 2 . These physical quantities are displayed in Figure 5 for different values of the structural parameter k .
As shown in Figure 5, the energy separation Δ E = ( E 1 p E 1 s ) diminishes with the parameter k, which confirms the red shift of the absorption’s peak observed in Figure 4. In the meantime, we observe that contrary to the energy separation variation, the dipole matrix element M 12 2 augments upon increasing k, which confirms the increase in the absorption amplitude stated in Figure 4. The increase observed in M 12 2 is a result of the augmentation in the overlap between the radius r and the two wavefunctions R 1 s r and R 1 p r . Figure 6 shows the spatial distribution of R 1 s r ,   R 2 s r , and R 1 p r for different values of k . By examining Figure 5, we can observe that the spread of the wavefunctions along the radial coordinate r augments with the parameter k . This augmentation in the spread leads to a greater overlap between R 1 s r and R 1 p r , which confirms the increase of M 12 2 as presented in Figure 5. Note that the dependency on the hydrogenic impurity presence is clearly noticeable, especially for 1s and 2s states at the origin of the QD. In fact, with the presence of the impurity, R 1 s r and R 2 s r are larger than their values in the absence of the impurity, especially at the center of the QD r = 0 . In fact, the presence of the impurity reinforces the presence of lower states and consequently increases their wavefunctions and densities due to the attractive force between the impurity and free electrons. Note that the impact of the hydrogenic impurity in the center of the QD, especially on the shift of the TOAC and its amplitude due to the huge electrostatic attraction between the impurity and the carriers, was confirmed in previous works [36,37]. In fact, the hydrogenic impurity plays a crucial role in the spread of the wavefunctions and their overlap, which in turn determines the value of the dipole matrix elements and energy separations.
In Figure 7, we display the variation in the binding energies E 1 s and E 1 p as a function of the parameter k . We noted that these energies diminished upon increasing k . This diminution reflects the huge attraction generated by the impurity located at the QD center. The ground state (1s) has greater values than the 1p state for all values of k . This can be interpreted by the fact that the 1s state is close to the impurity position, which amplifies the electrostatic attraction between them, leading to large binding energy.

3.2. Double Quartic Anharmonic Oscillator

The geometrical changes observed in the double quartic potential will certainly affect the distribution of the energy levels. To see the effect of geometrical changes in potential on the energy levels’ distribution, in Figure 8, we plot the lowest four levels as a function of k . By examining Figure 8, we can observe that the energy levels diminish rapidly for all k < 50 and then increase slowly. Furthermore, we observe that the energy of lower states E 1 s   and   E 1 p is less affected by the geometrical changes in the confining potential.
The variation in α 1 s 1 p ( ω ) as a function of incident photon energy for different values of k is given by Figure 9. We observe that the absorption’s peak moves to lower energies when k is increased from 50 to 70 , displaying red shift behavior. However, when k surpasses 70 to reach 80 , the absorption’s peak moves towards higher energies and a blue shift is observed. This result shows that the double quartic confining potential produces the two shifts (red and blue) of the TOAC by increasing the parameter k . However, the augmentation of this parameter in the case of single quartic anharmonic potential produces only a red shift of the TOAC. Furthermore, we can see clearly that the amplitude of the absorption increases at first and then diminishes. The shifts observed in the amplitudes and the peaks’ positions are related to the energy separation E 1 p E 1 s and the dipole matrix element M 12 2 . In Figure 10, we plot the variation in E 1 p E 1 s and M 12 2 as a function of the parameter k . This figure clearly shows that M 12 2 increases at first for all k < 70 and then decreases slowly. The change in M 12 2 confirms the amplitude’s variation of α 1 s 1 p ( ω ), as observed in Figure 9. Furthermore, the energy variation E 1 p E 1 s is displayed as a function of k . It diminishes at first for k < 70 and then rises gradually, which confirms the red and blue shifts of the TOAC detected in Figure 9. Note that for all values of k , the M 12 2 values in the presence of hydrogenic impurity are lower than those in the absence of it. This can be explained as follows: in the presence of hydrogenic impurity, the electron is located nearer the quantum dot center, so its wavefunction is reduced for a larger radius, and consequently the overlap between R 1 s r and R 1 p r is smaller than their overlap in the absence of the on-center impurity.
Finally, we show in Figure 11 the variation in the binding energies of the two lowest states E 1 s   a n d   E 1 p as a function of k . The binding energies decreases at first until a certain minimum obtained for k = 55   , and then remain constant. This is due to the insensitivity of the energy levels at higher values of k . In fact, when k is larger than 55   , the change in the bottom of the confining potential is reduced and the energy levels are not further affected.

4. Conclusions

As is well known, the vibrational interactions between atoms and molecules are better explained by using anharmonic potentials, which are more consistently realistic than harmonic ones, to describe these interactions. The efficiency of anharmonic (single and double quartic) potentials is obtained especially when studying diatomic molecules such as AHO, where the energy levels are not equally spaced. Therefore, because of these potentials’ importance, we have studied the electronic and optical properties of on-center hydrogenic spherical GaAs quantum dots based on single and double quartic potentials. The wavefunctions obtained by solving Schrödinger’s Equation were used to compute the dipole matrix elements and the energy separations, as well as the TOAC and the binding energies. Our results indicate that the structural parameter k in both potentials plays a crucial role in tuning the TOAC. In the case of single quartic potential, increasing k produces a blue shift; however, its augmentation in the case of double quartic potential displays a blue shift at first, and then a red shift. The binding energy dependence on parameter k was also commented on in the presence of each potential. The present study of the TOAC in spherical QDs with the presence of hydrogenic impurity can be useful for experimental applications in new devices based on anharmonic potentials.

Author Contributions

N.A.A.: Conceptualization, Formal analysis, Investigation, Software, Writing—original draft. W.B.: Conceptualization, Formal analysis, Investigation, Software, Writing—original draft. N.S.A.-S.: Formal analysis, Investigation, Software. H.D.: Conceptualization, Formal analysis, Investigation, Software, Writing—original draft. F.U.: Conceptualization, Formal analysis, Investigation, Software. S.W.: Conceptualization, Formal analysis, Investigation, Software, Writing—original draft. All authors have read and agreed to the published version of the manuscript.

Funding

This research work was funded by Umm Al-Qura University, Saudi Arabia, under grant number 25UQU4331235GSSR04.

Institutional Review Board Statement

Not applicable.

Informed Consent Statement

Not applicable.

Data Availability Statement

This work is new, and all the results were computed from the equations. The data that support the findings of this study are available from the corresponding author upon reasonable request.

Acknowledgments

Walid Belhadj extends their appreciation to Umm Al-Qura University, Saudi Arabia, for funding this research work through grant number 25UQU4331235GSSR04.

Conflicts of Interest

The authors declare no conflicts of interest.

References

  1. Villegas-Martínez, B.M.; Moya-Cessa, H.M.; Soto-Eguibar, F. Exact and approximated solutions for the harmonic and anharmonic repulsive oscillators: Matrix method. Eur. Phys. J. D 2020, 74, 137. [Google Scholar] [CrossRef]
  2. Panek, T.; Hoeske, A.A.; Jacob, C.R. On the choice of coordinates in anharmonic theoretical vibrational spectroscopy: Harmonic vs. anharmonic coupling in vibrational configuration interaction. J. Chem. Phys. 2019, 150, 054107. [Google Scholar] [CrossRef] [PubMed]
  3. Sharma, A.; Sastri, O.S.K.S. Numerical simulation of quantum anharmonic oscillator, embedded within an infinite square well potential, by matrix methods using Gnumeric spreadsheet. Eur. J. Phys. 2020, 41, 055402. [Google Scholar] [CrossRef]
  4. Landi, G.T.; de Oliveira, M.J. Fourier’s law from a chain of coupled anharmonic oscillators under energy-conserving noise. Phys. Rev. E 2013, 87, 052126. [Google Scholar] [CrossRef]
  5. Fletcher, N.H. Harmonic? Anharmonic? Inharmonic? Am. J. Phys. 2002, 70, 1205. [Google Scholar] [CrossRef]
  6. Adelakun, A.O.; Dele, A.D. Solution of quantum anharmonic oscillator with quartic perturbation. Adv. Phys. Theor. Appl. 2014, 27, 38–43. [Google Scholar]
  7. Sous, A.J. Solution for the eigenenergies of sextic anharmonic oscillator potential V ( x ) = A 6 x 6 + A 4 x 4 + A 2 x 2 . Mod. Phys. Lett. A 2006, 21, 1675–1682. [Google Scholar] [CrossRef]
  8. Pathak, A. Generalized quantum anharmonic oscillator using an operator ordering approach. J. Phys. A Math. Gen. 2000, 33, 5607–5613. [Google Scholar] [CrossRef]
  9. Yücel, M.B.; Kasapoglu, E.; Duque, C.A. Effects of Intense Laser Field on Electronic and Optical Properties of Harmonic and Variable Degree Anharmonic Oscillators. Nanomaterials 2022, 12, 1620. [Google Scholar] [CrossRef]
  10. Sakiroglu, S.; Yücel, M.B.; Kasapoglu, E. The effects of the variable mass on the electronic and nonlinear optical properties of octic anharmonic oscillators. Eur. Phys. J. Plus 2023, 138, 946. [Google Scholar] [CrossRef]
  11. Al Sdran, N.; Maiz, F. Airy function approach and Numerov method to study the anharmonic oscillator potentials V ( x ) = Ax 2 α + B x 2 . AIP Adv. 2016, 6, 065323. [Google Scholar] [CrossRef]
  12. Maiz, F.; Alqahtani, M.M.; Al Sdran, N.; Ghnaim, I. Sextic and decatic anharmonic oscillator potentials: Polynomial solutions. Phys. B Condens. Matter 2018, 530, 101–105. [Google Scholar] [CrossRef]
  13. Gaudreau, P.; Slevinsky, R.M.; Safouhi, H. An asymptotic expansion for energy eigenvalues of anharmonic oscillators. Ann. Phys. 2013, 337, 261–277. [Google Scholar] [CrossRef]
  14. Shah, B.P. Bound state eigenfunctions of an anharmonic oscillator in one dimension: A Numerov method approach. Int. J. Adv. Appl. Math. Mech. 2014, 2, 102–109. [Google Scholar]
  15. Budaca, R.; Buganu, P.; Chabab, M.; Lahbas, A.; Oulne, M. Extended study on a quasi-exact solution of the Bohr Hamiltonian. Ann. Phys 2016, 375, 65–90. [Google Scholar] [CrossRef]
  16. Ciftci, H.; Hall, R.L.; Saad, N. Construction of exact solutions to eigenvalue problems by the asymptotic iteration method. J. Phys. A. Math. Gen. 2005, 38, 1147–1155. [Google Scholar] [CrossRef]
  17. Maiz, F.; Alqahtani, M.M.; Ghnaim, I. Sextic and decatic anharmonic oscillator potentials including odd power terms: Polynomial solutions. AIP Con. Proc. 2018, 1976, 020034. [Google Scholar]
  18. Gaudreau, P.J.; Slevinsky, R.M.; Safouhi, H. Computing energy eigenvalues of anharmonic oscillators using the double exponential Sinc collocation method. Ann. Phys. 2015, 360, 520–538. [Google Scholar] [CrossRef]
  19. Maiz, F.; AlFaify, S. Quantum anharmonic oscillator: The airy function approach. Phys. B Cond. Matt. 2014, 441, 17–20. [Google Scholar] [CrossRef]
  20. Sous, A.J. The Asymptotic Iteration Method for the Eigenenergies of the a Novel Hyperbolic Single Wave Potential. J. Appl. Math. Phys. 2015, 3, 1406–1411. [Google Scholar] [CrossRef]
  21. de Souza Dutra, A.; de Castro, A.S.; Boschi-Filho, H. Approximate analytic expression for the eigenenergies of the anharmonic oscillator V ( x ) = Ax 6 + Bx 2 . Phys. Rev. A 1995, 51, 3480–3484. [Google Scholar] [CrossRef] [PubMed]
  22. Fernandez, F.M.; Guardiola, R. Accurate eigenvalues and eigenfunctions for quantum-mechanical anharmonic oscillators. J. Phys. A Math. Gen. 1993, 26, 7169. [Google Scholar] [CrossRef]
  23. Ivanov, I.A. Sextic and octic anharmonic oscillators: Connection between strong-coupling and weak-coupling expansions. J. Phys. A Math. Gen. 1998, 31, 5697. [Google Scholar] [CrossRef]
  24. Jafarpour, M.; Afshar, D. Calculation of energy eigenvalues for the quantum anharmonic oscillator with a polynomial potential. J. Phys. A Math. Gen. 2002, 35, 87. [Google Scholar] [CrossRef]
  25. Sharma, L.K.; Fiase, J.O. Non-perturbative energy expressions for the generalized anharmonic oscillator. Eur. J. Phys. 2000, 21, 167. [Google Scholar] [CrossRef]
  26. Speliotopoulos, A.D. The general structure of eigenvalues in nonlinear oscillators. J. Phys. A Math. Gen. 2000, 33, 3809. [Google Scholar] [CrossRef]
  27. Ikhdair, S.M.; Sever, R. Am alternative simple solution of the sextic anharmonic oscillator and perturbed coulomb problems. Int. J. Mod. Phys. C 2007, 18, 1571–1581. [Google Scholar] [CrossRef]
  28. Barakat, T. The asymptotic iteration method for the eigenenergies of the anharmonic oscillator potential V ( x ) = Ax 2 α + B x 2 . Phys. Lett. A 2005, 344, 411–417. [Google Scholar] [CrossRef]
  29. Hammada, M.M.; Yahiaa, M.M.; Motawehb, H.A.; Domac, S.B. Critical potentials and fluctuations phenomena with quartic, sextic, and octic anharmonic oscillator potentials. Nucl. Phys. A 2020, 1004, 122036. [Google Scholar] [CrossRef]
  30. Alauwaji, R.M.; Dakhlaoui, H.; Algraphy, E.; Ungan, F.; Wong, B.M. Binding Energies and Optical Properties of Power-Exponential and Modified Gaussian Quantum Dots. Molecules 2024, 29, 3052. [Google Scholar] [CrossRef]
  31. Dakhlaoui, H.; Belhadj, W.; Elabidi, H.; Ungan, F.; Wong, B.M. GaAs Quantum Dot Confined with a Woods–Saxon Potential: Role of Structural Parameters on Binding Energy and Optical Absorption. Inorganics 2023, 11, 401. [Google Scholar] [CrossRef]
  32. Tas, H.; Sahin, M. The inter-sublevel optical properties of a spherical quantum dot-quantum well with and without a donor impurity. J. Appl. Phys. 2012, 112, 053717. [Google Scholar] [CrossRef]
  33. Altuntas, I.; Dakhlaoui, H.; Mora-Ramos, M.E.; Ungan, F. Combined effects of electric, magnetic, and intense terahertz laser fields on the nonlinear optical properties in GaAs/GaAlAs quantum well with exponentially confinement potential. Eur. Phys. J. Plus 2023, 136, 1174. [Google Scholar] [CrossRef]
  34. Dakhlaoui, H.; Altuntas, I.; Mora-Ramos, M.E.; Ungan, F. Numerical simulation of linear and nonlinear optical properties in heterostructure based on triple Gaussian quantum wells: Effects of applied external fields and structural parameters. Eur. Phys. J. Plus 2021, 136, 894. [Google Scholar] [CrossRef]
  35. Dakhlaoui, H. Influence of doping layer concentration on the electronic transitions in symmetric AlxGa(1-x)N/GaN double quantum wells. Opt.—Int. J. Light Electron Opt. 2013, 124, 3726–3729. [Google Scholar] [CrossRef]
  36. Ed-Dahmouny, A.; Arraoui, R.; Jaouane, M.; Fakkahi, A.; Sali, A.; Es-Sbai, N.; El-Bakkari, K.; Zeiri, N.; Duque, C.A. The influence of the electric and magnetic fields on donor impurity electronic states and optical absorption coefficients in a core/shell GaAs/Al0.33Ga0.67As ellipsoidal quantum dot. Eur. Phys. J. Plus 2023, 138, 774. [Google Scholar] [CrossRef]
  37. Ed-Dahmouny, A.; Sali, A.; Es-Sbai, N.; Arraoui, R.; Duque, C.A. The impact of hydrostatic pressure and temperature on the binding energy, linear, third-order nonlinear, and total optical absorption coefficients and refractive index changes of a hydrogenic donor impurity confined in GaAs/AlxGa1−xAs double quantum dots. Eur. Phys. J. Plus 2022, 137, 784. [Google Scholar] [CrossRef]
Figure 1. Single quartic single potential for different values of parameter k.
Photonics 12 00675 g001
Figure 2. Double quartic potential for different values of parameter k.
Photonics 12 00675 g002
Figure 3. Energy level variation as a function of k (dashed lines (Z = 1); solid lines (Z = 0)).
Photonics 12 00675 g003
Figure 4. TOAC α 1 s 1 p ( ω ) as a function of incident photon energy for different values of k .
Photonics 12 00675 g004
Figure 5. Dipole matrix element M 12 2 and energy variation for different values of k (dashed lines (Z = 1); solid lines (Z = 0)).
Photonics 12 00675 g005
Figure 6. R n l ( r ) variation in the three lowest states ( 1 s ,   2 s ,   and   1 p ) for four different values of k .
Photonics 12 00675 g006
Figure 7. Binding energy variation as a function of k .
Photonics 12 00675 g007
Figure 8. Energy level variation as a function of k (dashed lines (Z = 1); solid lines (Z = 0)).
Photonics 12 00675 g008
Figure 9. TOAC α 1 s 1 p ( ω ) as function of incident photon energy for different values of k .
Photonics 12 00675 g009
Figure 10. Diploe matrix element M 12 2 and energy variation E 1 p E 1 s for different values of k (dashed lines (Z = 1); solid lines (Z = 0)).
Photonics 12 00675 g010
Figure 11. Binding energy variation as a function of k .
Photonics 12 00675 g011
Disclaimer/Publisher’s Note: The statements, opinions and data contained in all publications are solely those of the individual author(s) and contributor(s) and not of MDPI and/or the editor(s). MDPI and/or the editor(s) disclaim responsibility for any injury to people or property resulting from any ideas, methods, instructions or products referred to in the content.

