Abstract
A spatial light modulator (SLM) is a key element in several applications, but it is subject to surface deformation due to manufacturing imperfections or environmental factors. Therefore, the current study aims to analyze and compensate for such deformations in a phase-only SLM using a Michelson interferometer. The recorded interferogram represents the interference between the wavefront reflected from the SLM surface (object wave) and a reference wave. Noise in the recorded interferogram can degrade the accuracy of phase measurements. Various digital filtering techniques were applied to improve the signal-to-noise ratio (SNR) of the interferogram. The filtered interferogram enabled accurate phase extraction through Fourier transform processing and side peak selection using a spatial carrier frequency method. Additionally, phase errors caused by the tilt of the reference beam were corrected. Thereafter, the conjugate of the corrected phase distribution was used to calculate a phase-only computer-generated hologram (CGH), which was displayed on the SLM to compensate for surface deformations. The effectiveness of the proposed compensation procedure was confirmed by a second phase measurement, which demonstrated improved SLM performance. This study highlights the impact of combining the interferometric techniques with digital processing for precise surface deformation analysis.
1. Introduction
A spatial light modulator (SLM) is becoming a valuable tool in optics laboratories due to its ability to be incorporated into various applications. These applications include beam shaping [1], optical metrology [2], programmable optical elements [3], optical tweezers [4], computer-generated holography [5], quantitative phase imaging [6], telecommunication [7], laser material processing [8], and optical coherence tomography [9]. The fundamental operation of an SLM is based on modulating the amplitude and/or phase of the incident light beam, which is similar to a deformable mirror [10]. A phase-only SLM is commonly based on liquid crystal on silicon (LCOS) which comprises an LCOS panel. The panel is driven by a control unit and composed of three main layers with a sandwich structure [11]: glass cover, liquid crystal (LC) mixture, and LCOS backplane. The amplitude and/or the phase modulation is controlled via the LC layer, where the effective refractive index of LC molecules is electrically controlled for each pixel depending on the displayed grayscale image on the SLM. The predefined gamma curve provided by the manufacturer determines the phase response to the displayed grayscale values. Alternatively, the user should generate the gamma curve that characterizes the SLM using different approaches, such as double-pinhole diffraction measurement [12].
However, the actual phase response of a phase-only SLM can exhibit pixel-to-pixel variations due to the manufacturing process, which causes the curvature of the silicon backplane and the non-uniform thickness of the glass and LC layers [13]. Additionally, the phase response of an SLM is influenced by ambient laboratory conditions, such as the power and wavelength of the laser used and the environmental noise [14]. Moreover, temperature variations have a non-negligible effect on the performance of the SLM [15].
On the other hand, the performance of the SLM in different applications is highly dependent on its technical specifications, including pixel pitch, fill factor, number of pixels, and maximum phase modulation. Therefore, it is crucial to consider these parameters in the design of the experimental setups in an analogous way to SLM-based phase retrieval [16]. Several studies have demonstrated that the efficiency of SLMs can be enhanced by modifying their global lookup table (LUT). Such methods include intensity correlation [17] and interferometry [18]. Rujia Li and Liangcai Cao [19] explored the key phase calibration methods of SLMs which address non-linear phase response, pixel crosstalk, and temporal instabilities. Digital holography is widely used to correct the phase errors of SLMs [20]. The authors of [21] proposed a digital holography microscopy-based method for SLM characterization, involving both global and local phase calibration.
In particular, interference-based methods, including holography, are widely recognized for their exceptional ability to provide precise phase and surface measurements, often with nanometer sensitivity. Their sensitivity arises from the interference of coherent light waves, enabling the detection of small changes in the optical path length [22,23]. The fringe patterns obtained from the interferometric measurement serve as the basis for extracting the phase distribution of the optical system. This process, known as phase extraction, converts the intensity variations in the fringe pattern into quantitative phase information. Two widely used phase extraction methods are (i) temporal phase-shift algorithms [24], which rely on the acquisition of multiple fringe patterns with known phase shifts (e.g., , and ), and (ii) spatial carrier frequency methods [25], which employ the Fast Fourier Transform (FFT) to analyze a single fringe pattern with a spatially modulated carrier frequency. The extracted phase values are typically wrapped in the range of radians. An additional step known as phase unwrapping is often required to connect the wrapped phase values to the physical quantities being measured. After unwrapping, the phase is converted into desired physical quantities, such as surface deformations, displacements, or refractive index variations, through a process called phase conversion [26].
However, the presence of noise can significantly affect the accuracy of phase extraction and conversion. Noise can arise from various sources, including unstable or imperfect laser modes [27], misalignments or imperfections in optical components, and environmental factors such as vibration or air turbulence. These disturbances introduce errors into the measured phase values, complicating subsequent analysis. It is also important to emphasize that the efficiency of the phase conversion process is highly dependent on the configuration and precise calibration of the optical measurement system. Proper system alignment, stable illumination, and high-quality optical components are essential to minimize noise and maximize measurement accuracy. Noise reduction through filtering or compensation techniques is often necessary to ensure reliable phase measurements and meaningful physical interpretations.
Therefore, the current study focuses on measuring the surface deformations of a phase-only SLM using a Michelson interferometer. Errors in the measured phase introduced by the tilt of the reference beam were corrected by exploiting the relationship between the tilt in the spatial domain and its shift in the Fourier domain. Specifically, the carrier frequency of the reference beam was identified in the Fourier domain, and the corresponding peak was shifted to the center of the frequency spectrum to compensate for this tilt. A constant phase map () was displayed on the SLM, and the resulting interferogram was recorded. Consequently, the effects of the noise, which may be multiplicative or additive, on the measured interferogram were investigated. Different digital filtering techniques were applied on the interferogram, the signal-to-noise (SNR) ratio was measured for each applied filter, and then the filter that yielded the maximum SNR was selected.
To enhance measurement efficiency, the spatial carrier frequency method was employed, enabling phase extraction from a single interferogram. The extracted phase values were conjugated and converted into a computer-generated hologram (CGH). This conjugated CGH was displayed on the SLM to compensate for the measured phase errors and deformations. The effectiveness of the proposed compensation process was validated by analyzing the interferogram recorded after displaying the conjugated CGH on the SLM. This approach provided a comprehensive assessment of both surface deformations and the noise impacts on the measurement process.
It is worth mentioning that the Michelson interferometer is not a new setup to investigate the phase errors of the SLM. However, the aim of the current study is not only to compensate for the phase errors of the SLM used and the existing noise but also to compensate for any other errors arising from the constructed setup. Our ultimate goal is to use this setup to characterize different lenses (contact, bulk, and intraocular) by replacing the traditionally used deformable mirror (DM) with an SLM for aberration correction. Once the phase errors and noise of the SLM have been compensated, the SLM will be used to correct the measured aberrations of both the test lens and all optical components, as the SLM has a higher resolution than the DM.
2. Filtering of Noise from the Recorded Interferograms
An interferogram represents the interference pattern between a known reference wave and an object wave. The object wave, , is defined as the diffracted or refracted wave from the object with its complex amplitude expressed as follows [28]:
In Equation (1), the vector denotes the three-dimensional spatial coordinates, is the amplitude, and is the spatially dependent phase term reflecting the optical path traveled by the object wave and the state of the measured object. This expression is consistent with scalar diffraction theory [29]. Since visible light oscillates at frequencies around Hz, direct phase measurement with a camera is not possible. To extract phase information, the object wave must coherently interfere with a reference wave, which is expressed as follows:
where and are the amplitude and phase of the reference wave, respectively.
Noise in the recorded interferogram arises from multiple sources, including ambient light, vibration, optical surface imperfections (e.g., surface irregularities of the SLM), dust particles, and speckle noise from the laser. Noise can be broadly categorized into additive and multiplicative phase noise (speckle) [14]. Additive noise, , results from ambient light, optical surfaces, and electronic measurement components. Multiplicative phase noise, , is caused by the laser beam. The recorded interferogram intensity can be expressed as a superposition of the object and the reference beams affected by both types of noise. Using a tilted reference wave introduces a spatial carrier frequency , and thus, the interferogram intensity can be expressed as follows [25]:
is the 2D spatial coordinate of the camera plane, is the background illumination, is the fringe contrast, and is the phase difference to be estimated. The interferogram data grid is a regular pixel array.
To improve the SNR, a low-pass filter with a moving-average convolution mask is applied to the interferogram, effectively suppressing multiplicative noise in Equation (3). This procedure is based on the Central Limit Theorem (CLT) [30], which ensures that a filtered random process with finite mean and variance approximates Gaussian statistics, regardless of the original noise distribution. By applying the Euler relation to the cosine term in Equation (3), the interferogram can be rewritten as follows [31]:
where
Applying the discrete Fourier transform (DFT) to Equation (4) yields
where is the 2D spatial frequency vector. The amplitude spectrum exhibits Hermitian symmetry due to the real nature of . The term contains the zero-order peak, while and correspond to the carrier frequency components . Bandpass filtering isolates a carrier peak (e.g., ), suppressing low-frequency noise and high-frequency speckle noise.
A straightforward compensation procedure can be performed in the Fourier domain to compensate for the unknown tilt of the reference wave in the interferometric measurement. This process begins by isolating the diffraction order (denoted as ) from the Fourier spectrum of the interferogram using a bandpass filter or mask, as mentioned above. Once the order is selected, the centroid of the isolated region is determined using, for example, a centroid calculation function available in MATLAB R2021a. The coordinates of the calculated centroid define the carrier frequency components . Then, shifting the order to the center of the Fourier spectrum corrects the tilt induced by the reference wave in the spatial domain. Subsequently, an inverse Fourier transform is applied to reconstruct the complex amplitude of the object wave. The phase of the object wave is then retrieved by calculating the argument of the complex amplitude, specifically as the arctangent of the ratio of the imaginary part to the real part of the reconstructed complex amplitude. This allows the object phase to be retrieved using
This compensation process efficiently removes the influence of the tilted reference wave, ensuring an accurate phase retrieval for further analysis.
3. Simulation Results
Our simulation procedure started with the simulation image shown in Figure 1a. The image shows a simulated phase function of two circles on a surface, with phases of and . The noise was added to the image using Gaussian white noise. Therefore, the simulation image with added noise, a “noisy image”, was compared to the original simulation image “with no noise” in terms of the SNR. This comparison was performed pixel by pixel. Hence, the SNR in decibels (dB) was calculated for both images as follows:
where is the mean intensity of the pixels (summed squared magnitude) in the image and is the standard deviation of the noise.
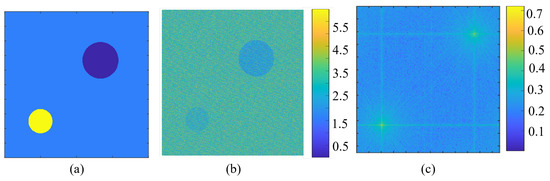
Figure 1.
(a) A simulated phase function at the beam splitter consists of two circles, with a size of pixels and a radius of 100 pixels and with a size of pixels and a radius of 150 pixels, without noise. (b) The interferogram of the image (a) at the beam splitter with added noise. (c) The Fourier transform of the interferogram at the beam splitter. Note that the simulated image size is ) pixels.
The reference beam is tilted at an angle of . The interference between the tilted reference beam and the object beam with added noise at the beam splitter is shown in Figure 1b. The Fourier transform of the simulated interferogram at the beam splitter is shown in Figure 1c. From Figure 1c, it is clear that there is a side peak and its conjugate, from which the phase distribution caused by surface irregularities can be easily extracted, as discussed in Section 2. The extracted phase is wrapped around the range of radians, as shown in Figure 2a. The measured phase was unwrapped by assigning reliability values to each pixel based on the variance of the phase derivative [32]. Consequently, edges between adjacent pixels were created with values equal to the sum of the connected pixels’ reliabilities, and unwrapping proceeds by processing each edge in order, combining a group of pixels and adjusting their relative phase values. The two-dimensional unwrapped phase is shown in Figure 2b.
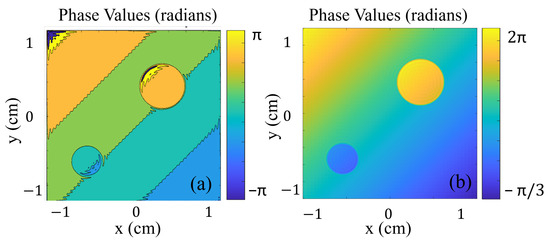
Figure 2.
(a) The extracted phase values using the inverse Fourier transformation of the interferogram, wrapped at radians, and (b) the unwrapped phase values in the range of radians.
To investigate different digital filtering techniques for noise removal and improving the SNR, noise was added to the simulated image in a ratio of 1:1. Noise reduction methods involve the use of linear filters (that is, convolution and Wiener) and a non-linear filter (that is, median) [33], where their obtained results were compared in terms of the SNR. The median filter is a static filter that replaces the value of a center pixel with the median value of the window, removing the existing noise. The convolution filter utilizes a kernel matrix which is multiplied element-wise with the neighboring pixels, and the sum is placed in the center pixel. The Wiener filter is an adaptive filter to minimize the mean square error (MSE). The results show that the untreated noisy interferogram image has an SNR of dB. After applying the median filter, the SNR improves to dB, while the convolutional approach results in an SNR of dB. The Wiener filter gives an SNR of dB. Based on these results, the median filter provides the highest SNR of dB.
4. Experimental Setup
The basic principle for measuring the optical flatness and surface deformations of a phase-only SLM is based on a Michelson interferometer configuration. The experimental setup used to measure and compensate for the surface deformations of the phase-only SLM is shown in Figure 3. This setup consists of a He-Ne laser source with a wavelength of nm, a microscope objective (MO), a spatial filter (SF), two lenses ( with a focal length of mm and with a focal length of mm), a beam splitter (BS), a reference mirror (M), a half-waveplate and an analyzer (P) and (A), the SLM itself, and a CCD camera.
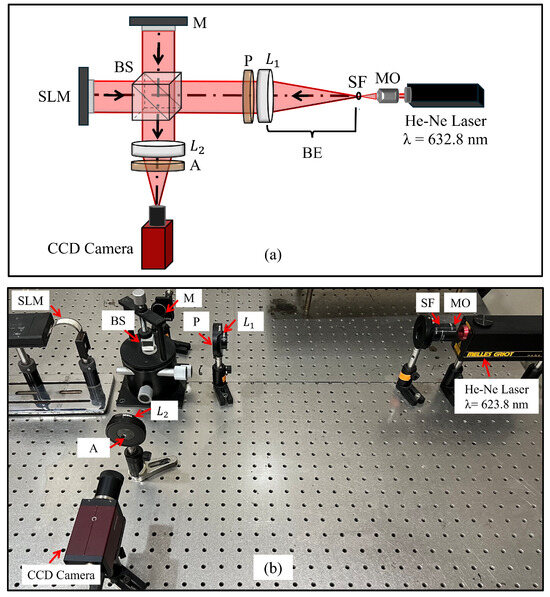
Figure 3.
The experimental setup of a Michelson interferometer was used to measure and compensate for the surface deformations of a phase-only SLM: (a) schematic layout and (b) a lab photo. MO: microscope objective; SF: spatial filter; : collimating lens with a focal length of mm; P: half-waveplate; BS: beam splitter; M: reference mirror; SLM: a phase-only spatial light modulator; : imaging lens with a focal length of mm; A: analyzer.
The system starts with a continuous-wave He-Ne laser beam with a wavelength of nm (Melles Griot, Carlsbad, CA, USA). This laser beam is expanded and collimated to a diameter of 20 mm using a beam expander (BE) consisting of the microscope objective (MO), a spatial filter (SF), and a plano-convex lens (). The expanded and collimated laser beam is then directed onto a non-polarizing cube beam splitter (BS) designed for visible light (400–700 nm) with a 50:50 splitting ratio. The beam splitter splits the incoming laser beam into two identical beams: one beam is directed to the reference mirror (M) and the other is incident on the reflective surface of the phase-only SLM. It is noted that LC SLMs are high-resolution devices with millions of pixels, where each individually addressable element allows the phase of the light to be modified with a typical precision of better than [34]. Thus, the efficiency of the resulting measurements is not affected by the discretization of these devices. However, addressing large phase steps between neighboring pixels (e.g., transition from to ) introduces pixel crosstalk which reduces the precision of the phase modulation. This could be compensated for by modifying the CGH to be displayed on the SLM [35].
It is important to note that the SLM under investigation is manufactured by HOLOEYE Photonics (model: Pluto; resolution: pixels; pixel pitch: μm). As the SLM consists of birefringent LC molecules, the polarization direction of the linearly polarized laser beam should be aligned parallel to the slow axis of the LC molecules in the SLM. This alignment is achieved by placing a half-waveplate (P) in front of the SLM and an analyzer (A) behind it to ensure that the laser light interacts correctly with the LC molecules.
The two beams, one reflected from the reference mirror (M) and the other from the SLM surface, are recombined by BS, creating an interference pattern. The interference pattern was resized to fit into the field of view of the CCD camera using the plano-convex lens (). In this way, the plane reference wave is modulated with so that it becomes a spherical reference wave with a radius of curvature of mm. To compensate for the reference wave, it is necessary to simulate the spherical reference wave numerically using the following:
with k being the wavenumber.
In a typical experiment, a constant phase map, , was displayed on the SLM and the resulting interference pattern was recorded for further analysis. An example of the full camera image of the interferogram is shown in Figure 4.
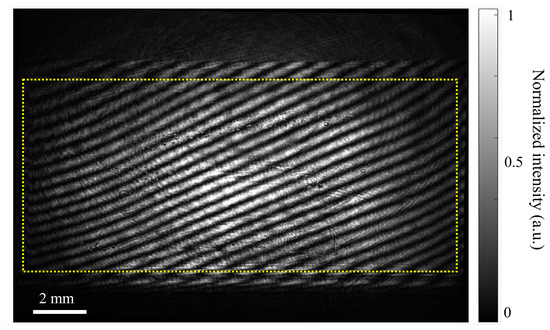
Figure 4.
The interferogram was recorded after displaying a constant phase map on the SLM with . The yellow rectangle highlights the active area of the SLM () pixels. The fringes appear across the active area of the SLM inside the yellow rectangle, while the outer fringes originate from the inactive area (behaving as a mirror) of the SLM.
5. Experimental Results
5.1. Noise Reduction and Phase Extraction
The untreated interference pattern obtained after passing through the plano-convex lens () is shown in Figure 5. It has a pixel resolution. Three filtering techniques were employed to improve the SNR of the interferogram. Initially, the untreated interferogram had an SNR of dB. The results demonstrated that the median filtering provided an SNR of dB. The convolutional smoothing filter yielded an SNR of dB. The Wiener filter gave an SNR of dB. Among these, the median filtered image had the best SNR of dB. Therefore, the median filtered image was selected for further processing to extract phase information.
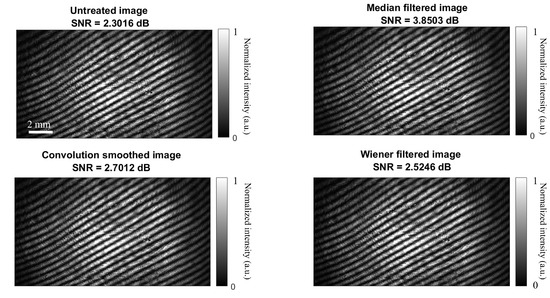
Figure 5.
The measured interferogram with different filtering approaches to improve the SNR.
The values of the SNR for both simulation and experiment were compared as depicted in Figure 6. The median filter consistently achieved the highest SNR values for both the simulation and the experimental results, with an SNR of approximately dB for the simulation and dB for the experiment. This can be attributed to its ability to effectively eliminate outliers and high-frequency noise components while preserving the structural integrity of the phase information. These results confirm the choice of the median filter as the optimal filtering technique for our phase measurement and compensation procedure.
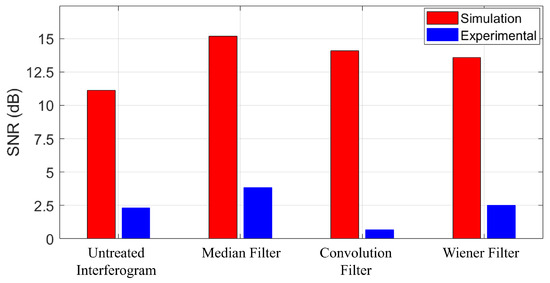
Figure 6.
Comparative analysis of SNR values of simulation and experimental results for different filtering approaches.
5.2. Surface Deformation Compensation Based on the Estimated Phase
To achieve an optically flat surface using phase-only SLM, it is essential to compensate for the inherent surface deformations. The proposed procedure involves the following key steps:
- Reconstructing the phase map of the SLM surface after noise reduction and reference wave compensation;
- Modeling of residual deformations using a two-dimensional polynomial fit;
- Displaying the inverted fitted phase function as a compensation map on the SLM;
- Verification of the flatness of the SLM surface through interferometric measurements and phase analysis.
To compensate for the reference wave, a sampled form of Equation (9) is derived using the following:
Here, μm is the camera pixel pitch in the current experiment and are axis components of the vector . Now, the final phase at the hologram plane can be calculated taking Equations (7) and (10) into account as follows:
where is the argument operation for obtaining the phase from a complex number. Figure 7 shows the phase (calculated using Equation (11)) of the spherical wave simulated numerically using Equation (10) based on the experimental configuration parameters.
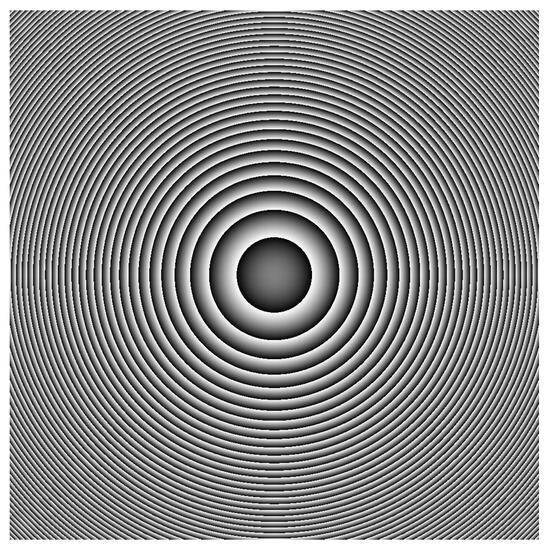
Figure 7.
Unwrapped phase distribution of the spherical wave resulting after mm. The phase varies in the range of and the image size is pixels with a pixel pitch of the camera of μm.
The surface deformation map was reconstructed using the phase values obtained after noise reduction and reference wave compensation. Hence, the reconstructed phase, , represents the optical path difference caused by the surface irregularities of the SLM. The residual deformation of the SLM surface could be extracted by removing any constant phase shift or systematic aberrations, leaving only localized deviations from flatness. A two-dimensional polynomial fitting of the third degree in both x and y including all mixed terms was used to model these residual deformations. The polynomial including the coefficients has the following form:
Figure 8a shows the reconstructed phase map of the SLM surface, while Figure 8b shows the fitted phase profile obtained by a two-dimensional polynomial fit calculated using Equation (12). It is noted that the standard phase deviation measured from an ideal flat surface was rad . The fitted phase function, representing the residual deformation, is inverted and displayed on the SLM to counteract the surface irregularities and the illumination beam residuals. It should be noted that this image is converted to an 8-bit image ranging from 0 to 255, enabling a full phase modulation of the phase modulation of the SLM. This approach effectively flattens the optical surface of the SLM by introducing a compensatory phase distribution.
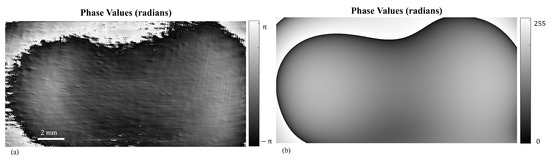
Figure 8.
(a) The reconstructed phase map of the SLM surface after noise reduction and reference wave compensation, and (b) the fitted phase profile of the SLM surface based on a two-dimensional polynomial model given by Equation (12).
To verify the effectiveness of the compensation process, the interferogram is re-recorded after the compensation map is displayed on the SLM. The reconstructed phase map, shown in Figure 9, shows a significant reduction in surface deformation, resulting in an almost flat optical surface. In terms of root mean square (RMS), the measured standard phase deviation of the SLM surface from an ideal flat surface before compensation was rad (), a deviation of approximately . After applying the compensation technique, this deviation was significantly reduced to rad (), equivalent to μm, or a deviation of only . This reduced deviation corresponds to a surface flatness of , calculated with , where h is the height, n is the refractive index of the liquid crystal (LC), and nm using of the LC at this wavelength [36]. These results highlight the effectiveness of the proposed method in minimizing surface deformation and improving the phase uniformity of the SLM. A quantitative analysis of the residual errors confirms the success of the compensation procedure.
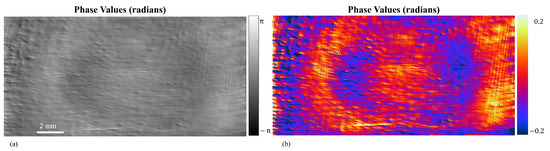
Figure 9.
(a) Reconstructed phase map of the SLM surface after applying the compensation map, demonstrating a nearly flat surface. (b) The same phase map as in (a), but with an adjusted dynamic range to highlight the detailed phase residuals remaining after compensation.
By implementing this compensation process, the optical flatness of the SLM is restored, enabling its use in high-precision optical applications. The results demonstrate the effectiveness of this method in minimizing surface deformations and achieving a uniform phase distribution.
6. Conclusions
This study demonstrates a robust approach to measuring and compensating for surface deformations of a phase-only SLM using a Michelson interferometer in combination with the spatial carrier frequency method. The phase was extracted using a single interferogram, which in turn simplifies the process and reduces experimental complexity. The effect of noise on the measured interferogram was investigated. Different digital filtering techniques were applied and the effectiveness of each one was evaluated by measuring the SNR. The median filter provided the highest SNR improvement; the initial SNR for the untreated interferogram was 2.3016 dB and the SNR obtained by applying the median filter was 3.8503 dB. The median filtered interferogram was selected for further phase information extraction. The conjugate of the extracted phase was converted into a phase-only CGH to compensate for the measured phase errors. The results obtained confirm the effectiveness of the compensation method in reducing surface deformation. Before compensation, the SLM had a standard deviation of rad from an ideal flat surface, a deviation of . After compensation, the deviation was significantly reduced to rad, or only phase deviation compared to a flat surface. This reduced deviation corresponds to a surface flatness of . This agrees well with the supplier’s reference measurement. The interferometric approach ensures high precision and sensitivity in detecting phase deviations, making it a powerful tool to characterize and improve the performance of SLMs. These results highlight the practical effectiveness of the proposed approach in achieving a uniform SLM surface, which is critical for applications that require high optical precision.
Author Contributions
Conceptualization, M.A. and S.H.E.; methodology, R.M.A., M.A. and S.H.E.; software, R.M.A., M.A. and S.H.E.; validation, R.M.A., M.A. and S.H.E.; formal analysis, R.M.A., M.A. and S.H.E.; investigation, R.M.A. and M.A.; resources, R.M.A.; data curation, R.M.A.; writing—original draft preparation, R.M.A., M.A. and S.H.E.; writing—review and editing, R.M.A., M.A. and S.H.E.; visualization, M.A.; supervision, S.H.E.; project administration, M.A. and S.H.E. All authors have read and agreed to the published version of the manuscript.
Funding
This research received no external funding.
Institutional Review Board Statement
Not applicable.
Informed Consent Statement
Not applicable.
Data Availability Statement
The raw data supporting the conclusions of this article will be made available by the authors upon request.
Conflicts of Interest
The authors declare no conflicts of interest.
Abbreviations
The following abbreviations are used in this manuscript:
| SLM | Spatial light modulator |
| LCOS | Liquid crystal on silicon |
| LC | Liquid crystal |
| LUT | Lookup table |
| CGH | Computer-generated hologram |
| SNR | Signal-to-noise ratio |
| MSE | Mean square error |
| RMS | Root mean square |
References
- Maxson, J.M.; Bartnik, A.C.; Bazarov, I.V. Efficient and accurate laser shaping with liquid crystal spatial light modulators. Appl. Phys. Lett. 2014, 105, 171109. [Google Scholar] [CrossRef]
- Falldorf, C.; Agour, M.; Von Kopylow, C.; Bergmann, R.B. Phase retrieval for optical inspection of technical components. J. Opt. 2012, 14, 065701. [Google Scholar] [CrossRef]
- Bawart, M.; Bernet, S.; Ritsch-Marte, M. Programmable freeform optical elements. Opt. Express 2017, 25, 4898–4906. [Google Scholar] [CrossRef] [PubMed]
- Cai, Y.; Yan, S.; Wang, Z.; Li, R.; Liang, Y.; Zhou, Y.; Li, X.; Yu, X.; Lei, M.; Yao, B. Rapid tilted-plane Gerchberg-Saxton algorithm for holographic optical tweezers. Opt. Express 2020, 28, 12729–12739. [Google Scholar] [CrossRef]
- Abdelazeem, R.M.; Agour, M. Color holographic visualization of an abnormal retina: A training guide. In Proceedings of the 2022 4th Novel Intelligent and Leading Emerging Sciences Conference (NILES), Giza, Egypt, 22–24 October 2022; IEEE: Piscataway, NJ, USA, 2022; pp. 186–189. [Google Scholar]
- Ibrahim, D.G.A.; Abdelazeem, R.M. Quantitative phase imaging by automatic phase shifting generated by phase-only spatial light modulator. In Proceedings of the Frontiers in Optics, Washington, DC, USA, 1–4 November 2021; Optical Society of America: Washington, DC, USA, 2021; p. JTh5A.104. [Google Scholar]
- Crossland, W.; Wilkinson, T.; Manolis, I.; Redmond, M.; Davey, A. Telecommunications applications of LCOS devices. Mol. Cryst. Liq. Cryst. 2002, 375, 1–13. [Google Scholar] [CrossRef]
- Olakanmi, E.O.; Cochrane, R.F.; Dalgarno, K.W. A review on selective laser sintering/melting (SLS/SLM) of aluminium alloy powders: Processing, microstructure, and properties. Prog. Mater. Sci. 2015, 74, 401–477. [Google Scholar] [CrossRef]
- Gardner, M.R.; Lewis, A.; Park, J.; McElroy, A.B.; Estrada, A.D.; Fish, S.; Beaman, J.J.; Milner, T.E. In situ process monitoring in selective laser sintering using optical coherence tomography. Opt. Eng. 2018, 57, 041407. [Google Scholar] [CrossRef]
- Abdel-Harith, M.; Abdelazeem, R.M.; Hamdy, O.; Abdel-Salam, Z. Adaptive optics-based wavefront-enhanced laser-induced fluorescence (WELIF) for improved analytical performance. Anal. Methods 2023, 15, 212–220. [Google Scholar] [CrossRef] [PubMed]
- Abdelazeem, R.M.; Ahmed, M.M.; Hassab-Elnaby, S.; Agour, M. Adaptive phase control of a phase-only spatial light modulator using the Shack-Hartmann wavefront sensor. Appl. Opt. 2024, 63, G54–G62. [Google Scholar] [CrossRef]
- Bergeron, A.; Gauvin, J.; Gagnon, F.; Gingras, D.; Arsenault, H.H.; Doucet, M. Phase calibration and applications of a liquid-crystal spatial light modulator. Appl. Opt. 1995, 34, 5133–5139. [Google Scholar] [CrossRef]
- Chandra, A.D.; Banerjee, A. Rapid phase calibration of a spatial light modulator using novel phase masks and optimization of its efficiency using an iterative algorithm. J. Mod. Opt. 2020, 67, 628–637. [Google Scholar] [CrossRef]
- Servin, M.; Estrada, J.; Quiroga, J.; Mosiño, J.; Cywiak, M. Noise in phase shifting interferometry. Opt. Express 2009, 17, 8789–8794. [Google Scholar] [CrossRef] [PubMed]
- Takiguchi, Y.; Otsu, T.; Inoue, T.; Toyoda, H. Self-distortion compensation of spatial light modulator under temperature-varying conditions. Opt. Express 2014, 22, 16087–16098. [Google Scholar] [CrossRef] [PubMed]
- Falldorf, C.; Agour, M.; von Kopylow, C.; Bergmann, R.B. Design of an optical system for phase retrieval based on a spatial light modulator. AIP Conf. Proc. 2010, 1236, 259–264. [Google Scholar]
- Yue, H.; Song, L.; Hu, Z.; Liu, H.; Liu, Y.; Liu, Y.; Peng, Z. Characterization of the phase modulation property of a free-space electro-optic modulator by interframe intensity correlation matrix. App. Opt 2012, 51, 19. [Google Scholar] [CrossRef]
- Reichelt, S. Spatially resolved phase-response calibration of liquid-crystal-based spatial light modulators. Appl. Opt. 2013, 52, 2610–2618. [Google Scholar] [CrossRef]
- Li, R.; Cao, L. Progress in phase calibration for liquid crystal spatial light modulators. Appl. Sci. 2019, 9, 2012. [Google Scholar] [CrossRef]
- Li, R.; Gao, Y.; Cao, L. In situ calibration for a phase-only spatial light modulator based on digital holography. Opt. Eng. 2020, 59, 053101. [Google Scholar] [CrossRef]
- Yang, L.; Xia, J.; Chang, C.; Zhang, X.; Yang, Z.; Chen, J. Nonlinear dynamic phase response calibration by digital holographic microscopy. Appl. Opt. 2015, 54, 7799–7806. [Google Scholar] [CrossRef]
- Agour, M.; Falldorf, C.; Bergmann, R.B. Spatial multiplexing and autofocus in holographic contouring for inspection of micro-parts. Opt. Express 2018, 26, 28576–28588. [Google Scholar] [CrossRef]
- Yang, S.; Zhang, G. A review of interferometry for geometric measurement. Meas. Sci. Technol. 2018, 29, 102001. [Google Scholar] [CrossRef]
- Yamaguchi, I.; Liu, J.-Y.; Kato, J.-i. Active phase-shifting interferometers for shape and deformation measurements. Opt. Eng. 1996, 35, 2930–2937. [Google Scholar] [CrossRef]
- Takeda, M.; Ina, H.; Kobayashi, S. Fourier-transform method of fringe-pattern analysis for computer-based topography and interferometry. J. Opt. Soc. Am. 1982, 72, 156–160. [Google Scholar] [CrossRef]
- Huntley, J.M. Automated fringe pattern analysis in experimental mechanics: A review. J. Strain Anal. Eng. Des. 1998, 33, 105–125. [Google Scholar] [CrossRef]
- Kogelnik, H.; Li, T. Laser beams and resonators. Appl. Opt. 1966, 5, 1550–1567. [Google Scholar] [CrossRef]
- Kreis, T. Handbook of Holographic Interferometry: Optical and Digital Methods; John Wiley & Sons: Weinheim, Germany, 2004. [Google Scholar]
- Goodman, J. Introduction to Fourier Optics; Roberts and Company Publishers: Greenwood Village, CO, USA, 2005. [Google Scholar]
- Papoulis, A. Random Variables and Stochastic Processes; McGraw Hill: New York, NY, USA, 1965. [Google Scholar]
- Agour, M.; El-Farahaty, K.; Seisa, E.; Omar, E.; Sokkar, T. Single-shot digital holography for fast measuring optical properties of fibers. Appl. Opt. 2015, 54, E188–E195. [Google Scholar] [CrossRef] [PubMed]
- Herráez, M.A.; Burton, D.R.; Lalor, M.J.; Gdeisat, M.A. Fast two-dimensional phase-unwrapping algorithm based on sorting by reliability following a noncontinuous path. Appl. Opt. 2002, 41, 7437–7444. [Google Scholar] [CrossRef]
- Gonzalez, R.C. Digital Image Processing; Pearson Education India: Noida, India, 2009. [Google Scholar]
- Holoeye. Application Note: Spatial Light Modulators (SLM)—Version 6.0. Available online: https://holoeye.com/wp-content/uploads/Application_Note_SLM-V.60.pdf (accessed on 4 March 2025).
- Persson, M.; Engström, D.; Goksör, M. Reducing the effect of pixel crosstalk in phase only spatial light modulators. Opt. Express 2012, 20, 22334–22343. [Google Scholar] [CrossRef]
- Li, J. Refractive Indices of Liquid Crystals and Their Applications in Display and Photonic Devices; University of Central Florida: Orlando, FL, USA, 2005. [Google Scholar]
Disclaimer/Publisher’s Note: The statements, opinions and data contained in all publications are solely those of the individual author(s) and contributor(s) and not of MDPI and/or the editor(s). MDPI and/or the editor(s) disclaim responsibility for any injury to people or property resulting from any ideas, methods, instructions or products referred to in the content. |
© 2025 by the authors. Licensee MDPI, Basel, Switzerland. This article is an open access article distributed under the terms and conditions of the Creative Commons Attribution (CC BY) license (https://creativecommons.org/licenses/by/4.0/).