Optical Fiber Pressure Sensor with Self-Temperature Compensation Structure Based on MEMS for High Temperature and High Pressure Environment

 ,
, 
Abstract
1. Introduction
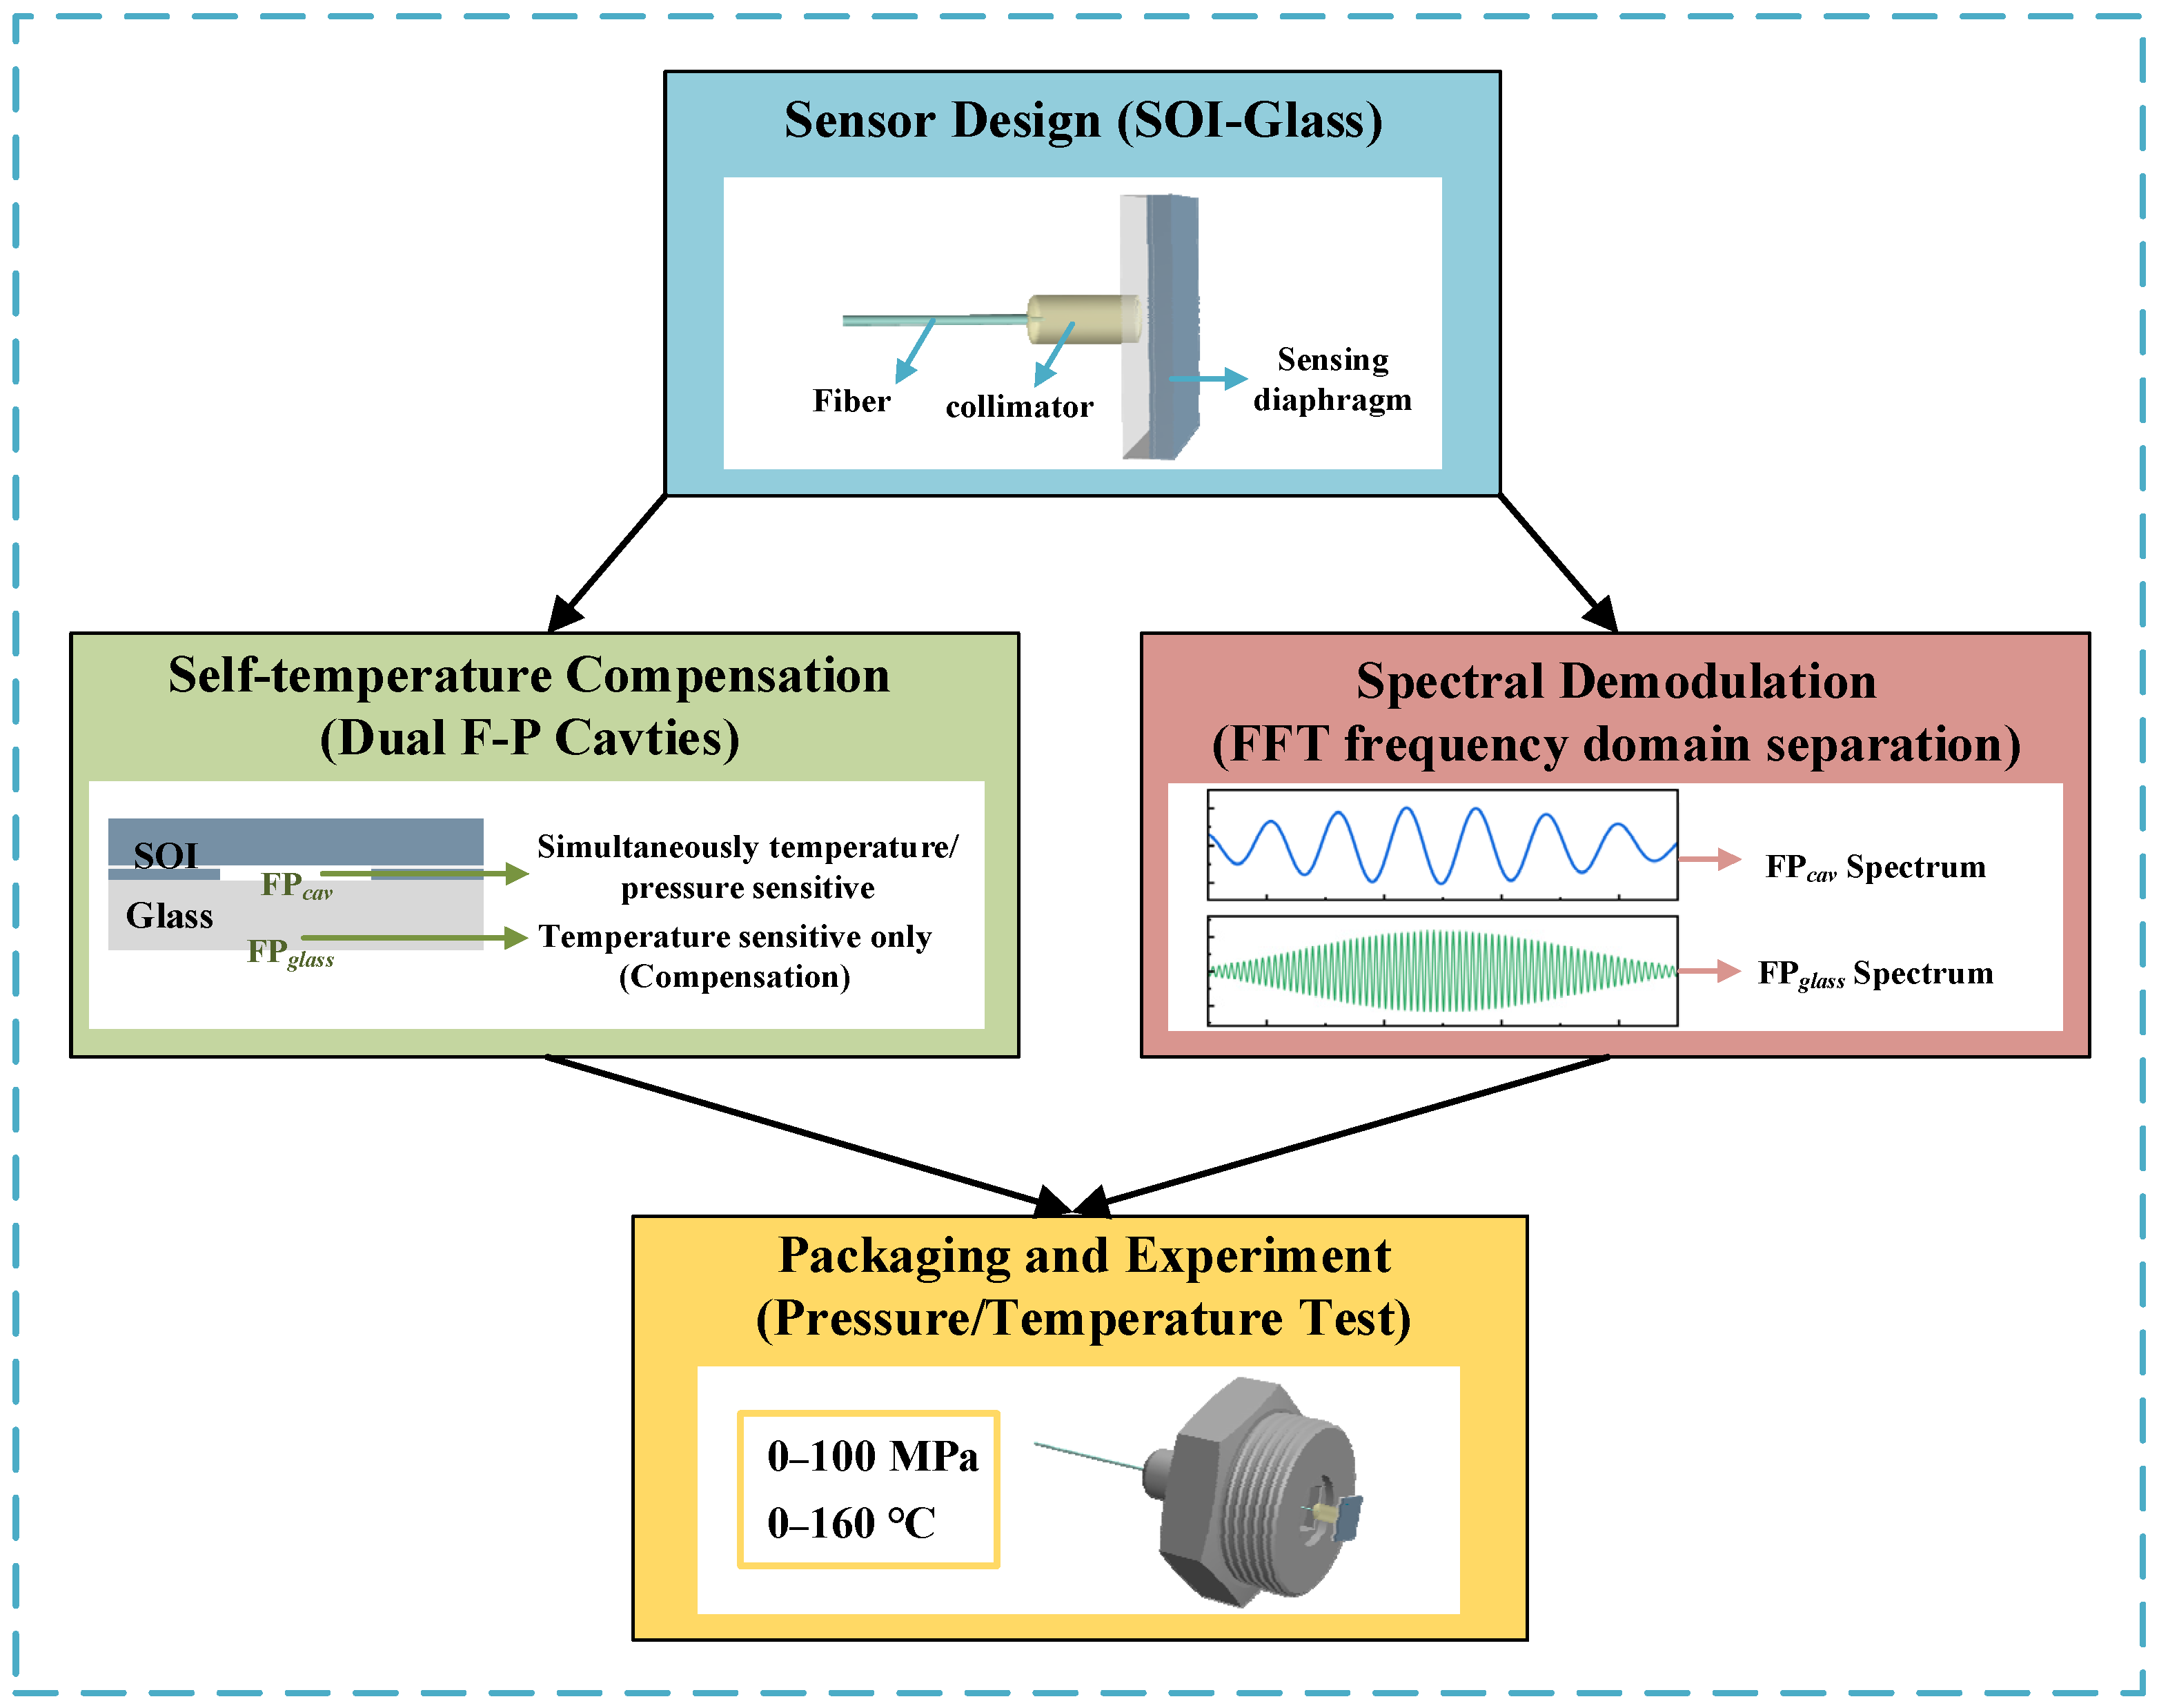
2. Methods
2.1. Fabry–Pérot Cavity Sensing Principle
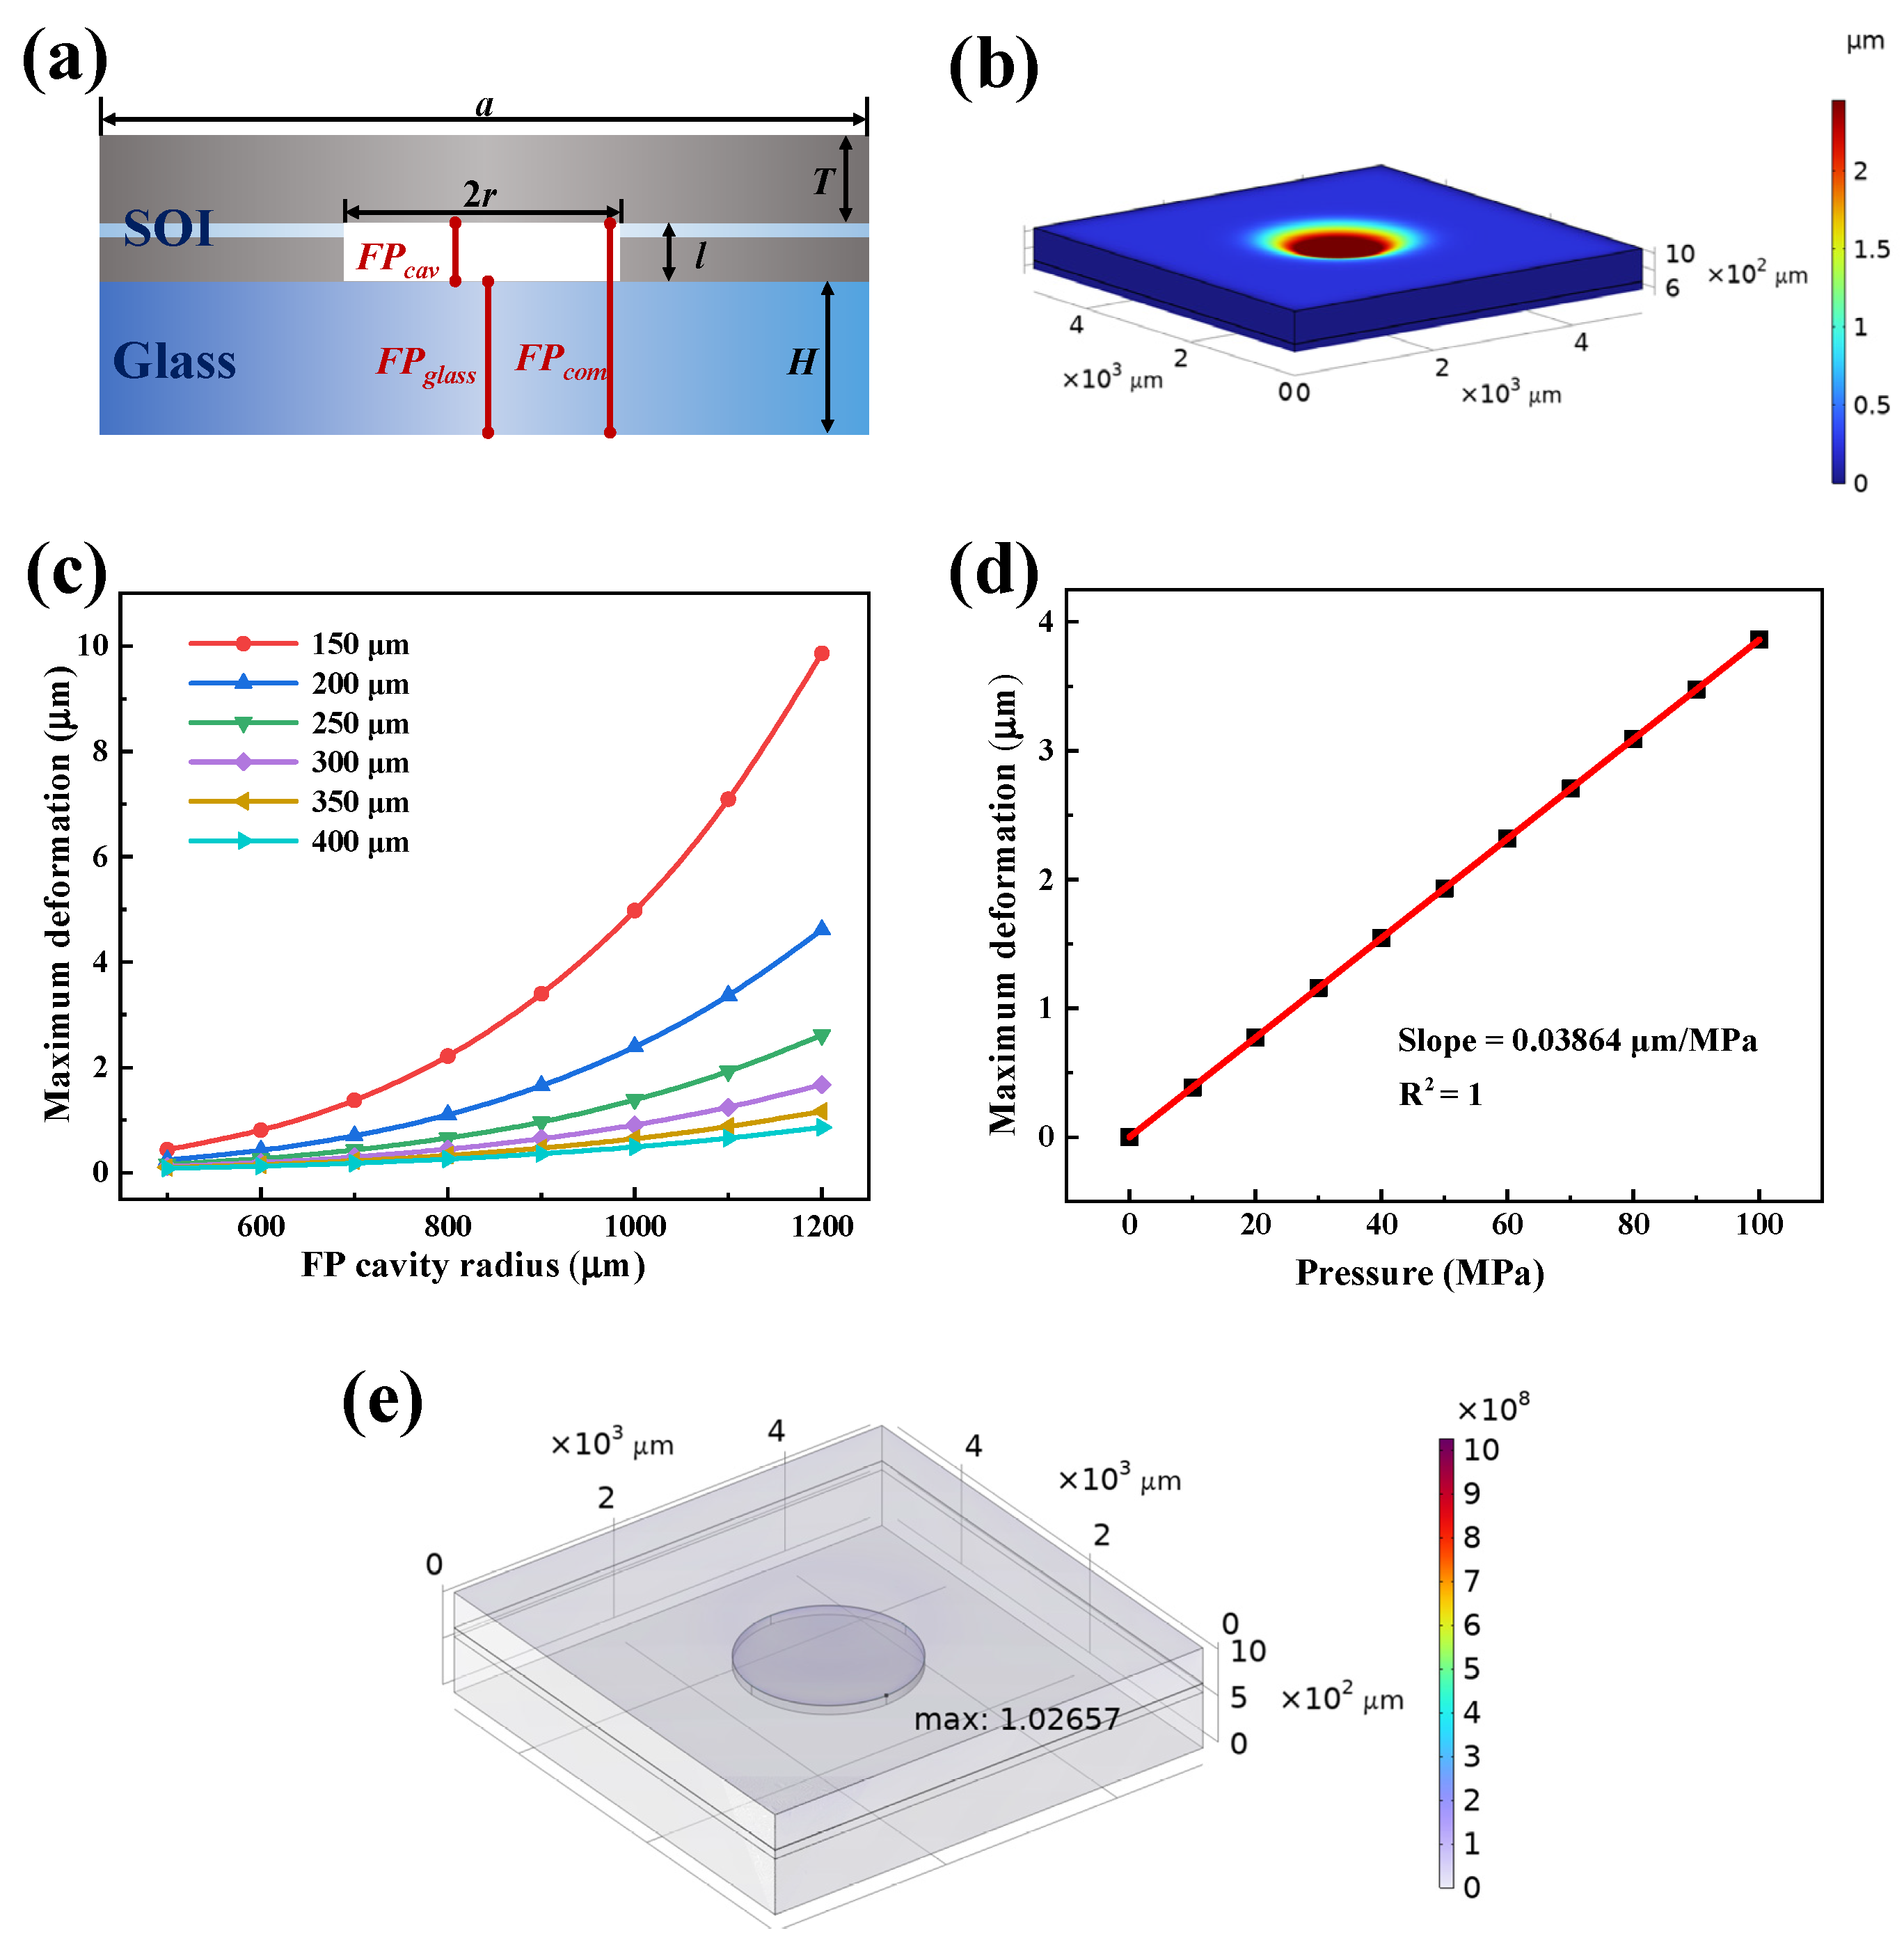
2.2. Diaphragm Deformation Principle
2.3. Mechanical Simulation
2.4. Spectra Simulation and Demodulation Algorithm
3. Fabrication
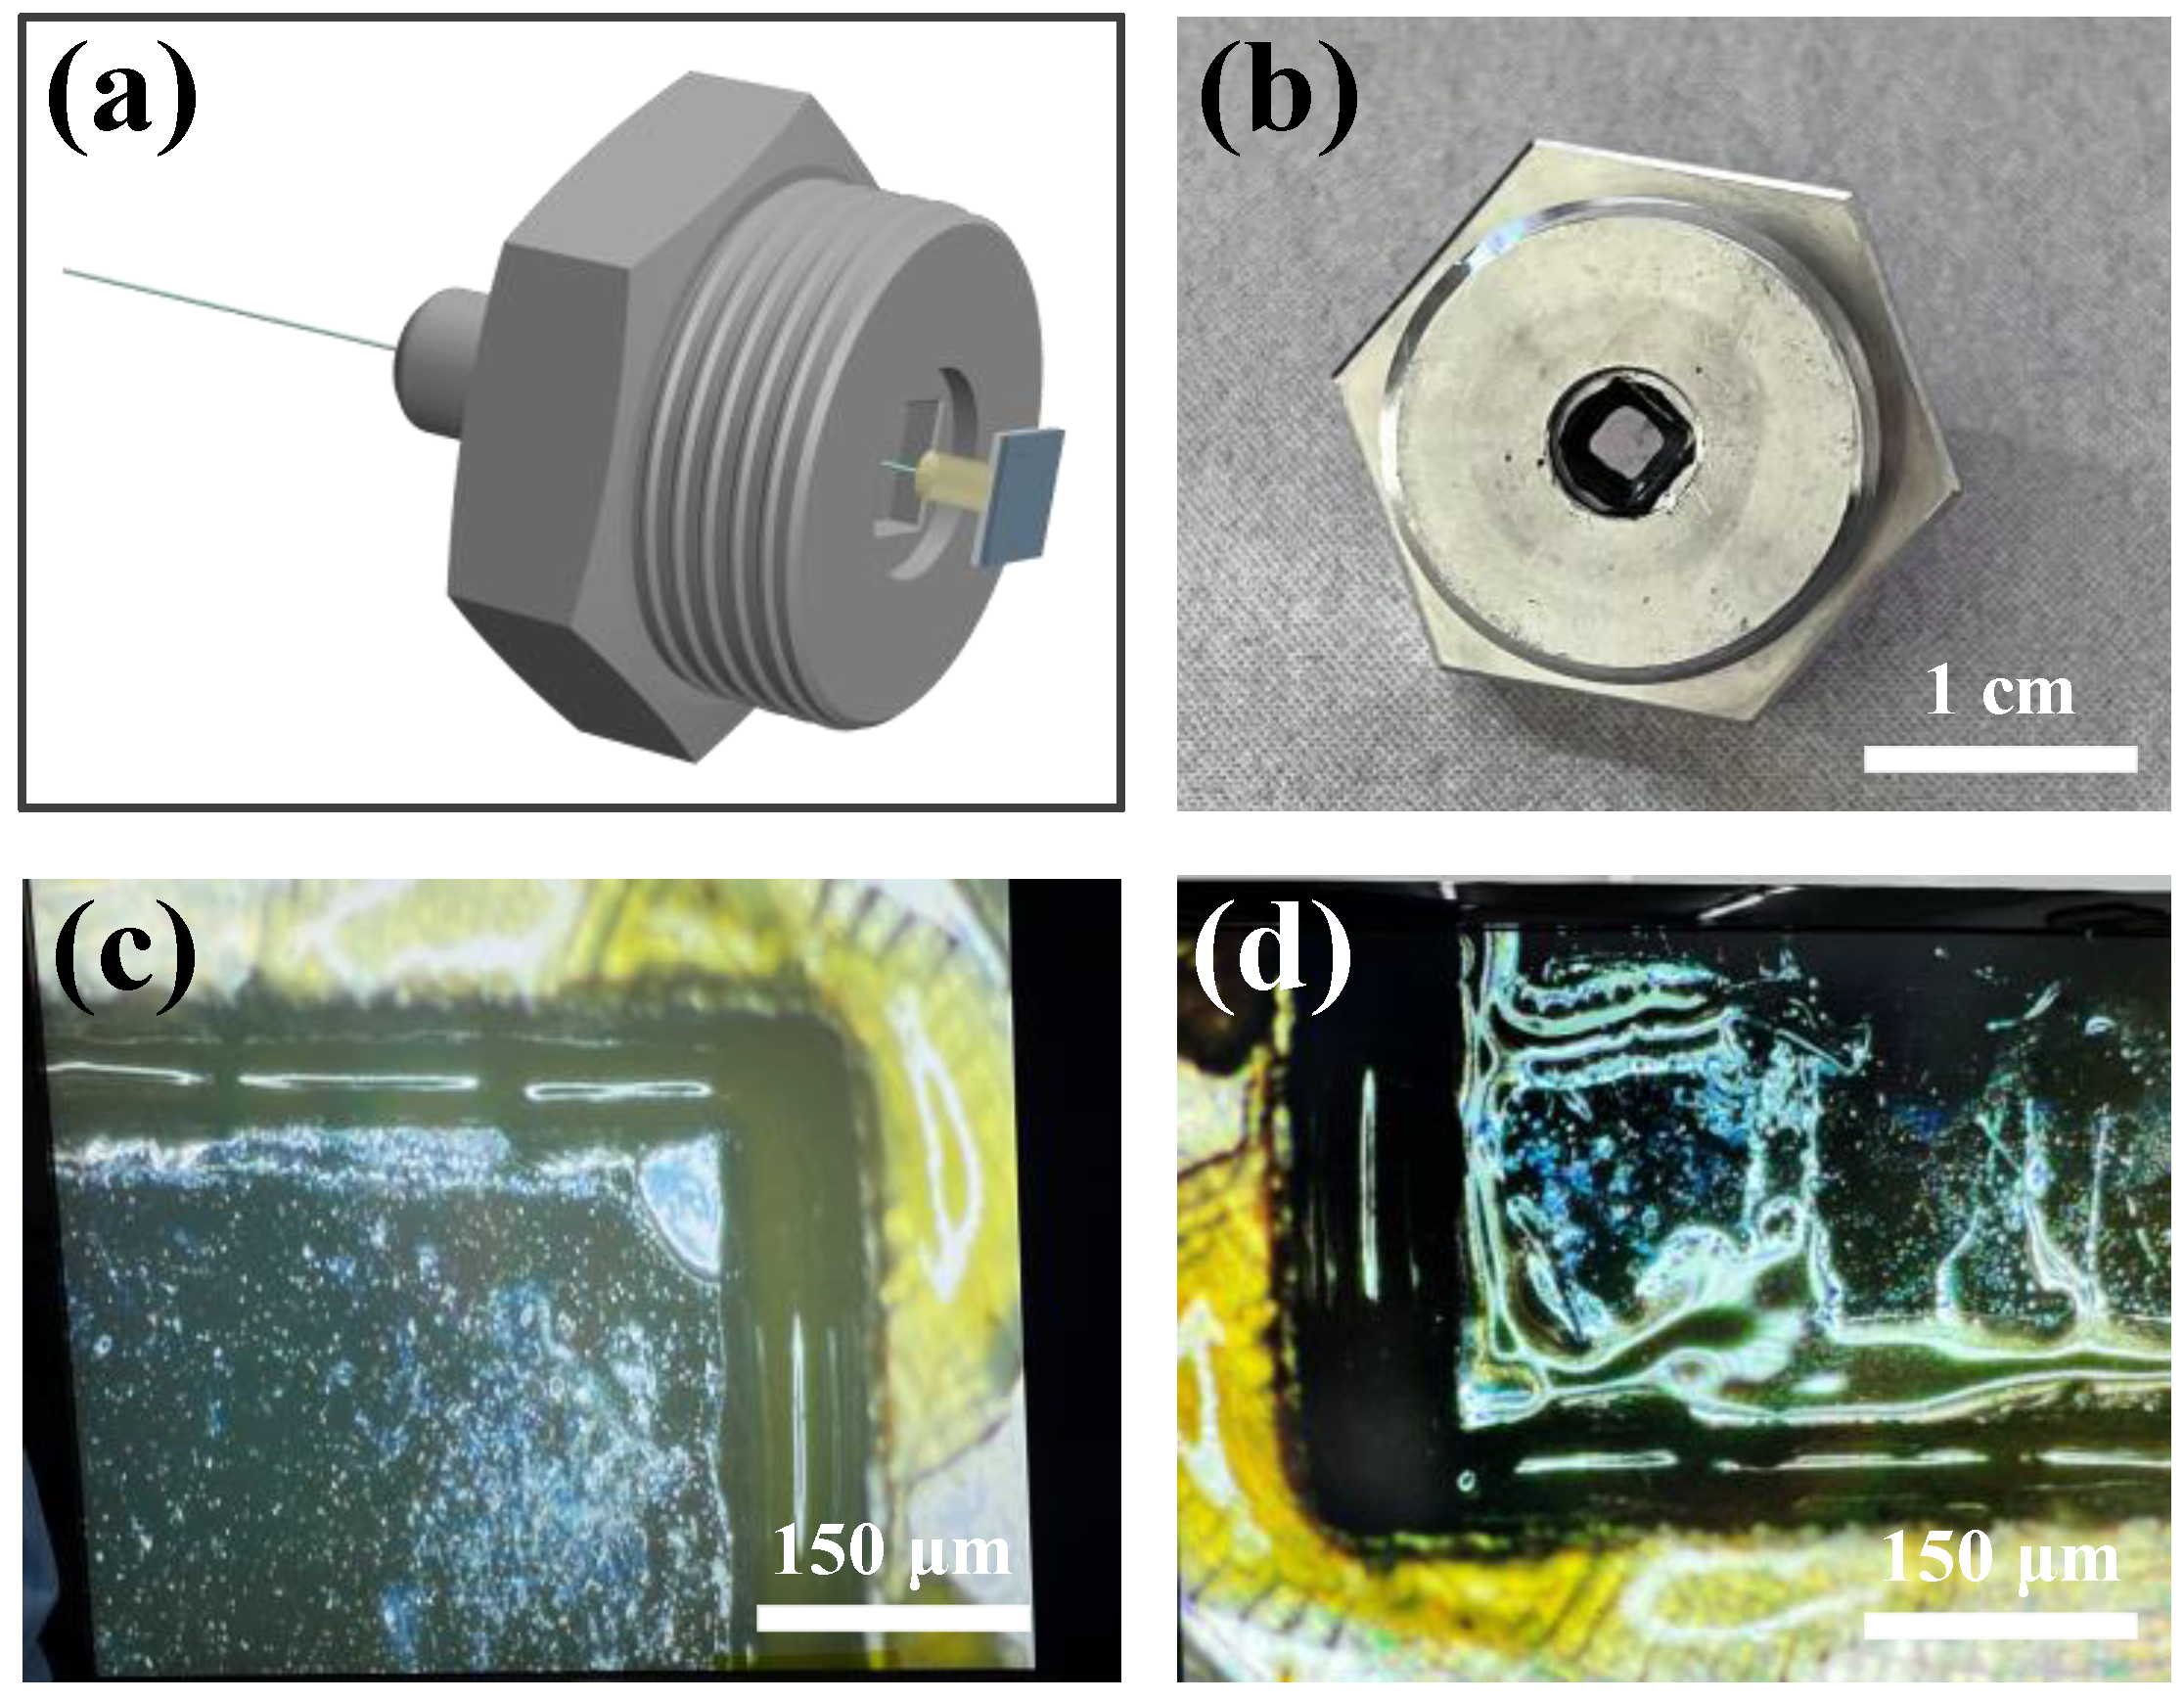
3.1. Sensor Diaphragm Fabrication
3.2. Sensor Packaging
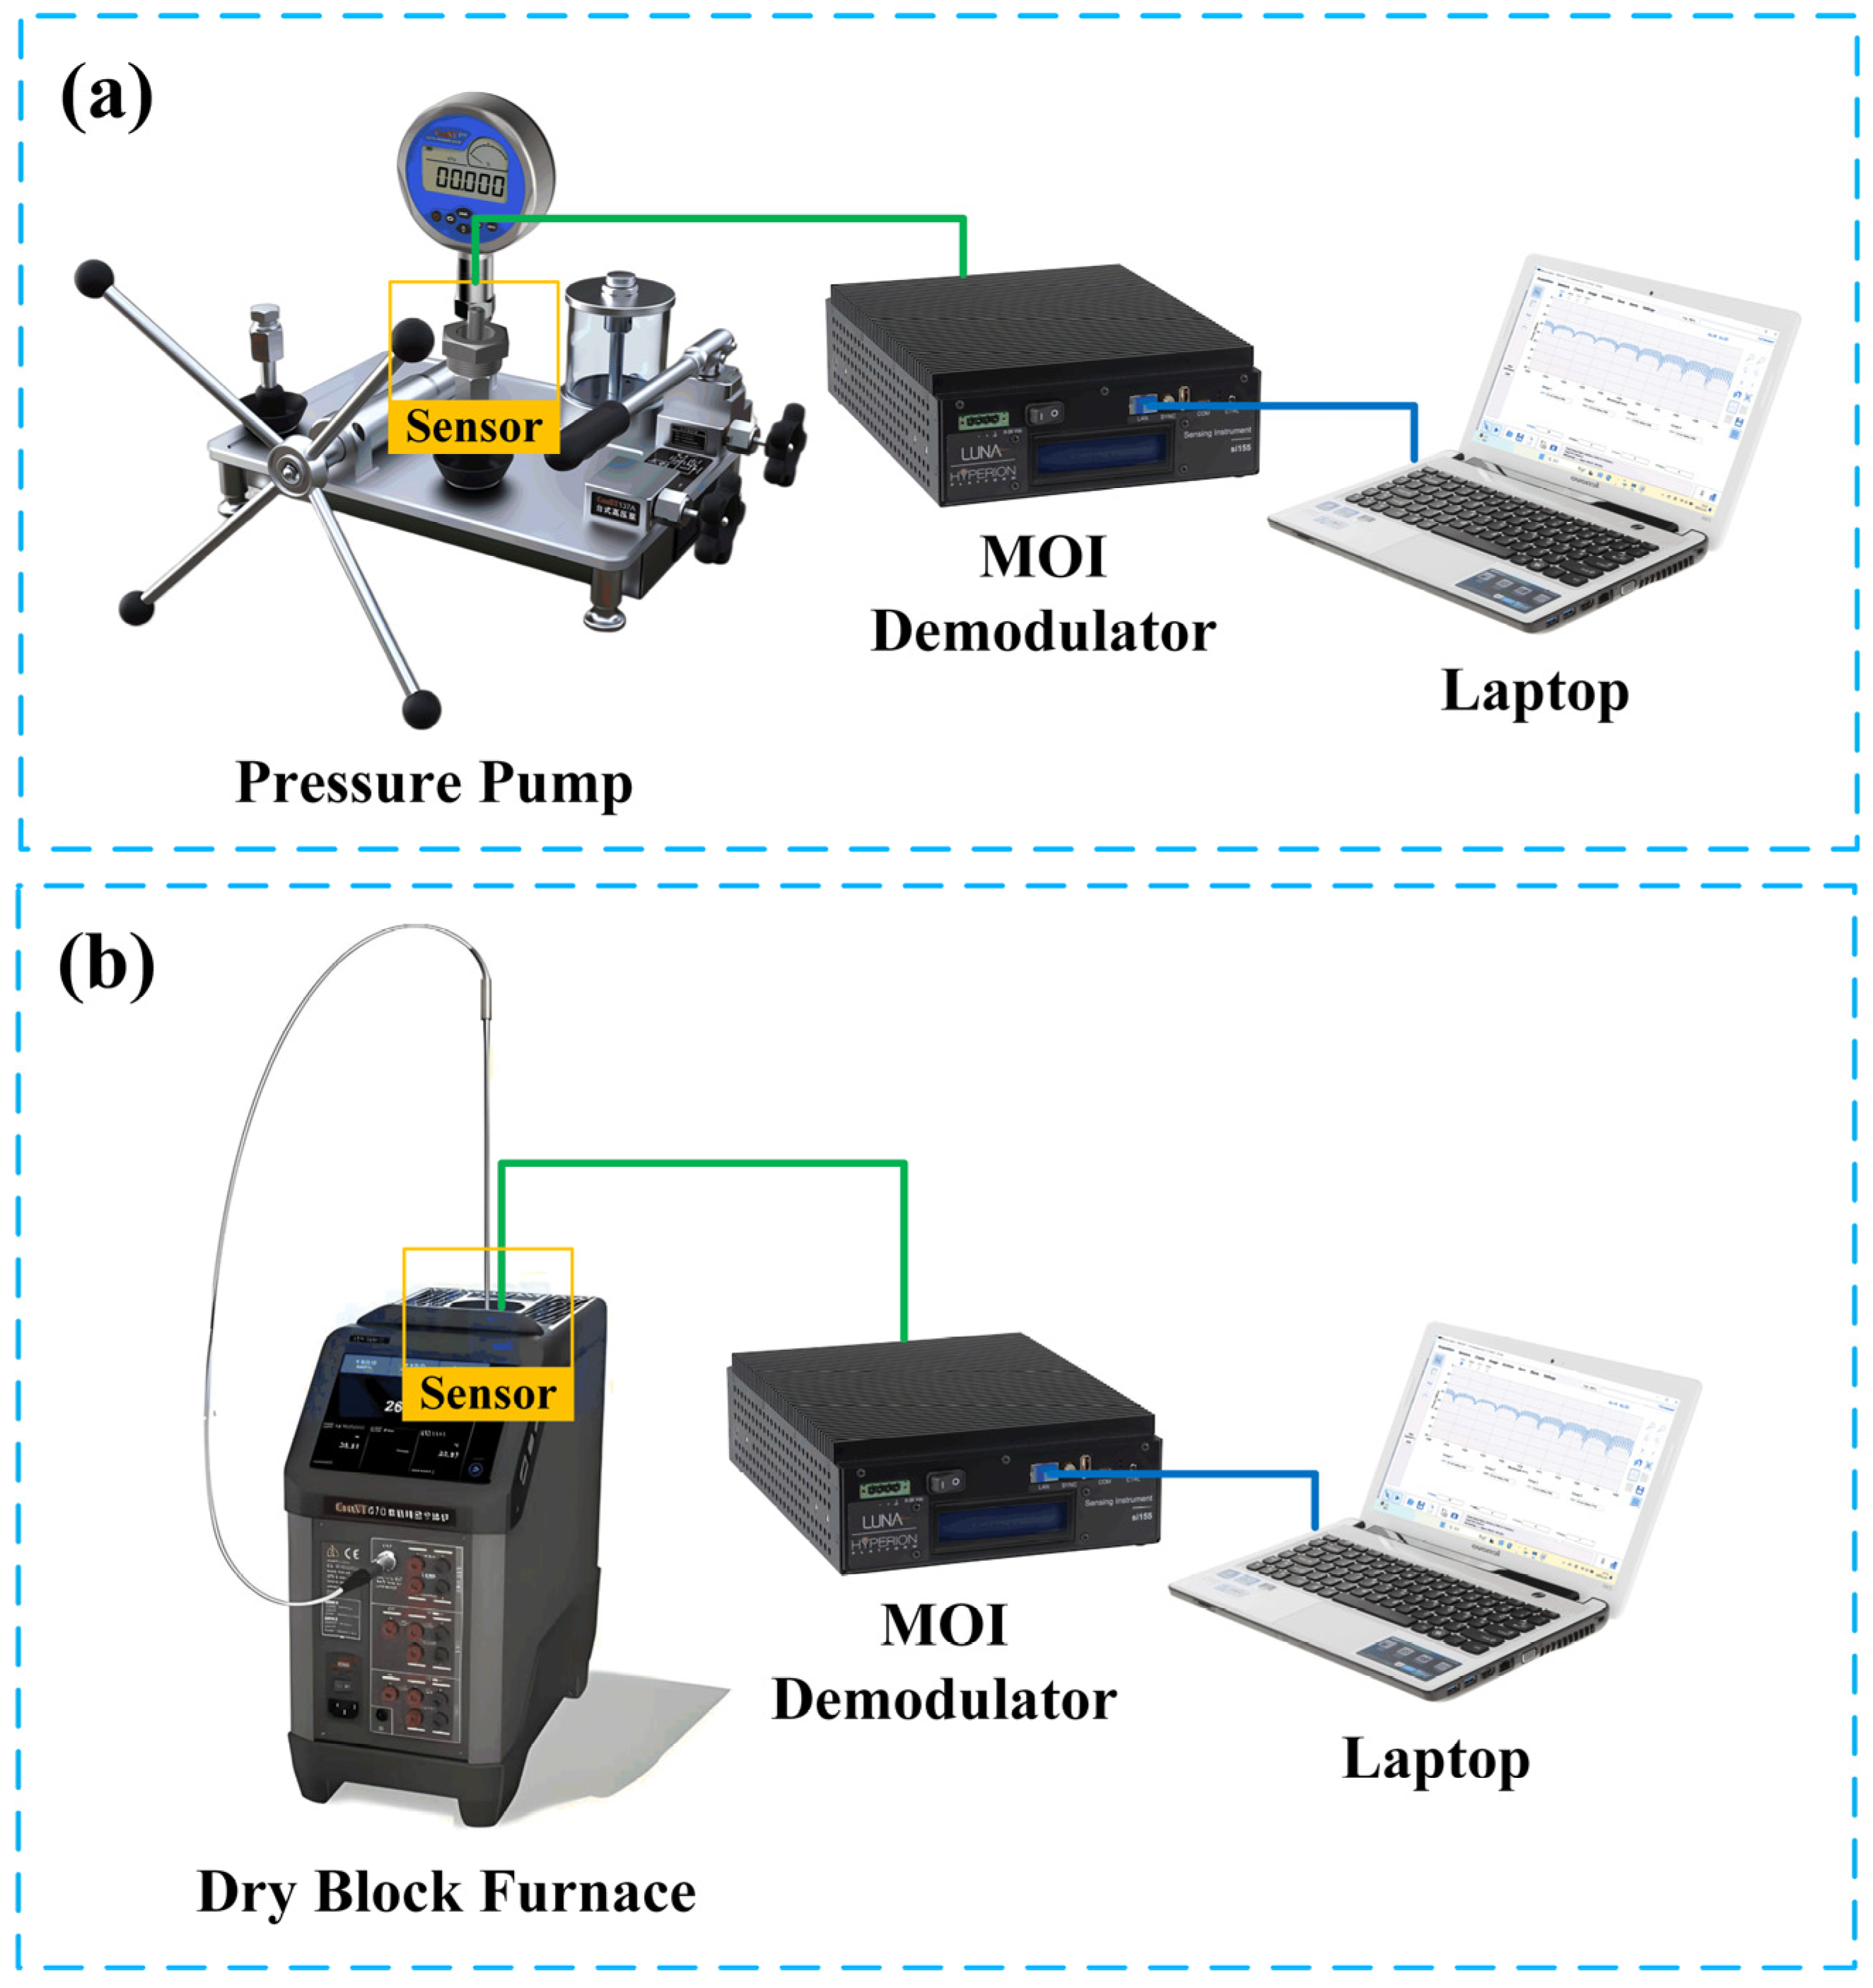
4. Setup and Experimental Results
4.1. Setup
4.2. Pressure Test
4.3. Temperature Test
5. Discussion
6. Conclusions
Author Contributions
Funding
Institutional Review Board Statement
Informed Consent Statement
Data Availability Statement
Conflicts of Interest
References
- Luo, M.; Feng, Y.; Gui, Y.; Deng, J.; Han, C. Development status and prospect of key technologies for high temperature and high pressure drilling. Pet. Sci. Bull. 2021, 2, 228–244. [Google Scholar]
- Chuang, L.; Cordovilla, F.; Jagdheesh, R.; Ocaña, J.L. Design optimization and fabrication of a novel structural SOI piezoresistive pressure sensor with high accuracy. Sensors 2018, 18, 439. [Google Scholar] [CrossRef]
- Mishra, R.B.; El-Atab, N.; Hussain, A.M.; Hussain, M.M. Recent progress on flexible capacitive pressure sensors: From design and materials to applications. Adv. Mater. Technol. 2021, 6, 2001023. [Google Scholar] [CrossRef]
- Basov, M. Research of Long-Term Stability of High Sensitivity Piezoresistive Pressure Sensors for Ultra-Low Differential Pressures. IEEE Sens. J. 2024, 24, 36443–36450. [Google Scholar] [CrossRef]
- Fan, Z.; Zhong, S.; Zhao, K.; Wang, Q.; Li, Y.; Zhang, G.; Ma, G.; Zhao, J.; Yan, H.; Huang, Z.; et al. A Hermetic Package Technique for Multi-Functional Fiber Sensors through Pressure Boundary of Energy Systems Based on Glass Sealants. Photonics 2024, 11, 792. [Google Scholar] [CrossRef]
- Fernandez, I.; Berrocal, C.G.; Rempling, R. Long-term performance of distributed optical fiber sensors embedded in reinforced concrete beams under sustained deflection and cyclic loading. Sensors 2021, 21, 6338. [Google Scholar] [CrossRef]
- Leal-Junior, A.; Díaz, C.; Frizera, A.; Lee, H.; Nakamura, K.; Mizuno, Y.; Marques, C. Highly sensitive fiber-optic intrinsic electromagnetic field sensing. Adv. Photonics Res. 2021, 2, 2000078. [Google Scholar] [CrossRef]
- Liu, P.; Liu, G.; Zhao, Q.; Wang, Y.; Li, F. A study of the development and application of fiber Bragg grating pressure sensors. In Proceedings of the 2011 Academic International Symposium on Optoelectronics and Microelectronics Technology, Harbin, China, 12–16 October 2011; pp. 232–235. [Google Scholar]
- Wei, Z.; Song, D.; Zhao, Q.; Cui, H.L. High Pressure Sensor Based on Fiber Bragg Grating and Carbon Fiber Laminated Composite. IEEE Sens. J. 2008, 8, 1615–1619. [Google Scholar] [CrossRef]
- Schroeder, R.J. High pressure and temperature sensing for the oil industry using fiber Bragg gratings written onto side hole single mode fiber. In Proceedings of the 13th International Conference on Optical Fiber Sensors, Kyongju, Republic of Korea, 12–16 April 1999; Volume 3746, pp. 462–465. [Google Scholar]
- Liu, Y.; Jing, Z.; Li, R.; Zhang, Y.; Liu, Q.; Li, A.; Zhang, C. Miniature fiber-optic tip pressure sensor assembled by hydroxide catalysis bonding technology. Opt. Express 2020, 28, 948–958. [Google Scholar] [CrossRef]
- Guo, X.; Zhou, J.; Du, C.; Wang, X. Highly Sensitive Miniature All-Silica Fiber Tip Fabry–Perot Pressure Sensor. IEEE Photonics Technol. Lett. 2019, 31, 689–692. [Google Scholar] [CrossRef]
- Zhen, Y.; Tu, X.; Zhu, J.; Tong, Y.; Liu, L.; Yao, N.; Wang, P.; Tong, L.; Zhang, L. Atomically smooth gold microflake-enabled fiber-tip Fabry–Perot interferometer for temperature and pressure sensing. ACS Appl. Mater. Interfaces 2023, 15, 35161–35169. [Google Scholar] [CrossRef]
- Gao, H.; Jiang, Y.; Cui, Y.; Zhang, L.; Jia, J.; Hu, J. Dual-Cavity Fabry–Perot Interferometric Sensors for the Simultaneous Measurement of High Temperature and High Pressure. IEEE Sens. J. 2018, 18, 10028–10033. [Google Scholar] [CrossRef]
- Ma, J.; Ju, J.; Jin, L.; Jin, W. A Compact Fiber-Tip Micro-Cavity Sensor for High Pressure Measurement. IEEE Photonics Technol. Lett. 2011, 24, 1561–1563. [Google Scholar] [CrossRef]
- Zhao, Q.; Liu, X.; Ma, L.; Zhao, W.; Wang, H. Optical fiber pressure sensor based on FP cavity in the oil and gas well. IOP Conf. Ser. Earth Environ. Sci. 2017, 64, 012007. [Google Scholar] [CrossRef]
- Li, M.; Wang, M.; Li, H. Optical MEMS pressure sensor based on Fabry-Perot interferometry. Opt. Express 2006, 14, 1497–1504. [Google Scholar] [CrossRef] [PubMed]
- Tian, B.; Zhan, F.; Han, F.; Li, K.; Zhao, N.; Yang, N.; Jiang, Z. An optical fiber Fabry–Pérot micro-pressure sensor based on beam-membrane structure. Meas. Sci. Technol. 2018, 29, 125104. [Google Scholar] [CrossRef]
- Li, J.; Jia, P.; Wang, J.; Liu, J.; An, G.; Xiong, J. Silica-MEMS-based Fiber-optic Fabry-Perot Pressure Sensor for High-temperature Applications. Acta Photonica Sin. 2022, 51, 0606005. [Google Scholar]
- Feng, F.; Jia, P.; Qian, J.; Hu, Z.; An, G.; Qin, L. High-Consistency Optical Fiber Fabry–Perot Pressure Sensor Based on Silicon MEMS Technology for High Temperature Environment. Micromachines 2021, 12, 623. [Google Scholar] [CrossRef]
- Zhang, T.; Jiang, Y.; Ma, W. A high fineness optical fiber FP pressure sensor based on MEMS. Laser Optoelectron. Prog. 2019, 56, 170625. [Google Scholar] [CrossRef]
- Fu, Y.; Wang, R.; Tang, W.; Du, X.; Wang, W.; Chen, H. MEMS silicon-glass fiber-optic FP pressure sensor for high-pressure measurements. Chin. Opt. 2024, 17, 771. [Google Scholar]
- Qi, X.; Wang, S.; Jiang, J.; Liu, K.; Wang, X.; Yang, Y. Fiber optic Fabry-Perot pressure sensor with embedded MEMS micro-cavity for ultra-high pressure detection. J. Light. Technol. 2019, 37, 2719–2725. [Google Scholar] [CrossRef]
- Wang, Z.; Jiang, Y.; Ding, W.; Gao, R. A cross-correlation based fiber optic white-light interferometry with wavelet transform denoising. In Proceedings of the Fourth Asia Pacific Optical Sensors Conference, Wuhan, China, 15–18 October 2013; Volume 8924, pp. 222–225. [Google Scholar]
- Chen, H.; Liu, J.; Zhang, X.; Wang, W.; Ma, Z.; Lv, W.; Guo, Z. High-Order Harmonic-Frequency Cross-Correlation Algorithm for Absolute Cavity Length Interrogation of White-Light Fiber-Optic Fabry-Perot Sensors. J. Light. Technol. 2020, 38, 953–960. [Google Scholar] [CrossRef]
- Liu, Y.; Zhang, T.; Wang, Y.; Yang, D.; Liu, X.; Fu, H.; Jia, Z. Simultaneous measurement of gas pressure and temperature with integrated optical fiber FPI sensor based on in-fiber micro-cavity and fiber-tip. Opt. Fiber Technol. 2018, 46, 77–82. [Google Scholar] [CrossRef]
- Guo, M.; Zhang, Q.; Su, Z.; Zhu, H.; Liang, R.; Zhang, C.; Wang, B.; Guo, B.; Zheng, Y.; Chen, J.; et al. Simultaneous Measurement of Gas Pressure and Temperature Sensor Based on F-P Interference Using Hollow Core Bragg Fiber. IEEE Sens. J. 2024, 24, 39028–39034. [Google Scholar] [CrossRef]
- Gangopadhyay, T.K. Prospects for fibre Bragg gratings and Fabry-Perot interferometers in fibre-optic vibration sensing. Sens. Actuators A Phys. 2004, 113, 20–38. [Google Scholar] [CrossRef]
- Ge, Y.; Cai, K.; Wang, T.; Zhang, J. MEMS pressure sensor based on optical Fabry–Perot interference. Optik 2018, 165, 35–40. [Google Scholar] [CrossRef]
- Zhang, P.; Zhu, Y.; Chen, W. A Study on Fourier Transformation Demodulating Theory of the Gap of Optical Fiber Fabry-Perot Sensor. Acta Photonica Sin. 2004, 33, 1449–1452. [Google Scholar]
- Liu, D.; Wang, W.; Wang, K.; Liu, B. Optical Hybrid Sensor Based on EFPI-FBG Structure. J. Astronaut. Metrol. Meas. 2023, 43, 51. [Google Scholar]
- Hu, Y.; Cao, L.; Nie, S.; Liu, Q.; Xie, F.; Peng, X.; Zhu, Y.; Han, J.; Chen, X.; Wang, L.; et al. MEMS Fabry-Perot sensor for accurate high pressure measurement up to 10 MPa. Opt. Express 2024, 32, 37059–37072. [Google Scholar] [CrossRef]
- Liang, H.; Jia, P.; Liu, J.; Fang, G.; Li, Z.; Hong, Y.; Liang, T.; Xiong, J. Diaphragm-Free Fiber-Optic Fabry-Perot Interferometric Gas Pressure Sensor for High Temperature Application. Sensors 2018, 18, 1011. [Google Scholar] [CrossRef]
- Liu, S.; Du, X.; Zhu, M.; Liu, D. Long-term stability enabling technology of silicon-based piezoresistive MEMS pressure sensor. Journal of Physics: Conference Series. J. Phys. Conf. Ser. 2020, 1520, 012009. [Google Scholar]


| Material | Young’s Modulus (GPa) | Poisson’s Ratio | CTE * (/°C) |
|---|---|---|---|
| Si | 130 | 0.28 | 2.6 × 10⁻⁶ |
| SiO2 | 70 | 0.17 | 0.5 × 10⁻⁶ |
| BF33 Glass | 64 | 0.21 | 3.25 × 10⁻⁶ |
| Parameters | Value (μm) | Description |
|---|---|---|
| r | 900 | FP cavity radius |
| l | 100 | FP cavity length |
| a | 5000 | Diaphragm side length |
| H | 650 | Glass thickness |
| T | 350 | Substrate silicon thickness |
| Scheme | Sensitivity (nm/MPa) | Range (MPa) | Sensitivity (pm/°C) | Range (°C) | Ref. |
|---|---|---|---|---|---|
| Microbubble cavity | 0.315 | 0–40 | 1.55 | 0–600 | [15] |
| Capillary splicing | 216 | 0–69 | / | / | [16] |
| MEMS silicon-glass | 46.94 | 0–30 | / | / | [22] |
| MEMS embedded structure | 1.071 rad/MPa | 2–120 | 2.665 × 10⁻³ rad/°C | 0–60 | [23] |
| This work | 36.13 | 0–100 | 13.9 (temperature compensation) | 0–160 |
Disclaimer/Publisher’s Note: The statements, opinions and data contained in all publications are solely those of the individual author(s) and contributor(s) and not of MDPI and/or the editor(s). MDPI and/or the editor(s) disclaim responsibility for any injury to people or property resulting from any ideas, methods, instructions or products referred to in the content. |
© 2025 by the authors. Licensee MDPI, Basel, Switzerland. This article is an open access article distributed under the terms and conditions of the Creative Commons Attribution (CC BY) license (https://creativecommons.org/licenses/by/4.0/).
Share and Cite
Li, K.; Wang, Y.; Li, G.; Xu, Z.; Liu, Y.; Shi, A.; Yu, X.; Li, F. Optical Fiber Pressure Sensor with Self-Temperature Compensation Structure Based on MEMS for High Temperature and High Pressure Environment. Photonics 2025, 12, 258. https://doi.org/10.3390/photonics12030258
Li K, Wang Y, Li G, Xu Z, Liu Y, Shi A, Yu X, Li F. Optical Fiber Pressure Sensor with Self-Temperature Compensation Structure Based on MEMS for High Temperature and High Pressure Environment. Photonics. 2025; 12(3):258. https://doi.org/10.3390/photonics12030258
Chicago/Turabian StyleLi, Ke, Yongjie Wang, Gaochao Li, Zhen Xu, Yuanyuan Liu, Ancun Shi, Xiaoyan Yu, and Fang Li. 2025. "Optical Fiber Pressure Sensor with Self-Temperature Compensation Structure Based on MEMS for High Temperature and High Pressure Environment" Photonics 12, no. 3: 258. https://doi.org/10.3390/photonics12030258
APA StyleLi, K., Wang, Y., Li, G., Xu, Z., Liu, Y., Shi, A., Yu, X., & Li, F. (2025). Optical Fiber Pressure Sensor with Self-Temperature Compensation Structure Based on MEMS for High Temperature and High Pressure Environment. Photonics, 12(3), 258. https://doi.org/10.3390/photonics12030258