1. Introduction
Hydrogen sulfide (H
2S) is a critical trace gas with multifaceted applications spanning biomedical diagnostics, industrial safety, and energy infrastructure monitoring. Its role as a biomarker for pulmonary diseases (e.g., asthma and chronic obstructive pulmonary disease (COPD)) and as a decomposition byproduct of SF
6 insulation gas in high-voltage equipment necessitates ultrasensitive detection at parts-per-billion (ppb) levels [
1]. In biomedical applications, H
2S functions as both a food spoilage biomarker via metabolic byproduct analysis and an endogenous gasotransmitter regulating cardiovascular physiology [
2]. In respiratory medicine, sub-ppm H
2S concentrations in exhaled breath serve as biomarkers for early diagnosis of pulmonary diseases such as asthma and COPD [
3].
The energy infrastructure sector demonstrates another crucial application of H
2S monitoring. As a decomposition byproduct of SF
6 insulation gas in high-voltage equipment, ppb-level H
2S detection provides critical predictive maintenance capabilities. Early identification of minute H
2S concentrations enables timely detection of insulation system degradation, thereby preventing catastrophic electrical failures in power transmission networks [
4,
5].
Industrial applications present particularly demanding challenges for H
2S monitoring technology. The thermal power generation industry exemplifies these requirements, where the widespread adoption of low-NOx combustion systems and circulating fluidized bed reactors has significantly elevated ambient H
2S concentrations. This heightened presence of reducing gases induces two major operational hazards: accelerated boiler coking/slagging processes and severe high-temperature sulfidation corrosion of water-cooled walls. The latter phenomenon poses particularly grave risks, as progressive wall thinning can culminate in catastrophic tube failures (“bursting”), potentially triggering major industrial accidents [
6,
7]. These challenges necessitate robust online monitoring systems capable of real-time, ultrasensitive H
2S detection under extreme industrial conditions.
These diverse demands have catalyzed the development of advanced sensing platforms capable of ppb-level sensitivity, high selectivity in multicomponent gas matrices, and resilience under harsh industrial conditions.
Recently, many techniques based on absorption spectroscopy of atoms and molecules in the gas phase have been developed in order to achieve a sensitive and accurate measurement of H
2S. Tunable diode laser absorption spectroscopy (TDLAS) techniques, including wavelength modulation and Herriot cell designs, have achieved detection limits of 140 ppb [
8,
9], while quantum cascade laser-based systems report 1.5 ppm sensitivity [
10]. Fabry Perot (FP) interferometer is often used due to its excellent sensitivity and accuracy, and it also has been applied to detect low concentrations of H
2S [
11,
12]. In terms of quartz-enhanced photoacoustic spectroscopy (QEPAS), near-infrared QEPAS H
2S sensors that can achieve ppm level H
2S detection limits have been developed by some research teams [
13,
14,
15]. Wu et al. achieved a detection limit of 142 ppb for H
2S in the 1582 nm band using an enhanced near-infrared QEPAS sensor [
16]. A detection limit of 10 ppb for H
2S using double-resonant photoacoustic spectroscopy with line locking has been achieved by Zhang’s group [
17]. In terms of off-axis integrated cavity output spectroscopy, Tian et al. and Chen et al. have achieved a detection limit of 150 ppb for H
2S [
18,
19]. Despite advancements, existing CRDS systems face limitations in spectral acquisition speed and field-deployment robustness. For instance, Siciliani de Cumis et al. reported a 105 ppb detection limit with conventional CRDS, highlighting the need for enhanced sensitivity [
20]. Jiang et al. achieved a detection limit of 4.44 ppb for H
2S in SF
6 gas using CRDS technology [
21].
This study tackles these deficiencies by designing a miniaturized cavity ring-down spectroscopy (CRDS) system that integrates hybrid scanning algorithms and achieves sub-millikelvin (sub-mK) thermal stability, enabling parts-per-billion (ppb)-level detection of hydrogen sulfide (H
2S) in challenging and harsh environmental conditions. The proposed system overcomes the limitations in sensitivity, portability, and robustness found in conventional approaches, offering a compact and efficient solution for trace gas monitoring. The structure of this paper is organized as follows:
Section 2 details the instrumentation and methodology, outlining the technical framework and experimental setup;
Section 3 presents the results, providing a comprehensive analysis of the system’s performance; the final section offers a conclusion and discussion, synthesizing key findings, implications, and potential avenues for future research.
2. Experimental Setup and Method
2.1. Experimental Setup
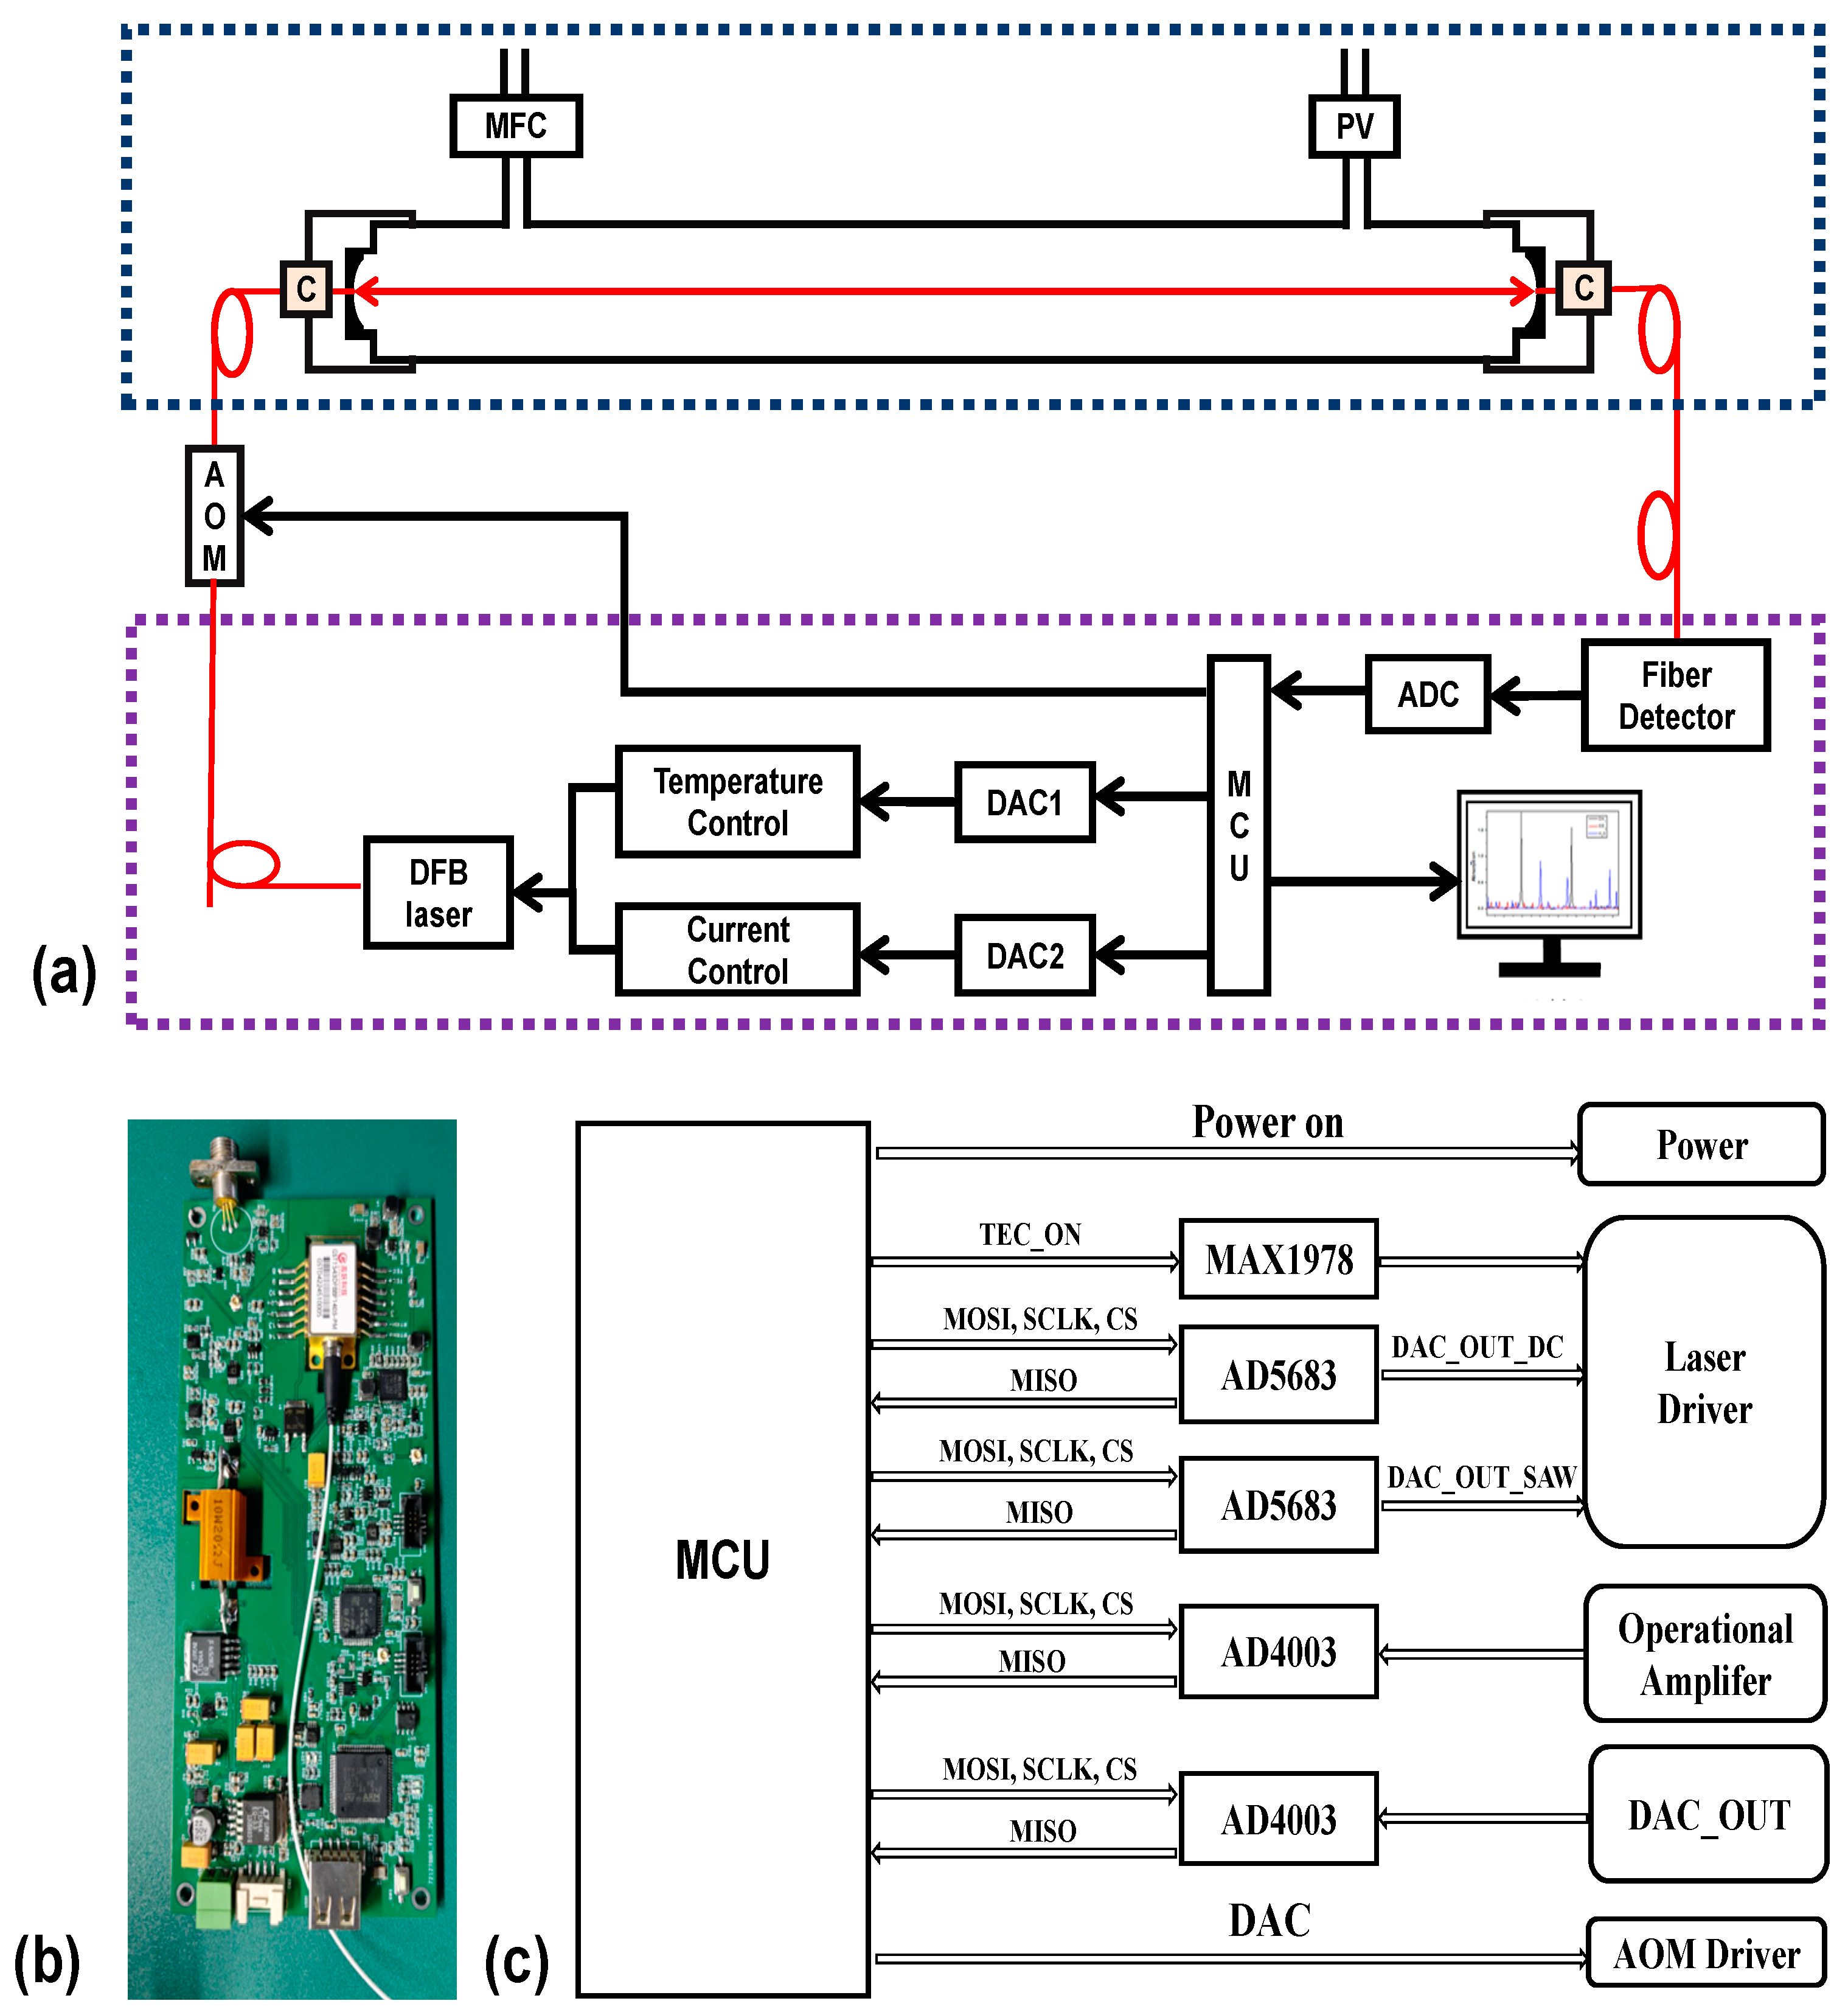
As illustrated in the schematic diagram of the cavity ring-down spectroscopy (CRDS) system, the DFB laser (GyScienTech, Wuhan City, China, GST1574DFBBF1413-PM) emits a wavelength-tunable beam modulated by an acousto-optic modulator (AOM). The modulated light is coupled into a quartz ring-down cavity (effective optical path: 660 mm; baseline ring-down time: 191.5 µs) via a single-mode polarization maintaining fiber.
High-precision hydrogen sulfide (H2S) detection is fundamentally constrained by three critical parameters: thermodynamic stability, pressure regulation, and spectral interference mitigation. To address these challenges, our apparatus employs a dual-stage thermal control system that stabilizes intracavity gas temperature at 45.00 °C ± 0.005 °C, achieving sub-millikelvin thermal uniformity. Under ambient pressure conditions, trace-level H2S concentrations exhibit significant spectral overlap interference from dominant CO2 and H2O absorption lines, though such cross-talk effects demonstrate progressive attenuation with reduced pressure.
During dynamic pressure optimization, the minimum achievable cavity pressure is constrained to >20 kPa due to cumulative instrumental tolerances in the vacuum pump assembly, mass flow controller (200 sccm ± 0.01 sccm), and proportional control valve. To ensure robust pressure regulation with adequate system margin, the operational pressure is actively maintained at 25.000 kPa ± 0.002 kPa through closed-loop control. This optimized pressure regime enables unambiguous molecular discrimination of H2S signatures.
Wavelength selection is controlled by a microcontroller unit (STM32H743) interfaced with a 16-bit digital-to-analog converter (AD5683, Analog Devices), which modulates the laser’s temperature and injection current. The amplified photodetector output is digitized using an 18-bit analog-to-digital converter (Analog Devices, AD4003) at a sampling rate of 2 MSPS, ensuring high-fidelity ring-down waveform capture. Upon threshold detection, the MCU generates a TTL signal to deactivate the AOM, ensuring optimal ring-down waveform acquisition. Following the acquisition of complete ring-down waveforms, the MCU transmits spectral data to a host computer for real-time concentration inversion and graphical display via custom-developed algorithms as shown in
Figure 1.
2.2. Spectral Scan Method
The longitudinal modes of the ring-down cavity serve as precise frequency markers, with their frequencies expressed as follows:
where N is the mode order and FSR is the free spectral range. Enhanced FSR stability is achieved through two key measures: (1) employing low-expansion-coefficient materials (high-purity quartz in this work) and (2) implementing precision temperature control. Here,
corresponds to the fundamental mode frequency (N = 0) and
specifies the Nth-order mode frequency.
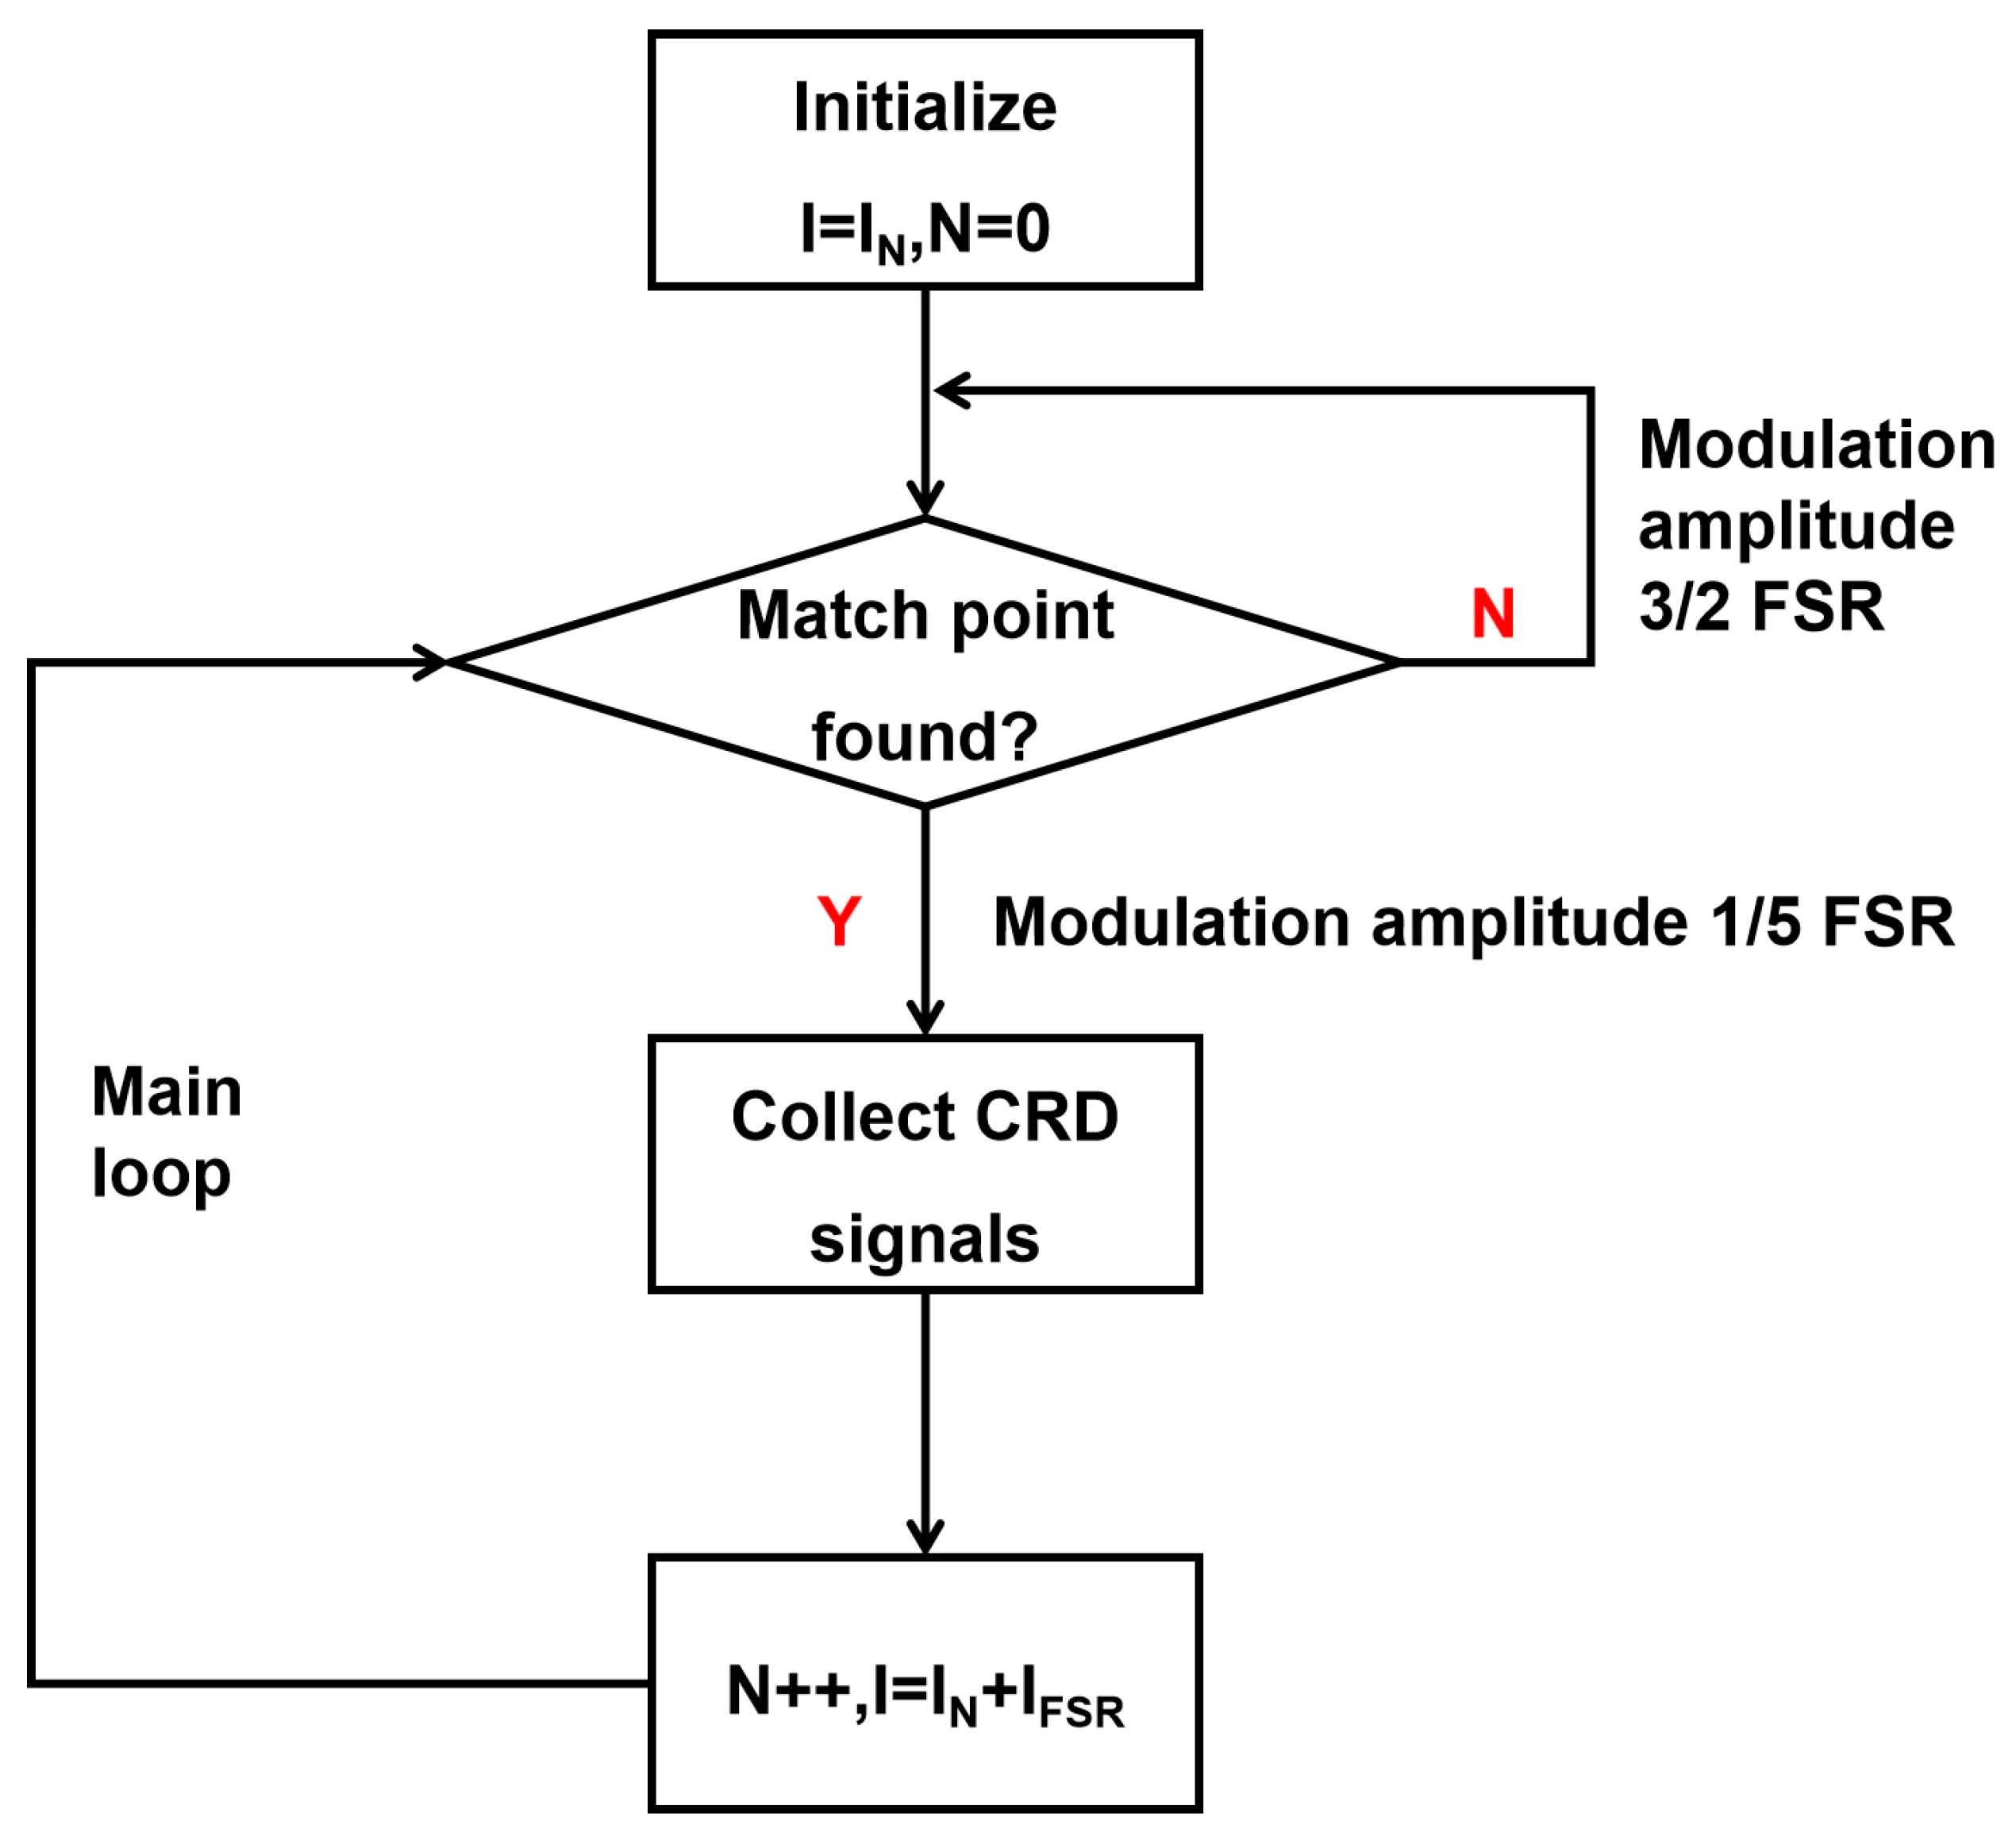
While the sequential matching of cavity modes could theoretically enable complete spectral acquisition, practical limitations arise from laser current–wavelength nonlinearities and frequency instability. Our previous digital locking schemes [
22] improved mode matching efficiency but exhibited prolonged relocking durations (>10 s) following unexpected disturbances. To address this limitation, we developed a hybrid scanning strategy combining wide-range searching (3/2 FSR span) with narrow-band locking (1/5 FSR modulation), achieving spectral acquisition within 3–5 s. The operational workflow (see schematic diagram as shown in
Figure 2) comprises the following:
- 1.
Coarse Search Phase: Detect mode-matching conditions through 3/2 FSR scanning.
- 2.
Precision Locking Phase: Apply 1/5 FSR modulation for stabilized measurements.
- 3.
Fault Recovery: Reinitiate searching mode if no ring-down signal is detected within 0.1 s.
This adaptive approach maintains measurement continuity while preventing prolonged system downtime from transient disturbances.
3. Results
3.1. Self-Calibration of the Spectrum
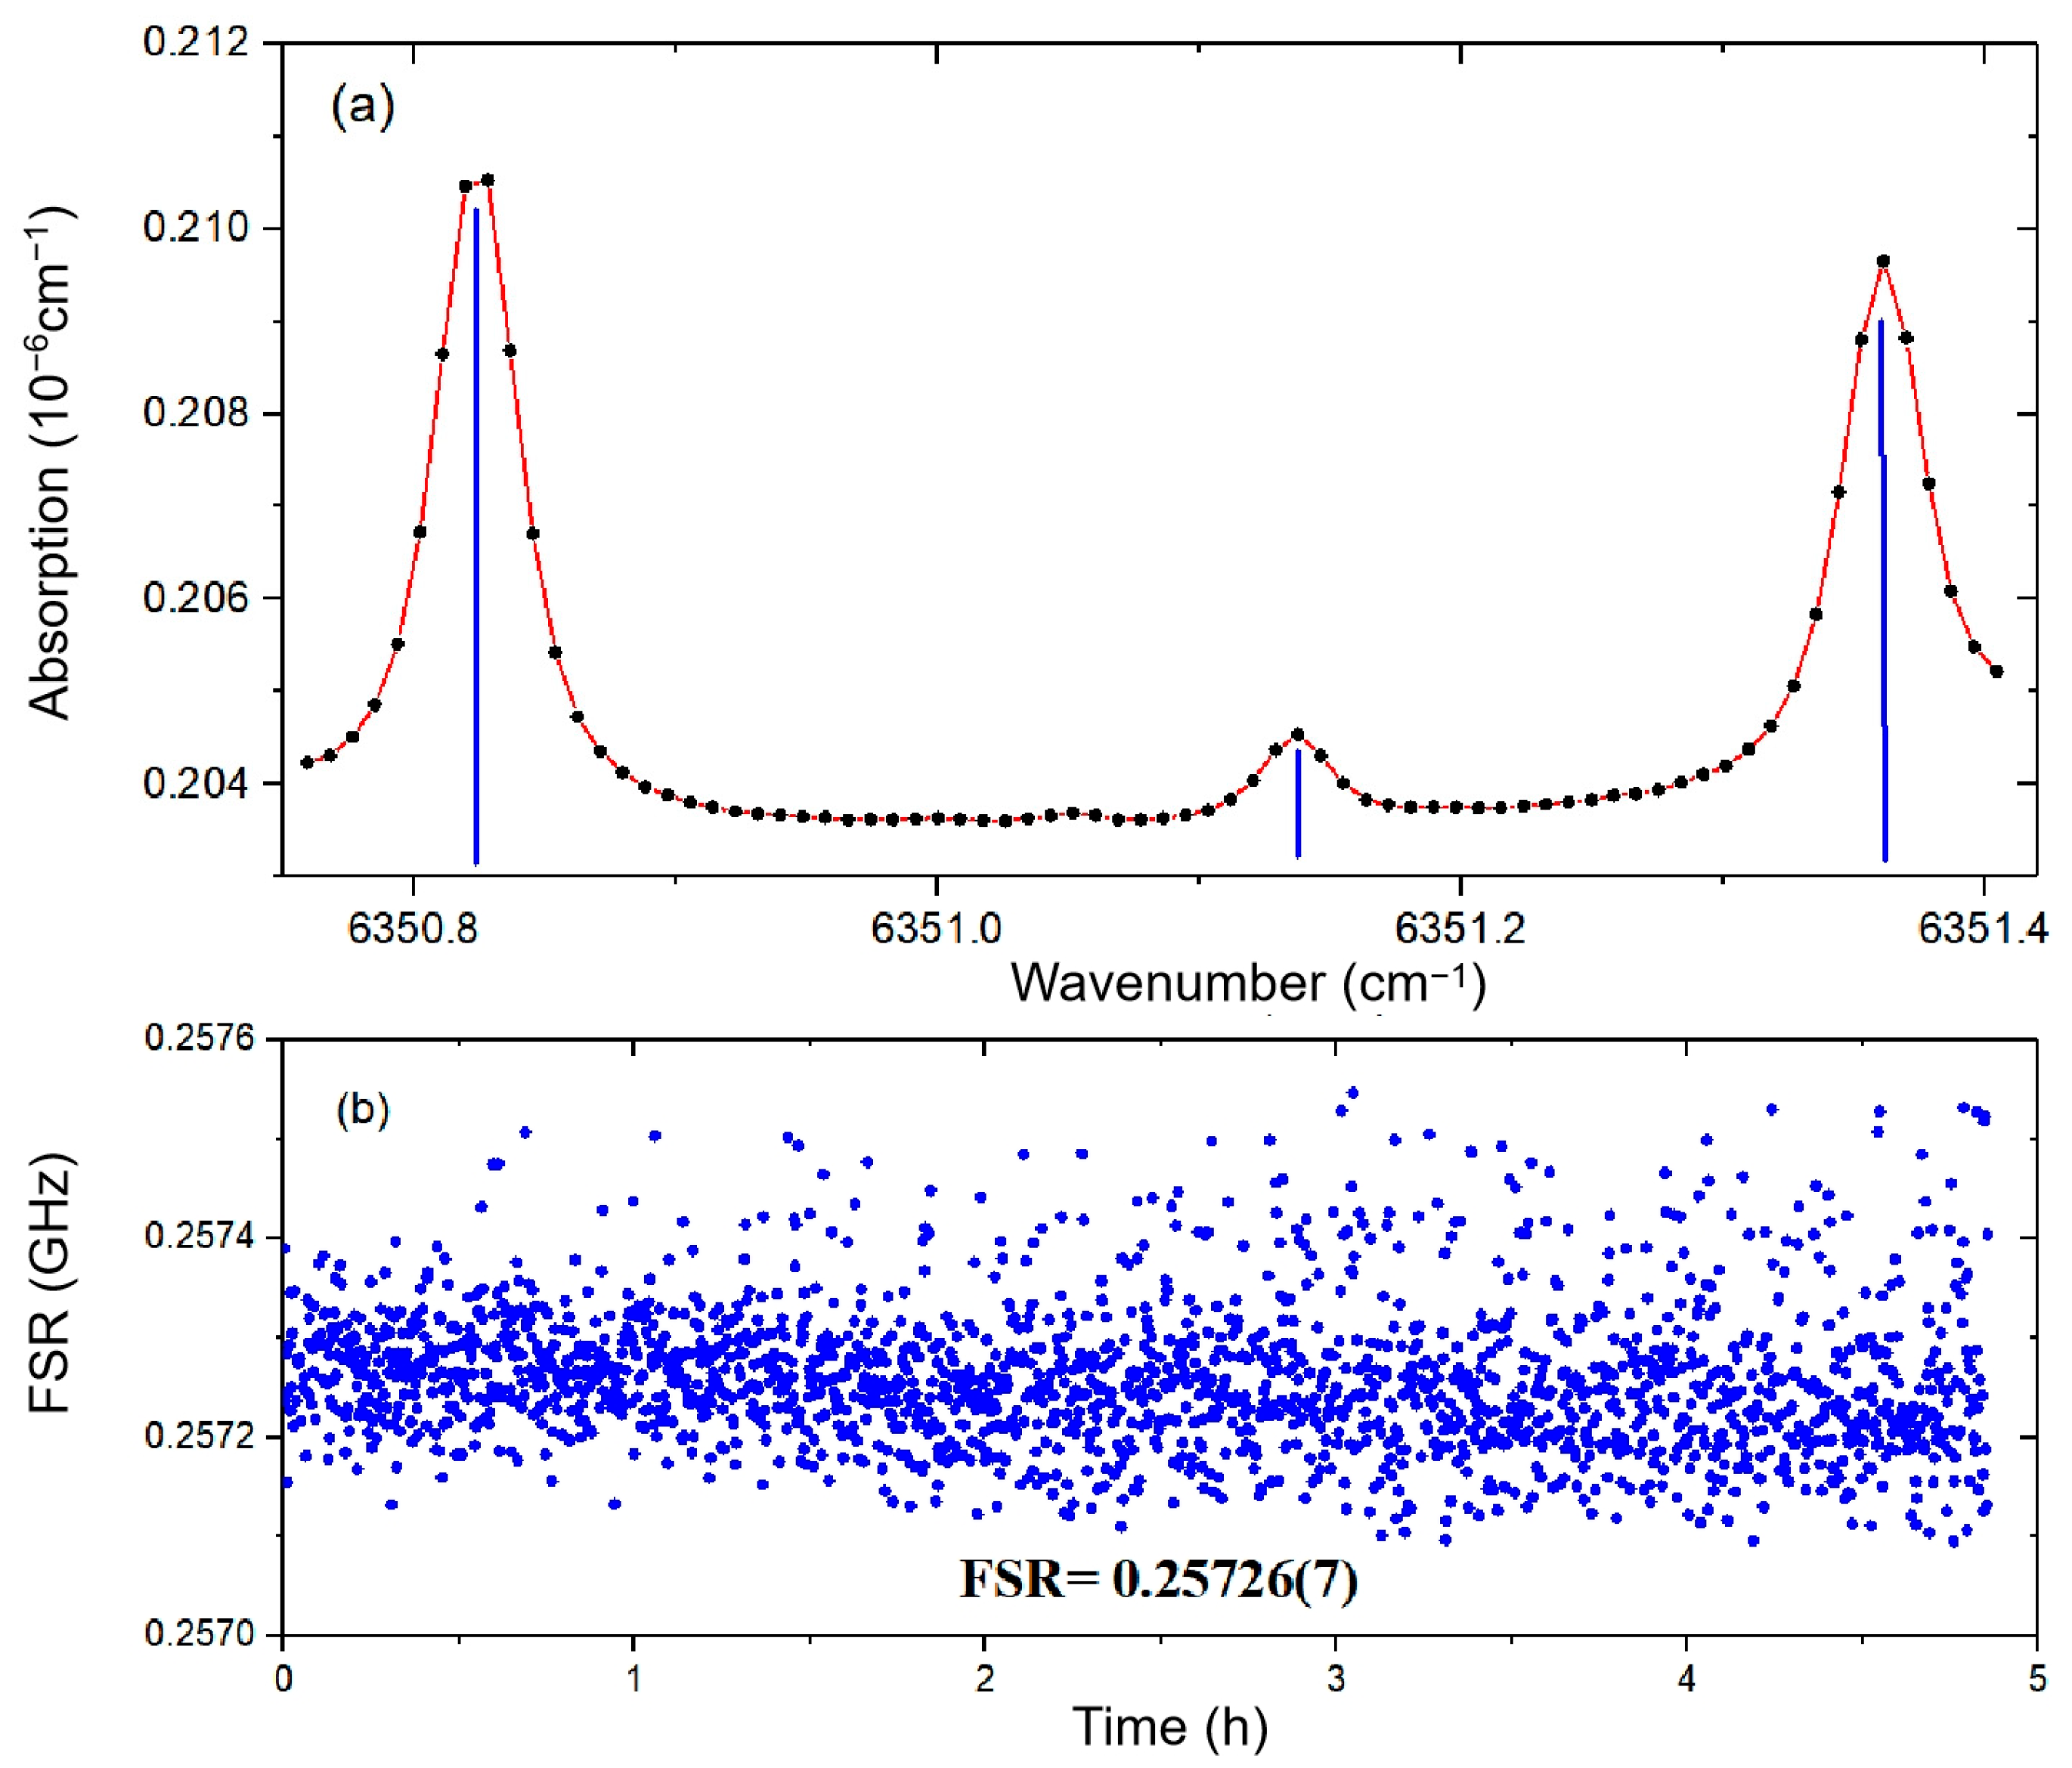
To assess the accuracy of the longitudinal mode frequency comb, we conducted continuous spectral measurements of H2S absorption features near 1574.554 nm over a 5 h period. Through multi-peak fitting analysis, we determined the relative positions of three characteristic absorption peaks. These measured peak positions were then correlated with reference wavelengths from the HITRAN database using linear regression analysis. The slope of the fitted curve yielded the free spectral range (FSR) of 257.26 ± 0.07 MHz.
The measurement precision was further evaluated through statistical analysis of 76 discrete spectral data points. The maximum potential relative error for any individual point is theoretically 1/76 (1.31%). However, as shown in
Figure 3b, the observed maximum relative deviation was only 0.18%, demonstrating two critical findings:
This exceptional performance validates the robustness of our hybrid scanning approach and the stability of the frequency comb reference.
3.2. Linearity, Sensitivity, Detection Limit, and Response Time
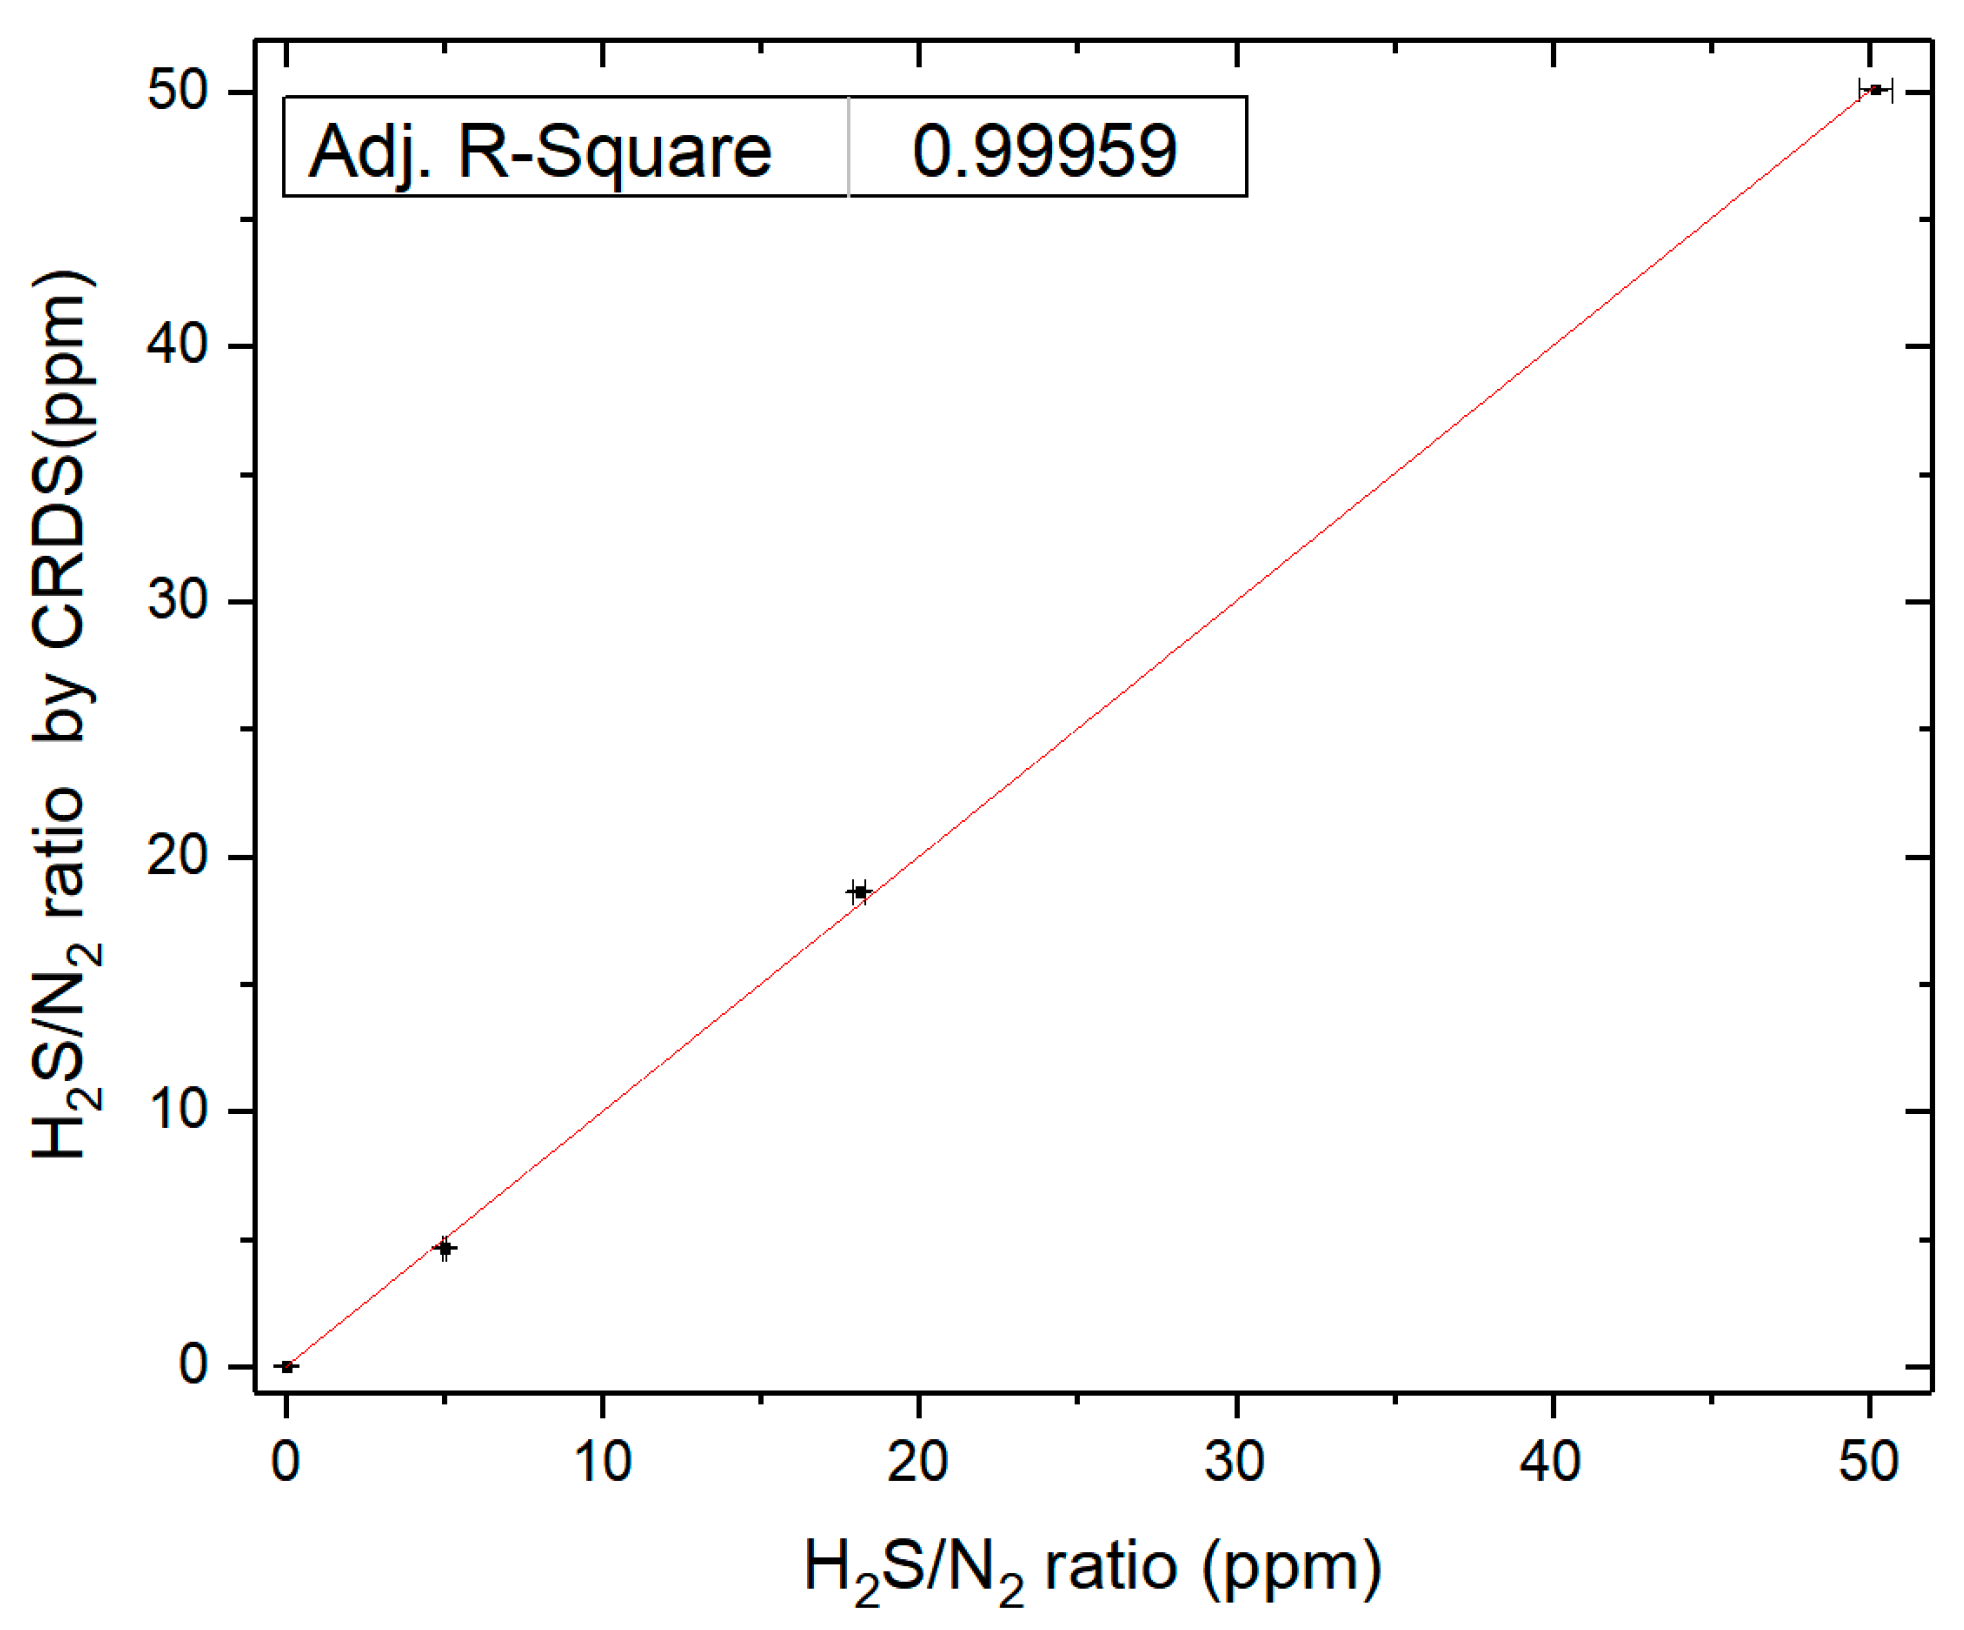
Instrument calibration was performed using four certified reference gas cylinders (Nanjing Special Gases Co., Ltd.) with certified H
2S concentrations of N
2 blank, 5 ppm, 18.1 ppm, and 50.2 ppm (1% uncertainty). Hydrogen sulfide concentrations were subsequently determined using cavity ring-down spectroscopy (CRDS). As shown in
Figure 4, the CRDS measurements exhibited excellent agreement with the certified gravimetric mixture (GM) values, demonstrating an Adj. R-Square of 0.99959. The observed congruence between CRDS and GM measurements confirms that the cavity ring-down spectrometer has achieved satisfactory quantitative accuracy for precise concentration determinations.
Sensitivity, defined as the minimum resolvable concentration variation of the instrument, is governed by three critical parameters: (1) the signal-to-noise ratio (SNR) of the detection system, (2) the quality factor (Q-value) of the optical cavity, and (3) the stability of the laser source. Allan variance analysis, which evaluates the evolution of signal noise as a function of integration time, serves as a robust tool to determine the optimal integration time and derive the minimum detection limit (MDL)—the lowest H2S concentration that can be reliably identified at a specified confidence level. Compared to conventional noise analysis methods, Allan variance provides distinct advantages:
Noise Discrimination: Differentiates contributions from white noise, flicker noise, and other noise types.
Detection Limit Optimization: Enables significant reduction of MDL through systematic integration time tuning.
Long-Term Stability Quantification: Offers a quantitative framework for assessing system performance in trace gas detection applications.
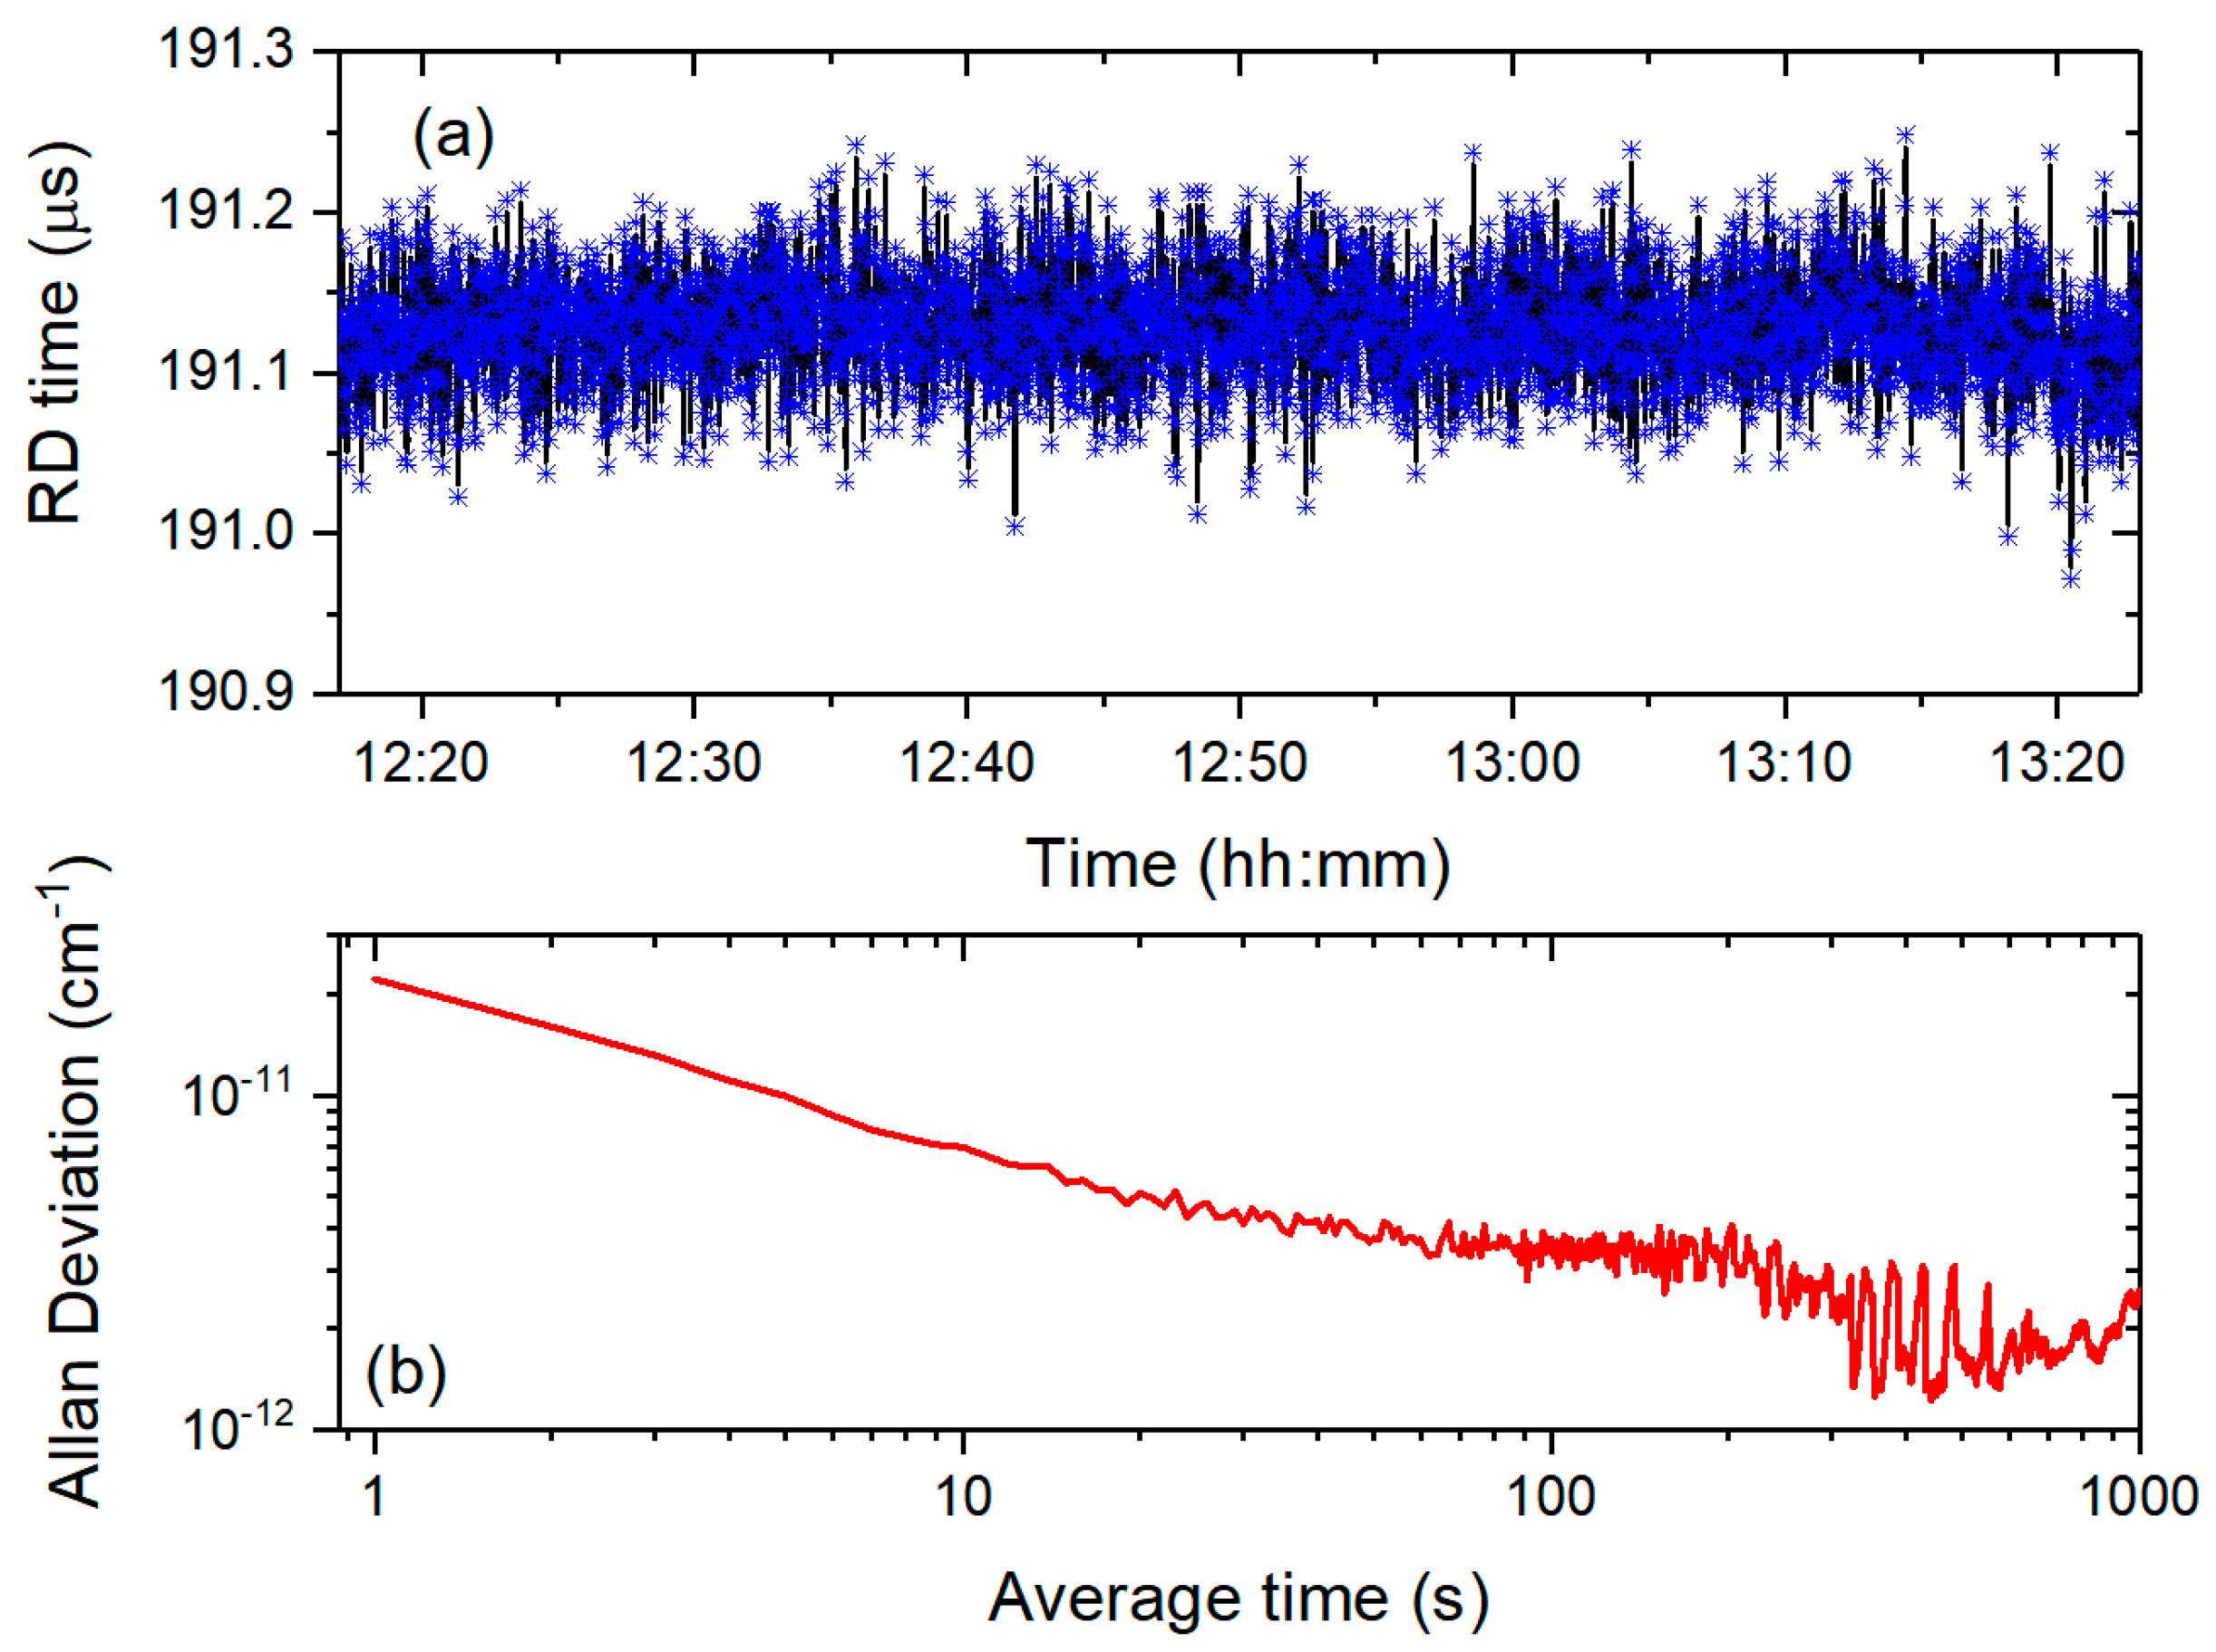
To evaluate the detection capability of our system, we performed continuous measurements of cavity ring-down time variations at a fixed wavelength within the H
2S absorption band (1574.554 nm) under vacuum conditions (
Figure 5a). Allan variance analysis revealed a minimum detectable absorption coefficient of 3 × 10
−12 cm
−1 at 60-s integration (
Figure 5b), corresponding to 0.2 ppb H
2S concentration fluctuations—surpassing the sensitivity of prior CRDS systems. This performance highlights the exceptional stability and precision of the developed CRDS system.
To establish a controlled low-concentration H2S environment, we implemented a dynamic dilution protocol using a certified 4 ppm H2S/air mixture. The experimental sequence comprised the following:
Initial Conditioning: Purging the cavity with 4 ppm H2S reference gas.
Dynamic Dilution: Continuous air injection at constant flow (200 sccm) and pressure (25,000 Pa).
Signal Processing: Application of moving average filtering (3 s per spectrum, 100-point window) for enhanced measurement precision.
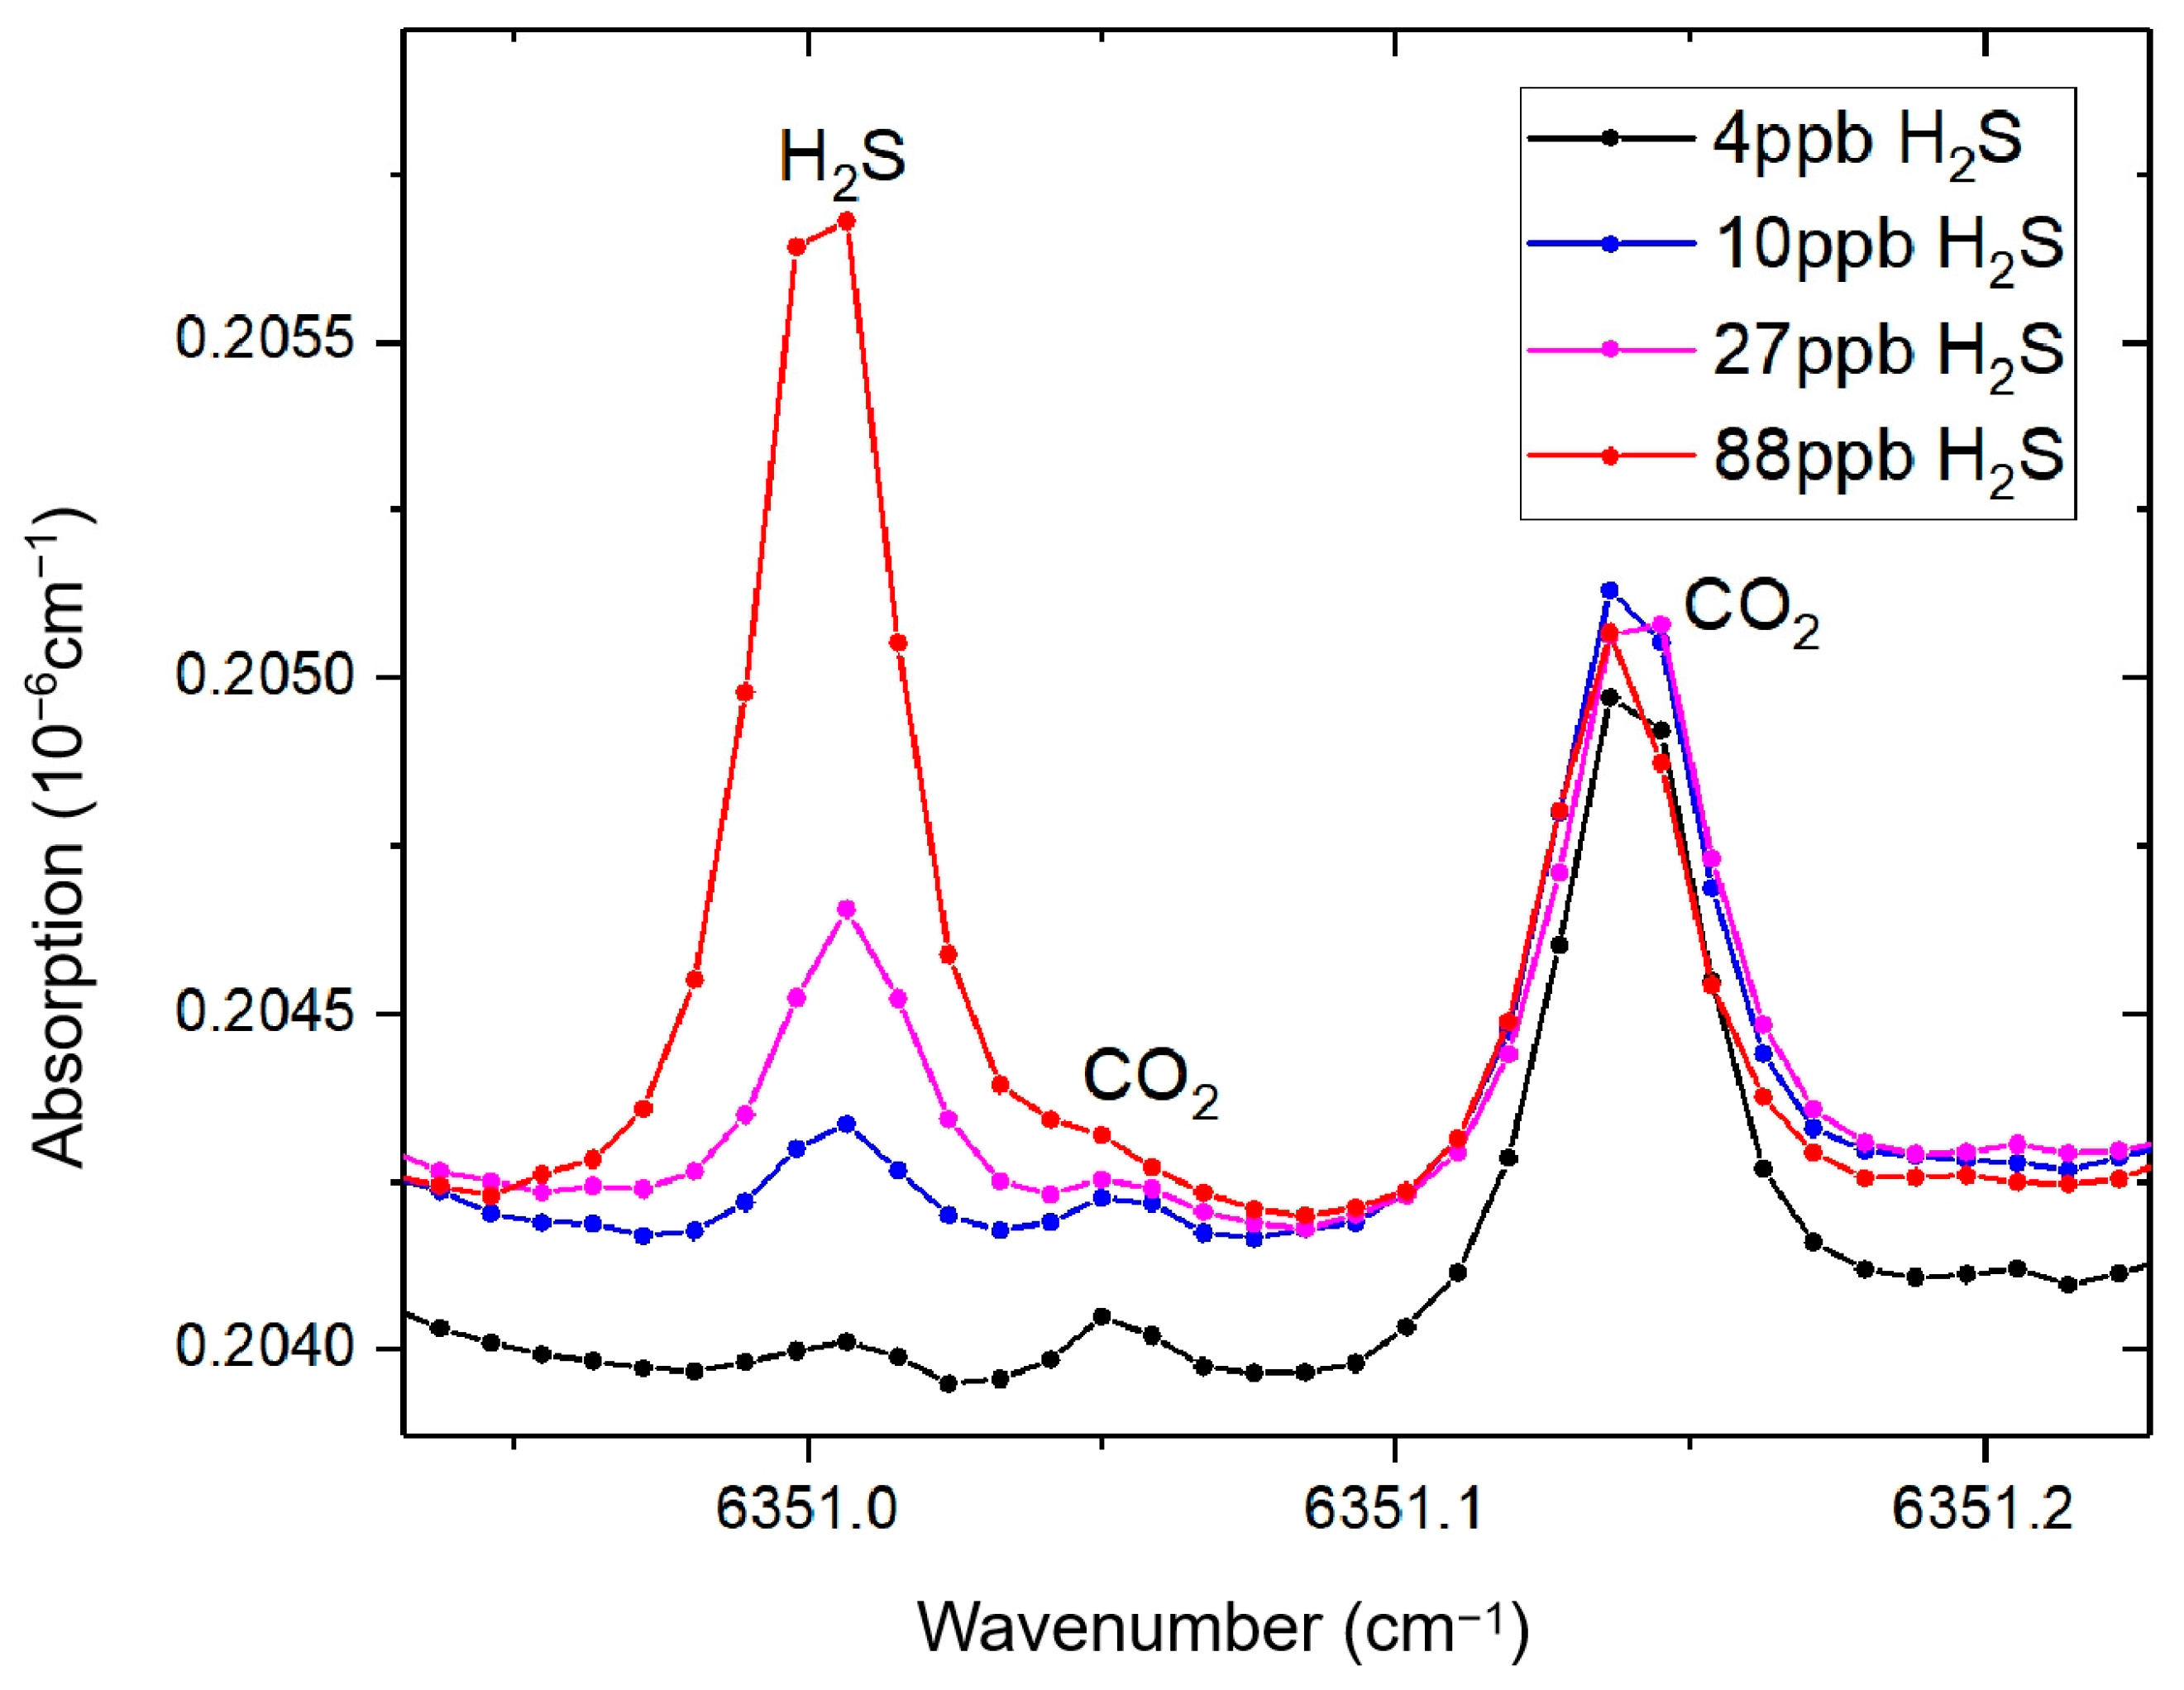
As illustrated in
Figure 6, a dynamic dilution system employing purified air was utilized to systematically attenuate hydrogen sulfide (H
2S) standard gas at a constant flow rate of 200 standard cubic centimeters per minute (sccm). The experimentally monitored temporal concentration profile demonstrated sequential attenuation characteristics: the H
2S concentration decreased from an initial 4 ppm to 88 ppb after 10 min of continuous dilution, followed by subsequent reductions to 27 ppb at 20 min, 10 ppb at 30 min, and ultimately reaching 4 ppb after 45 min of operation.
The absorption spectra exhibited a signal-to-noise ratio (SNR) exceeding 6 across the tested concentration range (4–80 ppb), validating the system’s robustness for trace-level quantification under dynamic dilution conditions. Applying the 3σ detection criterion, the system achieves a practical detection limit of 2 ppb in ambient air, validating its capability for air trace gas monitoring applications.
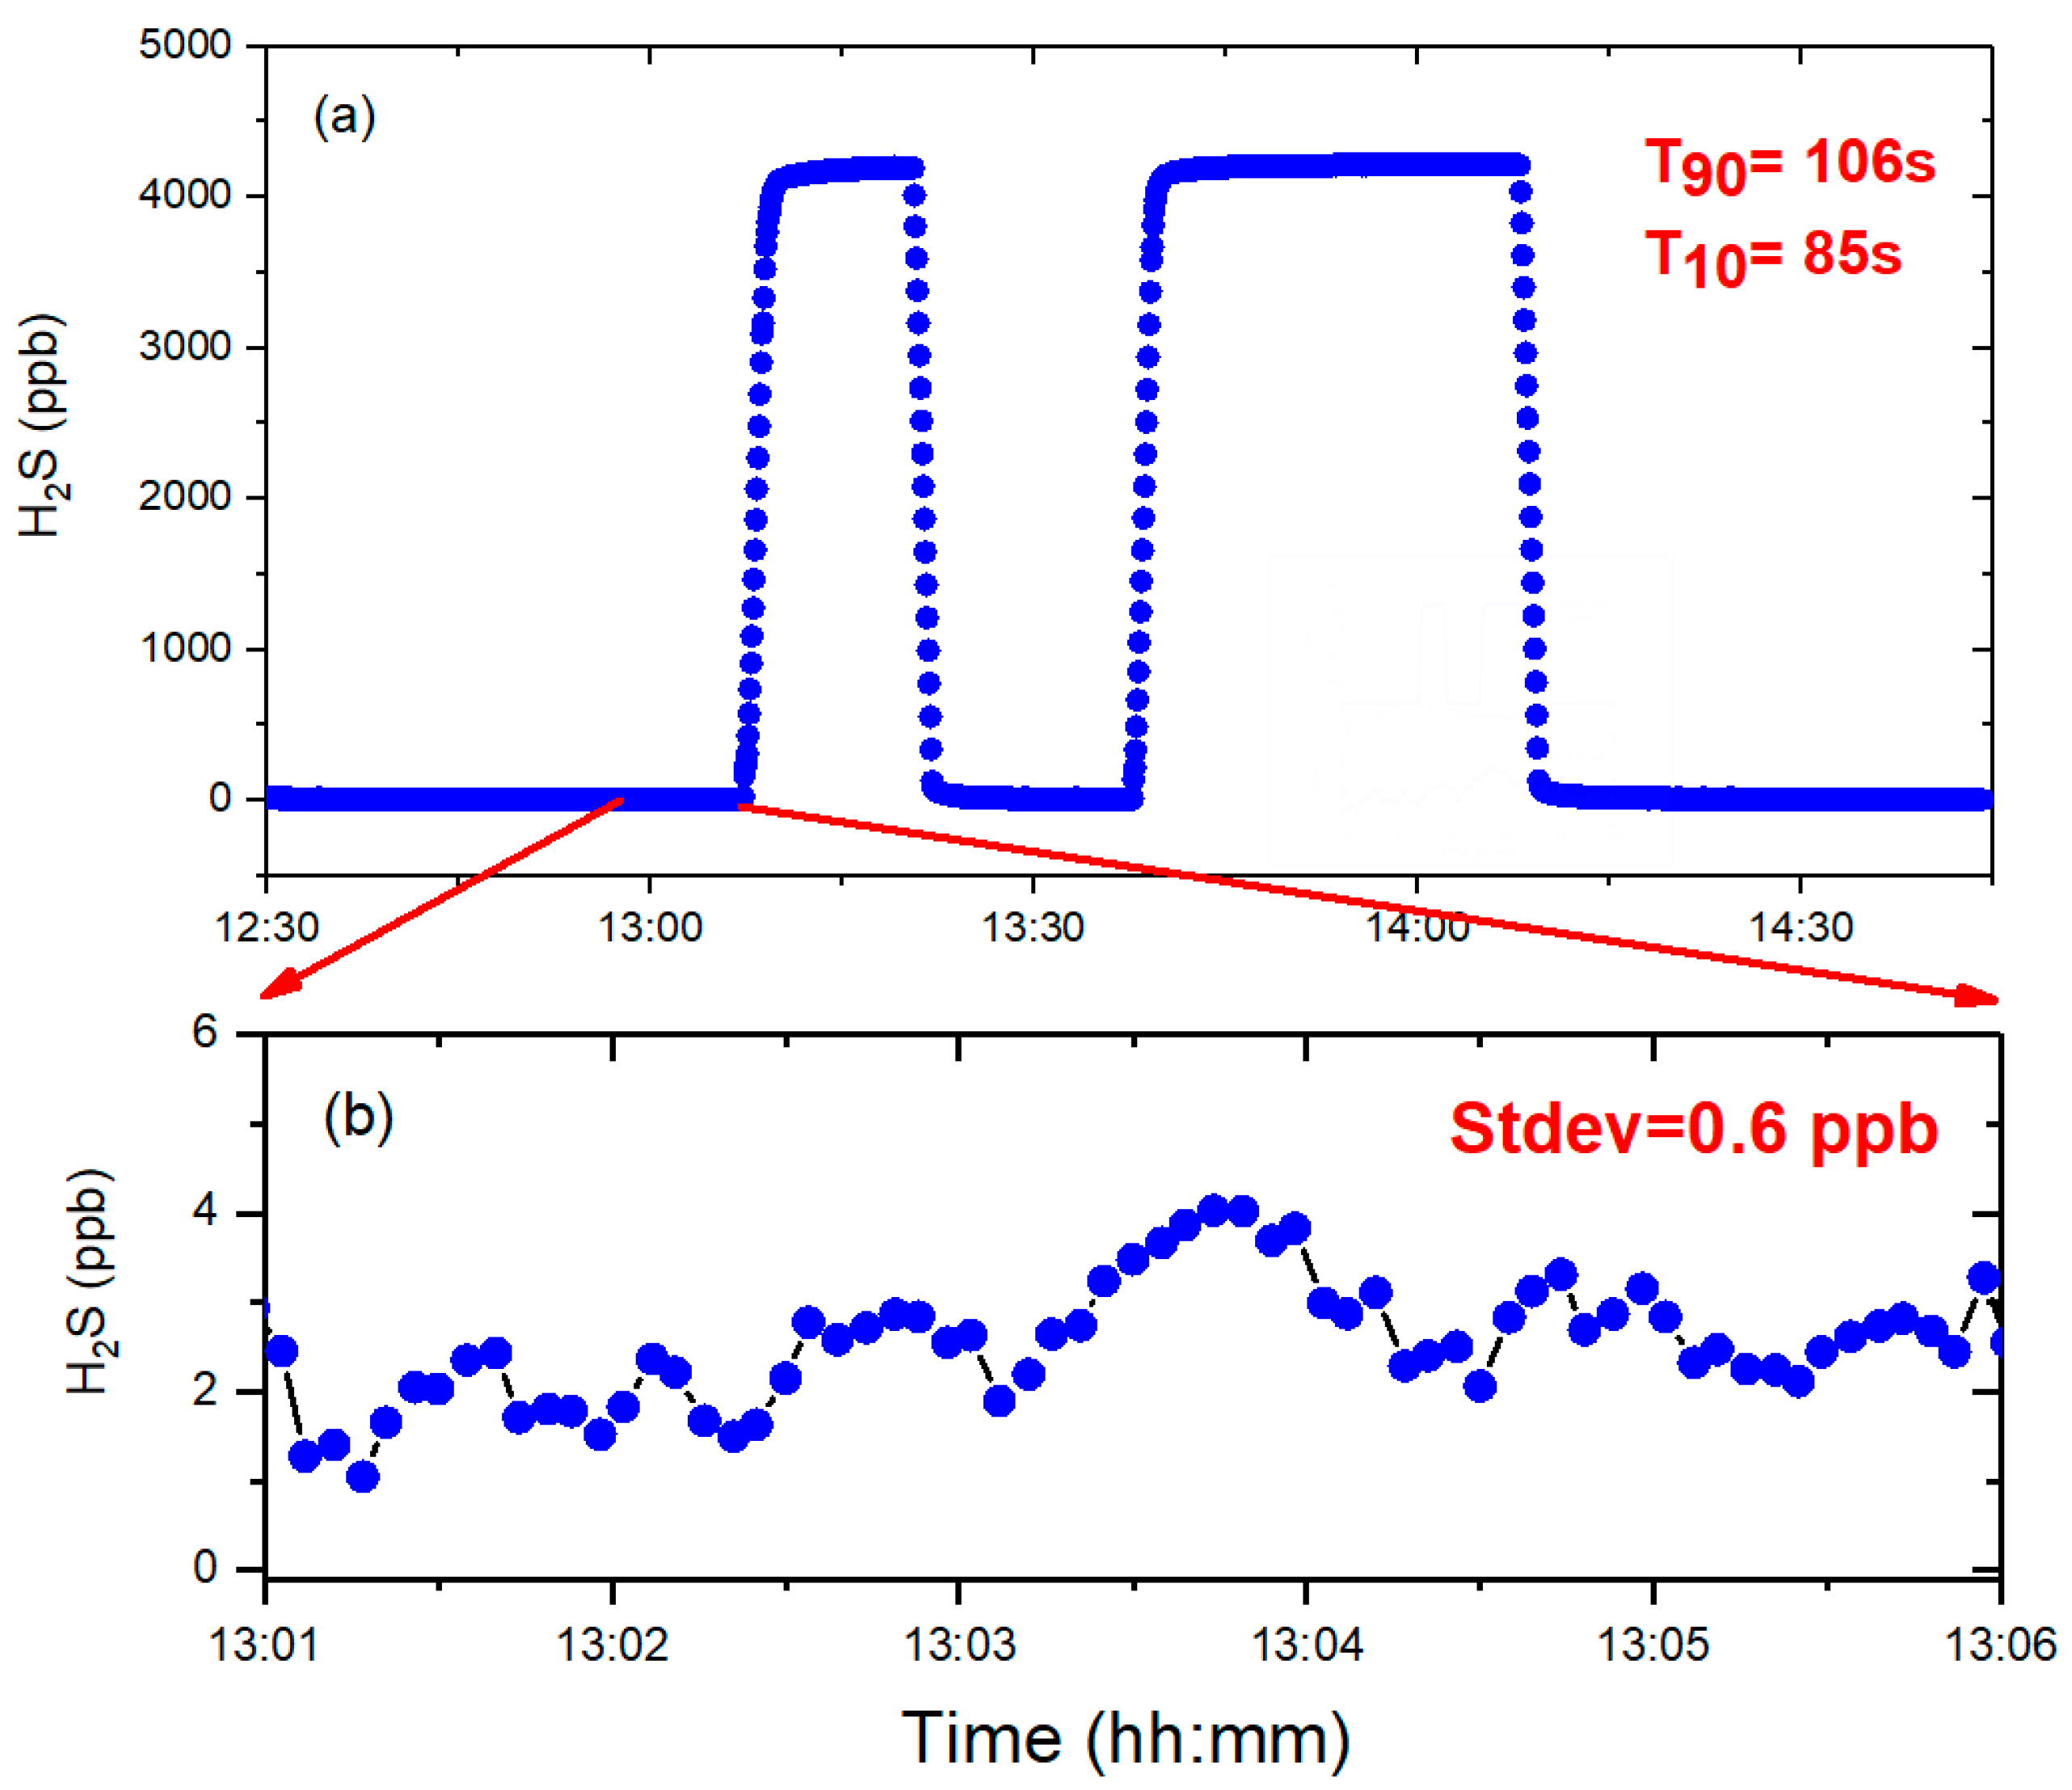
Instrument response characterization was conducted through a gas-switching methodology employing H2S standard gas and high-purity nitrogen (N2). This protocol was implemented to determine the temporal response characteristics and establish the detection limits under standardized gas conditions.
The temporal resolution was quantitatively evaluated using two critical parameters: T90 and T10 response times. The operational definitions were as follows:
T90: Duration required for sensor output to reach 90% of nominal value during the transition from high-purity N2 to calibrated H2S concentration.
T10: Time elapsed for signal decay to 10% of initial value when switching from H2S standard gas back to high-purity N2.
As shown in
Figure 7, the system exhibited a T
90 response time of 106 s and a T
10 recovery time of 85 s, reflecting efficient gas-switching dynamics. The main reason for the difference in response time is that we adopt the sliding average method, which improves the detection ability of the system but reduces the response of the system, especially the rise time response T90. Subsequent statistical analysis of the baseline signal following prolonged N
2 purging revealed a standard deviation of 0.6 ppb for H
2S concentrations, corresponding to a measurement precision of 0.6 ppb. Using the conventional three-sigma criterion, the instrument demonstrated a detection limit of 1.8 ppb.
4. Conclusions and Discussion
This study introduces a low-cost, high-precision cavity ring-down spectroscopy (CRDS) analyzer tailored for trace hydrogen sulfide (H2S) detection, addressing the pressing need for sensitive, affordable, and field-deployable gas-sensing technologies. The system integrates a novel digital locking circuit within a compact, embedded platform that seamlessly combines laser frequency stabilization, ring-down signal detection, amplification, data acquisition, exponential fitting, and real-time data transmission. Spectral analysis and visualization are efficiently handled by a dedicated microcomputer, streamlining the operational workflow. By adopting an all-polarization-maintaining-fiber configuration, the design eliminates free-space optical components, enhancing mechanical stability and reducing maintenance demands. The resulting analyzer, with dimensions of 48 cm × 22 cm × 95 cm and a power consumption of 70 W, offers a practical solution for both laboratory and field applications.
The developed H
2S sensing system demonstrates unprecedented sensitivity, attaining a record-low detection limit of 1.8 ppb. A systematic comparison against existing detection methods reveals significant performance advantages; the details are provided in
Table 1.
This work represents a 52.5-fold improvement over the 105 ppb limit of existing field-deployable CRDS systems [
20]. This leap in performance stems from two key innovations: a hybrid scanning algorithm that optimizes laser-cavity mode alignment and a thermally stabilized cavity (±0.005 °C) that minimizes frequency drift. The detection scheme exploits the stable longitudinal modes of the ring-down cavity as an intrinsic frequency comb, paired with a novel digital locking algorithm that sequentially aligns the laser frequency to individual cavity modes with unprecedented precision. A 5 h characterization of the free spectral range (FSR) demonstrated a frequency precision of 0.07 MHz (relative precision: 0.02%), far surpassing the ~10 MHz resolution of conventional wavelength meters. This advancement not only enhances the accuracy of H
2S absorption line measurements but also sets a new benchmark for frequency stabilization in CRDS systems.
Sensitivity assessments further underscore the system’s capabilities. Allan variance analysis of cavity ring-down times under vacuum conditions revealed a minimum detectable absorption coefficient of 3 × 10⁻¹² cm−1 at a 60 s integration time, reflecting the analyzer’s ability to detect ultra-low gas concentrations with high stability. Field deployment validated its real-world efficacy, achieving a detection limit below 2 ppb for atmospheric H2S with a T90 response time of 106 s and a signal-to-noise ratio (SNR) exceeding 6 for a 4 ppb signal. These metrics fulfill stringent requirements for industrial safety protocols and environmental air quality monitoring, where rapid and reliable detection of trace H2S is paramount.
The modular design of this CRDS analyzer enhances its versatility, positioning it as a scalable platform for monitoring multiple greenhouse gases and polar molecules beyond H
2S. The incorporation of adsorption-resistant modifications—such as specialized coatings or materials—mitigates the signal degradation caused by gas adhesion to cavity surfaces, a common challenge in trace gas sensing. Preliminary tests suggest that, with targeted surface modifications, the system could be adapted for real-time detection of species like ammonia (NH
3) and so on [
23], expanding its utility in climate research, agricultural monitoring, and industrial process control. The compact footprint, low power consumption, and cost-effective architecture further distinguish this platform from bulkier, more resource-intensive alternatives, making it an attractive option for widespread deployment.
Despite these achievements, opportunities for refinement remain. The T90 response time of 106 s, while adequate for many applications, could be reduced through faster signal processing or enhanced cavity flushing mechanisms to meet the demands of dynamic, high-throughput environments. Additionally, while the current design excels in controlled settings, its performance under variable humidity, temperature, or pressure conditions warrants further investigation to ensure robustness across diverse field scenarios. Future work could also explore integrating multi-wavelength capabilities to simultaneously detect multiple gas species, amplifying the system’s analytical power.
In summary, this work demonstrates a transformative approach to CRDS-based trace gas detection, blending affordability, precision, and adaptability into a single platform. By leveraging innovative digital locking techniques and a streamlined optical design, the analyzer not only outperforms existing systems in H2S detection but also lays the groundwork for broader applications in environmental and industrial monitoring. These advancements herald a step forward in the evolution of portable, high-sensitivity spectroscopy tools, with significant potential to address emerging challenges in gas-sensing technology.

