Article

A Picometre-Level Resolution Test Method without Nonlinearity for Heterodyne Interferometer Measurement Electronics

1
School of Instrumentation Science and Engineering, Harbin Institute of Technology, Harbin 150080, China
2
Key Laboratory of Ultraprecision Intelligent Instrumentation, Ministry of Industry and Information Technology, Harbin 150080, China
*
Author to whom correspondence should be addressed.
Photonics 2024, 11(4), 331; https://doi.org/10.3390/photonics11040331
Submission received: 29 February 2024 / Revised: 26 March 2024 / Accepted: 31 March 2024 / Published: 2 April 2024
(This article belongs to the Special Issue Optical Devices/Components/Coatings for Ultra-Precision Equipment)

Abstract

:
The wide application of displacement measurement in high-precision equipment production and high-precision metrology is placing increasing pressure on the resolution of heterodyne interferometers. However, as the core component of an interferometer, since measurement electronics includes the cross-physical process of photoelectric conversion, its resolution is rarely evaluated, either on an individual level or as a whole. Therefore, in this paper, we propose a picometer resolution test method for measurement electronics, that uses intensity modulation signals based on an AOM to replace the beat frequency interference signals, and an ordinary commercial guide rail to equivalently generate the pm-level displacement of the heterodyne interferometer under laboratory conditions. Based on the detailed analysis of the type of noise in the test device, the correlation between the light intensity and the nonlinear error was established, and nonlinearity was suppressed to 10% of the original level. Furthermore, this test method allows one to perform a 0.1 mrad phase step test at 1 MHz signal frequency, equivalent to a 2.5 pm resolution test in a double-pass heterodyne interferometer. Simultaneously, it can be directly applied to the resolution test for measurement electronics with a center frequency in the range of 1 MHz to 20 MHz.

1. Introduction

In the fields of ultra-precision machining and high-precision displacement measurement, heterodyne interferometers have been widely used for sensor calibration [1,2,3], ultra-precision measurement [4,5], and semiconductor processing [6,7] due to their advantages of high resolution, traceability, non-contact measurement, and high dynamic range. The resolution of a heterodyne interferometer can be inferred through its ability to distinguish the minimum displacement, and it has been improved to the nanometer [8,9] or even picometer level [10,11]. The measurement of displacement in a heterodyne interferometer is essentially realized via the phase interpolation of optical interference signals in electronic circuits. Therefore, one of the main types of error in heterodyne interferometers is electrical errors caused by measurement electronics [12,13,14]. This means that the resolution of the measurement electronics determines the highest theoretically achievable resolution of a heterodyne interferometer.
The resolution of measurement electronics is mainly affected by the following three aspects. Firstly, in the process of transforming the interference signal from optical to electrical, the photodetector will introduce noise, resulting in a decrease in signal quality. At present, there are numerous studies that have been conducted to obtain high signal-to-noise ratio signals through auto-self-gain [15] and noise optimization design [16]. Secondly, different phase calculation principles will also result in differences in resolution. At present, many different phase unwrapping methods [17,18,19], such as pulse filling and phase-locked amplification, have been proposed to improve resolution. Finally, there is a form of accommodation between the above two factors; that is, the signal-to-noise ratio of the electrical signal from the photodetector should be sufficient to achieve the highest resolution of the phase meter. At present, commercial measurement electronics often integrate these two parts [20,21], thereby suppressing noise and improving resolution. Therefore, with regard to the above studies, how to completely and effectively test the resolution of measurement electronics is a critical issue.
The currently used test methods can be divided into three categories, namely, electrical methods, methods based on the PZT stage, and equivalent methods. Within electrical methods, a signal generator is used to offer electrical signals as ideal interference signals [8,9,12,17,18,19] to directly test the resolution of the phase meter. However, it is evident that this method ignores the influence of noise on the resolution during the photoelectric conversion process. Regarding the second type of method, a PZT stage [22] is used to generate nanoscale displacements to test the resolution of measurement electronics in a real interferometer [23,24]. However, the effects of temperature fluctuations, environmental interference, and vibration will be combined in the measurement results. Thus, such a method can only be used to test the resolution of nanometers or even tens of nanometers and requires complex environmental control and isolation design. Finally, the equivalent method involves the use of a linear guide rail to directly introduce a phase shift into the optical interference signal, which can generate an equivalent displacement of picometers [12,25]. However, this method is only applicable to a resolution test at a fixed frequency, and there are obvious nonlinearities that have not yet been resolved.
In order to evaluate the resolution of measurement electronics at the picometer level, through this paper, we propose a resolution test method without nonlinearity. Through this study, we found and solved the problem of nonlinear error caused by light intensity fluctuations and replaced the heterodyne interference signal with an intensity modulation signal with controllable amplitude, frequency, and low phase jitter. Finally, this method allows for a resolution test of up to 2.5 pm for any measurement electronics with a center frequency in the range of 1 MHz to 20 MHz.

2. Resolution of Heterodyne Interferometer

The typical heterodyne interferometer principle is shown in Figure 1. The reference and the measurement interference signals can be expressed as follows:
I r I 1 + I 2 + 2 I 1 I 2 cos [ 2 π ( f 1 f 2 ) t + φ r 0 ] ,
I m I 1 + I 2 + 2 I 1 I 2 cos [ 2 π ( f 1 f 2 ) t + φ m 0 + Δ φ x + φ l ] ,
where I 1 and I 2 , and f 1 and f 2 refer to the amplitudes, and frequencies of the two single-frequency beams, respectively; φ r 0 and φ m 0 refer to the initial phase of interference signals; and φ l refers to the phase error due to air refractive index perturbations, vibrations [26,27], and so on. The phase change caused by the displacement of the target can be described as
Δ φ x = 4 π n a Δ x λ 2 ,
where Δ x denotes the displacement of the target and na represents the index of refraction. After the photoelectric conversion of the photodetector and further phase calculation performed by the phasemeter, the phase measurement result can be expressed as follows:
Δ φ x = Δ φ x + φ l + φ e + φ p ,
where φ e and φ p represent the errors originating from the two photodetectors and phasemeter. When the above three errors in Equation (4) are small enough to make Δ φ x and Δ φ x close enough, the phase change caused by the movement of the target will be resolved by the interferometer, and Δ x will be referred to as the resolution of the heterodyne interferometer.
In practice, the errors caused by vibrations and air turbulences in the heterodyne interferometer can reach tens of nanometers [28,29], hindering the observation and isolation of errors of measurement electronics that are only at the sub-nanometer level.
Within measurement electronics, photodetectors are a large source of error. In addition to thermal noise and shot noise [14,15,16], the most significant impact is the deviation caused by changes in photoelectronic delays [30,31]. Changes in light intensity will cause the internal bias voltage of the photodiode to fluctuate, thereby affecting the transit time of photoelectrons [32]. Therefore, the relationship between the phase shift and light intensity in a photodiode can be described as
φ e d e l a y = B i { 1 [ U p / ( U j ( I 1 + I 2 ) ) ] g } ,
where Up and U denote the reverse bias and breakdown voltage of the photodiode, respectively, and i , j , g represent the coefficients related to the photodiode. Therefore, the fluctuations in light intensity will cause changes in the phase shift, thereby introducing a nanoscale measurement error [30,31].
Finally, the error of the phasemeter depends on the signal-to-noise ratio of the electrical signals output by photodetectors, which is shown in Equation (6).
S N R = i A C i s h o t + i d a r k + 4 k T B / R L ,
where i A C is the AC photocurrent signal; i s h o t and i d a r k are the shot noise current and dark current, respectively; k is the Boltzmann constant; T denotes the absolute temperature; and RL is the load resistance. When the amplitudes of the signal decrease, SNR deteriorates as well, which will increase the phase measurement error [18].
Furthermore, the center frequency of measurement electronics depends on the frequency difference of the dual-frequency laser, which is distributed in the range of 0.5 MHz to 20 MHz [8,12]. However, the increase in signal frequency makes the influence of the error from the phase meter more significant, insofar as the resolution may be different under different center frequencies.
Following the analysis of factors affecting the resolution in the heterodyne interferometer, three aspects should be considered carefully in the resolution test of measurement electronics. Firstly, the test signal must possess sufficiently small noise. Secondly, the errors due to changes in light intensity coupled in photodetectors should be considered seriously. Finally, the resolution under different signal amplitudes and frequencies should be tested in detail.

3. Theory

3.1. Principle of the Test Method

The schematic diagram of the resolution test method for the measurement electronics is shown in Figure 2. The collimated light output by the He-Ne laser is converged to the working area of the AOM (acousto-optic modulator) through a convex lens. The modulation of the incident light intensity is driven by the signal from the signal generator, which is expressed as:
s = M + N cos ( 2 π F t ) ,
where M, N, and F denote the bias, depth, and frequency of the modulation, respectively. The modulated light is re-collimated by another convex lens with the same focal length and split into two parts at the NPBS. One is used as the reference signal, and the other is taken as the measurement signal after the reflection of a retroreflector. They can be expressed as follows:
I Q r = α I i n [ M + N cos ( 2 π F t + ψ r 0 + ψ A O M ) ] ,
I Q m = ( 1 α ) I i n [ M + N cos ( 2 π F t + ψ m 0 + ψ A O M + ψ L + Δ ψ X ) ] ,
where α denotes the splitting coefficient of the NPBS; ψ r 0 and ψ m 0 represent the initial phase of reference and measurement signals, respectively; ψ A O M and ψ L denote the phase errors caused by the modulation and optical structure, such as air refractive index fluctuations and vibrations; and Δ ψ X refers to the phase change of the modulated signal caused by the movement of the retroreflector, which can be expressed as follows:
Δ ψ X = 4 π n a Δ X λ F ,
where ΔX denotes the displacement of the target and λ F represents the wavelength of the modulation signal. Since the measurement electronics is a phase-sensitive sensor, it cannot distinguish the source of the phase change. Therefore, for the measurement electronics, the phase change of the modulated signal can be equivalent to the phase change in the interferometer. Let Equation (10) be equal to Equation (3) and expressed as:
4 π n a Δ X λ F = 4 π n a Δ x λ 2 .
It can be seen that there is a ratio between ΔX and Δx, which can be expressed as:
Δ x Δ X = λ 2 λ F = λ 2 c F .
As shown in Equation (12), this is the zoom factor in [25], which represents the scaling factor from the displacement in the testing device to the displacement in the interferometer. However, compared with the funding of the previous research, the zoom factor can be flexibly adjusted by changing the frequency of modulation. For example, when ΔX in Equation (12) remains constant and the modulation frequency is reduced by half, the equivalent displacement in the interferometer is reduced by half. Therefore, this method can ensure that the displacement of the retroreflector is equivalently reduced by eight to nine orders of magnitude for the measurement electronics and enables higher resolution tests at lower frequencies.

3.2. The Key Performance Indicators of the Test Method

In this section, we mainly expound the key performance indicators to ensure an effective and complete resolution test for the measurement electronics from three aspects: noise analysis of the testing device, suppression of nonlinearity, and the resolution test abilities under different signal amplitudes and frequencies.
From Equations (8) and (9), the actual phase change of the modulated signal in the testing device can be expressed as follows:
Δ ψ X = Δ ψ X + ψ A O M + ψ L + φ e + φ p .
The phase error from the optical structure is in the same order of magnitude as the one in Equation (4). However, because of the zoom factor in Equation (12), its equivalent error in displacement is reduced by eight to nine orders of magnitude and can, thus, be ignored. This also shows that, compared with the design of using an AOM to achieve frequency shifting [10], this method has stronger anti-interference ability and does not require complex environmental control and isolation. Furthermore, due to the specialty of AOM modulation by diffraction, there is only a phase transfer from the signals of the signal generator to intensity modulation signals. Thus, the phase error of modulation mainly comes from the frequency stability of the signal generator and the modulation system, which is ±1 ppm and ±1.5 ppm, respectively. When the signal frequency is 20 MHz, the phase error is around 3.5 μrad, which is equivalent to the displacement error of 0.09 pm in a double-pass heterodyne interferometer and can, thus, be ignored.
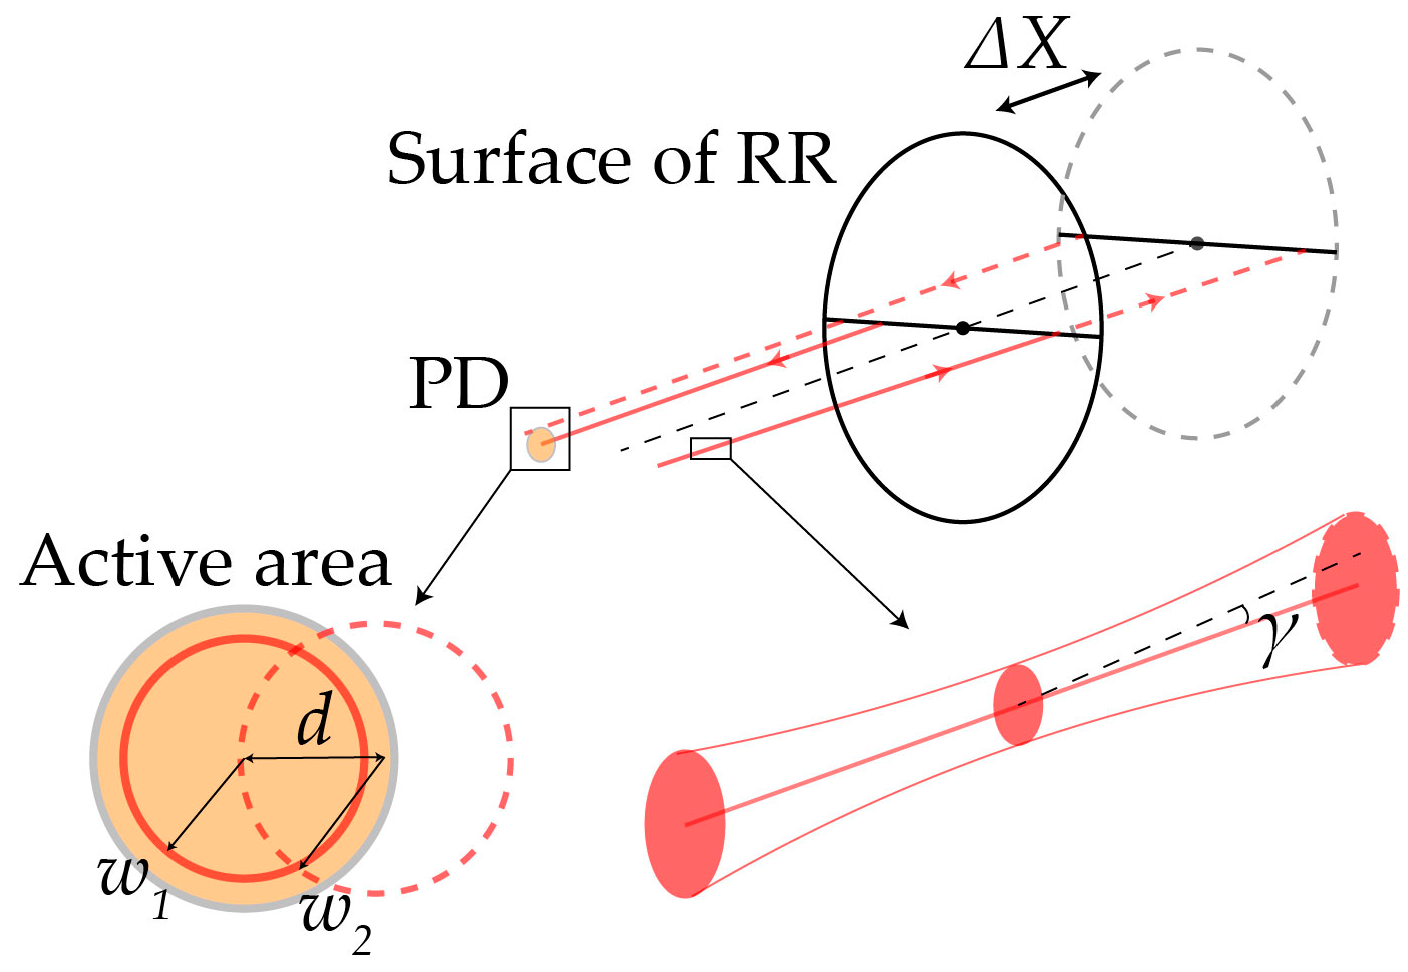
Moreover, the fluctuations in light intensity coupled in the photodetectors will cause changes in photoelectronic delays. As depicted in Figure 2 and Figure 3, this stems from the non-parallelism between the directions of light and movement, the non-ideal alignment of the photodetector, the straightness of the guide rail, and the far-field divergence of the Gaussian beam. The Gaussian beam intensity can be expressed as
I Q = A 0 2 exp [ 2 r 2 / w ( X ) ] ,
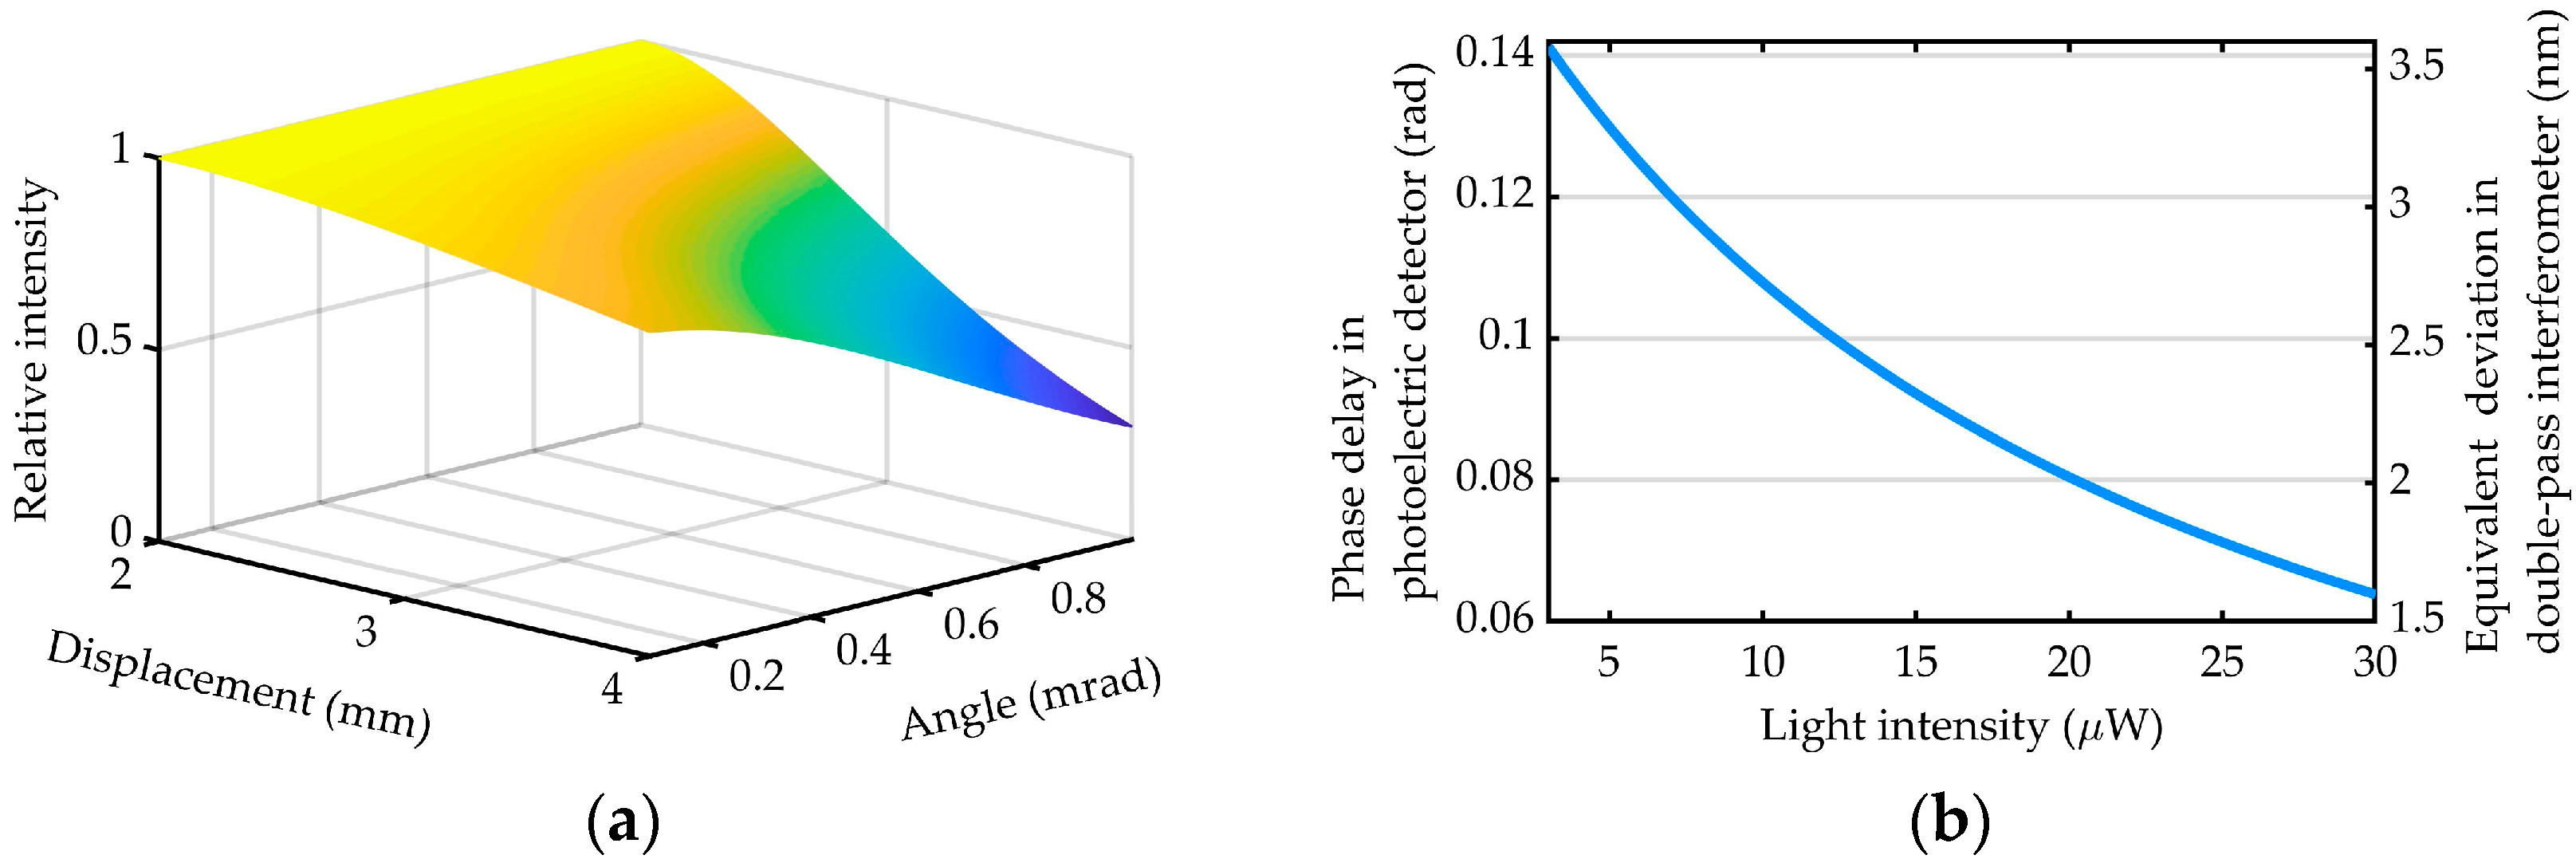
where A 0 denotes the amplitude of light, r represents the distance from a point on the plane to the center of the beam, and w(X) denotes the beam radius of displacement at X. The simulation of light intensity change with target movement is shown in Figure 4a. According to Equation (5), the phase shift in the photodetector and equivalent displacement deviation are shown in Figure 4b. Obviously, without careful treatment and adjustment, changes in light intensity can cause nano-level nonlinear errors in the resolution test process.
Due to the above, an autocollimator was used to minimize the angle between the direction of light and movement to 0.1 mrad, and the position of the second convex lens was adjusted to reduce the far-field divergence angle of the beam to around 0.2 mrad. In this way, nonlinear error can be suppressed below tens of picometers.
Finally, compared with a dual-frequency laser, light intensity modulation accomplished by an AOM provides more convenience for the change in signal amplitudes without fluctuation in average light intensity. Thus, this advantage gives the testing device the ability to test the influence of signal amplitudes on the resolution. Moreover, in order to make the testing device widely applicable to the resolution test for measurement electronics with different center frequencies, the modulation bandwidth was broadened by the optical configuration shown in Figure 5. The modulation bandwidth [33] can be expressed as follows:
B s = 2 v s λ cos θ B r a g g Δ θ B r a g g ,
where v s refers to sound velocity, and θ B r a g g and Δ θ B r a g g denote the Bragg diffraction angle and the divergence angle of the incident beam. Through the first convex lens shown in Figure 5, the radius of the incident beam is reduced with the increase in its divergence angle. After measurement by a CCD, the minimum beam radius behind the first convex is 78 μm and the divergence angle is 2.2 mrad. Thus, according to Equation (15), the modulation bandwidth is around 26 MHz, which can fully cover the center frequency range of most measurement electronics.

4. Experiments and Results

4.1. Experiment Setup

To ascertain the feasibility and adaptability of the proposed method, a resolution testing device was built as shown in Figure 6. The He-Ne laser (Melles Griot, model: 25-STP-912) provides a single-frequency beam with a wavelength of 632.8 nm as the light source. After passing through a convex lens with a focal length of 10 cm, the output beam is modulated by the AOM (Gooch & Housego, model: AOMO 3110-120). The utilized linear guide rail (BOCI Company, model: MTS104) equipped with a retroflector possesses a 200 mm range of motion and a 0.0025 mm displacement resolution. The measurement electronics under examination is composed of two 450 MHz high-bandwidth, low-noise photodetectors (Thorlabs, model: APD430A2), a high-precision self-developed phasemeter, and a host computer. It is worth mentioning that the phasemeter possesses a phase resolution of 0.77 mrad in the 2.5 MHz–37 MHz bandwidth, which is equivalent to the displacement resolution of 19 pm in the double-pass heterodyne interferometer [18].

4.2. Stability of the Testing Device

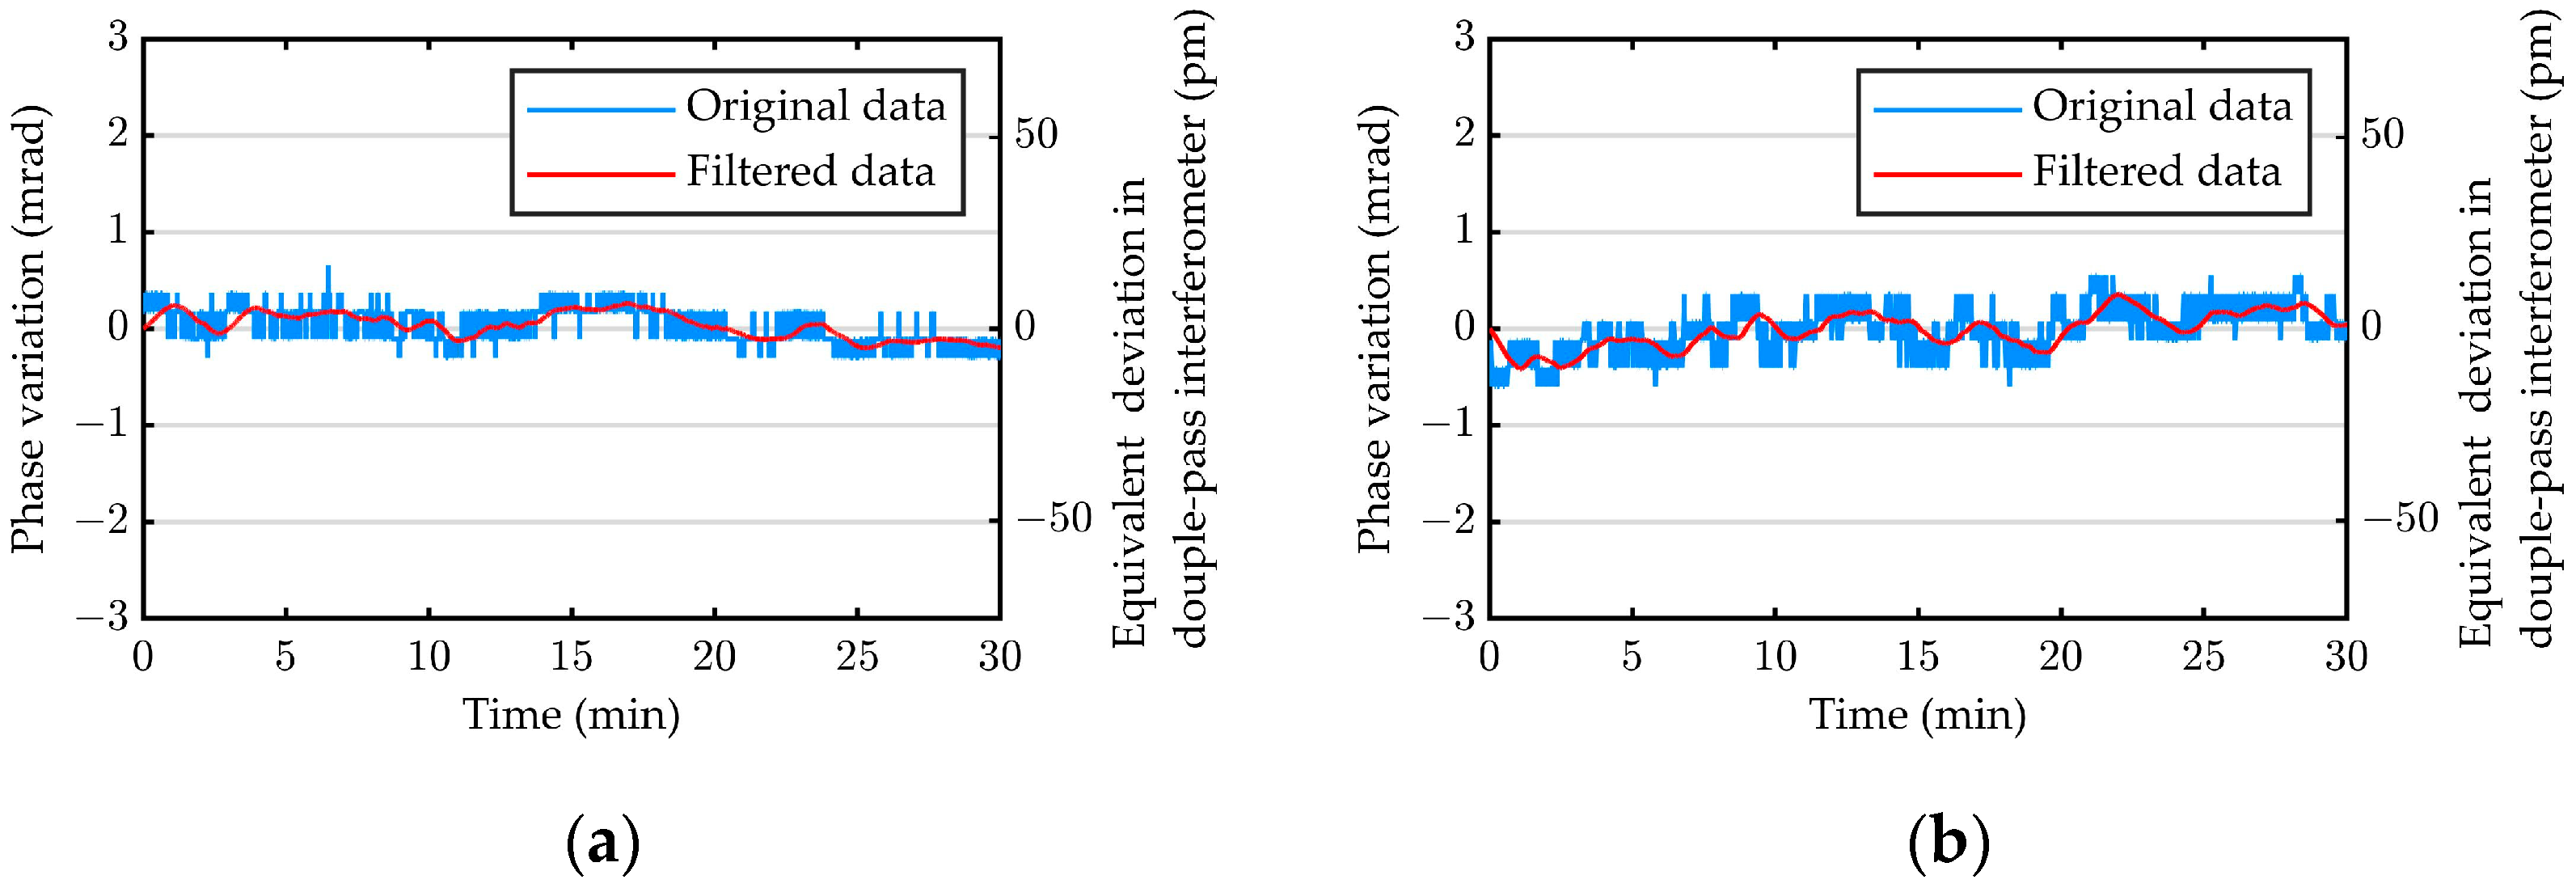
In order to verify whether the noise of the testing device can guarantee the test at pm-level resolution, the reference and measurement signals were connected to the lock-in amplifier (SR844) through photodetectors to perform the stability experiments. The phase measurement results covering a period of half an hour were recorded at 1 MHz and 20 MHz frequencies, respectively, as shown in Figure 7. For the results of 1 MHz signals, the peak-to-peak value of the phase variation was less than 0.67 mrad (17 pm). After using 500-point average filtering, the peak-to-peak value was reduced to 0.45 mrad (11 pm), and the standard deviation was 0.14 mrad (3.8 pm). And, for the results of 20 MHz signals, the peak-to-peak value of the phase variation was less than 1.05 mrad (29 pm). After using 500-point average filtering, the peak-to-peak value was reduced to 0.7 mrad (18 pm), and the standard deviation is 0.15 mrad (3.8 pm). The noise of the lock-in amplifier was ~0.087 mrad; therefore, the short-term jitters in the results reflect the noise from the testing device, and the long-term drift may be due to temperature change and stress release. Moreover, the deterioration in phase stability from Figure 7a,b is due to the increase in the signal wavelength, which is inevitable, and it is still small enough to support the picometer-level resolution test.
Therefore, the equivalent stability results of 3.8 pm in the double-pass heterodyne interferometer prove that the testing device possesses noise performance at the pm level, which can fully support high-resolution tests for measurement electronics.

4.3. Nonlinearity Suppression

In a previous study [25], a very serious nonlinear error occurred that was not solved by the authors. To verify the correctness of the error source analysis and the suppression effect of nonlinear error, we allowed the linear guide rail to move at a constant speed of 2.5 mm/s and recorded the measurement results of the measurement electronics and signal intensity output by the measurement photodetector simultaneously. Since the gain of the photodetector is fixed, the electrical signal intensity can reflect the light intensity coupled in the photosensitive area of the detector. To avoid the possibility that the phasemeter may possess nonlinearity [13,34], two different phasemeters with 1 MHz and 5 MHz center frequencies were used. As shown in Figure 8 and Figure 9, the nonlinear errors are very obvious without the proposed treatment and adjustment. However, after suppression, they were reduced from ±0.34 nm and ±60 pm to ±0.03 nm and ±7 pm in 1 MHz and 5 MHz, respectively, which is about 10% of the original level. Moreover, Figure 8b and Figure 9b show the variation in the light intensity and nonlinear error at different guide rail positions. The light intensity is different at different positions, and, thus, the phase shift of the photodetector is also different, which introduces nonlinear errors. In addition, under both frequencies, the correlation between the nonlinear error and the light intensity variation can be clearly seen, which proves that in the fluctuation of light intensity is the source of nonlinear error. Moreover, this correlation is consistent with the findings of previous studies [30,31]. Therefore, by paying careful attention to the variation in light intensity, the testing device solves the problem of nonlinearity in the resolution test. And the nonlinear error is greatly suppressed, with a minimum level of ±7 pm.

4.4. Resolution Test under Different Conditions

In order to conduct a comprehensive, universal resolution test of measurement electronics, testing devices should be able to perform resolution tests under different signal amplitudes and frequencies.
First, by maintaining the modulation bias and reducing the modulation depth, the signal-to-noise ratio of the signals’ output by the photodetector was attenuated gradually. The resolution test was performed under three different signal amplitudes of 0.85 V, 0.35 V, and 0.1 V, and the results are shown in Figure 10. It can be seen that, as the signal amplitude decreases, the noise of the measurement results increases, and the displacement steps are no longer clear to completely indistinguishable. Thus, using the testing device, it can be established at which signal amplitude the resolution of measurement electronics will decrease and fail.
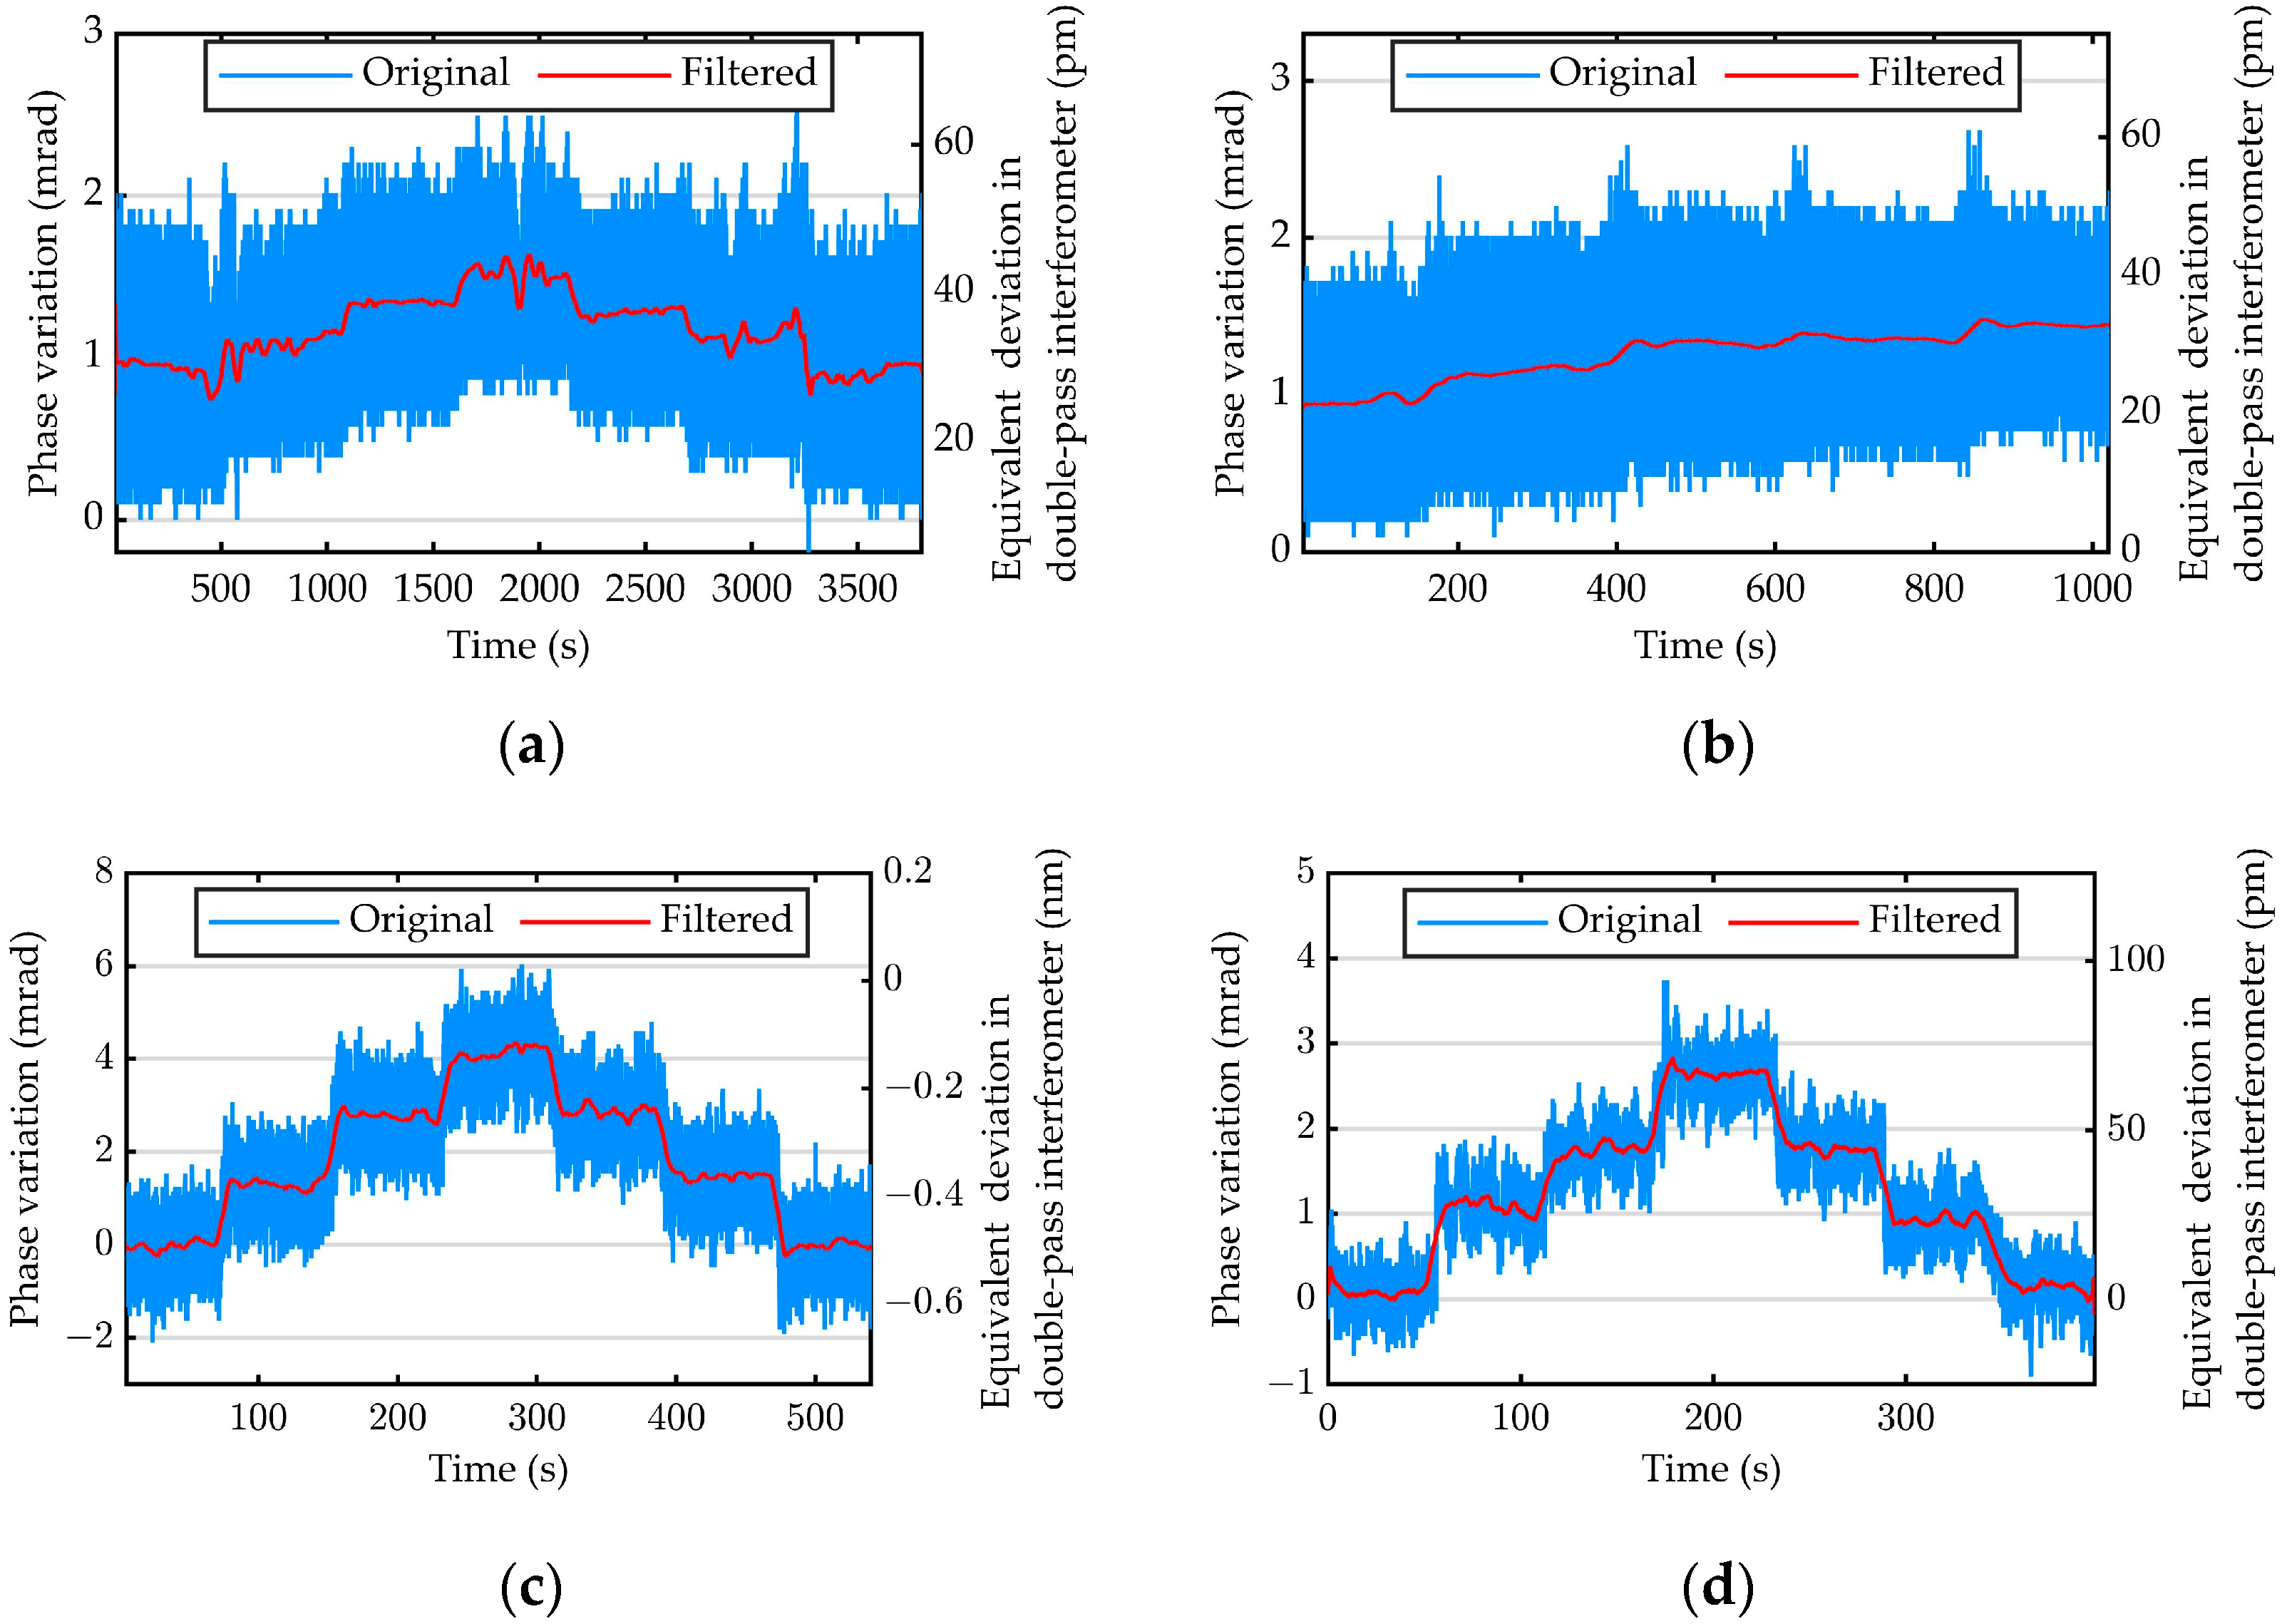
Furthermore, three phasemeters with center frequencies of 1 MHz, 5 MHz, and 20 MHz were selected to form the measurement electronics to test the universal applicability and ultimate resolution of the testing device. Figure 11 shows the resolution test results of measurement electronics with a 1 MHz center frequency, and the red curve is the result of 500-point average filtering. The phase steps of 0.2 mrad and 0.1 mrad can be clearly distinguished, which means that the measurement electronics possess a resolution of 2.5 pm in a double-pass heterodyne interferometer.
The resolution test results of measurement electronics with 5 MHz and 20 MHz center frequencies are shown in Figure 11c,d, respectively. Three phase steps of 1.5 mrad can be clearly seen in Figure 11c, which means that the resolution of the measurement electronics with a 5 MHz center frequency is 38 pm. Moreover, three clear phase steps of 0.77 mrad are shown in Figure 11d, which proves that the phasemeter in [18] truly possesses a displacement resolution of 19 pm. This result also indirectly proves the effectiveness of the resolution test using the testing device.

5. Discussion

In actual conditions, the intensity modulation using the AOM is not linear, as shown in Equations (8) and (9). The diffraction efficiency of the Bragg diffraction in the acousto-optic modulator can be expressed as [33] follows:
η a = I Q I i n = sin 2 [ π λ L M 2 P s 2 H ] ,
where L and H denote the length and width of the transducer, respectively; M 2 denotes the quality factor of the acousto-optic material; and P s is the driving power, and can be expressed as follows:
P s = m 2 s 2 ,
where m represents the transfer coefficient. Thus, the modulated light intensity can be expressed as follows:
I Q = I i n sin 2 ( n m s ) .
By putting Equation (7) into Equation (18) and performing the Taylor expansion at the modulation bias, the modulated signal can be described as:
I Q = A + B cos ( 2 π F t ) + C cos ( 4 π F t ) + D cos ( 6 π F t ) + o [ N 3 cos 3 ( 2 π F t ) ] ,
where A, B, C, and D denote the amplitudes of harmonics and can be expressed as follows:
{ A = I i n 2 [ 1 + n 2 m 2 N 2 cos ( 2 n m M ) ] B = I i n 2 ( 2 n m N + n 3 m 3 N 3 ) sin ( 2 n m M ) C = I i n 2 n 2 m 2 N 2 cos ( 2 n m M ) D = I i n 6 n 3 m 3 N 3 sin ( 2 n m M ) .
It is evident that the sinusoidal light intensity modulation signal output by the AOM possesses multiple harmonics. However, in the proposed testing device, since only the linear modulation region is used, harmonics distortion is very low according to Equation (20). Moreover, in contrast to periodic nonlinearity in the heterodyne interferometer [35,36], the harmonic frequencies in the testing device are far away from the center frequency, and the harmonics in Equation (19) are basically filtered out by the analog and digital filters in the measurement electronics. Therefore, it is not necessary to worry about the modulation nonlinearity of the AOM in the proposed resolution test method.

6. Conclusions

In this study, through the analysis of the noises and errors affecting the resolution of a heterodyne interferometer, we emphasize the challenges and demands of the resolution test for measurement electronics. A picometre-level resolution test method for heterodyne interferometer measurement electronics is proposed, which solves the issue of nonlinearity and possesses extensive applicability. The experimental results show that the noise of the testing device is better than 0.15 mrad, which is equivalent to the noise of 3.8 pm in a double-pass interferometer. Moreover, the nonlinear error of the testing device is suppressed to 10% of the original, whose minimum level is ±7 pm and is much smaller than the ± 0.2 nm residual error in the previous method [25]. The testing device can generate a minimum phase step of 0.1 mrad at 1 MHz, which means that it can test the resolution of measurement electronics up to 2.5 pm in a double-pass interferometer. Compared with the level of 18.5 pm noted in a previous method [25], a certain degree of improvement was achieved. Finally, we verified both the resolution test’s ability under different signal amplitudes and its adaptability to any measurement electronics with a center frequency in the range of 1 MHz to 20 MHz. The future development directions of the test method are as follows: testing the resolution of any phase point in the whole cycle of measurement electronics through two modulation devices, and using laser diode intensity modulation combined with optical fibers to make the structure of the testing device more concise.

Author Contributions

Conceptualization, Y.S. and W.L.; methodology, Y.S.; software, X.X.; validation, Y.S., W.L. and X.X.; formal analysis, Y.S.; investigation, Y.S. and J.W.; resources, P.H.; data curation, W.L.; writing—original draft preparation, Y.S.; writing—review and editing, X.X.; visualization, W.L.; supervision, J.T.; project administration, P.H.; funding acquisition, P.H. All authors have read and agreed to the published version of the manuscript.

Funding

This research was funded by the National Key Research and Development Program of China under Grant 2022YFF0605100.

Institutional Review Board Statement

Not applicable.

Informed Consent Statement

Not applicable.

Data Availability Statement

The data are available on request.

Conflicts of Interest

The authors declare no conflicts of interest.

References

  1. Haitjema, H. The Calibration of Displacement Sensors. Sensors 2020, 20, 584. [Google Scholar] [CrossRef]
  2. Papazetis, G.; Avrampos, P.; Papantoniou, A.; Vosniakos, G. Machine Tools Metrology Using Laser Systems. In Proceedings of the 7th Annual National Congress on Metrology, Athens, Greece, 11–12 May 2018. [Google Scholar]
  3. Yang, P.; Xing, G.; He, L. Calibration of high-frequency hydrophone up to 40 MHz by heterodyne interferometer. Ultrasonics 2014, 54, 402–407. [Google Scholar] [CrossRef]
  4. Yang, S.; Zhang, G. A review of interferometry for geometric measurement. Meas. Sci. Technol. 2018, 29, 102001. [Google Scholar] [CrossRef]
  5. Yu, X.; Gillmer, S.R.; Woody, S.C.; Ellis, J.D. Development of a compact, fiber-coupled, six degree-of-freedom measurement system for precision linear stage metrology. Rev. Sci. Instrum. 2016, 87, 065109. [Google Scholar] [CrossRef] [PubMed]
  6. Xie, Q.; Hong, M.; Tan, H.; Chen, G.; Shi, L.; Chong, T. Fabrication of nanostructures with laser interference lithography. J. Alloys Compd. 2008, 449, 261–264. [Google Scholar] [CrossRef]
  7. Hu, Y.; Wang, Z.; Weng, Z.; Yu, M.; Wang, D. Bio-inspired hierarchical patterning of silicon by laser interference lithography. Appl. Opt. 2016, 55, 3226–3232. [Google Scholar] [CrossRef]
  8. Demarest, F.C. High-resolution, high-speed, low data age uncertainty, heterodyne displacement measuring interferometer electronics. Meas. Sci. Technol. 1999, 9, 1024. [Google Scholar] [CrossRef]
  9. Diao, X.; Hu, P.; Xue, Z.; Kang, Y. High-speed high-resolution heterodyne interferometer using a laser with low beat frequency. Appl. Opt. 2016, 55, 110–116. [Google Scholar] [CrossRef]
  10. Weichert, C.; Flügge, J.; Köning, R.; Bosse, H.; Tutsch, R. Aspects of design and the characterization of a high resolution heterodyne displacement interferometer. In Proceedings of the Fringe 2009: 6th International Workshop on Advanced Optical Metrology, Nürtingen, Germany, 14–16 September 2009; pp. 1–6. [Google Scholar] [CrossRef]
  11. Köchert, P.; Flügge, J.; Weichert, C.; Köning, R.; Manske, E. Phase measurement of various commercial heterodyne He–Ne-laser interferometers with stability in the picometer regime. Meas. Sci. Technol. 2012, 23, 074005. [Google Scholar] [CrossRef]
  12. Oldham, N.M.; Kramar, J.A.; Hetrick, P.; Teague, E. Electronic limitations in phase meters for heterodyne interferometry. Precis. Eng. 1993, 15, 173–179. [Google Scholar] [CrossRef]
  13. Bobroff, N. Recent advances in displacement measuring interferometry. Meas. Sci. Technol. 1993, 4, 907. [Google Scholar] [CrossRef]
  14. Lawall, J.; Kessler, E. Michelson interferometry with 10 pm accuracy. Rev. Sci. Instrum. 2000, 71, 2669–2676. [Google Scholar] [CrossRef]
  15. Cao, Y.; Bu, X.; Xu, M.; Han, W. APD optimal bias voltage compensation method based on machine learning. ISA Trans. 2020, 97, 230–240. [Google Scholar] [CrossRef] [PubMed]
  16. Su, Z.; Liang, X.; Bi, S. Noise analysis and determination method of optimum multiplication rate for APD sensor. In Proceedings of the International Conference on Automatic Control and Artificial Intelligence (ACAI 2012), Xiamen, China, 3–5 March 2012; pp. 1403–1406. [Google Scholar] [CrossRef]
  17. Zhang, E.; Chen, B.; Zheng, H.; Teng, X. Laser heterodyne interference signal processing method based on phase shift of reference signal. Opt. Express 2018, 26, 8656–8668. [Google Scholar] [CrossRef] [PubMed]
  18. Hu, P.; Wang, J.; Lin, X.; Xing, X.; Fu, H.; Tan, J. Phase Measurement Method Based on Digital Dual Frequency Comb for High-Precision High-Speed Heterodyne Interferometry. IEEE Sens. J. 2023, 23, 9707–9715. [Google Scholar] [CrossRef]
  19. Deng, W.; Peng, X. A high precision phase extraction method in heterodyne interferometer based on FPGA. J. Phys. Conf. Ser. 2022, 2387, 012002. [Google Scholar] [CrossRef]
  20. Agilent Technologies, Inc. Agilent N1225A Four-Channel High Resolution Laser Axis Board for VME, 2nd ed.; Agilent Technologies, Inc.: Santa Clara, CA, USA, 2007. [Google Scholar]
  21. Zygo. ZMI™ 4100 Series Measurement Board. Available online: https://www.zygo.com.cn/products/nano-position-sensors/displacement-measuring-interferometers/measurement-electronics (accessed on 20 February 2024).
  22. Physik Instrumente (PI) GmbH & Co., KG. LISA Linear Actuator and Stage P-753. Available online: https://www.physikinstrumente.com/en/products/nanopositioning-piezo-flexure-stages/linear-piezo-flexure-stages/p-753-lisa-linear-actuator-stage-200900/#downloads (accessed on 24 March 2024).
  23. Yang, T.; Yan, L.; Chen, B.; Liu, Y.; Tian, Q. Signal processing method of phase correction for laser heterodyne interferometry. Opt. Lasers Eng. 2014, 57, 93–100. [Google Scholar] [CrossRef]
  24. Zhang, E.; Chen, B.; Yan, L.; Yang, T.; Hao, Q.; Dong, W.; Li, C. Laser heterodyne interferometric signal processing method based on rising edge locking with high frequency clock signal. Opt. Express 2013, 21, 4638–4652. [Google Scholar] [CrossRef] [PubMed]
  25. Chang, D.; Wang, J.; Hu, P.; Tan, J. Zoom into picometer: A picoscale equivalent phase-difference-generating method for testing heterodyne interferometers without ultraprecision stages. Opt. Eng. 2019, 58, 064101. [Google Scholar] [CrossRef]
  26. Badami, V.; de Groot, P. Displacement measuring interferometry. In Handbook of Optical Dimensional Metrology; CRC Press: Boca Raton, FL, USA, 2013; Volume 4. [Google Scholar] [CrossRef]
  27. Ellis, J.D. Field Guide to Displacement Measuring Interferometry; SPIE Press: Bellingham, WA, USA, 2014. [Google Scholar]
  28. Stone, J. Test and Calibration of Displacement Measuring Laser Interfe-Rometers. In Proceedings of the 3rd International Conference on Mechanical Metrology (CIMMEC III), Gramado, Brazil, 14–16 October 2014. [Google Scholar]
  29. Haitjema, H. Calibration of Displacement Laser Interferometer Systems for Industrial Metrology. Sensors 2019, 19, 4100. [Google Scholar] [CrossRef]
  30. Miyata, T.; Araki, T.; Iwata, T. Correction of the intensity-dependent phase delay in a silicon avalanche photodiode by controlling its reverse bias voltage. IEEE J. Quantum Electron. 2003, 39, 919–923. [Google Scholar] [CrossRef]
  31. Wang, J.; Sun, Y.; Xing, X.; Hu, P.; Chang, D.; Tan, J. Equivalent Measurement and Real-Time Compensation of Error Caused by Intensity Change in Deep Sub-Nanometer Displacement Measuring Interferometry. Photonics 2022, 9, 714. [Google Scholar] [CrossRef]
  32. Song, Z.; Zhou, Z.; Huang, J.; Zou, X.; Yang, C.; Chen, B. Analysis of AM-to-PM conversion in MUTC photodiodes based on an equivalent circuit model. Opt. Express 2021, 29, 33582–33591. [Google Scholar] [CrossRef] [PubMed]
  33. Goutzoulis, A.P. Design and Fabrication of Acousto-Optic Devices; CRC Press: Boca Raton, FL, USA, 2021. [Google Scholar]
  34. Eom, T.B.; Kim, J.A.; Kang, C.-S.; Park, B.C.; Kim, J.W. A simple phase-encoding electronics for reducing the nonlinearity error of a heterodyne interferometer. Meas. Sci. Technol. 2008, 19, 075302. [Google Scholar] [CrossRef]
  35. Badami, V.; Patterson, S. A frequency domain method for the measurement of nonlinearity in heterodyne interferometry. Precis. Eng. 2000, 24, 41–49. [Google Scholar] [CrossRef]
  36. Chen, H.; Jiang, B.; Shi, Z. Synthetic model of nonlinearity errors in laser heterodyne interferometry. Appl. Opt. 2018, 57, 3890–3901. [Google Scholar] [CrossRef]
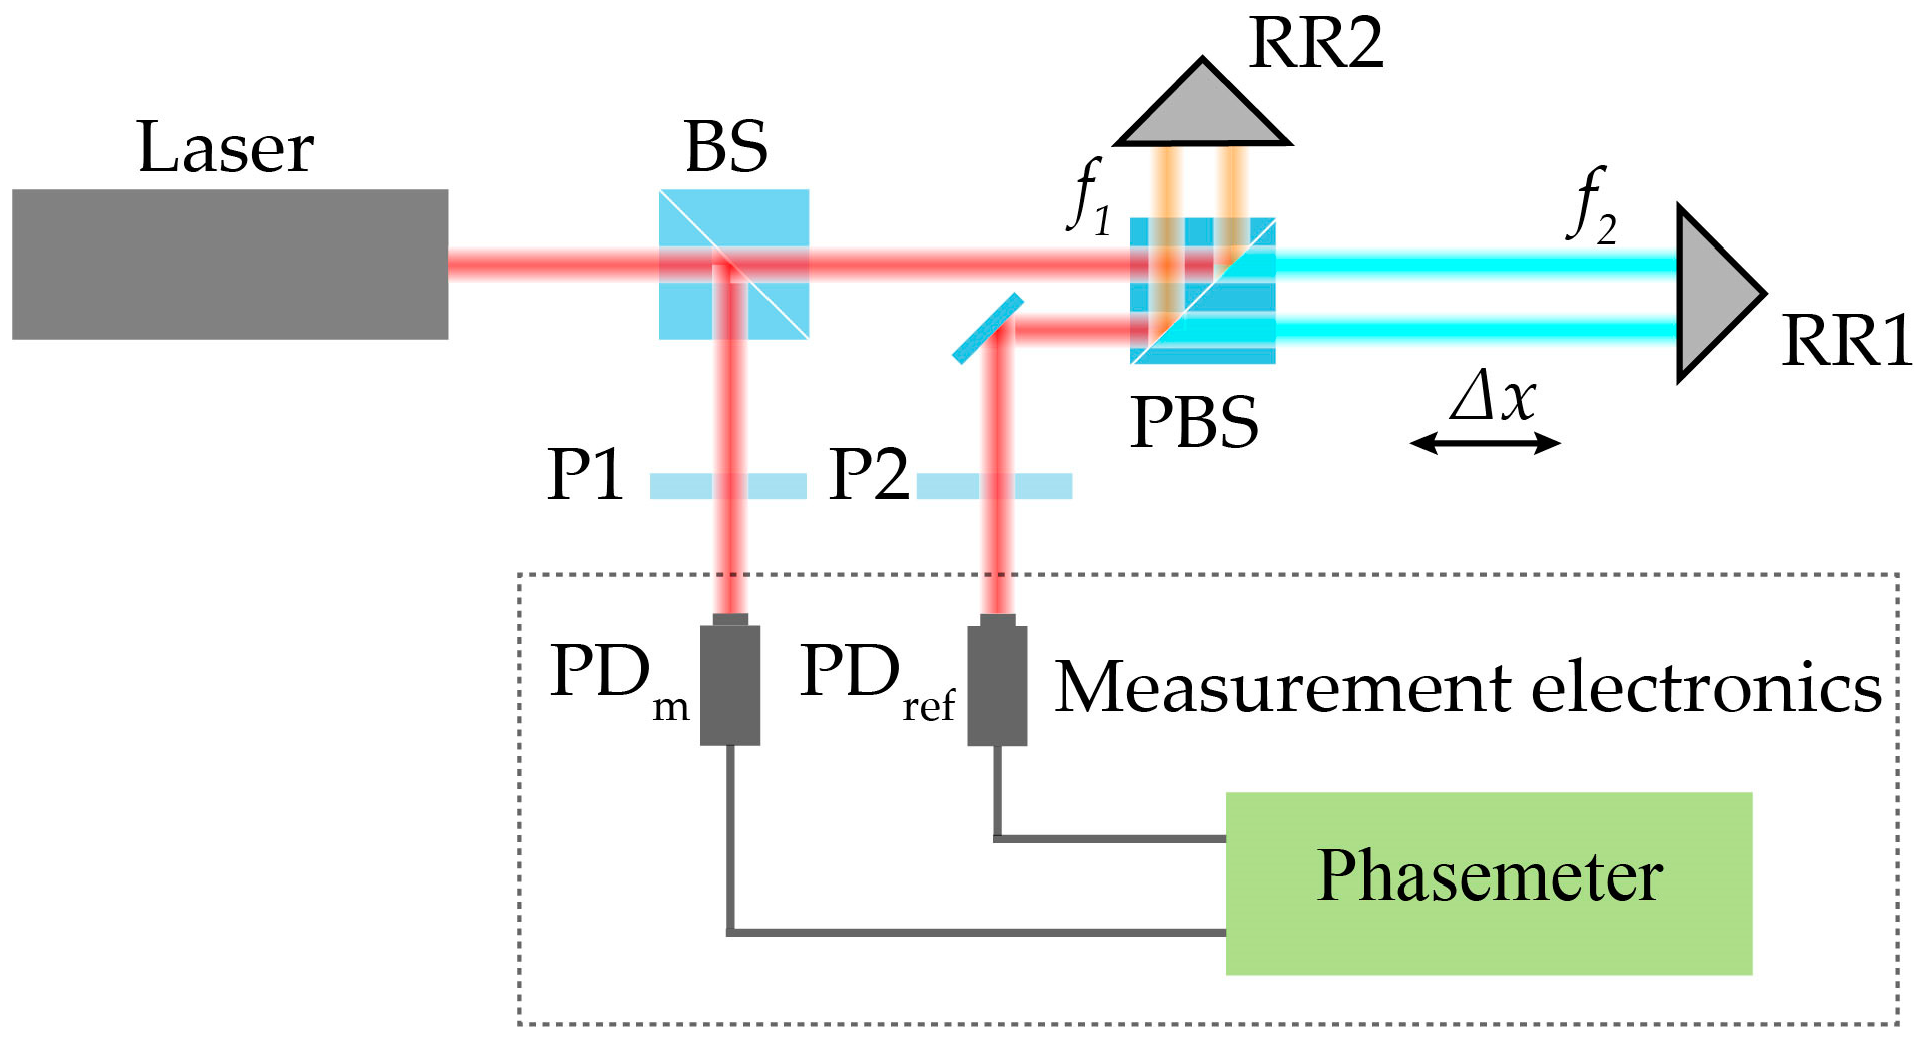
Figure 1. Schematic of the heterodyne interferometer. BS, beam splitter; P1 and P2, polarizers; PBS, polarized beam splitter; RR1 and RR2, retroreflectors; PDm and PDref, photodetectors.
Photonics 11 00331 g001
Figure 2. Schematic of the resolution test method for heterodyne interferometer measurement electronics. NPBS, non-polarized beam splitter; RR, retroreflector.
Photonics 11 00331 g002
Figure 3. Geometric scheme showing the causes of light intensity fluctuation. d, distance between two light spots; w1 and w2, radius of two light spots; PD, photodetector; γ, angle between beam direction and RR movement direction; RR, retroreflector.
Photonics 11 00331 g003
Figure 4. Simulation results of light intensity variation (a) and the equivalent displacement deviation (b) during the movement of the retroreflector.
Photonics 11 00331 g004
Figure 5. Optical configuration for reducing the divergence angle and expanding the modulation bandwidth.
Photonics 11 00331 g005
Figure 6. Experiment setup of the testing device.
Photonics 11 00331 g006
Figure 7. Phase stability of the testing device at signal frequencies of 1 MHz (a) and 20 MHz (b).
Photonics 11 00331 g007
Figure 8. Test results of linear motion at the center frequency of 5 MHz. (a) Measurement results of measurement electronics, and (b) changes in light intensity and nonlinear error with the movement of the retroreflector.
Photonics 11 00331 g008
Figure 9. Test results of linear motion at the center frequency of 1 MHz. (a) Measurement results of measurement electronics, and (b) changes in light intensity and nonlinear error with the movement of the retroreflector.
Photonics 11 00331 g009
Figure 10. Resolution test results of measurement electronics with the center frequency of 5 MHz under different signal amplitudes of 0.85 V (a), 0.35 V (b), and 0.1 V (c).
Photonics 11 00331 g010
Figure 11. Resolution test results of the measurement electronics with different center frequencies. (a) The 5 pm resolution test results at a center frequency of 1 MHz; (b) the 2.5 pm resolution test results at a center frequency of 1 MHz; (c) the 38 pm resolution test results at a center frequency of 5 MHz; and (d) the 19 pm resolution test results at a center frequency of 20 MHz.
Photonics 11 00331 g011
Disclaimer/Publisher’s Note: The statements, opinions and data contained in all publications are solely those of the individual author(s) and contributor(s) and not of MDPI and/or the editor(s). MDPI and/or the editor(s) disclaim responsibility for any injury to people or property resulting from any ideas, methods, instructions or products referred to in the content.