Article

Peripheral Wavefront Sensor with Fixation Target Made by Optical Simulation for Measuring Human Eye Regardless of Spectacle

1
Department of Electrical and Computer Engineering, Inha University, Incheon 22212, Republic of Korea
2
Center for Sensor Systems, College of Engineering, Inha University, Incheon 22212, Republic of Korea
3
College of Optometry, University of Houston, Houston, TX 77004, USA
4
Department of Ophthalmology, College of Medicine, Uijeongbu St. Mary’s Hospital, The Catholic University of Korea, 222, Banpo-daero, Seocho-gu, Seoul 06591, Republic of Korea
5
Inha Research Institute for Aerospace Medicine, Inha University, Incheon 22212, Republic of Korea
*
Authors to whom correspondence should be addressed.
These authors contributed equally to this work.
Photonics 2024, 11(4), 332; https://doi.org/10.3390/photonics11040332
Submission received: 17 December 2023 / Revised: 29 March 2024 / Accepted: 29 March 2024 / Published: 2 April 2024

Abstract

:
This study proposes a custom-built aberrometer that measures peripheral defocus to evaluate myopia progression in the human eye. This advanced device can measure visual fields in both horizontal (up to 40°) and vertical (up to 30°) orientations. It incorporates a novel fixation target that is meticulously designed using an optical simulation software. Notably, each angular point of this novel fixation target differs considerably from the conventional fixation target. To mitigate the effects of the optical variations introduced by spectacles and the subject’s vision, we incorporated a position-variable lens positioned in front of the eye. This lens compensates for these variations, enhancing the precision of the measurements. To evaluate the performance of the proposed aberrometer, we conducted experiments under three distinct conditions: first, with the naked eye; second, while wearing spectacles; and third, while wearing a multifocal lens.

1. Introduction

Myopia is a prevalent global ophthalmic condition [1,2,3,4,5,6,7]. Almost 2.0 billion individuals are affected by myopia [6], and it is estimated that half of the population will be affected by myopia by 2050 [7]. However, the causes and remedies remain unclear. Previous studies have postulated several causes of myopia, including accommodation lag, environmental factors, and peripheral defocus [4,8,9,10,11,12,13,14,15]. According to the peripheral defocus hypothesis, changes in eye length are triggered to compensate for the defocus in the peripheral retina [16]. Accurate assessment of peripheral retinal defocus is crucial for diagnosing myopia progression [17,18]. Defocus values can be determined by calculating aberrations measured with an aberrometer using Zernike polynomials [17,19,20]. Measuring peripheral defocus necessitates the use of an aberrometer and a fixation target. Because of the simplicity of the aberrometer, additional measurement devices can be employed [9,10,17,21]. For example, Lundström et al. reported the use of an aberrometer for measuring peripheral defocus during an accommodation process along with the Badal system [18], and Jaeken et al. improved the measurement speed by attaching a scanner to the aberrometer [22].
Despite recent advancements, aberrometers still have limitations in measuring peripheral defocus in the human eye. First, the design of the fixation target in the aberrometer must consider the optical properties of the human eye, including its curvature and refractive index. Failure to do so can result in a fixation target that measures a different peripheral retinal angle than intended. Second, variations in optical properties introduce changes in the light path, leading to measurement errors. This complicates the analysis of peripheral defocus in individuals who wear spectacles. Previous research faced difficulties, such as reflections and refractions caused by spectacles, making it challenging to compare spectacled eyes under different conditions [18]. Consequently, the correlation between spectacle uses and the progression of myopia has been largely unexplored. Third, when measuring subjects with different degrees of myopia (mild myopia ≤ −3D, moderate myopia: −3D~−6D, and high myopia ≥ −6D), conventional aberrometers require additional optics to adapt the system for each case. Incorporating these additional optics increases the complexity and size of the system, thereby making it less practical. However, our developed aberrometer overcomes these challenges and can effectively analyze peripheral defocus regardless of the presence of spectacles without the need for additional optics.
This study proposes a novel aberrometer incorporating a Shack–Hartmann wavefront sensor (SHWFS) for measuring peripheral defocus with two key objectives. First, we considered the optical properties of the human eye using a newly designed fixation target created through optical simulation using OpticStudio® (19.4 SP2 version, Zemax, LCC, Washington, DC, USA). Using optical simulation results, we demonstrated disparities at various angular points between the newly designed fixation target and the conventional one. Our second objective was to reduce the involuntary variations originating from spectacles and the subject’s optical properties. To achieve this, we used a position-variable lens positioned in front of the subject’s eye. We conducted experiments under three eye conditions: with the naked eye, while wearing spectacles, and while wearing a multifocal lens. Furthermore, we compared the results acquired from myopic subjects to investigate the correlation between the peripheral defocus and eye measurement conditions. Both horizontal and vertical results are expressed as relative spherical error graphs. In addition, this study establishes the repeatability and reliability of the new aberrometer through statistical analysis.

2. Methods

2.1. Hardware and Setting

Figure 1 shows the schematic of the aberrometer. It uses an 832 nm superluminescent laser diode (SLD; SLD-380-MP-TO9, Superlum, Carrigtohill, Ireland) with a bandwidth of 17 nm. The current controller is in place to ensure that the power of the SLD entering the eye remains below 10 μW. In addition, a 500 μm pinhole is positioned in front of the light source to limit the diameter of the SLD entering the eye to less than 1 mm.
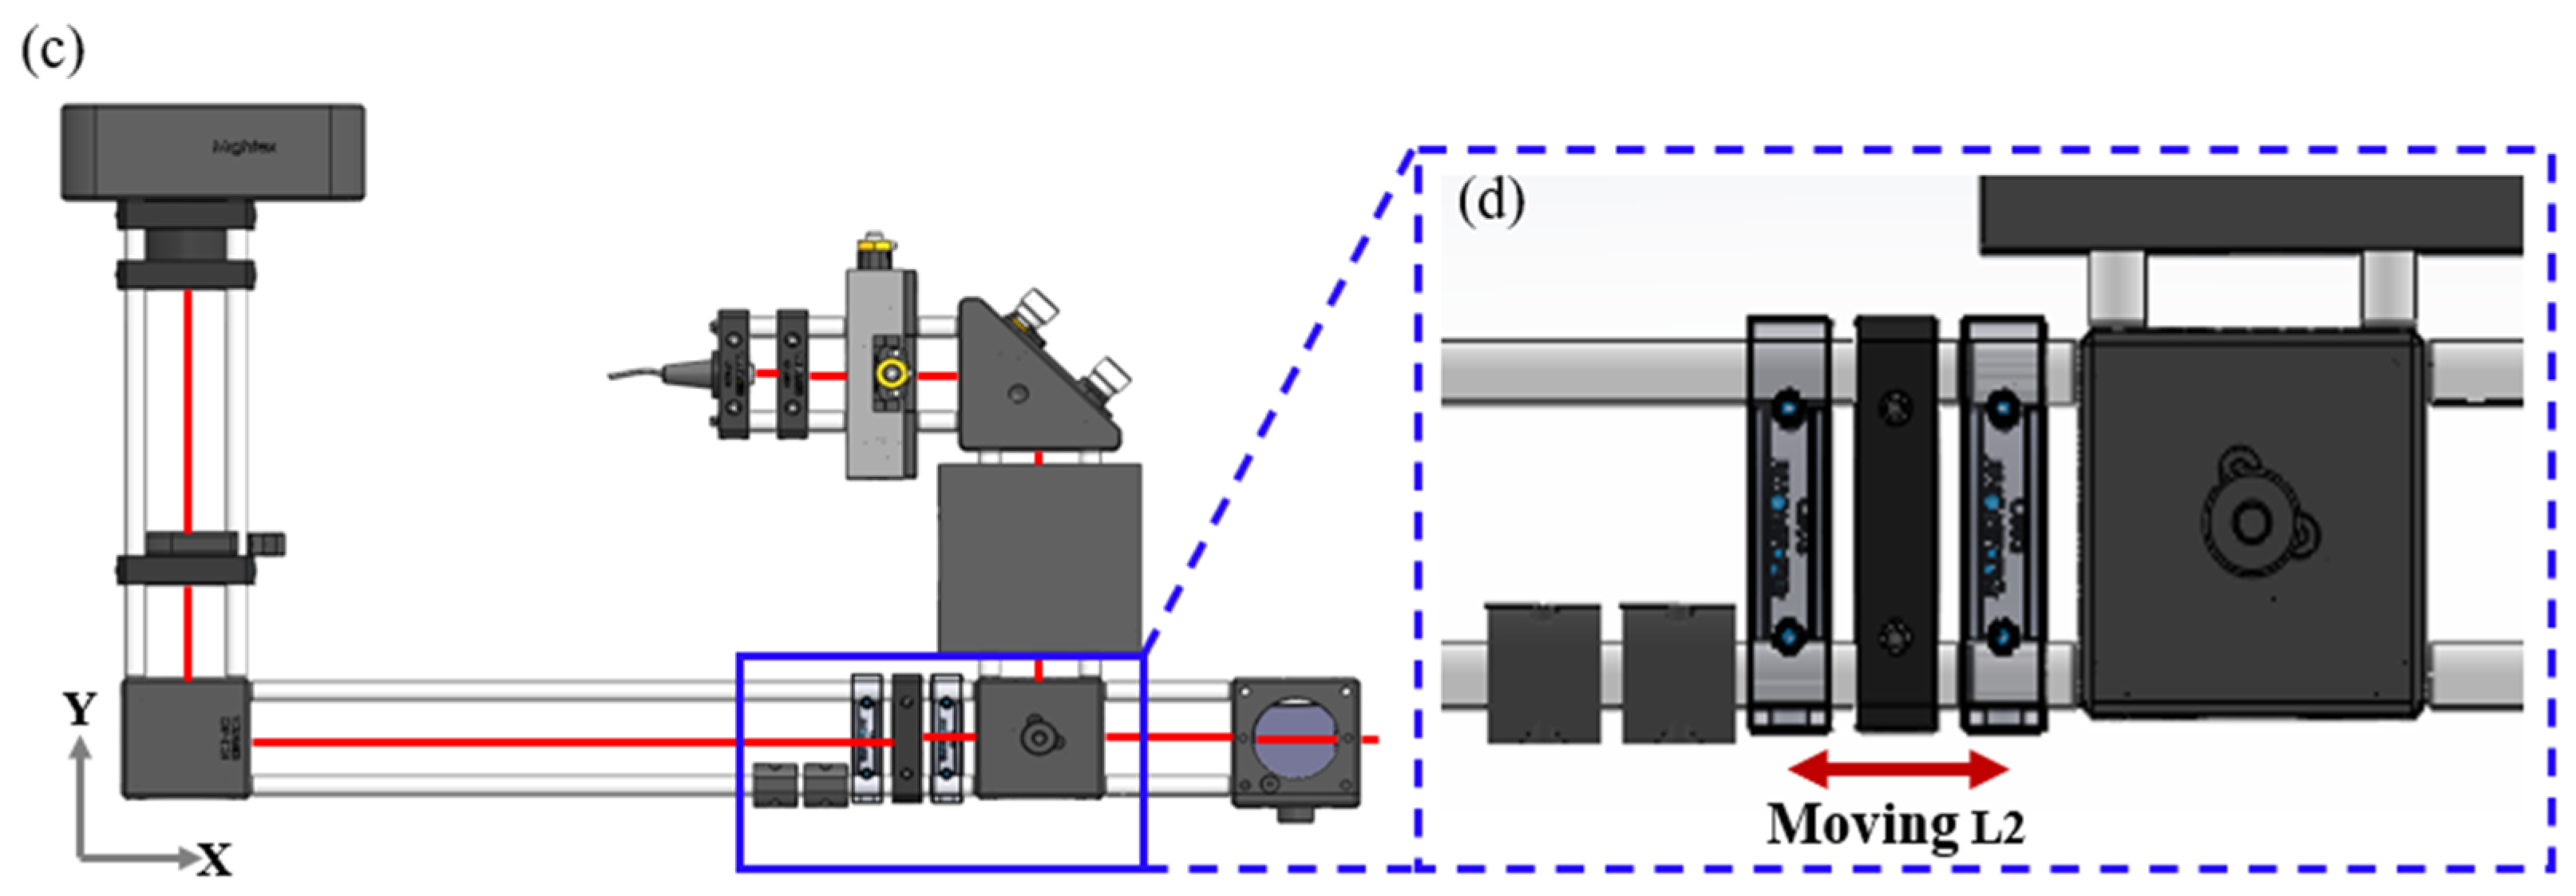
The reflected light from the retina is directed through a telescope system formed by lenses L2 and L3, leading to a wavefront sensor (WFS) equipped with a microlens array and a charge-coupled device (CCD) camera (CXE-B013-U, Mightex, Toronto, Canada). The microlens array has a focal length of 3.33 mm and a lenslet pitch of 150 μm. The CCD camera has a resolution of 1392 × 1040 and a pixel size of 6.45 μm × 6.45 μm. Subjects stabilize their position by resting their chin on a chin rest, and an operator makes adjustments to the aberrometer in three dimensions (X, Y, and Z) using a three-dimensional translational stage. Figure 1c,d and Figure 2 show the process of modifying L2 to compensate for variations in optical properties related to focal length discrepancies among subjects or resulting from eye conditions, such as wearing glasses or contact lenses. By changing the position of L2, the effects of cornea reflection are minimized, and the clarity of the wavefront signals is enhanced.

2.2. Experiment Process

Three subjects with varying degrees of myopia are presented by their spherical refraction values in Table 1. Due to the different spherical refractions, the subject’s accommodation of the eye should have varied during the measurements. The accommodation of the eye was not paralyzed in measuring aberration. Before the experiment, the subjects sat in a dark room for five minutes to naturally dilate their pupils. To ensure that measurements were obtained exclusively from the right eye, subjects wore an eye patch on their left eye, allowing them to focus solely on the fixation target. To minimize head movement during the experiments, the subjects rested their chin on a chin rest while an operator adjusted the aberrometer for each subject. Throughout the experiments, the subjects fixated on a target that continuously changed its measurement angle. The fixation target underwent incremental variations, with steps of 10° in the horizontal direction, ranging from −20° to +20°, and 7.5° steps in the vertical direction ranging from −15° to +15°. To enhance eye stability, the fixation target was designed in the shape of a bull’s eye, measuring between 0.4° and 0.6° [23,24]. Experiments were conducted under three different eye conditions: natural vision (naked eye), wearing eyeglasses, and wearing a multifocal soft contact lens (MFSCL). Each experiment for a particular condition lasted less than 20 s, with a one-minute interval between each condition.

2.3. OpticStudio® Simulation

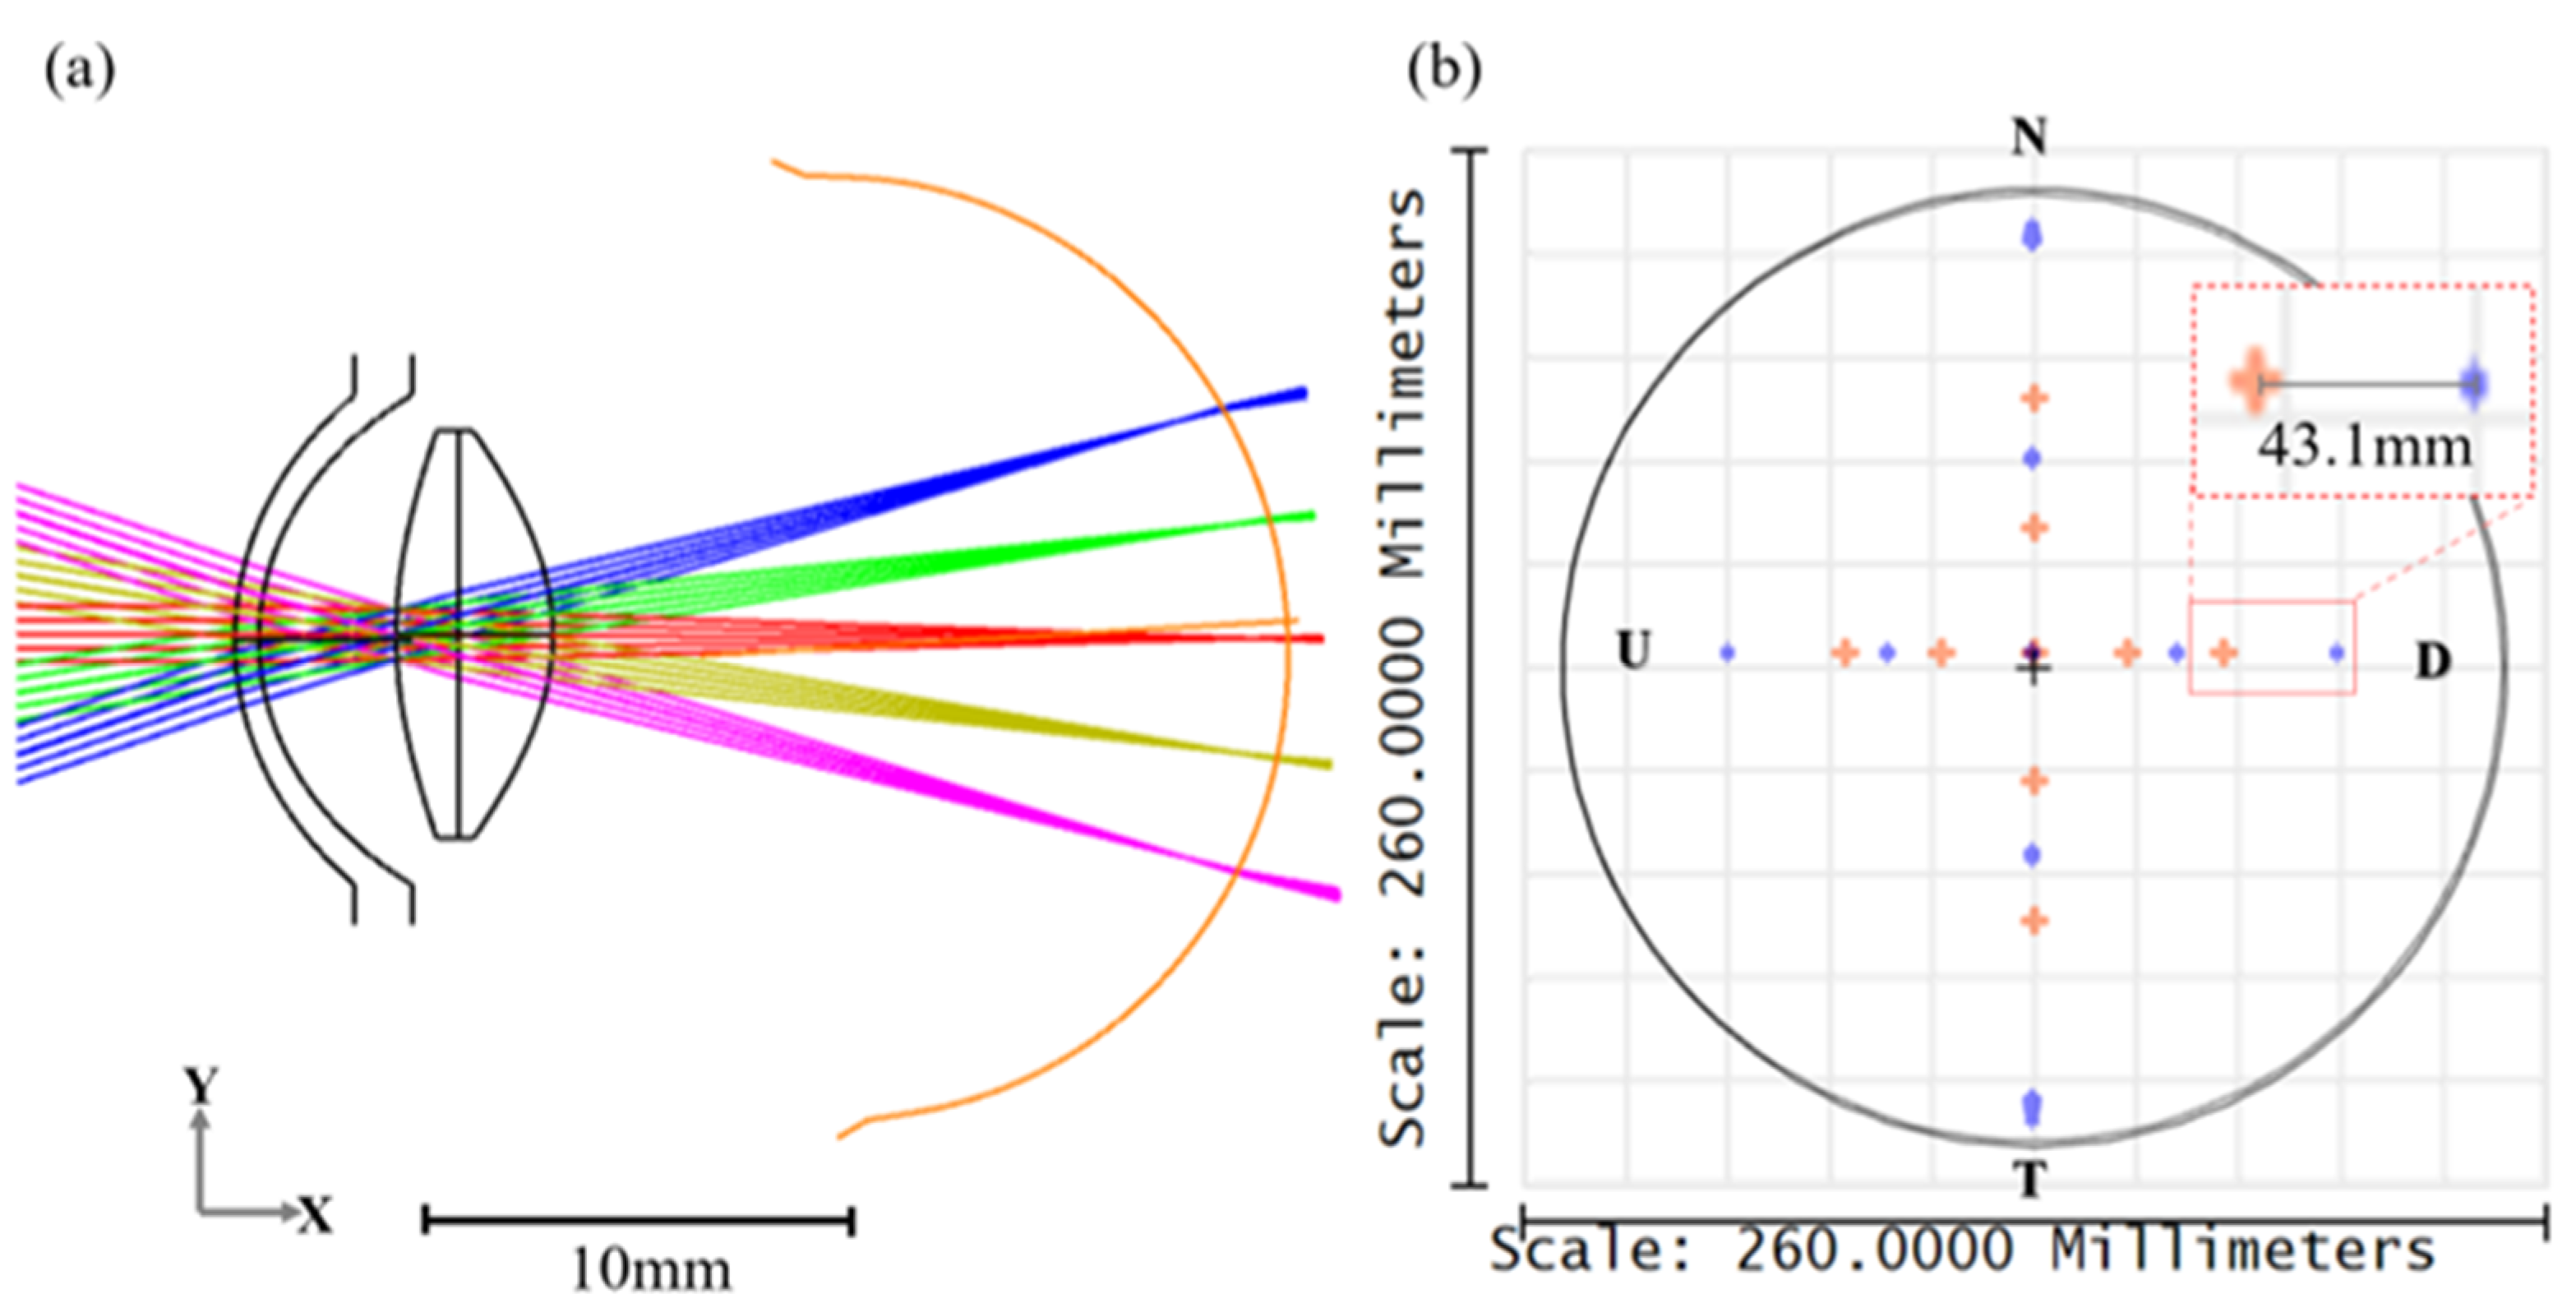
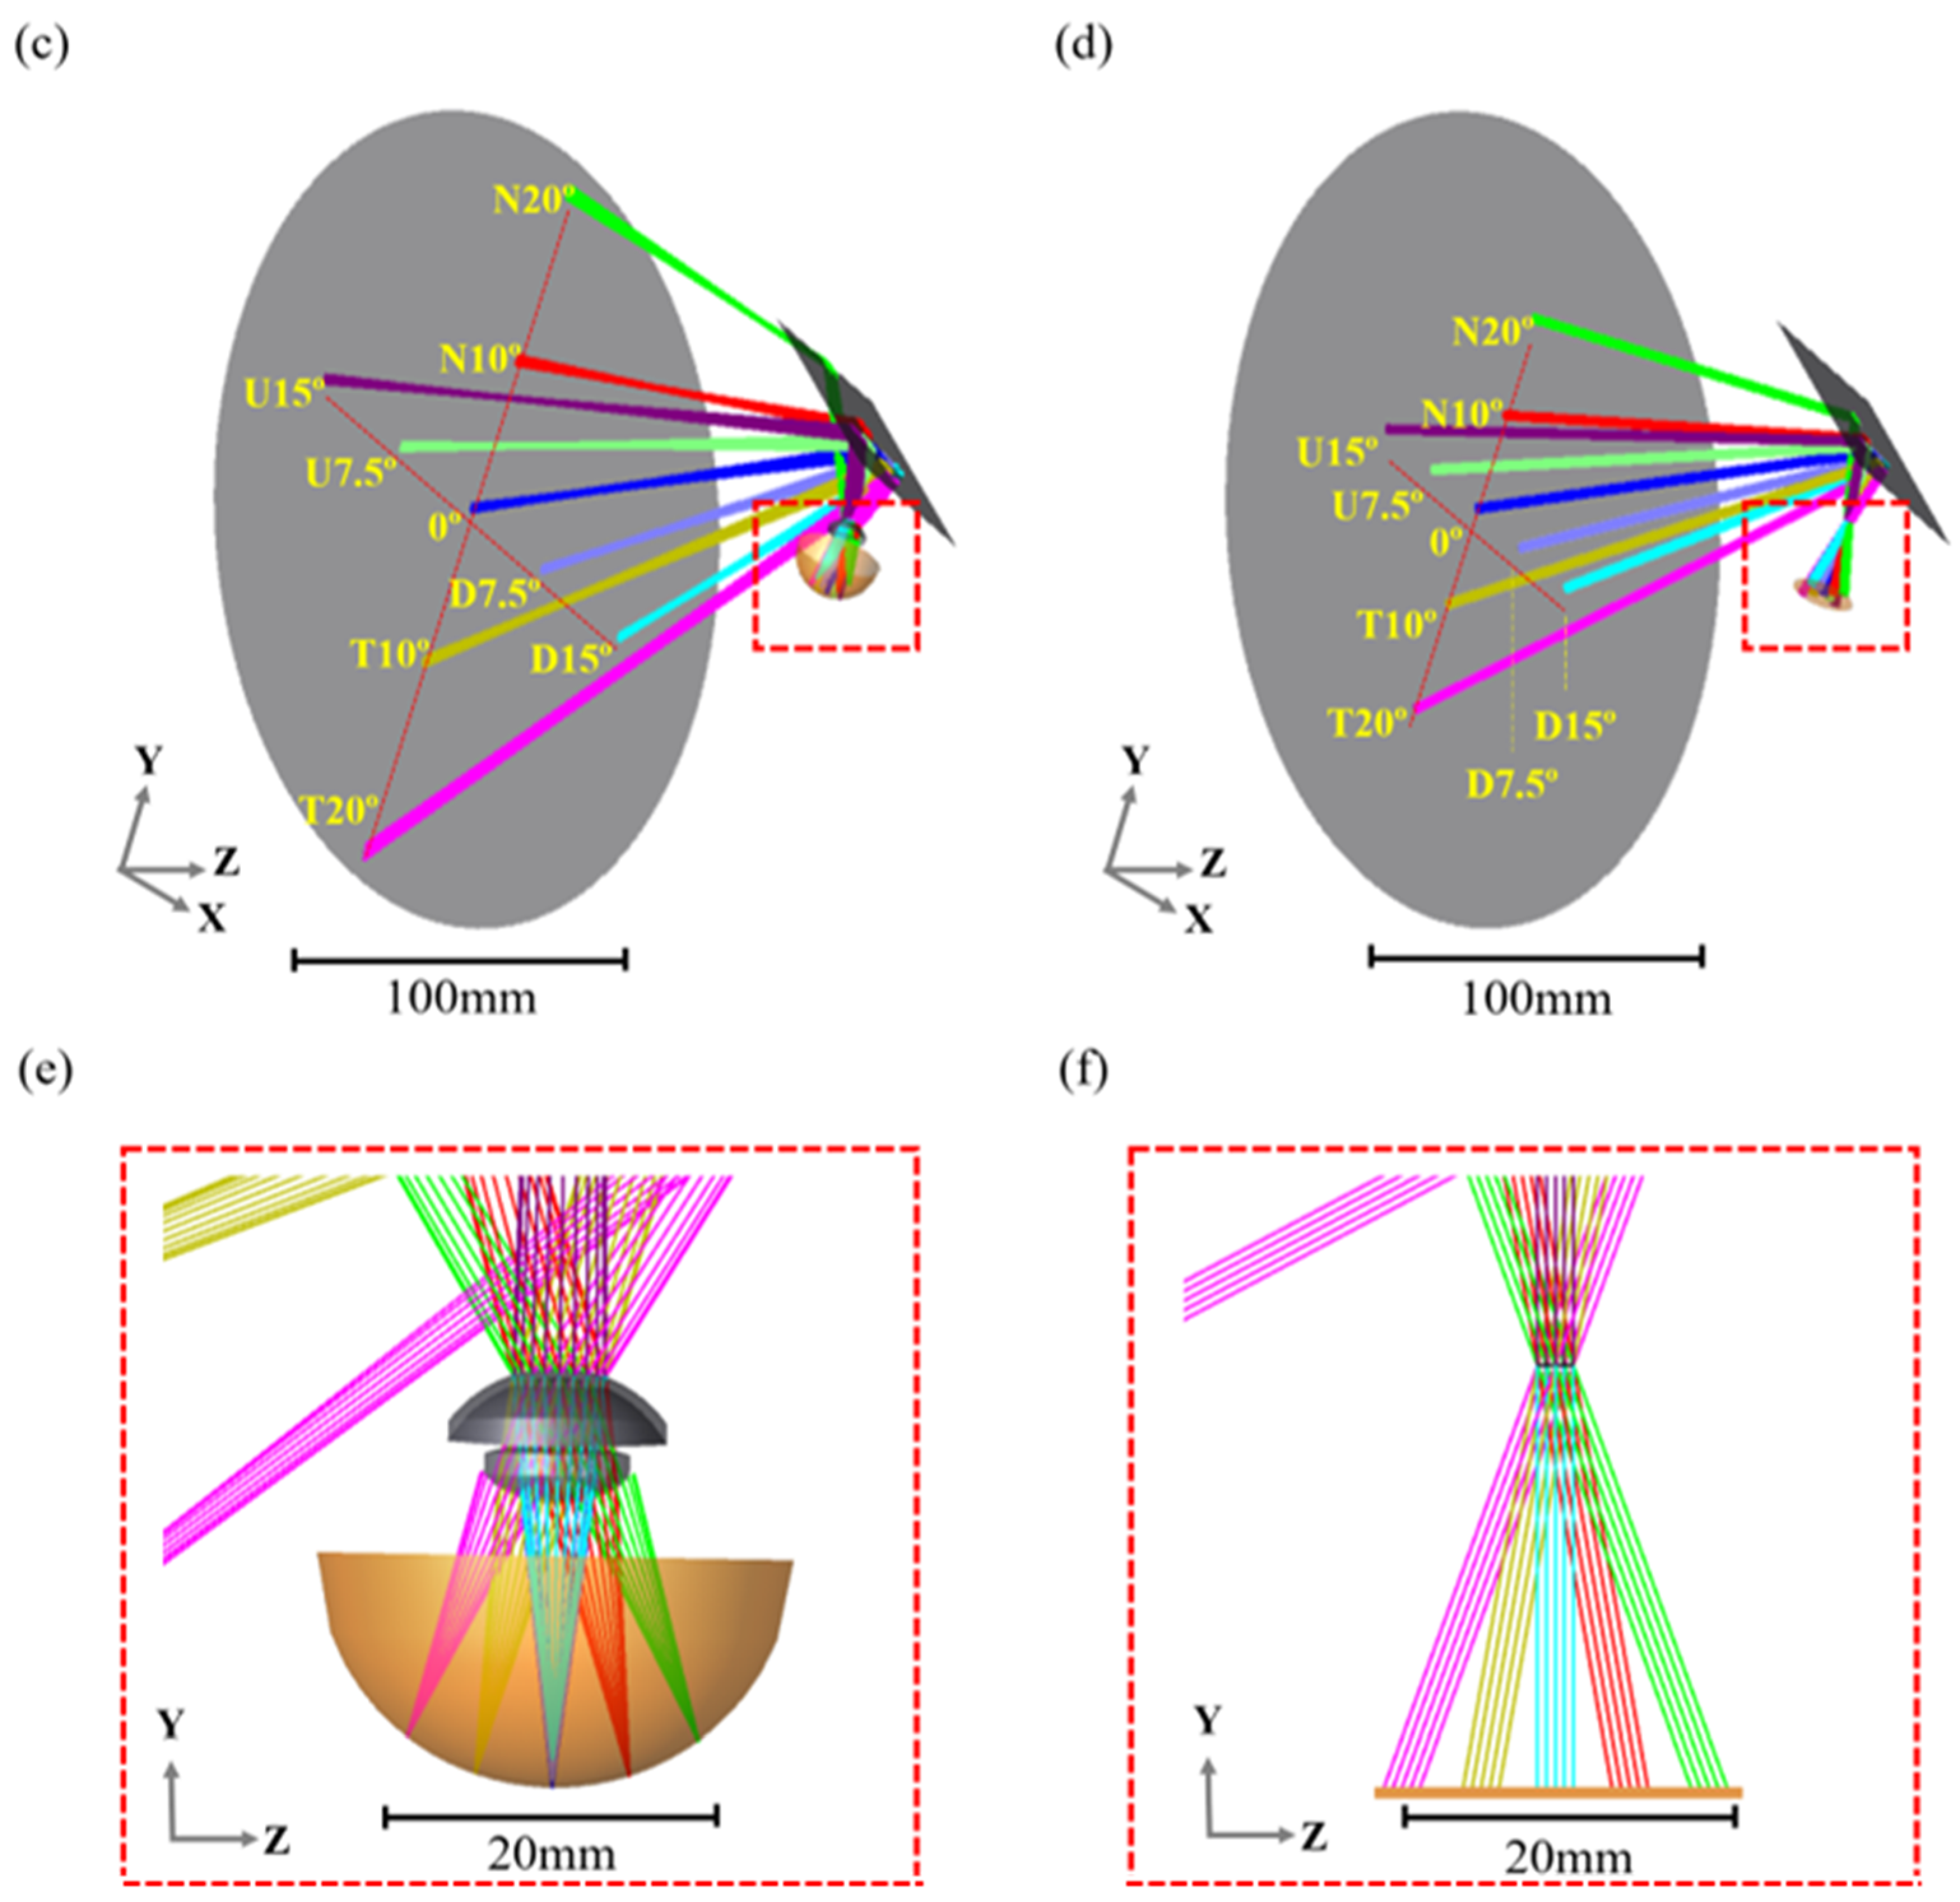
We employed the optical simulation software OpticStudio® (19.4 SP2 version, Zemax, LCC, Washington, DC, USA) to design a customized aberrometer. Precise alignment of the pupil plane is critical for the aberrometer performance. To achieve this, OpticStudio® was used to match the pupil plane of the human eye with the WFS by establishing accurate distances between the optical components. In addition, we conducted optical simulations using a human eye model, as shown in Figure 3a [25]. The model eye’s cornea, anterior lens, and posterior lens have radii of 13.78, 6.491, and 11.516, respectively, with further details provided in the reference [25]. Using these optical simulations, we determined the positions of fixation target points corresponding to each angular point of the retina. Figure 3c,d display all the angular points of the newly designed fixation targets and a conventional fixation target, with different colors representing different angles of the retina. For a visual comparison, Figure 3b illustrates the differences between the angular points (horizontal 20°, 10°, and vertical 15°, 7.5°) of the two targets. In Figure 3c, the blue dots represent the angular points acquired from the new fixation target, whereas in Figure 3d, the red dots represent the angular points of the conventional fixation target.

2.4. Data Acquisition

The WFS measures aberrations by assessing the difference between the measured focal points and ideal focal points. The detailed principles of using the WFS have been explained in previous studies [26,27,28,29,30]. An aberrometer can measure human eye aberrations in the form of Zernike coefficients. To calculate these coefficients, we used custom-developed software that converts the WFS data into Zernike coefficients [31]. The acquired aberrations were then converted to dioptric units and applied to Equation (1) to calculate the spherical refraction. In Equation (1), Z 0 2 represents the defocus value, and the two astigmatism coefficients are expressed as Z 2 2 and Z 2 2 . The spherical refraction is calculated by subtracting the root mean square of Z 2 2 and Z 2 2 from the defocus value of Z 0 2 . Comparing the graphs of spherical refraction values is challenging because of variations in the center point (0°) value. However, to facilitate comparisons, we used relative spherical error values by eliminating differences in the center point. To calculate the relative spherical error values, we subtracted the spherical refraction value at the center from each angular point (horizontal 20°, 10°, and vertical 15°, 7.5°). Therefore, our results are presented using relative spherical error graphs.
S p h e r i c a l   r e f r a c t i o n = Z 0 2 ( Z 2 2 ) 2 + ( Z 2 2 ) 2 2  

3. Results

3.1. Quantitative Analysis of the Fixation Target

Table 2 presents the quantitative differences between the newly designed fixation target and the conventional one. Columns 1 and 3 display the simulation results using the conventional fixation target, whereas columns 2 and 4 show the simulation results from the newly designed fixation target. First, a comparison between columns 1 and 2 reveals differences in the positions of the angular points (horizontal 20°, 10°, and vertical 15°, 7.5°) for both targets. The distances from the center (0°) to each angular point are provided in these columns, with variations ranging from 43.1 mm to 11 mm. In columns 3 and 4, we observe the angles between the cornea and the fixation target, which is positioned 200 mm away from the cornea. The values in column 3 match the angles of the retina because the conventional fixation target does not account for changes in the medium. Conversely, column 4 values differ from the retinal angle because our proposed method considers changes in the medium as well as the optical properties of the human eye, including the refractive index and curvature. For example, a point at horizontal 20° in column 4 is located at 30.09°, which is a larger angle than the retinal angle of approximately 10°.

3.2. Data Analysis

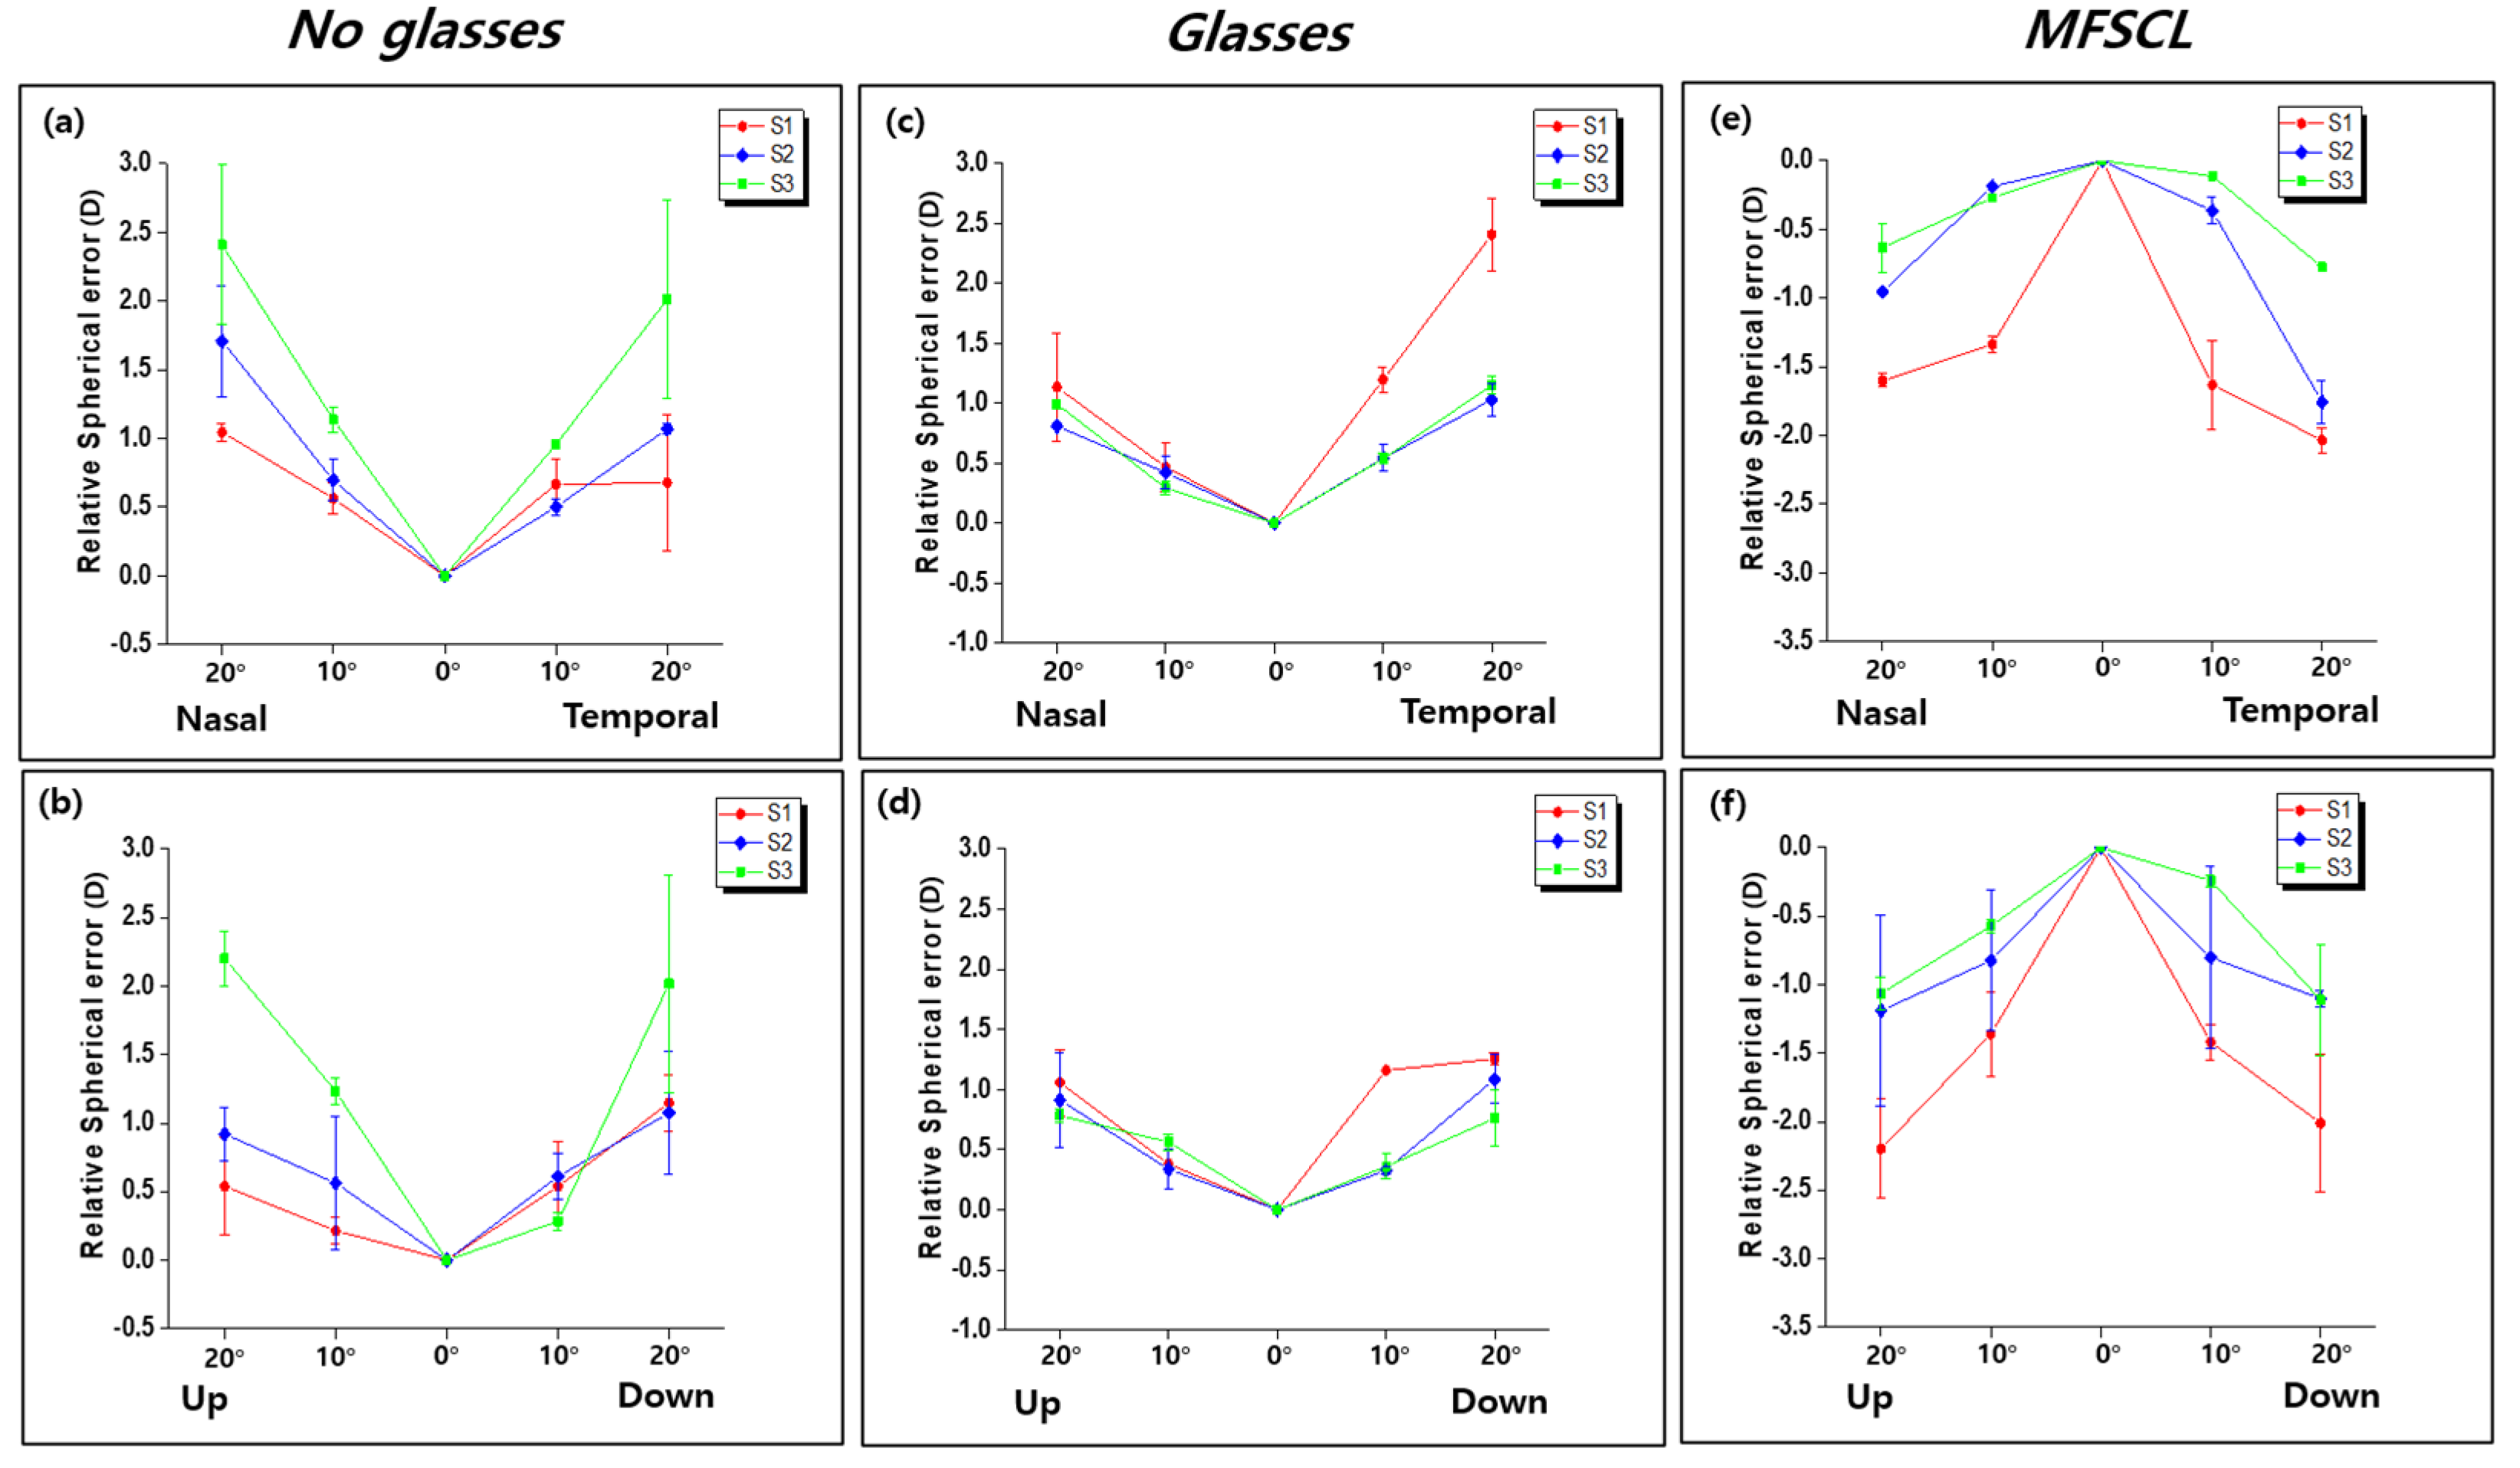
We assessed peripheral defocus in three conditions: with the naked eye (condition 1 or C1), while wearing glasses (condition 2 or C2), and while wearing the MFSCL (condition 3 or C3). The results for all conditions and subjects are shown in the Figure 4 relative spherical error (RSE) graphs. Results from the naked eye condition represent inherent relative spherical errors for subjects. All subjects have relative hyperopic defocus. LOA (low-order aberrations) include zero, first, and second orders of the Zernike polynomial expansion. Typically, normal glasses can correct second-order modes such as defocus and astigmatism [32,33]. But wearing glasses cannot change the characteristic of relative hyperopic defocus. Previous research excluding the moderately myopic group has shown statistically similar outcomes related to relative hyperopic defocus when wearing spectacles [34]. This suggestion is consistent with the findings in Figure 4, where wearing glasses (C2) still results in relative hyperopic defocus. On the other hand, wearing soft contact lenses has been reported to induce changes in spherical error [35,36,37]. Our study demonstrates that the MFSCL has been confirmed to convert hyperopic defocus into myopic defocus. Our results confirm peripheral hyperopic defocus in the naked eye (C1) and while wearing glasses (C2). Peripheral myopic defocus is acquired when wearing the MFSCL (C3), which agrees with previous studies demonstrating the peripheral defocus hypothesis [4,18,22,38]. Consequently, Figure 4 supports the alignment of the proposed aberrometer results with the peripheral defocus hypothesis. Furthermore, our previous study [17] using another aberrometer indicated that individuals who wore glasses for one year showed hyperopic defocus. In contrast, those who used lenses for myopia correction exhibited myopic defocus closely resembling the current results of our experiment.
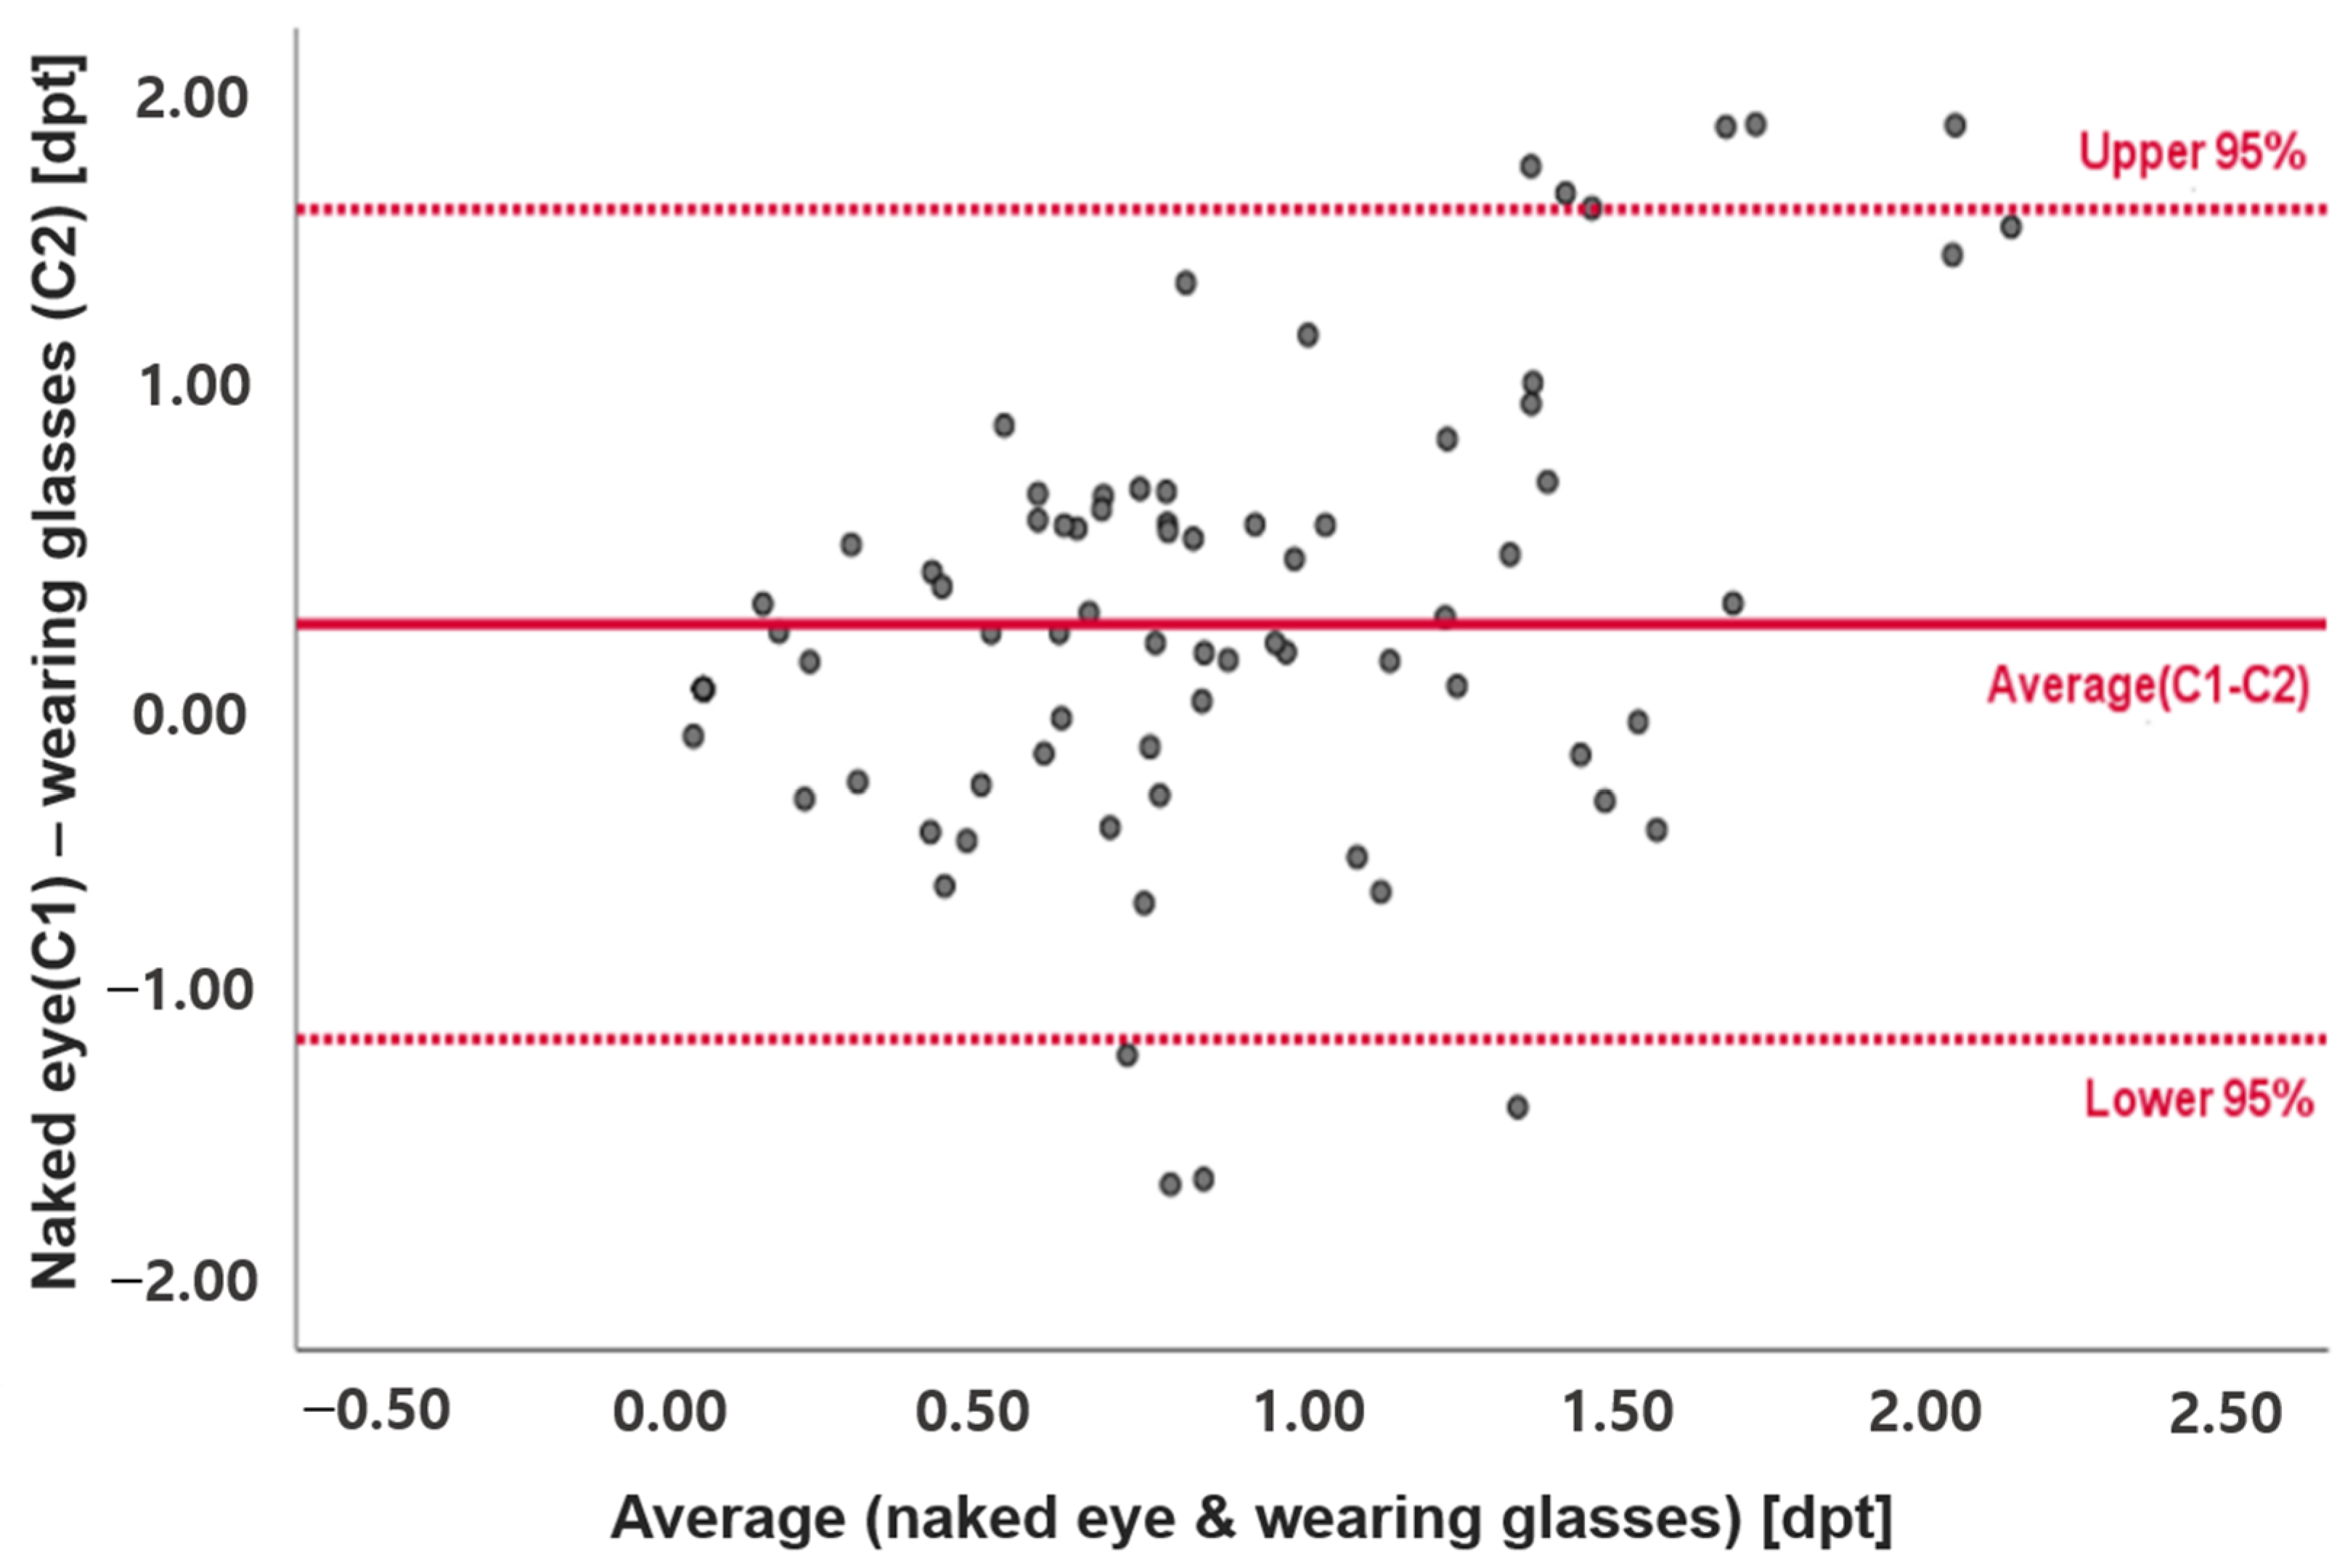
Statistical methods were employed to assess the reliability of the results. A Bland–Altman plot was used to measure the concordance between the naked eye (C1) and wearing glasses (C2). Figure 5 shows the Bland–Altman plot using the naked eye (C1) and wearing glasses (C2) results. The Y-axis in Figure 5 shows the differences between the naked eye (C1) and wearing glasses (C2) at each angle, whereas the x-axis shows the mean values of the naked eye (C1) and wearing glasses (C2) at each angle. The red line at the center represents the average of the differences between the naked eye (C1) and wearing glasses (C2). The upper and lower 95% red lines represent the 95% confidence intervals. Figure 5 reveals that the differences between the naked eye (C1) and wearing glasses (C2) are clustered around the average line, and nearly all data points fall within the 95% confidence interval. Therefore, the Bland–Altman plot demonstrates that the results obtained with the custom-built aberrometer for the naked eye (C1) and wearing glasses (C2) are well within the 95% confidence interval. We also conducted independent two-sample t-tests to evaluate the relationship between the naked eye (C1), wearing glasses (C2), and wearing the MFSCL (C3). The p values calculated for the naked eye (C1) and wearing glasses (C2) are notably higher than 0.05 (subject 1:0.555, subject 2:0.355, and subject 3:0.368), indicating no significant differences. These p values align with the results of the Bland–Altman plot, which confirms the similarity of the naked eye (C1) and wearing glasses (C2) results. In contrast, p values between wearing glasses (C1) and wearing the MFSCL (C3) are less than 0.05 (subject 1:0.04, subject 2:0.03, and subject 3:0.00), indicating a significant difference between these two conditions.

4. Discussion

The proposed aberrometer uses entering light with a diameter of 1 mm to extend the depth of focus (DOF) in the system. This smaller radius of entering light results in a small numerical aperture (NA) value, which is inversely proportional to the DOF. A larger DOF enhances the tolerance for the retinal plane. In addition, the wavefront sensing process of the human eye is less susceptible than that of other animals because of its smaller NA and larger DOF [28,39]. The combination of narrowed entering light and the optical characteristic of the human eye allows us to precisely adjust the position using the position-variable lens (L2) without deviating from the retinal plane. Consequently, the proposed aberrometer can achieve an optimal state for various eye conditions and subjects by using a position-variable lens.
Various fixation target construction methods exist, including machine-turn, eye-turn, and head-turn. To minimize subject movement, we employed an eye-turn fixation target. Previous research has shown that machine-turn and eye-turn fixation targets exhibit no significant difference [40]. In contrast, the head-turn fixation target is the least accurate of the three methods because of the subject movement [40]. The angular points of our custom-built fixation target were determined using OpticStudio® to consider the optical properties of the human eye, a departure from previous studies using conventional fixation targets that overlooked these characteristics [18,41].
We evaluated the reliability of our custom-built aberrometer by measuring three myopic subjects under three different conditions: C1 (with the naked eye or condition 1), C2 (while wearing spectacles or condition 2), and C3 (while wearing the MFSCL or condition 3). Our results confirm peripheral hyperopic defocus in the naked eye (C1) and while wearing glasses (C2). Peripheral myopic defocus is acquired when wearing the MFSCL (C3), which agrees with previous studies demonstrating the peripheral defocus hypothesis [4,18,22,38]. Notably, our study represents the first comparison of the naked eye (C1), wearing glasses (C2), and wearing the MFSCL (C3) results. Although comparing the spectacled eye with the other conditions of the eye is crucial, no research has been conducted due to the reflections and refractions of the spectacle. A previous study investigating peripheral defocus during an accommodation process demonstrated large differences between the naked eye and spectacled eye [18]. In contrast, our custom-built aberrometer can accurately measure subjects wearing spectacles, showing no significant differences.
Our custom-built aberrometer holds promise for conducting experiments aimed at determining the correlation between myopia and emmetropia by measuring peripheral retinal defocus [13,27,41]. As peripheral defocus has been shown to cause myopia, an aberrometer capable of assessing the wavefront of the retina provides a valuable tool for investigating the underlying causes of myopia. Previous studies using this aberrometer have shown that the MFSCL can effectively regulate the progression of myopia by addressing peripheral defocus [38,42,43]. However, differing viewpoints exist on the effectiveness of the MFSCL in controlling myopia, with Zhu et al. highlighting the need for further research to evaluate any potential rebound effect and Smith et al. suggesting that the effect of the MFSCL is steady but insignificant for controlling myopia [44,45]. As an alternative to the MFSCL, orthokeratology lenses that reshape the cornea to compensate for peripheral defocus have been proposed [46,47,48,49,50,51,52]. Further experiments under varying conditions will enable a thorough comparison of the effects of the orthokeratology lens and the MFSCL. Thus, developing instruments such as our custom-built aberrometer is indispensable for advancing this research and exploring solutions for myopia.

5. Conclusions

A custom-built aberrometer featuring a newly designed fixation target was used to measure peripheral retina aberrations within horizontal 40° and vertical 30° visual fields. The fixation target was designed using optical simulation software while considering the optical properties of the human eye. Through a comprehensive comparison between the angular points of the new fixation target and a conventional one using optical simulation, we observed differences in distances ranging from 43.1 mm to 11 mm. Notably, our aberrometer can accommodate spectacles and effectively measure the optical properties of spectacled eyes using a position-variable lens located in front of the subject’s eye. The position-variable lens can compensate for subject-oriented features, including refractive index and eye curvature. The advantage of this design was validated by the results of both the naked eye and spectacled eye measurements, which showed a similar tendency that a large retina angle corresponds to a higher defocus value. Unlike previous work [17], the newly developed system excludes the pupil camera and can subject optical characteristics with different degrees of myopia without requiring additional optic components. The system is simplified, resulting in a compact size of 20–43–4 cm (height–length–width) and reduced cost. Moreover, replacing the CCD with a CMOS camera would further contribute to cost reduction. The reliability of our proposed aberrometer was validated through assessment via a Bland–Altman plot and independent two-sample t-tests. These characteristics collectively establish our aberrometer as a valuable tool for clinical use, providing a reliable means to measure peripheral defocus in the human eye under various conditions.

Author Contributions

Conceptualization, Y.-S.Y. and D.Y.K.; methodology, Y.-S.Y. and D.Y.K.; software, S.-K.O.; validation, S.-K.O., J.-M.K., Y.-S.Y. and D.Y.K.; formal analysis, G.-Y.Y., Y.-S.Y. and D.Y.K.; investigation, S.-K.O., J.-M.K. and D.Y.K.; resources, G.-Y.Y.; data curation, S.-K.O. and J.-M.K.; writing—original draft preparation, S.-K.O. and J.-M.K.; writing—review and editing, S.-K.O., J.-M.K., Y.-S.Y. and D.Y.K.; visualization, S.-K.O. and J.-M.K.; supervision, Y.-S.Y. and D.Y.K.; project administration, Y.-S.Y. and D.Y.K.; funding acquisition, Y.-S.Y. and D.Y.K. All authors have read and agreed to the published version of the manuscript.

Funding

This work was supported by a grant from the National Research Foundation of Korea (2021R1I1A1A01056094), (2018R1A6A1A03025523), and (2023R1A2C1004330). In addition, this research was supported by the Korea Medical Device Development Fund grant funded by the Korean government (the Ministry of Science and ICT; the Ministry of Industry and Energy; the Ministry of Health & Welfare, and the Ministry of Food and Drug Safety) (Project Number: KMDF_PR_ 20200901_0026).

Institutional Review Board Statement

This study was conducted in accordance with the Declaration of Helsinki and approved by the Ethics Committee of Inha University (approval number: 230214-1A).

Informed Consent Statement

Informed consent was obtained from all subjects involved in the study.

Data Availability Statement

The data presented in this study are available on request from the corresponding author.

Conflicts of Interest

The authors declare no conflicts of interest.

References

  1. Rose, K.; Orth, B.; Bmed, W.S.; Morgan, I.; Mitchell, P. Clinical and Epidemiology The increasing prevalence of myopia: Implications for Australia. Clin Exp Ophthalmol. 2001, 29, 116–120. [Google Scholar] [CrossRef] [PubMed]
  2. Lin, L.; Shih, Y.; Hsiao, C.; Chen, C. Prevalence of Myopia in Taiwanese Schoolchildren: 1983 to 2000. Ann. Acad. Med. Singap. 2004, 33, 27–33. [Google Scholar]
  3. Vitale, S.; Ellwein, L.; Cotch, M.F.; Ferris, F.L.; Sperduto, R. Prevalence of refractive error in the United States, 1999–2004. Arch. Ophthalmol. 2008, 126, 1111–1119. [Google Scholar] [CrossRef] [PubMed]
  4. Smith, E.L.; Hung, L.-F.; Huang, J. Relative peripheral hyperopic defocus alters central refractive development in infant monkeys. Vis. Res. 2009, 49, 2386–2392. [Google Scholar] [CrossRef] [PubMed]
  5. Holden, B.A.; Fricke, T.R.; Wilson, D.A.; Jong, M.; Naidoo, K.S.; Sankaridurg, P.; Wong, T.Y.; Naduvilath, T.; Resnikoff, S. Global Prevalence of Myopia and High Myopia and Temporal Trends from 2000 through 2050. Ophthalmology 2016, 123, 1036–1042. [Google Scholar] [CrossRef] [PubMed]
  6. Baird, P.N.; Saw, S.-M.; Lanca, C.; Guggenheim, J.A.; Smith, E.L., III; Zhou, X.; Matsui, K.-O.; Wu, P.-C.; Sankaridurg, P.; Chia, A.; et al. Myopia. Nat. Rev. Dis. Primers 2020, 6, 99. [Google Scholar] [CrossRef] [PubMed]
  7. Sankaridurg, P.; Tahhan, N.; Kandel, H.; Naduvilath, T.; Zou, H.; Frick, K.D.; Resnikoff, S. IMI impact of myo-pia. Investig. Ophthalmol. Vis. Sci. 2021, 62, 2. [Google Scholar] [CrossRef]
  8. Hung, L.-F.; Crawford, M.; Smith, E.L. Spectacle lenses alter eye growth and the refractive status of young monkeys. Nat. Med. 1995, 1, 761–765. [Google Scholar] [CrossRef] [PubMed]
  9. Sng, C.C.A.; Lin, X.-Y.; Gazzard, G.; Chang, B.; Dirani, M.; Lim, L.; Selvaraj, P.; Ian, K.; Drobe, B.; Wong, T.-Y.; et al. Change in peripheral refraction over time in Singapore Chinese children. Investig. Opthalmology Vis. Sci. 2011, 52, 7880–7887. [Google Scholar] [CrossRef]
  10. Smith, E.L. Spectacle lenses and emmetropization: The role of optical defocus in regulating ocular development. Optom. Vis. Sci. 1998, 75, 388–398. [Google Scholar] [CrossRef]
  11. Saw, S.; Zhang, M.; Hong, R.; Fu, Z.; Pang, M.; Tan, D.T.H. Near-Work Activity, Night-lights, and Myopia in the Singa-pore-China Study. Arch. Ophthalmol. 2020, 120, 620–627. [Google Scholar] [CrossRef] [PubMed]
  12. Pärssinen, O.; Lyyra, A.L. Myopia and myopic progression among schoolchildren: A three-year follow-up study. Investig. Ophthalmol. Vis. Sci. 1993, 34, 2794–2802. [Google Scholar]
  13. Mutti, D.O.; Mitchell, G.L.; Hayes, J.R.; Jones, L.A.; Moeschberger, M.L.; Cotter, S.A.; Kleinstein, R.N.; Manny, R.E.; Twelker, J.D.; Zadnik, K.; et al. Accommodative lag before and after the onset of myopia. Investig. Ophthalmol. Vis. Sci. 2006, 47, 837–846. [Google Scholar] [CrossRef] [PubMed]
  14. Saw, S.-M.; Chua, W.-H.; Hong, C.-Y.; Wu, H.-M.; Chan, W.-Y.; Chia, K.-S.; Stone, R.A.; Tan, D. Nearwork in early-onset myopia. Investig. Ophthalmol. Vis. Sci. 2002, 43, 332–339. [Google Scholar]
  15. Gwiazda, J.; Thorn, F.; Held, R.; Cruz, A.; Machado, A.; Carvalho, R. Accommodation, accommodative convergence, and response AC/A ratios before and at the onset of myopia in children. Optom. Vis. Sci. 2005, 82, 273–278. [Google Scholar] [CrossRef] [PubMed]
  16. Sierra, H.; Cordova, M.; Chen, C.S.J.; Rajadhyaksha, M. Peripheral Defocus with Spherical and Multifocal Soft Contact Lenses. J. Investig. Dermatol. 2015, 135, 612–615. [Google Scholar] [CrossRef] [PubMed]
  17. Yoo, Y.-S.; Kim, D.Y.; Byun, Y.-S.; Ji, Q.; Chung, I.-K.; Whang, W.-J.; Park, M.R.; Kim, H.-S.; Na, K.-S.; Joo, C.-K.; et al. Impact of peripheral optical properties induced by orthokeratology lens use on myopia progression. Heliyon 2020, 6, e03642. [Google Scholar] [CrossRef] [PubMed]
  18. Lundstrom, L.; Mira-Agudelo, A.; Artal, P. Peripheral optical errors and their change with accommodation differ between emmetropic and myopic eyes. J. Vis. 2009, 9, 17. [Google Scholar] [CrossRef]
  19. Thibos, L.N.; Wheeler, W.; Horner, D. Power vectors: An application of fourier analysis to the description and statistical analysis of refractive error. Optom. Vis. Sci. 1997, 74, 367–375. [Google Scholar] [CrossRef]
  20. Lundström, L.; Manzanera, S.; Prieto, P.M.; Ayala, D.B.; Gorceix, N.; Gustafsson, J.; Unsbo, P.; Artal, P. Effect of optical correction and remaining aberrations on peripheral resolution acuity in the human eye. Opt. Express 2007, 15, 12654–12661. [Google Scholar] [CrossRef]
  21. Wei, X.; Thibos, L. Design and validation of a scanning Shack Hartmann aberrometer for measurements of the eye over a wide field of view. Opt. Express 2010, 18, 1134–1143. [Google Scholar] [CrossRef] [PubMed]
  22. Jaeken, B.; Lundström, L.; Artal, P. Fast scanning peripheral wave-front sensor for the human eye. Opt. Express 2011, 19, 7903–7913. [Google Scholar] [CrossRef] [PubMed]
  23. Thaler, L.; Schütz, A.; Goodale, M.; Gegenfurtner, K. What is the best fixation target? The effect of target shape on stability of fixational eye movements. Vis. Res. 2013, 76, 31–42. [Google Scholar] [CrossRef] [PubMed]
  24. Hirasawa, K.; Okano, K.; Koshiji, R.; Funaki, W.; Shoji, N. Smaller fixation target size is associated with more stable fixation and less variance in threshold sensitivity. PLoS ONE 2016, 11, e0165046. [Google Scholar] [CrossRef] [PubMed]
  25. Polans, J.; Jaeken, B.; McNabb, R.P.; Artal, P.; Izatt, J.A. Asymmetric wide-field optical model of the human eye with tilted and decentered crystalline lens that reproduces experimentally measured aberrations: Errata. Optica 2018, 5, 1461. [Google Scholar] [CrossRef]
  26. Yoon, G.; Pantanelli, S.; Nagy, L.J. Large-dynamic-range Shack-Hartmann wavefront sensor for highly aberrated eyes. J. Biomed. Opt. 2006, 11, 30502. [Google Scholar] [CrossRef]
  27. Williams, D.R.; Vaughn, W.J.; Singer, B.D.; Hofer, H.; Yoon, G.Y.; Artal, P.; Aragón, J.L.; Prieto, P.; Vargas, F. Rapid, Automatic Measurement of The Eyes Wave Aberration. US 6,827,444 B2, 7 December 2004. [Google Scholar]
  28. Liang, J.; Grimm, B.; Goelz, S.; Bille, J.F. Objective measurement of wave aberrations of the human eye with the use of a Hartmann–Shack wave-front sensor. J. Opt. Soc. Am. A 1994, 11, 1949–1957. [Google Scholar] [CrossRef] [PubMed]
  29. Wang, J.; Warnecke, J.M.; Haghi, M.; Deserno, T.M. Unobtrusive health monitoring in private spaces: The smart vehicle. Sensors 2020, 20, 2442. [Google Scholar] [CrossRef]
  30. Abecassis, V.; Monteiro, D.W.D.L.; Salles, L.P.; Cruz, C.A.D.M.; Belmonte, P.N.A. Impact of CMOS pixel and electronic circuitry in the performance of a Hartmann-Shack wavefront sensor. Sensors 2018, 18, 3282. [Google Scholar] [CrossRef]
  31. Kim, M.J.; Zheleznyak, L.; MacRae, S.; Tchah, H.; Yoon, G. Objective evaluation of through-focus optical performance of presbyopia-correcting intraocular lenses using an optical bench system. J. Cataract. Refract. Surg. 2011, 37, 1305–1312. [Google Scholar] [CrossRef]
  32. Chen, L.; Artal, P.; Gutierrez, D.; Williams, D.R. Neural compensation for the best aberration correction. J. Vis. 2007, 7, 9. [Google Scholar] [CrossRef]
  33. Suliman, A.; Rubin, A. A review of higher order aberrations of the human eye. Afr. Vis. Eye Health 2019, 78, 8. [Google Scholar]
  34. Lin, Z.; Martinez, A.; Chen, X.; Li, L.; Sankaridurg, P.; Holden, B.A.; Ge, J. Peripheral defocus with single-vision spectacle lenses in myopic children. Optom. Vis. Sci. 2010, 87, 4–9. [Google Scholar] [CrossRef]
  35. Ruiz-Pomeda, A.; César, V.-C. Slowing the progression of myopia in children with the MiSight contact lens: A narrative review of the evidence. Ophthalmol. Ther. 2020, 9, 783–795. [Google Scholar] [CrossRef]
  36. Huang, X.; Wang, F.; Lin, Z.; He, Y.; Wen, S.; Zhou, L.; Lu, F.; Jiang, J. Visual quality of juvenile myopes wearing multifocal soft contact lenses. Eye Vis. 2020, 7, 1–8. [Google Scholar] [CrossRef]
  37. Gifford, K.L.; Richdale, K.; Kang, P.; Aller, T.A.; Lam, C.S.; Liu, Y.M.; Langis, M.; Jeroen, M.; Janis, B.O.; Kathryn, A.R.; et al. IMI–clinical management guidelines report. Investig. Ophthalmol. Vis. Sci. 2019, 60, M184–M203. [Google Scholar] [CrossRef]
  38. Cheng, D.; Schmid, K.L.; Woo, G.C.; Drobe, B. Randomized trial of effect of bifocal and prismatic bifocal spectacles on myopic progression two-year results. Arch. Ophthalmol. 2010, 128, 12–19. [Google Scholar] [CrossRef]
  39. Geng, Y.; Schery, L.A.; Sharma, R.; Dubra, A.; Ahmad, K.; Libby, R.T.; Williams, D.R. Optical properties of the mouse eye. Biomed. Opt. Express 2011, 2, 717–738. [Google Scholar] [CrossRef]
  40. Radhakrishnan, H.; Charman, W.N. Peripheral refraction measurement: Does it matter if one turns the eye or the head? Ophthalmic Physiol. Opt. 2007, 28, 73–82. [Google Scholar] [CrossRef]
  41. Mathur, A.; Atchison, D.A.; Scott, D.H. Ocular aberrations in the peripheral visual field. Opt. Lett. 2008, 33, 863–865. [Google Scholar] [CrossRef]
  42. Anstice, N.S.; Phillips, J.R. Effect of Dual-Focus Soft Contact Lens Wear on Axial Myopia Progression in Children. Ophthalmology 2011, 118, 1152–1161. [Google Scholar] [CrossRef]
  43. Sankaridurg, P.; Holden, B.; Smith, E.; Naduvilath, T.; Chen, X.; de la Jara, P.L.; Martinez, A.; Kwan, J.; Ho, A.; Frick, K.; et al. Decrease in rate of myopia progression with a contact lens designed to reduce relative peripheral hyperopia: One-year results. Investig. Ophthalmol. Vis. Sci. 2011, 52, 9362–9367. [Google Scholar] [CrossRef]
  44. Smith, E.L. Optical treatment strategies to slow myopia progression: Effects of the visual extent of the optical treatment zone. Exp. Eye Res. 2013, 114, 77–88. [Google Scholar] [CrossRef]
  45. Zhu, Q.; Liu, Y.; Tighe, S.; Zhu, Y.; Su, X.; Lu, F.; Hu, M. Retardation of myopia progression by multifocal soft contact lenses. Int. J. Med. Sci. 2019, 16, 198–202. [Google Scholar] [CrossRef]
  46. González-Méijome, J.M.; Peixoto-De-Matos, S.C.; Faria-Ribeiro, M.; Lopes-Ferreira, D.P.; Jorge, J.; Legerton, J.; Queiros, A. Strategies to regulate myopia progression with contact lenses: A review. Eye Contact Lens 2016, 42, 24–34. [Google Scholar] [CrossRef]
  47. Sun, Y.; Xu, F.; Zhang, T.; Liu, M.; Wang, D.; Chen, Y.; Liu, Q. Orthokeratology to control myopia progression: A meta-analysis. PLoS ONE 2015, 10, e0124535. [Google Scholar]
  48. Cho, P.; Cheung, S.W.; Edwards, M. The longitudinal orthokeratology research in children (LORIC) in Hong Kong: A pilot study on refractive changes and myopic control. Curr. Eye Res. 2005, 30, 71–80. [Google Scholar] [CrossRef]
  49. Walline, J.J.; Jones, L.A.; Sinnott, L.T. Corneal reshaping and myopia progression. Br. J. Ophthalmol. 2009, 93, 1181–1185. [Google Scholar] [CrossRef]
  50. Kakita, T.; Hiraoka, T.; Oshika, T. Influence of overnight orthokeratology on axial elongation in childhood myopia. Investig. Opthalmology Vis. Sci. 2011, 52, 2170–2174. [Google Scholar] [CrossRef]
  51. Santodomingo-Rubido, J.; Villa-Collar, C.; Gilmartin, B.; Gutiérrez-Ortega, R. Myopia control with orthokeratology contact lenses in Spain: Refractive and biometric changes. Investig. Opthalmology Vis. Sci. 2012, 53, 5060–5065. [Google Scholar] [CrossRef]
  52. Hiraoka, T.; Kakita, T.; Okamoto, F.; Takahashi, H.; Oshika, T. Long-term effect of overnight orthokeratology on axial length elongation in childhood myopia: A 5-year follow-up study. Investig. Opthalmology Vis. Sci. 2012, 53, 3913–3919. [Google Scholar] [CrossRef]
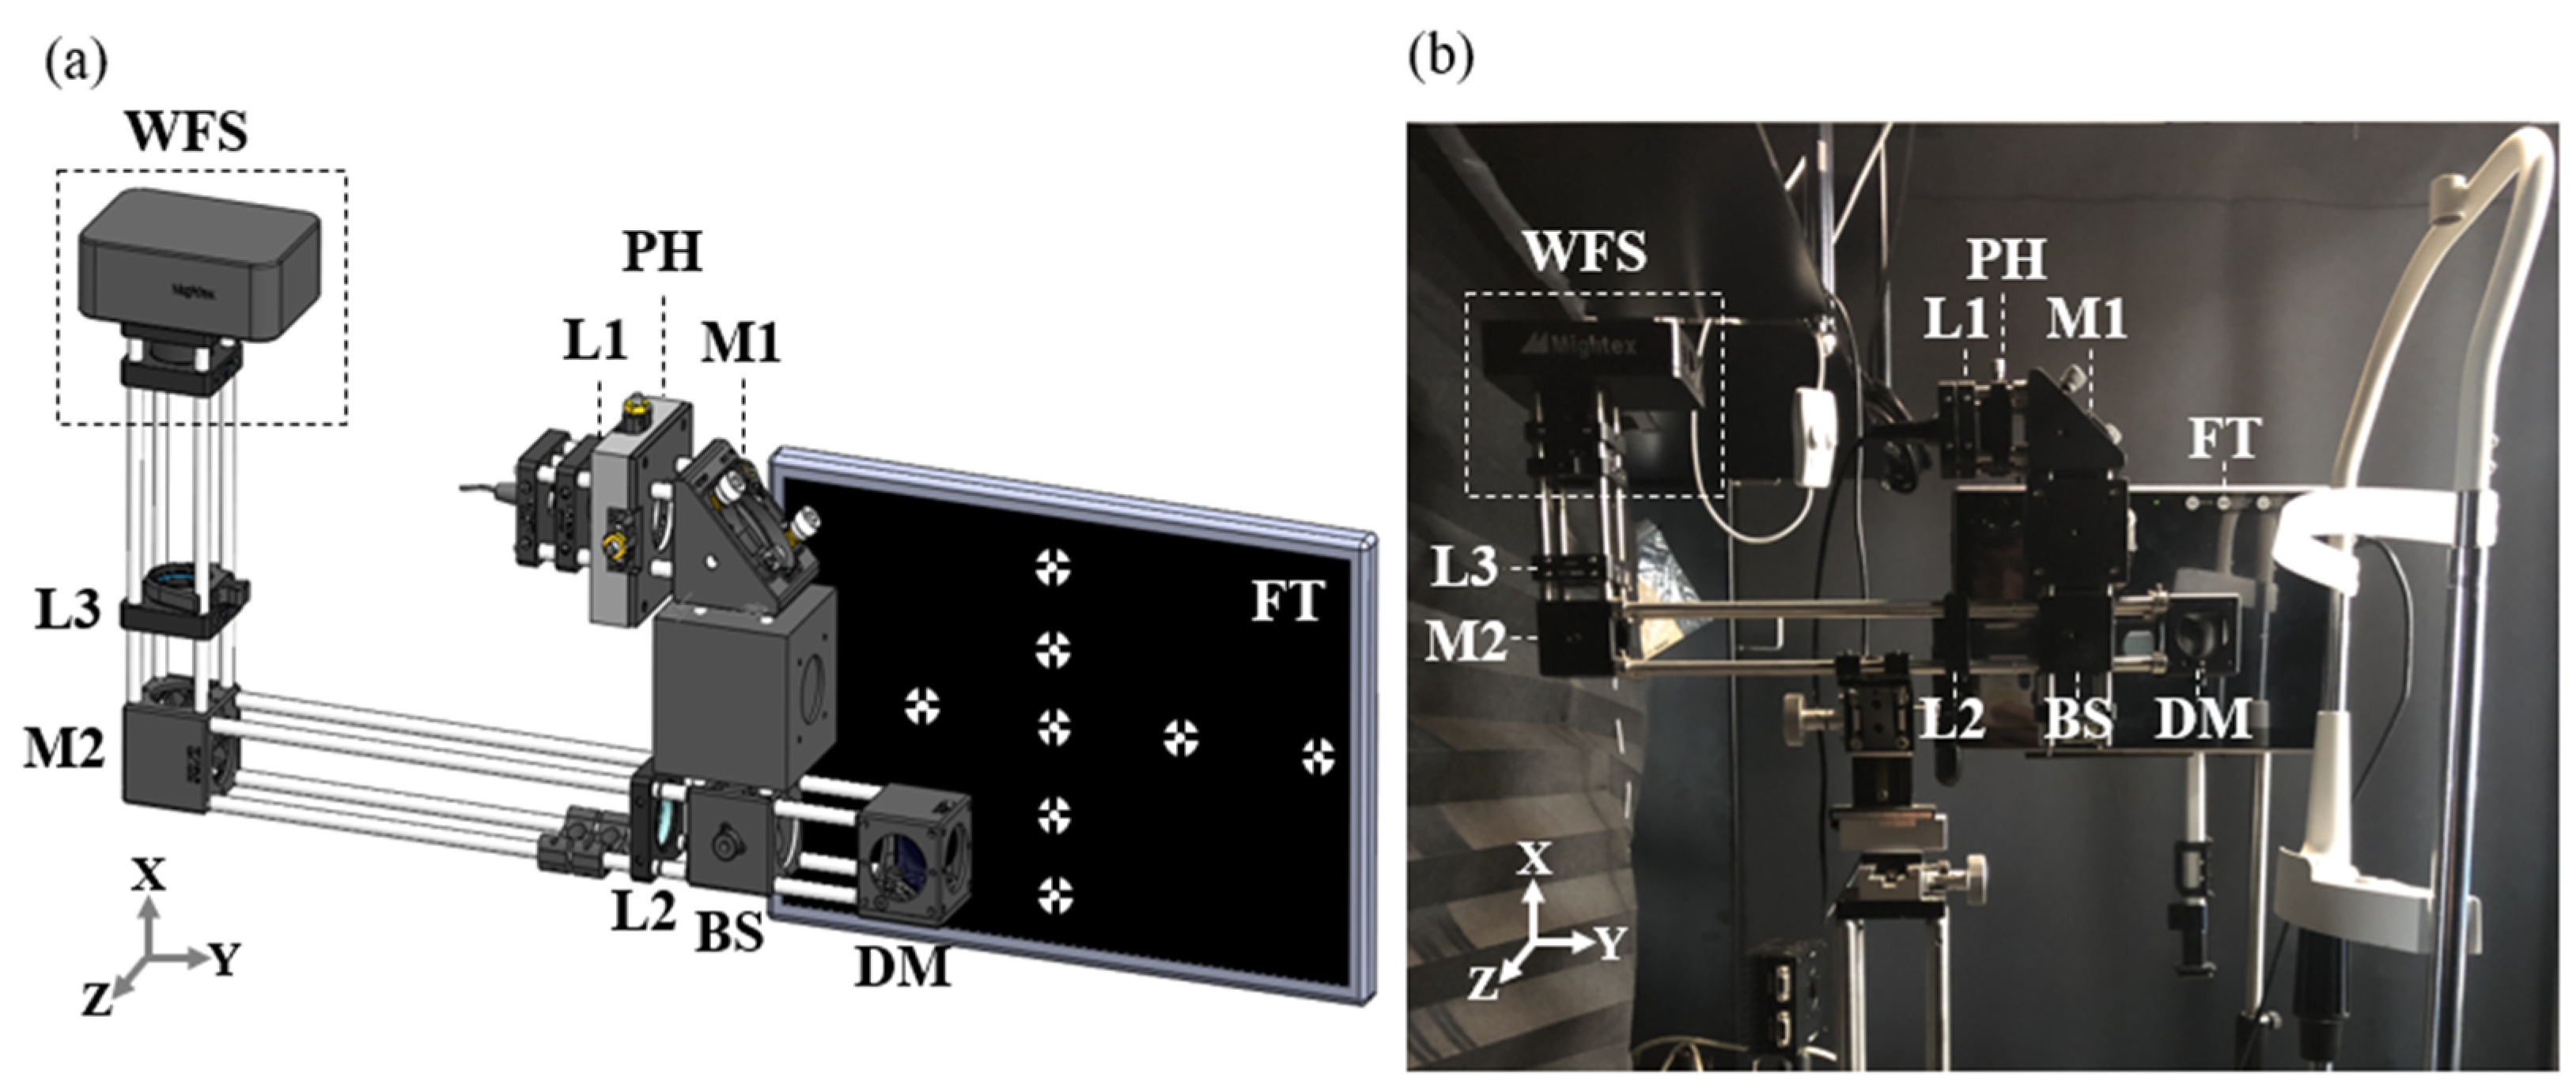
Figure 1. (a) Schematic of the new aberrometer; L1, L2, and L3: achromatic doublet lens; M1, M2: Mirror, DM: Dichroic mirror; BS: Beam splitter; PH: Pinhole, FT: Fixation target. (b) Photograph of the new aberrometer. (c) Compensating process that moves the position-variable lens (L2) forward and backward to compensate for unwanted alterations generated by the spectacle and subjects. (d) An enlarged picture of the process in (c).
Photonics 11 00332 g001aPhotonics 11 00332 g001b
Figure 2. (a) A schematic of the whole new aberrometer. (b) Optimal state of L2. (c) Personalizing process of L2.
Photonics 11 00332 g002
Figure 3. (a) Peripheral vision layout considering optical properties of the human eye. (b) To visualize the differences, all points of the two fixation targets displayed in (c,d) are displayed in a 2D chart. The blue and red spots represent the results of (c,d), respectively. The interval between the red and blue 20° points is 43.1 mm when the fixation target is 200 mm from the cornea of the model eye. (c) OpticStudio® 3D layout was used to create a new fixation target using an eye model. (d) The OpticStudio® 3D layout of the conventional fixation target. (e) Enlarged picture of light entering the eye. (f) Enlarged picture of the light path when the optical properties of the eye are not considered.
Photonics 11 00332 g003aPhotonics 11 00332 g003b
Figure 4. Subjects #1, #2, and #3 (S1, S2, and S3) are represented by the red-dotted, blue-dashed, and solid-green lines, respectively. (a) Nasal to temporal relative spherical error graphs and (b) up to down relative spherical error graphs for no glasses (naked eye: C1). (c) Nasal to temporal relative spherical error graphs and (d) up to down relative spherical error graphs for glasses (wearing glasses: C2). (e) Nasal to temporal relative spherical error graphs and (f) up to down relative spherical error graphs for MFSCL (wearing MFSCL: C3).
Photonics 11 00332 g004
Figure 5. The red line in the middle of the graph represents the average of the differences between the naked eye and wearing spectacle results acquired from S1, S2, and S3. The upper red-dotted line represents the upper 95% confidential interval, while the lower red-dotted line represents the lower 95% confidential interval. The R-value of 0.219 means that no significant differences exist between the two experiments.
Photonics 11 00332 g005
Table 1. Patients’ demographics.
SubjectsS1S2S3
SexMMM
Age252626
Spherical refraction (D)−2−4.75−5.0
Astigmatism (D)0−1.0−0.75
Table 2. Fixation target differences between OpticStudio® and the conventional method.
Retinal AngleConventional Method
Distance
Newly Designed®
Distance
Conventional Method
Angle
Newly Designed®
Angle
Horizontal 20°72.8 mm115.9 mm20°30.09°
Horizontal 10°35.3 mm49.3 mm10°13.84°
Vertical 15°53.6 mm77.9 mm15°21.28°
Vertical 7.5°26.3 mm37.3 mm7.5°10.56°
Disclaimer/Publisher’s Note: The statements, opinions and data contained in all publications are solely those of the individual author(s) and contributor(s) and not of MDPI and/or the editor(s). MDPI and/or the editor(s) disclaim responsibility for any injury to people or property resulting from any ideas, methods, instructions or products referred to in the content.