1. Introduction
For many years, Lidar ceilometer have been employed as a high-precision remote sensing instrument for the detection of cloud base height, cloud phase state, cloud optical thickness and cloud vertical extent [
1,
2,
3]. The Lidar ceilometer transmits pulsed laser in the atmosphere and collects the atmospheric backscattered signal at the same time. The principle of the Lidar ceilometer is mainly consists of the emission of a narrow-bandwidth laser pulse of laser through a laser emission system. During laser transmission in the atmosphere, it is absorbed and scattered, consuming some energy before reaching the cloud layer. Laser is also absorbed and scattered in the cloud layer. Strong scattering occurs when clouds are encountered, resulting in a significantly stronger being received than when there are no clouds. The presence of a cloud layer can be determined on the basis of whether the echo signal undergoes a significant mutation., The backscattering curve of the atmosphere is determined by calculating the flight time of the pulse and the intensity of the backscattered signal in order to obtain the vertical distribution of the atmospheric aerosol and cloud. The Lidar ceilometer has advantages in single-layer cloud, and has been popularized and applied because of its excellent space and time resolution when performing cloud base detection. As the core component of the Lidar ceilometer, the fiber laser directly influences the performance of the entire radar system.
With the continuous development of technology, optical materials have been applied in various fields [
4,
5,
6], especially with the increasing maturity of fiber optic materials. Laser altimeters based on fiber lasers have replaced traditional artificial methods of cloud height observation, developing into optical remote sensing equipment with similar detection capabilities to those of aerosol Lidar. The Lidar ceilometer based on fiber laser has the advantages of small volume, light weight, high stability, not requiring maintenance, high resolution, long detection distance, capacity for real-time online, and all-weather monitoring, making it an ideal method for detecting cloud information.
High-energy single-frequency nanosecond-pulsed fiber laser have been widely applied in Doppler radar, coherent radar, remote sensing detection, and other fields [
7,
8,
9,
10,
11], mainly owing to their narrow-linewidth, long coherence length, and high pulse energy. In recent years, high-energy single-frequency nanosecond-pulsed fiber laser at 1.5 μm have operated in eye-safe spectral regions, and have become a research hotspot for the use of fiber laser technology in Lidar ceilometers. Lidar ceilometer used for cloud detection based on fiber laser technologies operates with high pulse energy (typically 70 µJ to 1 mJ), narrow-linewidth fiber lasers (few MHz), high pulse repetition frequency (PRF, typically 5–20 kHz) and a pulse duration of 100–500 ns.
The MOPA configuration has been proven to be an effective approach for improving the output power of the single-frequency nanosecond-pulsed laser. Achieving high pulse energy, and high efficiency output is difficult at 1.5 µm, owing to the stimulated Brillouin scattering (SBS) and the ASE [
12,
13,
14]. The most effective approach to suppress the SBS is to reduce the fiber length and increase the mode area in the fiber laser, which can be realized by using a large-mode-area (LMA) fiber with a high gain coefficient [
15]. In 2012, Petersen et al. demonstrated a 1550 nm pulsed-fiber MOPA using only 12 cm of heavily-Er/Yb-doped phosphate fiber with a core diameter of 25 μm. The maximum peak power of the 2 ns pulse reached 128 kW, a near transform-limited linewidth of 200 MHz was recorded [
16]. In 2014, a peak power of 361 W for a pulse width of 200 ns at a repetition rate of 10 kHz was achieved with transform-limited linewidth and diffraction-limited beam quality [
17]. In the same year, L.V. Kotov, et al. reported a record peak power of 4 kW for single-frequency single-mode silica-based fiber sources close to 1550 nm [
18]. In 2015, the single-frequency all-fiber amplifier based on Er-Yb doped P
2O
5-Al
2O
3-SiO
2 fibers was reported. A peak power up to 1120 W at 1545 nm for a pulse duration of 108 ns was obtained with a slope efficiency of 18% [
19]. In 2018, W.K. Lee, et al. demonstrated the experimental demonstration of 1.8 mJ, a peak power of 3.5 kW at a pulse repetition rate of 2.5 kHz, as well as 1.3 mJ, with a peak power of 2.5 kW at a pulse repetition rate of 7.5 kHz for single-frequency optical pulses at 1572 nm using single-mode large-core polarization-maintaining (PM) Er-Yb codoped silicate glass fiber amplifiers pumped at 976 nm [
20]. M. M. Khudyakov, et al. demonstrated the amplification of single frequency 160 ns pulses at 1554 nm to a peak power of 3.7 kW with a pump-to-signal conversion efficiency of 23.6% relative to the launched multimode pump power at 976 nm in 2020 [
21].
When a laser enters a cloud in the atmosphere, strong backward scattering will occur in the cloud, especially at its boundary. The size of the scattering signal is related to the laser power, the cloud base height, the cloud type and details, the atmospheric characteristics, and performance parameters of the laser cloud height instrument. Cloud height information is difficult to directly obtain due to the weak signal detected at the receiving end of the cloud altimeter, as well as the relatively strong solar radiation intensity noise and system background noise. Therefore, the key factors affecting the SNR of the signal should be studied. The SNR of the system should be improved, as it constitutes a bottleneck in the overall system performance. The performance of the cloud height instrument system is greatly constrained by its various noise effects inside and outside. The denoising of the backscattered signal of the laser cloud height instrument has always been a challenge in this field, where the output performance of a laser, such as laser power, SNR, and other factors can affect the noise of the Lidar ceilometer. Therefore, the nonlinear effects and spontaneous emission effects in the laser should be suppressed to ensure an appropriate SNR of the output laser and improve the overall performance of the Lidar ceilometer.
The performance of a 1.5 µm pulse laser is mainly affected by the SBS and the ASE. SBS is mainly transmitted backward in the fiber laser, and the laser power cannot be increased, even causing damage to the laser system. At the same time, SBS can cause pulse waveform distortion, affecting the testing performance of the Lidar ceilometer. In pulse fiber amplifiers based on MOPA structure, ASE is amplified step by step, especially at low repetition rates. Under frequency conditions, due to the long pulse interval, the energy stored due to pumping during the interval is extracted by ASE, thereby consuming a large amount of upper energy levels. The number of particles decreases the energy extraction rate of signal pulses, resulting in a rapid increase in the ASE power. At the same time, the forward-transmitting ASE forms broadband noise on the signal pulse, whereas the backward-transmitting ASE damages the front-end components and affects the output performance of the amplifier. SBS can be suppressed by using shorter fiber length, and the output average power of the single-frequency nanosecond pulsed fiber laser can be increased by increasing the pump power. However, the residual upper number of particles in heavily doped fibers may improve the ASE competition that reduces the SNR of the fiber laser. ASE is usually cut off by the bandpass filter. However, the width of the bandpass filter is still greater the width of the single-frequency fiber laser, and the bandpass filter removes the out-of-band ASE component. Then, the in-band ASE can be further amplified by the power amplifier with the increase of the pump power. The residual ASE after the bandpass filter will influence the system of the Lidar ceilometer.
In this study, we analyze the influence of the ASE on the first derivative of backscatter intensity through the contrast experiment. Two single-frequency, linearly polarized, pulsed, eye-safe fiber lasers for coherent Doppler Lidar based on two different MOPA configurations are presented. The output power of every pre-amplifier and the power amplifier in two MOPA configurations are the same. Finally, 10 kHz pulse repetition frequency, 400 ns pulse width, and 1000 mW average power at 1550.5 μm are obtained without ASE. The first derivative of the backscatter intensity with two MOPA configurations is analyzed in the same output power. When the output power of ASE increases to a certain intensity, which decreases the SNR of the output power, the intensity of the noise obliques in an upward variation with increasing altitude in the first derivative of backscatter intensity. The angle of inclination increases with more output power. Moreover, the ASE of the MOPA configuration can be suppressed by increasing the output power of the seed. The result of this experiment is beneficial to improving the property of the fiber laser and the Lidar ceilometer.
2. Experiment Setup
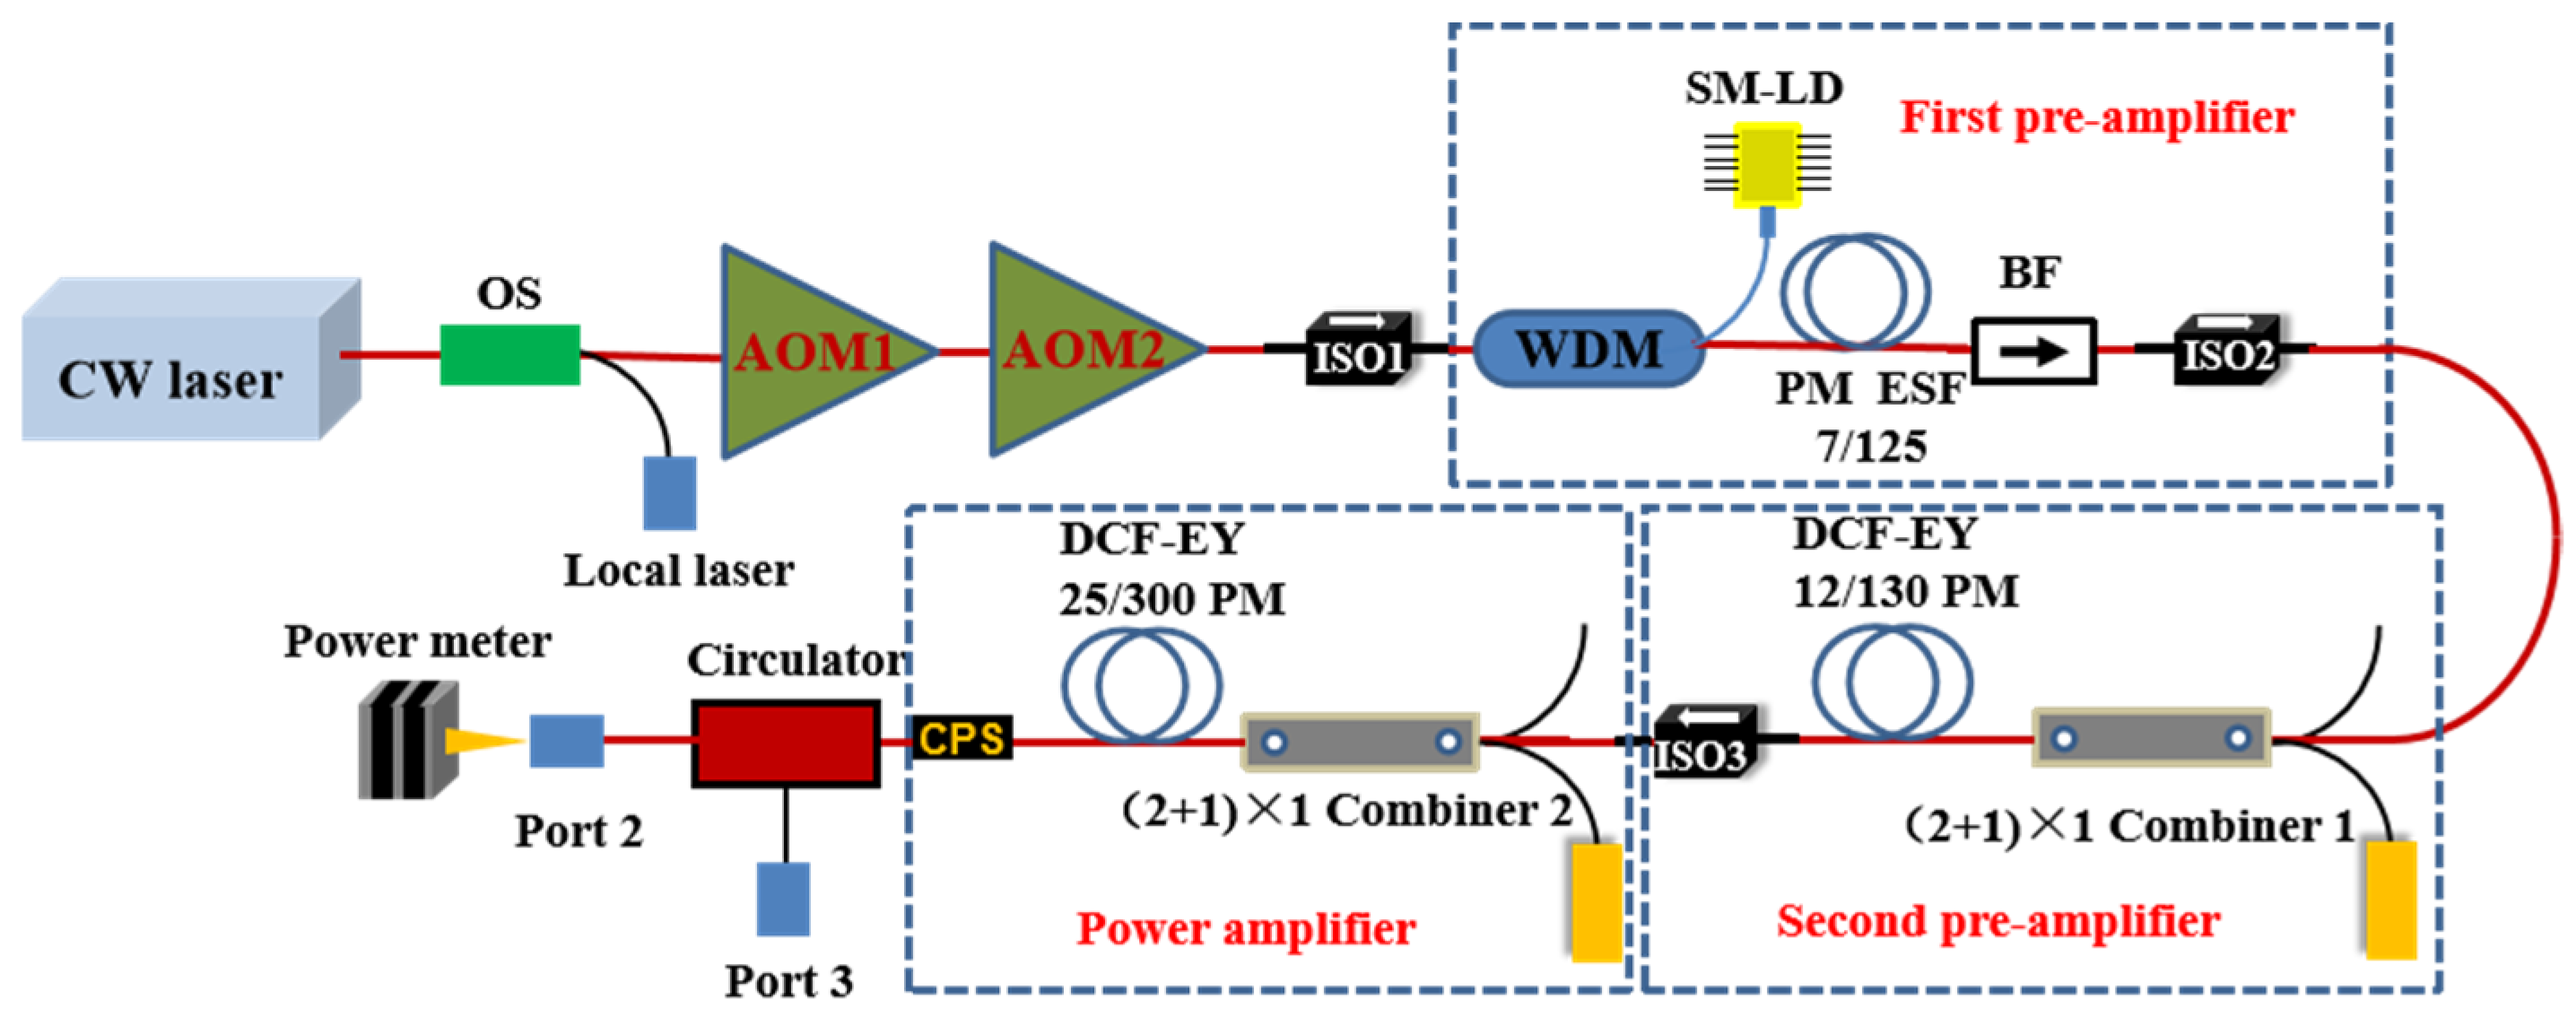
The single-frequency pulsed fiber laser was based on two different MOPA configurations (
Figure 1 and
Figure 2). A linearly polarized narrow-linewidth continuous fiber laser with a linewidth of 50 kHz and wavelength of 1550.5 nm was used as the seed source. The local laser for coherent detection was divided from the seed by an optical splitter with a splitting ratio of 5:95. The other power part of the seed was directed into an acousto-optic modulator (AOM). The AOM here was used to achieve a special pulse shape and a frequency shifter simultaneously. We can adjust the pulse repetition frequency, the optical pulse width, and pulse shape by modulating the AOM driver signal. In this paper, two AOMs with a linewidth of 40 MHz digitization and 80 MHz simulation were used to achieve high extinction modulators that reach up to 70 dB extinction to avoid the continuous output power leak. The amplifier consisted of the first pre-amplifier, the second pre-amplifier, and the main power amplifier.
As shown in
Figure 1, the first pre-amplifier was set after two AOMs. The first pre-amplifier adopted an active 120 cm long single-mode (SM) fiber doped with erbium ions (Nufern, PM-ESF-7/125). The fiber was core-pumped by an SM laser diode (LD) with a wavelength of 974 nm and output power of 325 mW through a PM wavelength division multiplex (WDM). The fiber absorption coefficient of the pump power was 17.6 dB/m at the wavelength of 974 nm. In the second pre-amplifier, a double cladding Er/Yb co-doped PM fiber was adopted, and the fiber was pumped by a 976 nm LD via a PM (2 + 1) × 1 pump combiner. The core diameter and numerical aperture (NA) of the PM fiber were 12 µm and 0.2, respectively, and the inner cladding diameter and NA of the fiber were 130 µm and 0.46, respectively. The pump absorption coefficient of the fiber was 10 dB/m at the wavelength of 976 nm.
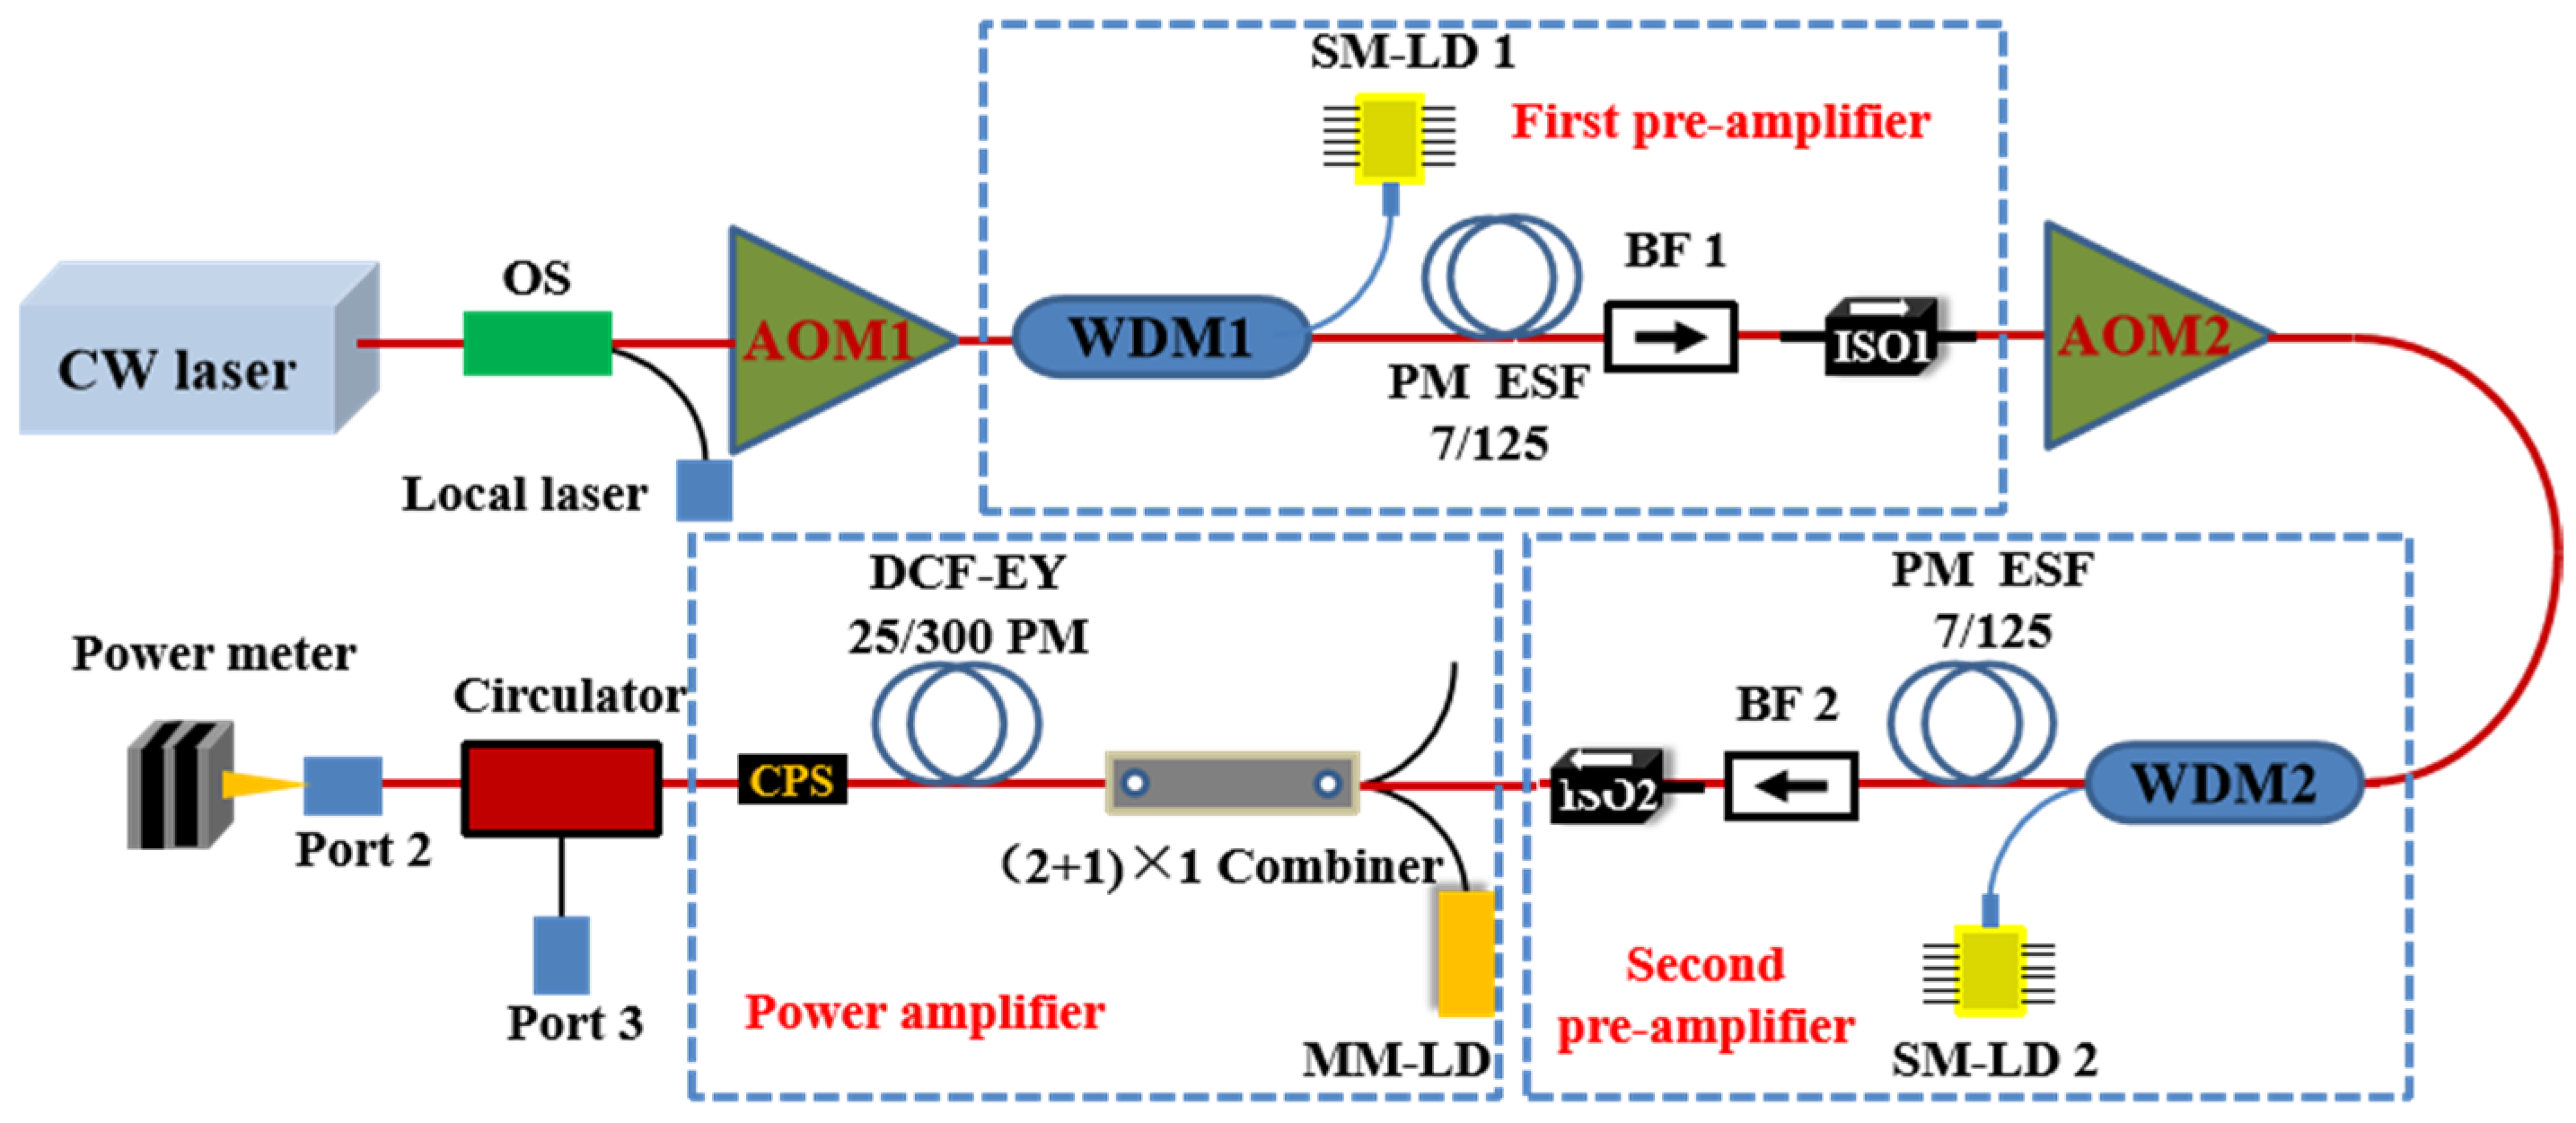
Figure 2 depicts the other MOPA configuration. The first pre-amplifier was set between the two AOMs. The first pre-amplifier setup was the same as the first pre-amplifier of the first MOPA construction as shown in
Figure 1. In the second pre-amplifier, the active SM fiber and construction were also the same as those of the first pre-amplifier.
In the two MOPA configurations, two isolators with >30 dB isolation were used between the amplifiers to protect the former stage from back-scattered light. In addition, the out-of-band ASE laser was removed by the band-pass filter with ±2 nm bandwidth. The main power amplifier adopted a large mode area (LMA) Er/Yb co-doped PM fiber with 1 m length and an LD with the power of 9 W at the wavelength of 976 nm. The core diameter and NA of the fiber were 25 µm and 0.09, respectively, and the inner cladding diameter and NA of the LMA fiber were 300 µm and 0.46, respectively. The signal and pump light are coupled by a (2 + 1) × 1 PM pump combiner. The unabsorbed 976 nm laser and the cladding light were extracted using a cladding power stripper (CPS). A circulator was spliced after the CPS to output the laser power with port 2 and receive back-scattered light of the end cap with port 3.
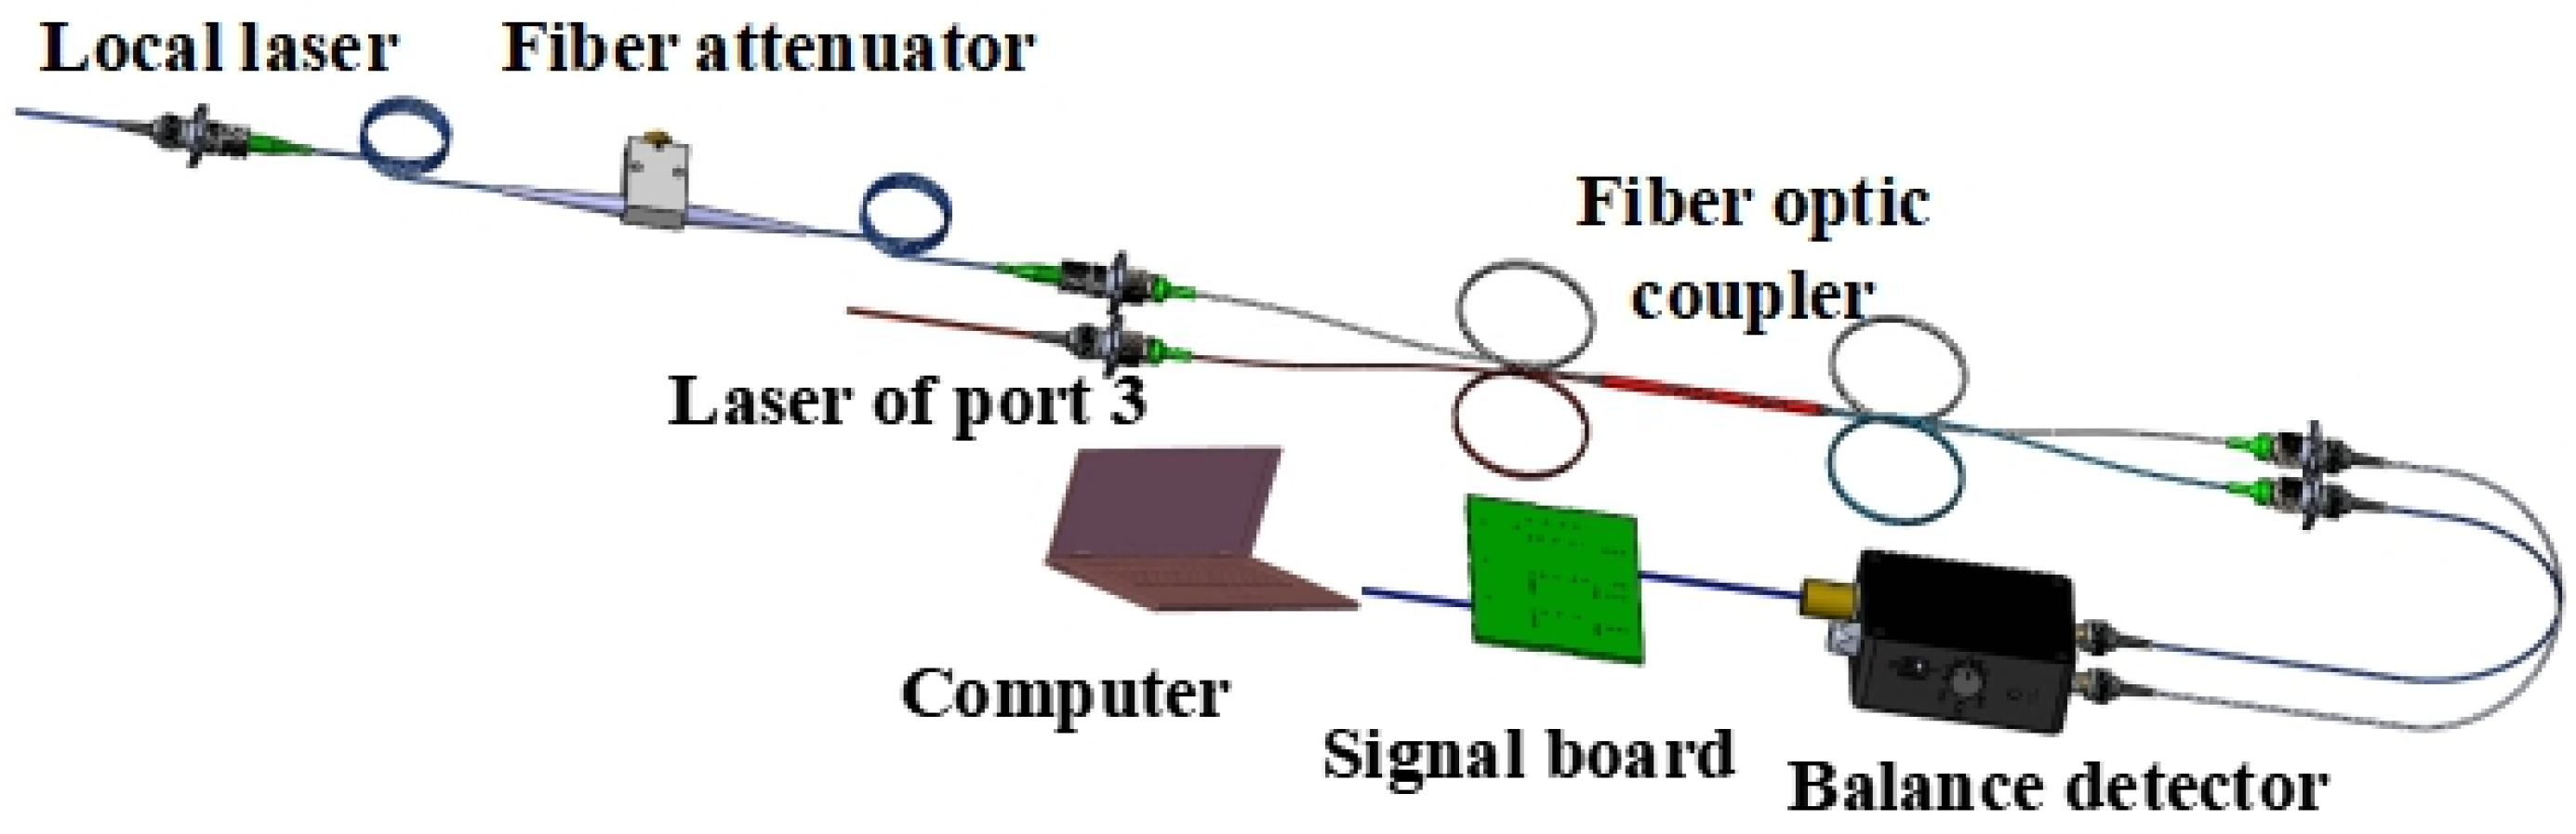
Figure 3 shows the construction of the coherent detection. The local laser was attenuated through a fiber attenuator, and the laser of port 3 was coupled to the balance detector by a 2 × 2 fiber optic coupler (50/50) to achieve the best frequency and produce the power spectrum. A balance detector was used to convert the optical signal into the electrical signal. In the end, the first derivative of the backscatter intensity was used to identify the altitude of the cloud-base.
3. Results and Discussion
A distributed feedback (DFB) fiber laser with an output power of 40 mW was used for the seed in the experiment. The power of the local laser for coherent detection is 3.7 mW. The output power of the modulated fiber laser after the AOM1 was approximately 270 μW with 10 kHz pulse repetition frequency and 500 ns pulse width. In the first MOPA configuration as shown in
Figure 1, the modulated laser power after the AOM1 and AOM2 was approximately 37.16 μW. The pulse shape after AOM2 is shown in
Figure 4. In the first pre-amplifier, when the pump power was 204 mW, the output power of the fiber laser was 18 mW. Combined with the output power of the second pre-amplifier in the second MOPA configuration, only 820 mW of the pump was applied to the second pre-amplifier to acquire about the same output power as the second pre-amplifier of the second MOPA configuration, and 79 mW output power was obtained. The optical–optical (O-O) efficiency was 10.87% because of the shorter gain fiber that increased the SBS threshold in the fiber laser.
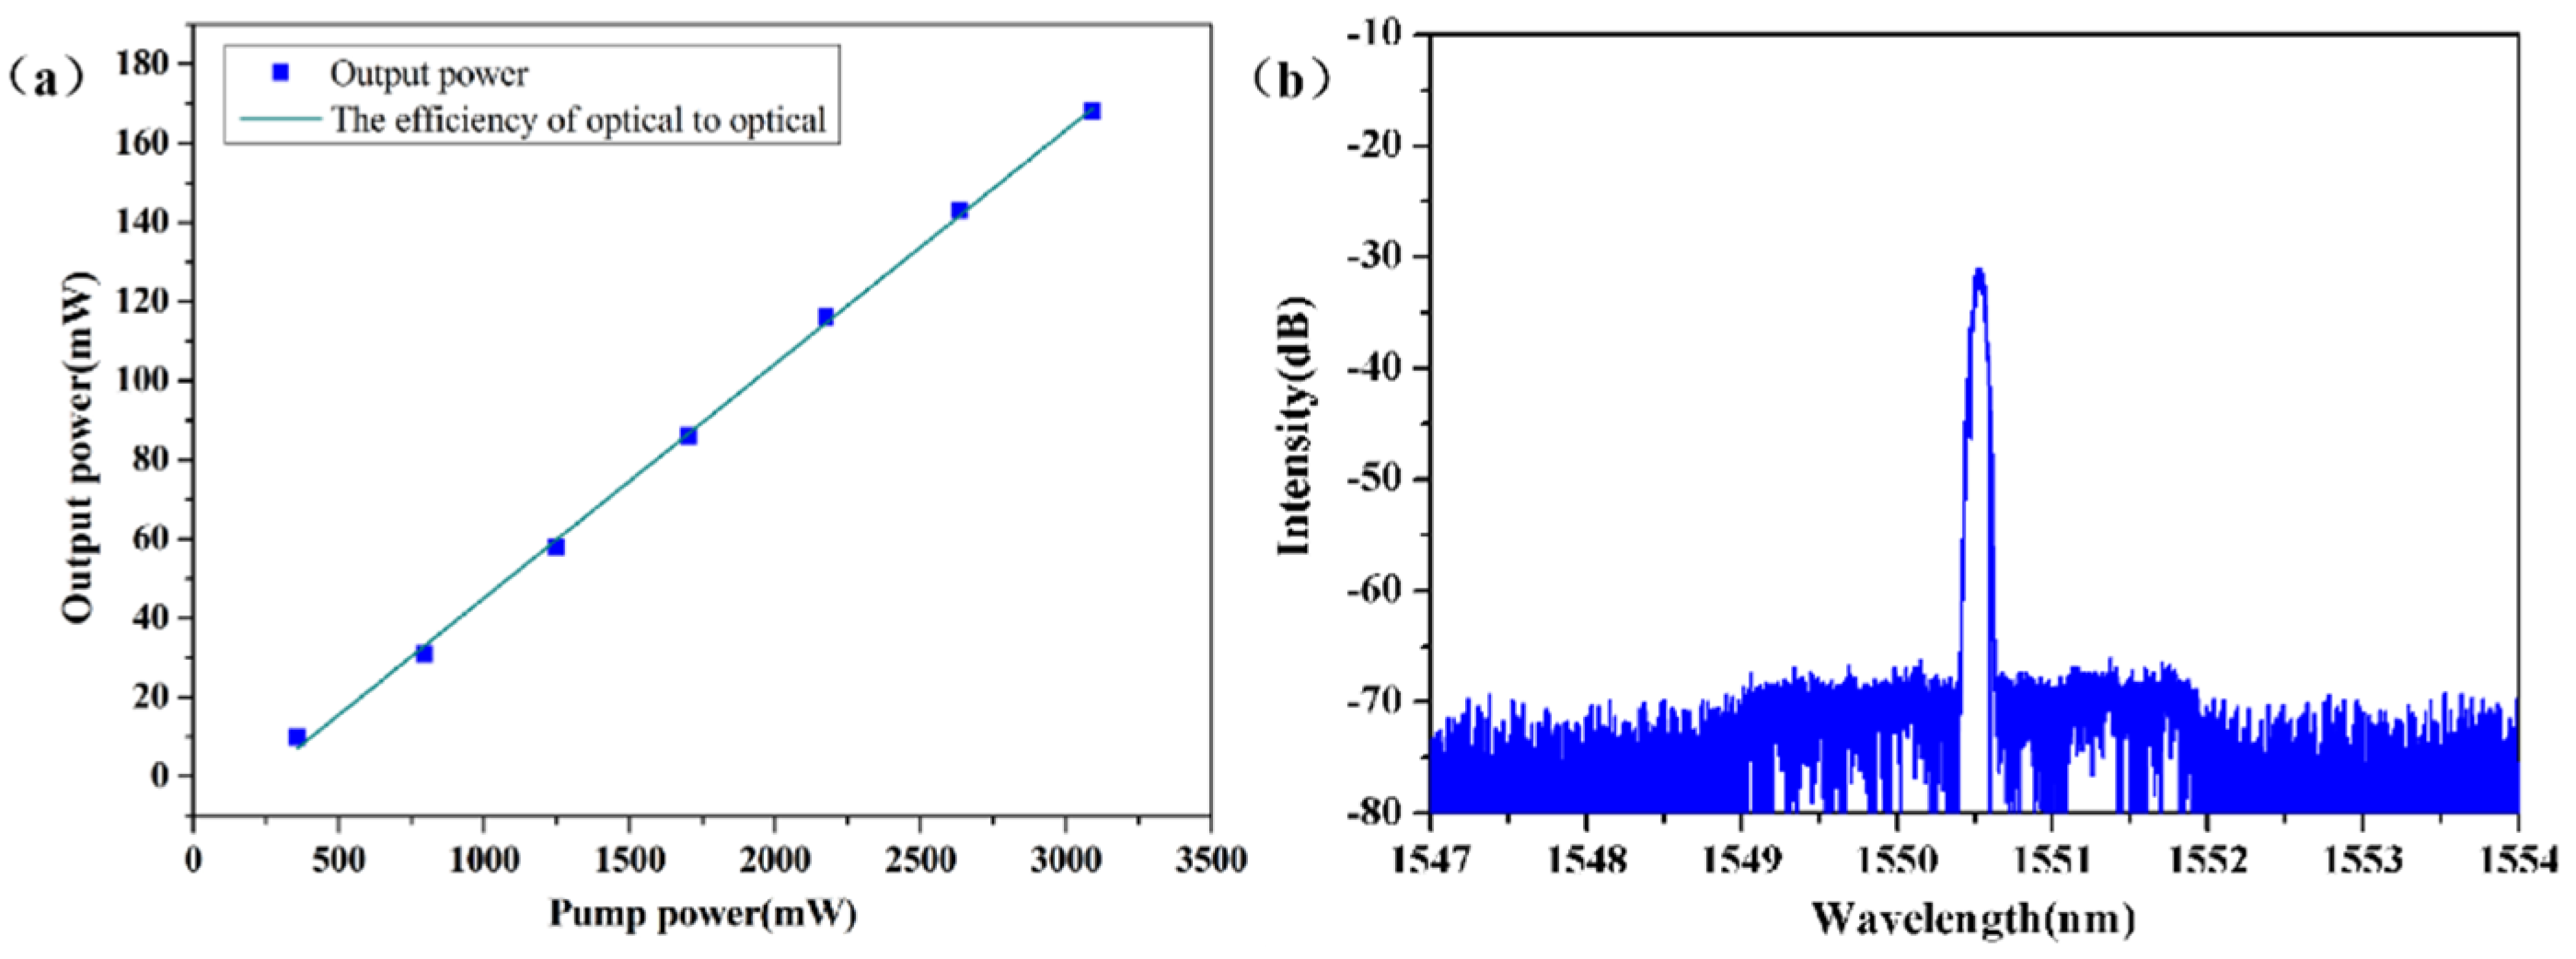
Figure 5a shows the average output power with different pump power in the second amplifier stage. It can be seen that the O-O conversion efficiency still increases, so it can be seen that the output laser power can be increased by continuously increasing the pump power. The output spectrum of the second pre-amplifier at the output power of 79 mW is measured using an optical spectrum analyzer (YOKOGAWA, AQ6370D) with a resolution bandwidth of 0.02 nm as shown in
Figure 5b. In the process of the second pre-amplifier, the noise from 1548 nm to 1552 nm was not evident, and the SNR was more than 35 dB. In the main power amplifier stage, with 7290 mW pump power, the signal power was boosted to 1009 mW with O-O conversion efficiency of 13.84%, as shown in
Figure 6a. The output spectra of the main power amplifier with different output power were recorded, as shown in
Figure 6b. The figure shows that the power of the in-band ASE increased with the output power of the main power amplifier. However, the out-band ASE component was removed by the bandpass filter with a ±2 nm bandwidth.
Figure 6b indicates that the output spectrum at the output power of 1009 mW exhibits strong ASE from 1549 to 1552 nm, which can be further amplified by increasing the output power of the main power amplifier, and the noise competition is improved. The corresponding SNR measurements versus output power were shown in
Figure 7. At 1549.5 nm and 1559.5 nm, the ASE increased faster after an output power level of 53 mW, as indicated by the SNR measurement. The output pulse shape of the main power amplifier stage at the maximum average power was recorded by using an oscilloscope (Tektronix TDS 3054C) and a fast photodiode (Thorlabs DET08CFC/M), as shown in
Figure 8. The output pulse width was measured to be 400 ns full width at half maximum (FWHM) without distortion.
In the second MOPA configuration as shown in
Figure 2, the modulated laser power after the AOM1 was boosted to 50 mW through the first pre-amplifier.
Figure 9 depicts the pulse shape of the fiber laser after the first pre-amplifier at the maximum average power. It can be seen that the pulse shape becomes steep at the leading edge, owing to the fact that the front part of the pulse expended more high-energy-level inverted number of particles and obtained more gain than the back during amplification. We used a pulse shaping technology to modulate pulse shape and mitigate the gain saturation in amplifications. The designed signal which was designed by an arbitrary waveform generator was used to modulate the AOM2 driver, and the front edge of the pulse shape was adjusted to be slow and smooth. The output power after AOM2 was 7 mW.
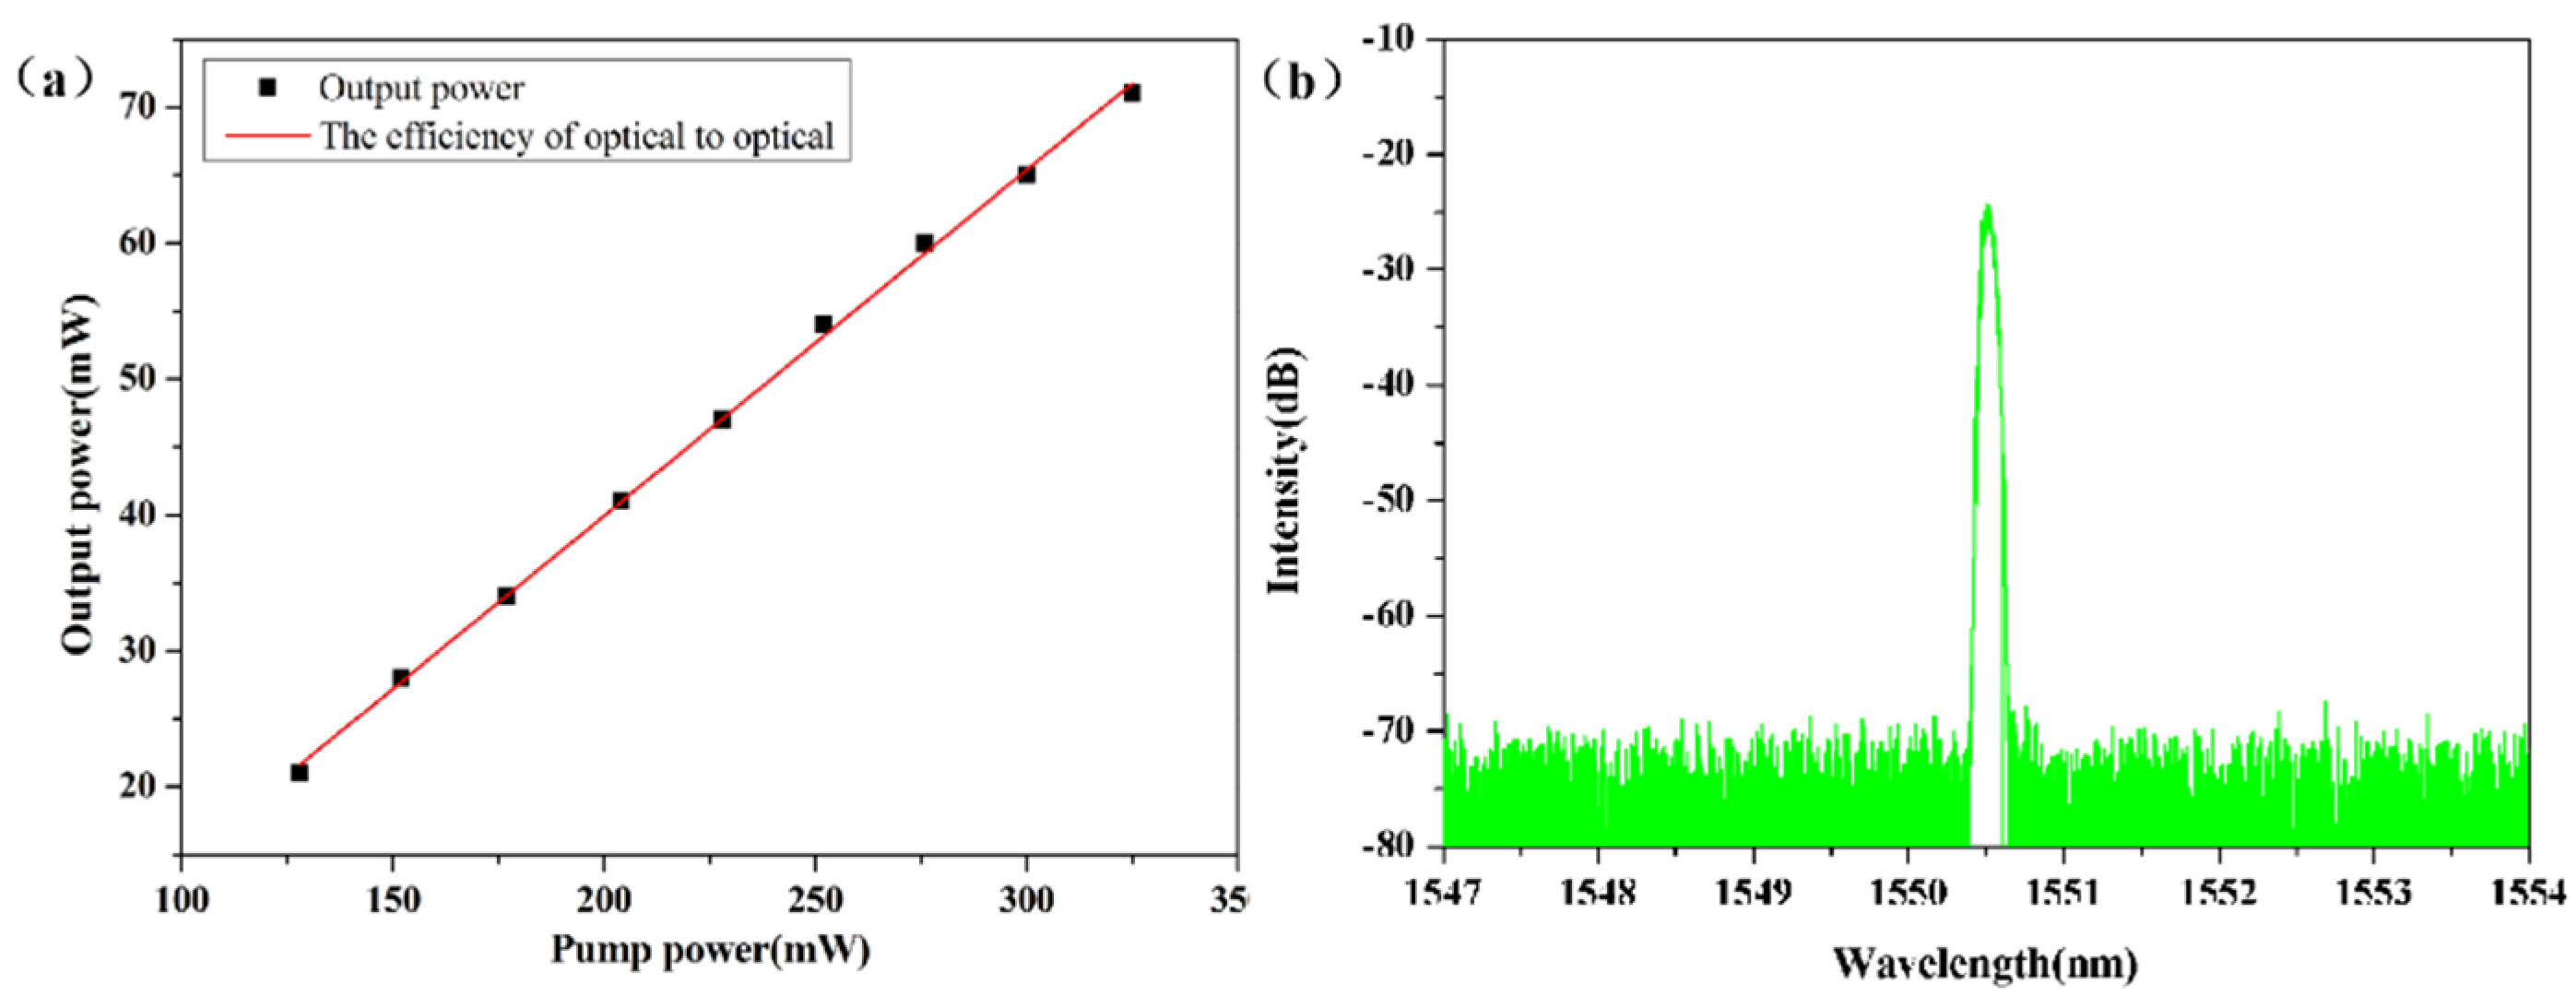
Figure 10a shows the second pre-amplifier output power and gain as a function of the pump power. The figure indicated that the output power increases linearly with the increase of the pump power. When the pump power was 325 mW, the output power was 70 mW, and the corresponding O-O conversion efficiency was 21.53%. The output spectrum was measured using an optical spectrum analyzer as shown in
Figure 10b. It can be seen that there was no ASE in the second pre-amplifier. The output power of the main power amplifier was pumped with the wavelength of 976 nm as shown in
Figure 11a, and the signal power was boosted to 1020 mW with O-O conversion efficiency of 10.6% due to limited pump absorption with shorter fiber length. The length of the gain fiber was reduced to increase the SBS threshold in the fiber, and the amplification O-O efficiency was relatively low. The output spectrum of the main power amplifier was recorded at the maximum average power, as shown in
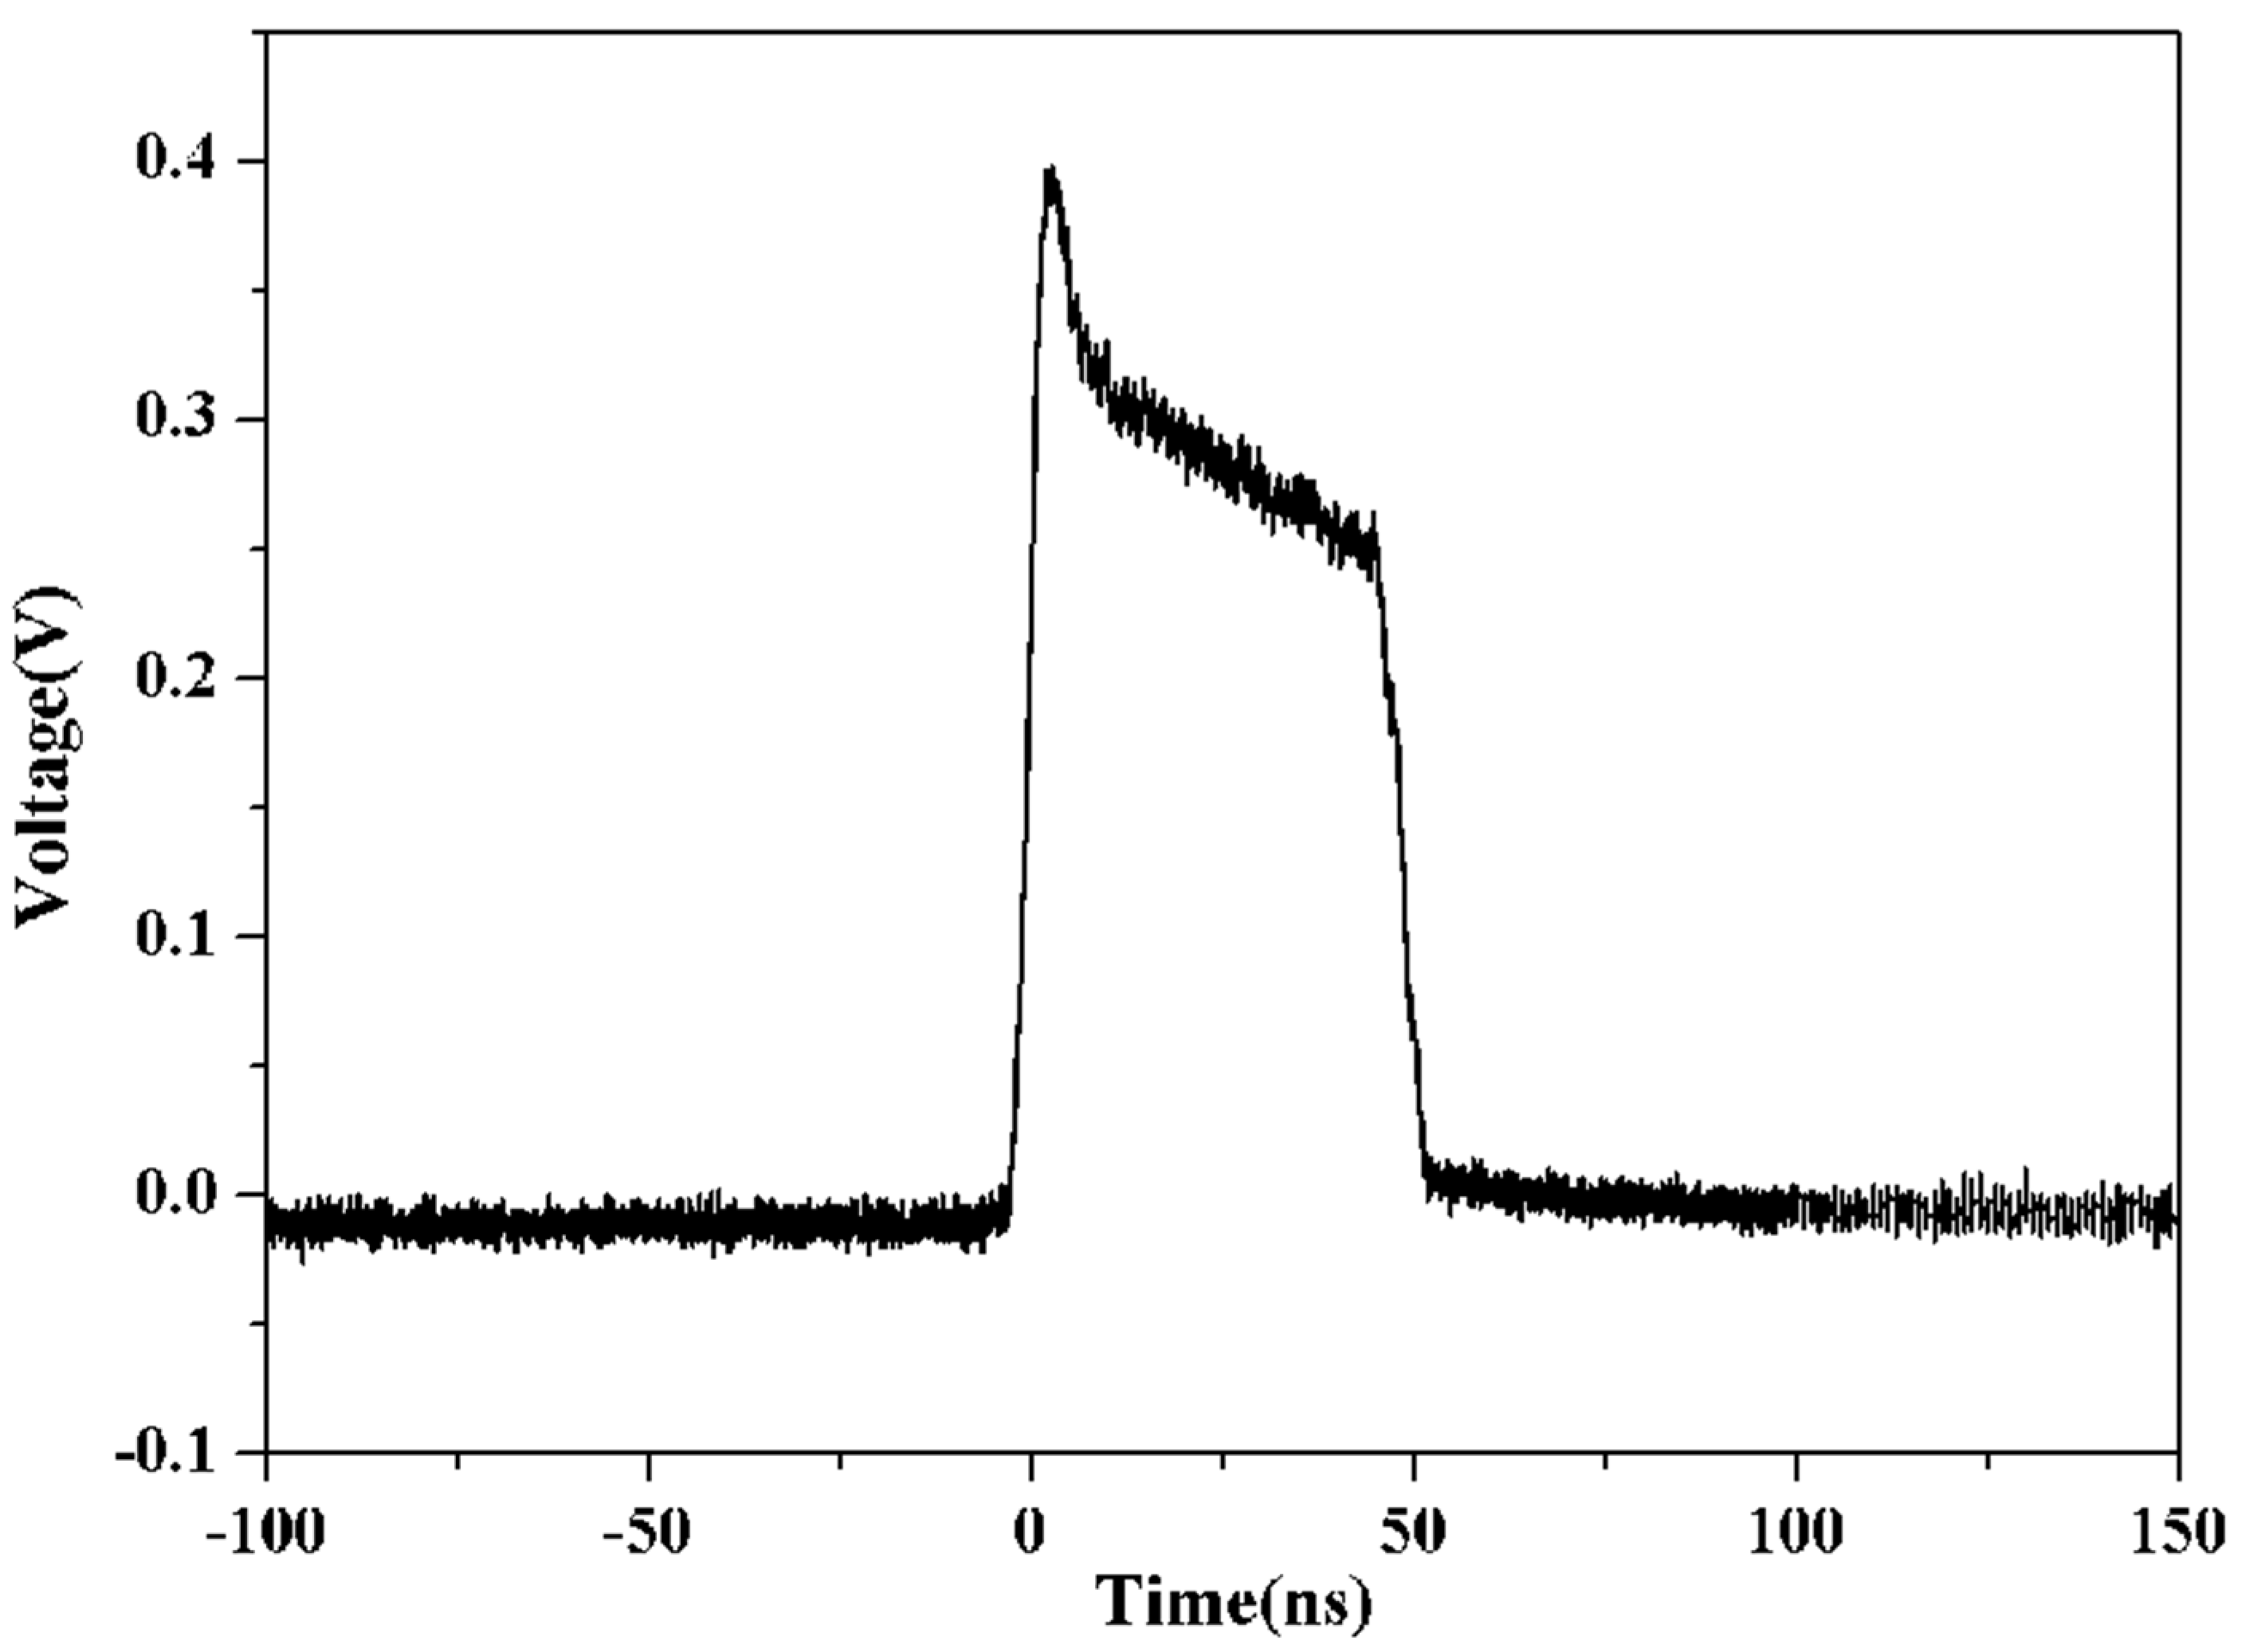
Figure 11b, indicating that the output spectrum at 1020 mW output power did not exhibit the ASE laser. At the maximum average power, the output pulse width was measured to be 400 ns FWHM, and the output pulse shape did not exhibit distortion, as shown in
Figure 12. In two MOPA configurations, the SBS threshold has been increased due to the maximum optimization of passive and active fiber lengths at all levels throughout the entire system design process. The output pulse shape of the main power amplifier at the maximum power in the two amplification structures shown in
Figure 8 and
Figure 12 indicated no periodic oscillation depressions on the pulse waveform. Therefore, the SBS was not present in the main power amplifier of the fiber laser.
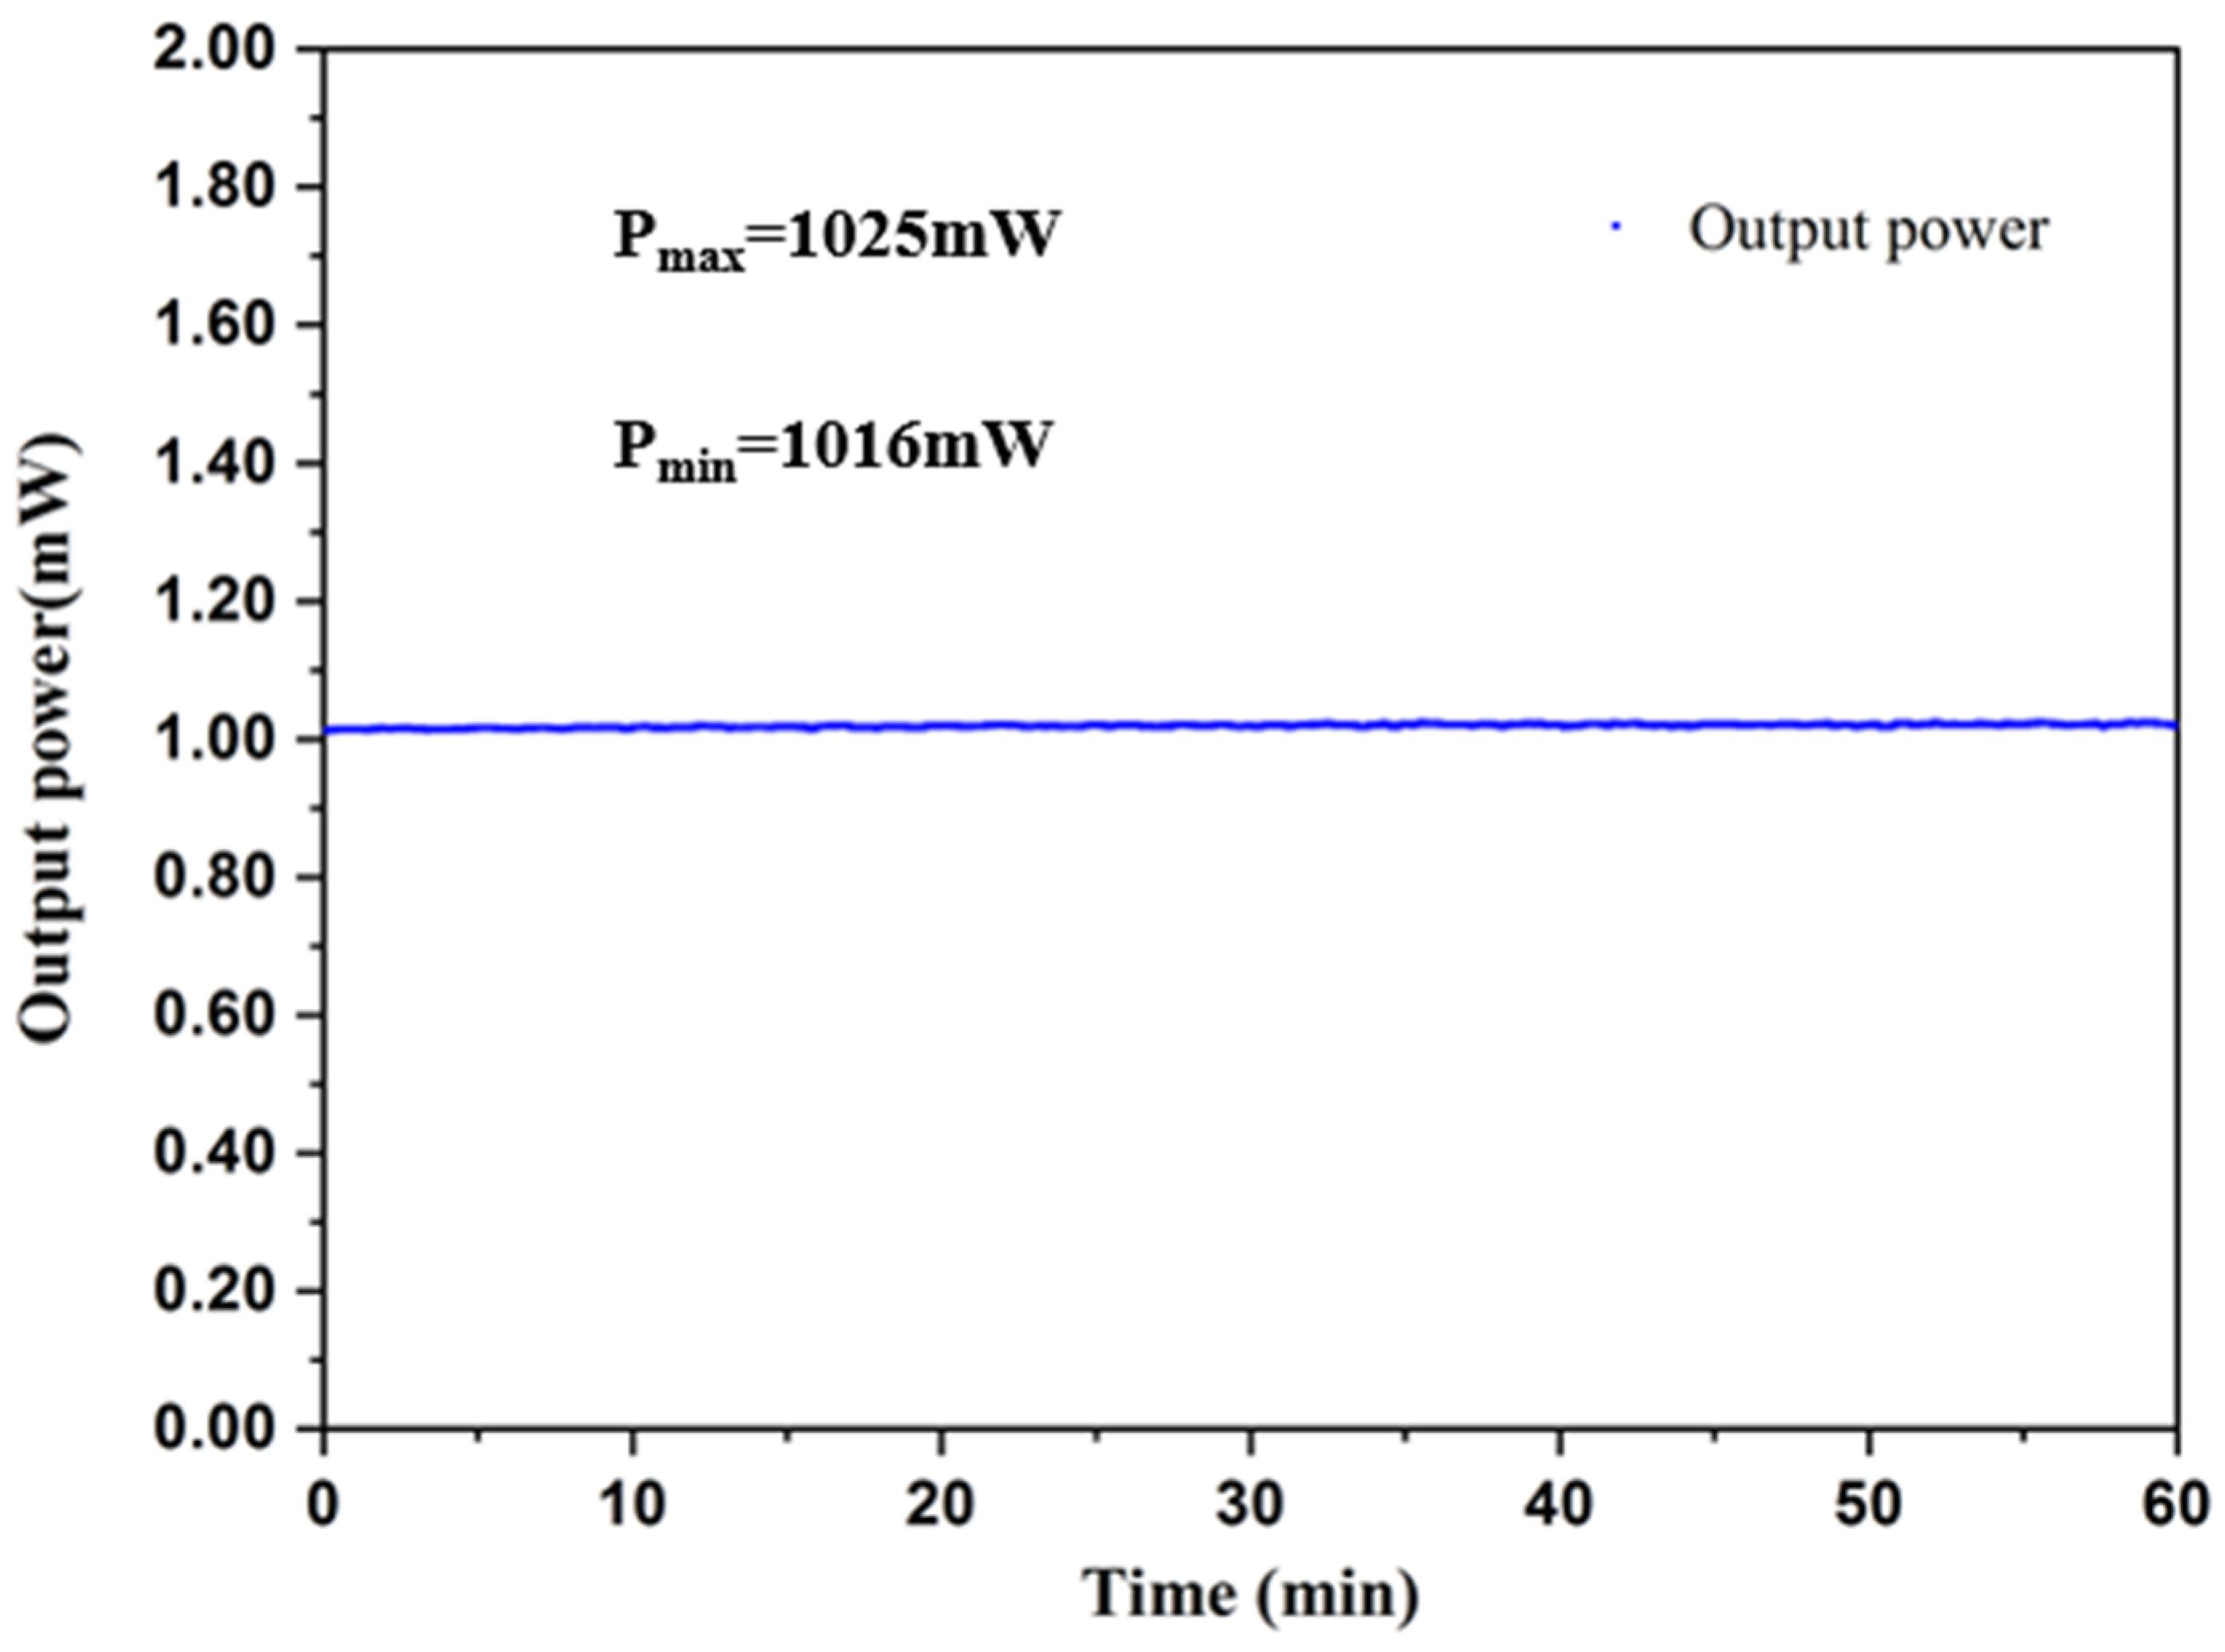
When all-weather measurement of clouds is required, the Lidar ceilometer should work for a long time. The long-term stability of the fiber laser will directly affect the accuracy of the Lidar ceilometer. Therefore, we monitor the stability of the laser at full power.
Figure 13 shows the fluctuation of the output power in 60 min at the maximum average power. The fluctuation of the power was less than 9 mW, and the ratio of fluctuation to the average value was less than 0.9%, owing to the heat accumulation of the pump heat and fiber system. We can further improve the power stability of the fiber laser by controlling the temperature range of the pump and fiber system by using thermoelectric cooler (TEC) heat dissipation.
The Lidar backscatter intensity P(r), which is a function of the backscatter coefficient β(r), the attenuation coefficient δ(r), and the range r, is expressed by the Lidar equation as follows:
where C is an instrument constant. This equation indicates that in a homogeneous atmosphere P (r) will decrease with range in an exponential fashion. The first derivative of backscatter intensity dP/dr can be used to identify the altitude of the cloud base [
22].
With the first MOPA configuration,
Figure 14a show the first derivative of backscatter intensity with different signal power of 183, 318, 810, and 1009 mW, respectively. It can been seen that the intensity of the noise with the power of 183 mW still changes the irregularity. When the power of the fiber laser was below 300 mW and the SNR is below 33 dB, the background noise of the backscatter intensity remained basically unchanged. However, as the pump power increased, when the output power of the fiber laser was more than 300 mW, the background noise intensity began to oblique in an upward variation with the increase of the output power. The angle of inclination increased with output power. The intensity of the noise, which changes with angle of the inclination will disturb the actual signal.
ASE was suppressed successfully by optimizing the MOPA configuration with an output power of 1020 mW. Compared with the first MOPA configuration, with the same pre-amplifier power and the same output power, the first derivative of backscatter intensity was detected with the second MOPA configuration.
Figure 14b depicts the first derivative of backscatter intensity with the second MOPA configuration as shown in
Figure 2. It can be seen that the intensity of the noise changed irregularity with different signal power levels of 62, 460, 834, and 1020 mW at different altitudes. The background noise of the backscatter intensity basically varied irregularly along a centerline, and when there was a far-field feedback signal, it was not submerged by background noise.
Two MOPA configurations were compared, and the results showed that the noise intensity with angle of the inclination was affected by the ASE of the amplifier, which decreased the SNR of the output power. The fiber laser produced an output power with very low ASE level to acquire the first derivative of backscatter intensity with a low noise. In addition, ASE can be suppressed by increasing the output power of the seed after AOM.

 ,
, 