Article

Analysis of Major Polyphenolic Compounds of Cydonia oblonga Miller (Quince) Fruit Extract by UPLC-MS/MS and Its Effect on Adipogenesis in 3T3-L1 Cells

Department of Pharmacology, School of Pharmacy, Xinjiang Medical University, No. 393, Xinyi Road, Urumqi 830011, China
*
Authors to whom correspondence should be addressed.
These authors contributed equally to this work.
Separations 2022, 9(7), 167; https://doi.org/10.3390/separations9070167
Submission received: 2 June 2022 / Revised: 24 June 2022 / Accepted: 27 June 2022 / Published: 1 July 2022
(This article belongs to the Special Issue Liquid Chromatography: Development of Separation Techniques)

Abstract

:
Cydonia oblonga miller (quince) plant serves as a potential folk medicine for treating hypertension and cardiovascular diseases in China. However, to the best of our knowledge, no study has been conducted on the polyphenolic profile and anti-adipogenic effect of quince fruit grown in China. In the current study, we aimed to investigate the quince fruit extract’s major phenolic compounds, evaluate their antioxidant activity, and examine their effect on adipogenesis in 3T3-L1 cells. A rapid and sensitive analytical method was established for the simultaneous determination of major polyphenolic compounds by using ultra-pressure liquid chromatography coupled with a triple quadrupole mass spectrometer (UPLC-MS/MS). Among the 10 compounds, the cryptochlorgenic acid was noticed as the most abundant compound of both purified (242.44 ± 0.73 µg/mg dw) and unpurified extract (3.37 ± 0.01 µg/mg dw) followed by quercetin 3-rutinoside and chlorogenic acid. Alternatively, both extracts possessed a high quantity of phenolic acids (purified extract = 483.10 ± 5.16 µg/mg dw and unpurified extract = 7.89 ± 0.02 µg/mg dw). The purified extract exhibited a strong antioxidant capacity (DPPH: EC50 = 3.316 µg/mL, ABTS: EC50 = 36.38 µg/mL) as compared to the unpurified extract. Additionally, our results also showed that the extract at 100 µg/mL significantly suppressed the preadipocyte differentiation and decreased the lipid droplets up to 69% in mature adipocytes. The present study highlights an accurate and fast detection method for quince fruit extract polyphenolic compounds with its antioxidant and antiadipogenic effects. The study also provides the necessary information for the rational development and utilization of quince fruit extract as a source of phytochemicals.

1. Introduction

Over the last few decades, the concept of using medicinal compounds originating from natural sources is increasing as an alternative to synthetic drugs. Most of these natural products serve as the initiative product for new drug discovery [1]. These products derived from natural sources are mostly genetically encoded and secondary metabolites [2]. According to the WHO estimation, around 80% of the world’s population depends mostly on natural products as a source of medicinal agents in different traditional medicinal systems [3]. Plants are the primary and oldest source of production of natural products as medicinal agents [4]. It is obvious that most Western medicines or synthetic drugs have unsatisfactory results with serious adverse reactions and complications. Therefore, drugs derived from natural sources are gaining much attention worldwide [5]. It has been noticed in developing countries and in some developed countries, that most of the people are following the prescription of natural drugs of plant origin [6,7]. For instance, in the treatment of some complex diseases such as cancer and degenerative diseases, the reliance on a single compound drug discovery has failed because of their inefficient cure effect. On the other hand, plant extracts are therapeutically more potent because of their synergetic and simultaneous action of different chemical compounds [8]. These chemical compounds obtained from different plants are generally classified into different groups such as alkaloids, terpenoids, phenolics, glycosides, tannins, saponins, etc. [9]. Among these compounds, a vast and great pharmacologically active role of polyphenolic compounds has been reported such as antioxidant [10], antihypertensive [11], anti-atherosclerosis [12], anti-diabetic [13], anti-cancer, and so on [14,15,16]. These pharmacological actions increased the importance of polyphenolic compounds among plant secondary metabolites and attracted researchers’ attention toward themselves.
Cydonia oblonga miller (quince) is a fruit plant belonging to the Rosaceae family [17]. The fruit of the plant serves as both a medicinal and food agent especially used in the pro-duction of jams [18]. Quince fruit is a source of polyphenolic compounds containing chlorogenic acid, cryptochlorogenic acid, neochlorogenic acid, isochlorogenic acid, quer-cetin 3-rutinoside, quercetin 3-galactoside, quercetin 3-glucoside, kaempferol 3-glucoside, kaempferol glycoside, and kaempferol 3-rutinoside as major phenolic compounds. These compounds have been reported to be involved in different pharmacological activities, making the plant unique for its medicinal purposes [19,20]. Moreover, it is also famous for its several therapeutic activities reported in different traditional medicine systems [21]. For instance, quince fruit is traditionally used to treat respiratory disorders, ulcers, hemolysis, urinary complications, and diabetes [18]. Likewise, its fruit is also used for the preventing and cure of cardiovascular diseases in traditional Uyghur medicines [22]. On the other hand, in the traditional Iranian medicine system, the plant is used to treat several diseases, including liver diseases, chronic headache, nausea and vomiting, and motion sickness [23]. In addition, several modern research studies reported different pharmacological activities of quince fruit extract such as antioxidant activity [24], an anti-inflammatory effect [25], chemo-preventive effect [26], protective effect in gastric ulcer [27], anti-colitis effect [21], aphrodisiac effect [28], antihypertensive effect [29], and hypolipidemic effect [30]. Based on the facts, the plant is a valuable source of phenolic compounds and has a long history of being traditionally used for treating different diseases, thus considering the plant a valuable medicinal agent.
In the present study, the quince fruit specimens collected in the Xinjiang region of China were investigated for their major polyphenolic compound’s composition and antioxidant activities. An accurate, rapid, and highly sensitive ultra-performance liquid chromatography tandem mass spectroscopy (UPLC-MS/MS) method was established to detect and quantify the major polyphenolic compounds of the extract with low detection and quantify limits. Additionally, the extracts were measured for total phenolic and flavonoid contents. Moreover, the extract was evaluated for its anti-adipogenic effect in 3T3-L1 cells. To our knowledge, the current study is the first time reporting the quince fruit extract’s effect on adipogenesis in 3T3-L1 cells.

2. Materials and Methods

2.1. Reagents and Standards

Quercetin 3-rutinoside, quercetin 3-glucoside, quercetin 3-galactoside, neochlorogenic acid, chlorogenic acid, caffeic acid, and kaempferol 3-glucoside were obtained from Shanghai Yuanya Bio-Technology Co., Ltd. (Shanghai, China). Kaempferol 3-rutinoside, crypto-chlorogenic acid, and iso-chlorogenic acid A were obtained from Sichuan Vickery Biotech Co., Ltd. (Sichuan, China). All the analytical standards were HPLC grade with the purity rate of ˃98%. The purity rate of 1,1-Dipenyl-2-picrylhydrazinde (DPPH), 2,2′-azino-bis (3-thylbenzothiazoline-6-sulfonic acid) diammonium salt (ABTS), and gallic acid were ˃98%, while 2,2′-azobis (2-methylpropionamidine) dihydrochloride (AAPH) was ˃97%; all were obtained from Solarbio (Beijing, China). AB-8 Macroporous adsorption resin, Oil red O, insulin, and dexamethasone were purchased from Solarbio (Beijing, China). LC/MS grade methanol, formic acid, and acetonitrile were obtained from Fisher Scientific (Waltham, MA, USA). The Folin-Ciocalteu’s phenolic reagent and 3-Isobutyl-1-methylxanthine (IBMX) were obtained from Sigma Aldrich Co. (St Louis, MO, USA). The water for the experiment was purified by the Millipore water purification system (Millipore, Milford, MA, USA). Figure 1 shows the chemical structures of the 10 analytical standard compounds used in this study.

2.2. Extraction of Polyphenols

Quince fruits were collected from Yecheng county, Kashgar prefecture, Xinjiang, China in October 2020. The fruits were identified by Prof, ABULIZI Padida, (certificate No. TCMEHSM2013_101) Department of Nature Pharmaceutical Chemistry, Xinjiang Medical University. The fruits were washed with tap water, cut into thin slices, and freeze-dried. Next, we crushed the dried fruits into fine powder and soaked them in ethanol (60% dilution in distilled water) at the ratio of 1:40 (g/mL) at room temperature for 24 h with continuous mixing by using an electric stirrer. After repeating three times, the extract was filtered using Whatman filter paper No. 1. The filtrate was concentrated by using the reduced pressure rotatory evaporator (EYELA N-1001, EYELA Co., Ltd., Shanghai, China) at 40 °C until the complete removal of ethanol. The obtained extract was an unpurified extract containing polysaccharides and other non-polar compounds and was further processed for polyphenolic purification. The yield of the unpurified extract was 25.54%.

2.3. Purification of Polyphenols

The extracted polyphenols from quince fruit were purified by using AB-8 macroporous resins. Briefly, 250 g of AB-8 macroporous resins was socked in 500 mL of absolute ethanol for 24 h, then washed with double distilled water (DDW) (1 L) three times. Next, the resins were transferred to a preparative glass chromatographic column (100 cm × 3.5 cm). The AB-8 microporous resins were activated for 2 h with 5% HCL solution and washed with DDW (1 L) 3 times. After that, it was neutralized with 2% sodium hydroxide solution for 2 h following a 3-times wash with DDW (1 L). The unpurified extract was loaded onto the column and washed out with DDW (1 L) to elute the polysaccharides and other non-polar compounds. Next, the polyphenolic fraction was collected with 60% ethanolic wash. The purification process was repeated twice, and the collected ethanolic fraction was reduced at 40 °C until the complete removal of ethanol by a vacuum evaporator, and then lyophilized and stored at −20 °C until use. The obtained extract was the purified polyphenolic extract of quince fruit with a total yield of 4.26%.

2.4. Determination of Total Phenolic Contents (TPC) and Total Flavonoid Contents (TFC)

The total phenolic contents (TPC) and total flavonoid contents (TFC) were determined following a standard method [31], with some minor modifications. For the determination of TPC, 20 µL of 300 µg/mL extract was added to a 96-well plate with 100 µL of Folin-Ciocalteu reagent (10% v/v); after 5 min, 80 µL of sodium carbonate solution (7.5% w/v) was added and incubated in the dark for two hours at room temperature. The absorbance was measured at 765 nm by microplate reader (Multiskan GO, Thermo Scientific, Waltham, MA, USA). To determine the TFC, 50 µL of 2% aluminum tri-chloride solution (in methanol) was added to a 96-well plate with an equal amount of ex-tract (300 µg/mL). After 10 min of incubation at room temperature, the absorbance was measured at 415 nm by a microplate reader. The TPC and TFC were expressed as mg of gallic acid equivalents per g of dry weight (mg GAE/g dry wt.) and mg of quercetin equivalents per g of dry weight (mg QU/g dry wt.), respectively, using a calibration curve prepared with the standards.

2.5. Antioxidant Activity

For the antioxidant activity, all the tests were performed away from direct light in 96-well microplates. The range of tested extracts started from 0.488 µg/mL to 250 µg/mL (dilution factor 1:2). In each experiment, each concentration was tested six times and all the experiments were repeated three times. Ascorbic acid was used as a positive control agent. The absorbance was read by using a microplate reader.
DPPH and ABTS radical scavenging activities were performed as previously described [32]. Briefly, to perform the DPPH assay, 40 µL of the DPPH solution 0.1 mM was added to 160 µL of different concentration samples and incubated for thirty minutes in the dark at room temperature. The reaction absorbance was measured at the wavelength of 517 nm. Regarding the ABTS radical scavenging assay, the ABTS radical cation was produced by mixing an equal proportion of ABTS 5 mM and AAPH 2 mM solutions and incubating for 45 min at 68 °C. The solution was diluted with 0.1 M PBS (pH about 7.0) to obtain an absorbance of 0.700 (±10) at 734 nm wavelength. Next, 20 µL of different concentration sample solutions were added to 180 µL ABTS radical and incubated for ten minutes at 37 °C in the dark; the absorbance was measured at a wavelength of 734 nm. The results for both assays were expressed as EC50: the concentration of the sample (in µg of dry extract/mL) at which 50% of the maximum scavenging activity was recorded.

2.6. Standard Solution Preparation for UPLC MS-MS Analysis

In total, 5 mg of each standard was accurately weighed and dissolved in 10 mL of methanol separately; after that, a calculated concentration of each standard solution was collected into a volumetric flask and diluted with different concentrations of methanol to obtain a working standard solution of appropriate concentration series within the given ranges: (1) neochlorogenic acid 19.53–1.0 × 10⁴ ng/mL, (2) chlorogenic acid 29.29–1.5 × 10⁴ ng/mL, (3) cryptochlorogenic acid 19.53–1.0 × 10⁴ ng/mL, (4) caffeic acid 2.92–1.5 × 10³ ng/mL, (5) quercetin-3-rutinoside 24.41–1.25 × 10⁴ ng/mL, (6) quercetin-3-galactoside 19.53–1.0 × 10⁴ ng/mL, (7) quercetin-3-glucoside 19.53–1.0 × 10⁴ ng/mL, (8) kaempferol-3-rutinoside 7.32–3.75 × 10³ ng/mL, (9) kaempferol-3-glucoside 7.32–3.75 × 10³ ng/mL, and (10) isochlorogenic acid 14.64–7.5 × 10³ ng/mL. All the standard solutions were stored at 4 °C and were filtered before analysis through 0.22 µm membrane.

2.7. Sample Solution Preparation for UPLC-MS/MS Analysis

In total, 5 mg accurately weighed purified and unpurified quince fruit extract was dissolved in 5 mL methanol to prepare the stock solution. After that, 900 µL of stock solution was diluted to a final volume of 3 mL and filtered through a 0.22 µm membrane filter to prepare the working solution of 300 µg/mL for the UPLC- MS/MS analysis.

2.8. UPLC-MS/MS Analysis

The UPLC analysis was performed by using an ACQUITY UPLC I-Class system (Waters Corp., Milford, MA, USA) equipped with a sample manager (condition 10 °C), a binary solvent pump, and a thermostatic column compartment. An Acquity UPLC reverse-phase BEH C18 column (1.7 µm, 2.1 mm × 150 mm) was used for the chromatographic separation. The column temperature was maintained at 30 °C for the chromatographic separation of the analytes and extracts using a linear gradient elution program with the injection volume of 3.0 µL and a flow rate of 0.3 mL/min. The mobile phase system consisted of 0.1% aqueous formic acid solution (A-phase) and acetonitrile (B-phase) for a total run time of ten minutes for the experiment. The gradient condition for the mobile phase was as follows: an isocratic elution of 10% B for 0–1 min; 10–20% B for 1–3 min; an isocratic elution of 25% B, 3.0–5.0 min; 25–40% B, 5.0–6.0 min; 40–90% B, 6.0–10.0 min; then returned to the initial 10% B volume and maintained for 10 min to balance the column.
The eluent of the UPLC was directly infused into XEVO TQ-S (Waters Corp., Milford, MA, USA), a triple quadrupole mass spectrometer equipped with an electrospray ionization source (ESI) operated in negative mode. The quince fruit extracts and the analytes were analyzed in multiple reaction monitoring mode (MRM). The ideal ESI parameters for the analytes were as follows: source temperature 150 °C; desolvation temperature 350 °C; capillary voltage 3.0 kV; and the flow rates of desolvation and cone gas were 700 and 150 L/h, respectively. The cone voltage (cV) and collision energy (cE) were set to match the MRM of each marker. The quantitation of samples, data acquisition, analysis of data, and instrument control were conducted by using the Masslynx software version 4.1 (Waters Corp., Milford, MA, USA).

2.9. Method Validation

2.9.1. Calibration Curves, Limits of Detection (LOD), and Limits of Quantification (LOQ)

A calibration curve was plotted and used to determine calculated concentrations of the samples. For the estimation of limits of detection (LOD), and limits of quantification (LOQ), a methanol blank solution was injected six times for analysis in the UPLC system. As per ICH guidelines, the LOD and LOQ can be calculated from the following equation: LOD = 3.3 (N/S) & LOQ = 10 (N/S), where N is known as the standard deviation of the blank solvent response, while S is known as the slope of the corresponding calibration curve.

2.9.2. Precision, Repeatability, and Stability

To perform precision, repeatability, and stability tests, the quince purified extract was prepared by following the preparation method discussed in Section 2.7. For the precision analysis, six replicants were analyzed on the same day for the determination of intra-day precision; for the inter-day precision analysis, the samples were analyzed for three consecutive days. The method precision was determined by calculating the per-centage relative standard deviation (RSD) values of the analyzed samples. For the repeatability analysis, three different concentrations of the extract were analyzed in six replicants for each concentration, and the results were expressed as the mean of RSDs of the three concentrations of RSD. For the stability analysis of the extract, six injections of freshly prepared extract samples were analyzed in 24 h at a constant time interval (0, 4, 8, 12, 18, and 24 h) at room temperature.

2.9.3. Recovery

To evaluate the accuracy of the method, a recovery test was performed by adding a known amount of the mixed standard solution to a certain amount of the quince extract at three different concentration levels: low (80% of known concentration), medium (100% of known concentration), and high (120% of known concentration). The average recovery concentration (%) was calculated by the following formula:
Recovery (%) = [(observed amount − original amount)/spiked amount] × 100%

2.10. Identification and Quantification

Target compounds were identified by comparing their UPLC retention time and mass/charge ratio (m/z) with the corresponding standard compound. The linear calibration plots of peak areas and concentrations were used for the quantitative analysis of the compounds.

2.11. Cell Culture

Mouse preadipocytes 3T3-L1 cells were purchased from Procell (Wuhan, China). The preadipocytes were grown in Dulbecco’s Modified Eagles Medium (DMEM) high glucose supplemented medium with 10% newborn calf serum (NCS), 100 U/mL penicillin, and 100 µg/mL streptomycin (1× p/s) in a T-75 flask. As the cells reached near 80% confluence, the preadipocytes were sub-cultured. To differentiate adipocytes, the sub-cultured preadipocytes were maintained in DMEM with 10% NCS and 1× p/s for 48 h after confluence. Then, adipogenesis was induced with DMEM containing 10% fetal bovine serum (FBS), 0.5 mM IBMX, 1 µM dexamethasone, 1× p/s, and 10 µg/mL insulin for 2 days. After that, the cells were maintained in DMEM containing 10% FBS, 1× p/s, and 10 µg/mL insulin for 2 days. The cell culture medium was constantly changed after 48 h. The cells were grown at 37 °C in 5% CO2 humidified cell culture incubator. For the cell experiment, a stock solution of 100 mg/mL of the quince purified extract was prepared in dimethyl sulfoxide (DMSO). Further dilutions for working solutions were prepared in the medium with a DMSO concentration less than 0.05%. The working solution was filtered through 0.22 µm filter paper before use.

2.11.1. Cell Viability Assay

To assess the effect of quince fruit purified extract on cells’ viability, the 3T3-L1 preadipocytes were seeded in a 96-well plate at the density of 0.8 × 10⁴ cells/well. A full 48 h after confluence, the cells were treated with a series of extract concentrations. Next, the medium was replaced again after 48 h with a fresh medium containing PristoBlue HS cell viability reagent and was incubated for 30 min in the dark. Finally, the fluorescence was measured at 530/590 nm by VICTOR Nivo Multimode Plate Reader (Perkin Elmer, Beaconsfield, UK).

2.11.2. Oil Red O Staining

This experiment was performed in a 6-well plate following a standard method [33], with slight modifications. Briefly, the Oil red O working solution was freshly prepared by diluting the stock solution (0.5% w/v in isopropanol) with distilled water by 2:3 with the final proportion of 0.2% Oil red O in 40% isopropanol solution. The working solution was filtered through a 0.22 µm filter membrane before use. On day 8 of adipogenesis, the medium was removed, and cells were washed with PBS. The cells were fixed with 4% formaldehyde solution for 15 min. Next, the 4% formaldehyde solution was removed, and cells were incubated with the Oil red O working solution for 30 min at room temperature. After 5 times washing with DDW, the cells were observed and photographed under an optical microscope. The dye was eluted by incubating the cells with 100% isopropanol for 10 min, and absorption was measured at 510 nm by a microplate reader.

2.12. Statistical Analysis

Each experiment was performed in triplicate and repeated at least three times. All data are presented as means ± standard deviation (SD). EC50 values (antioxidant activity), the average, and the relative were calculated by using Microsoft Excel 2019 (Microsoft Corporation, Redmond, WA, USA). A one-way analysis of variance (ANOVA) and Tukey’s post hoc test was applied to estimate the differences between multiple groups’ mean values. Statistical significance was at p < 0.001 (99.9% confidence interval). Statistical values and figures were obtained by using GraphPad Prism version 8.0 for Windows (GraphPad Software, San Diego, CA, USA).

3. Results and Discussion

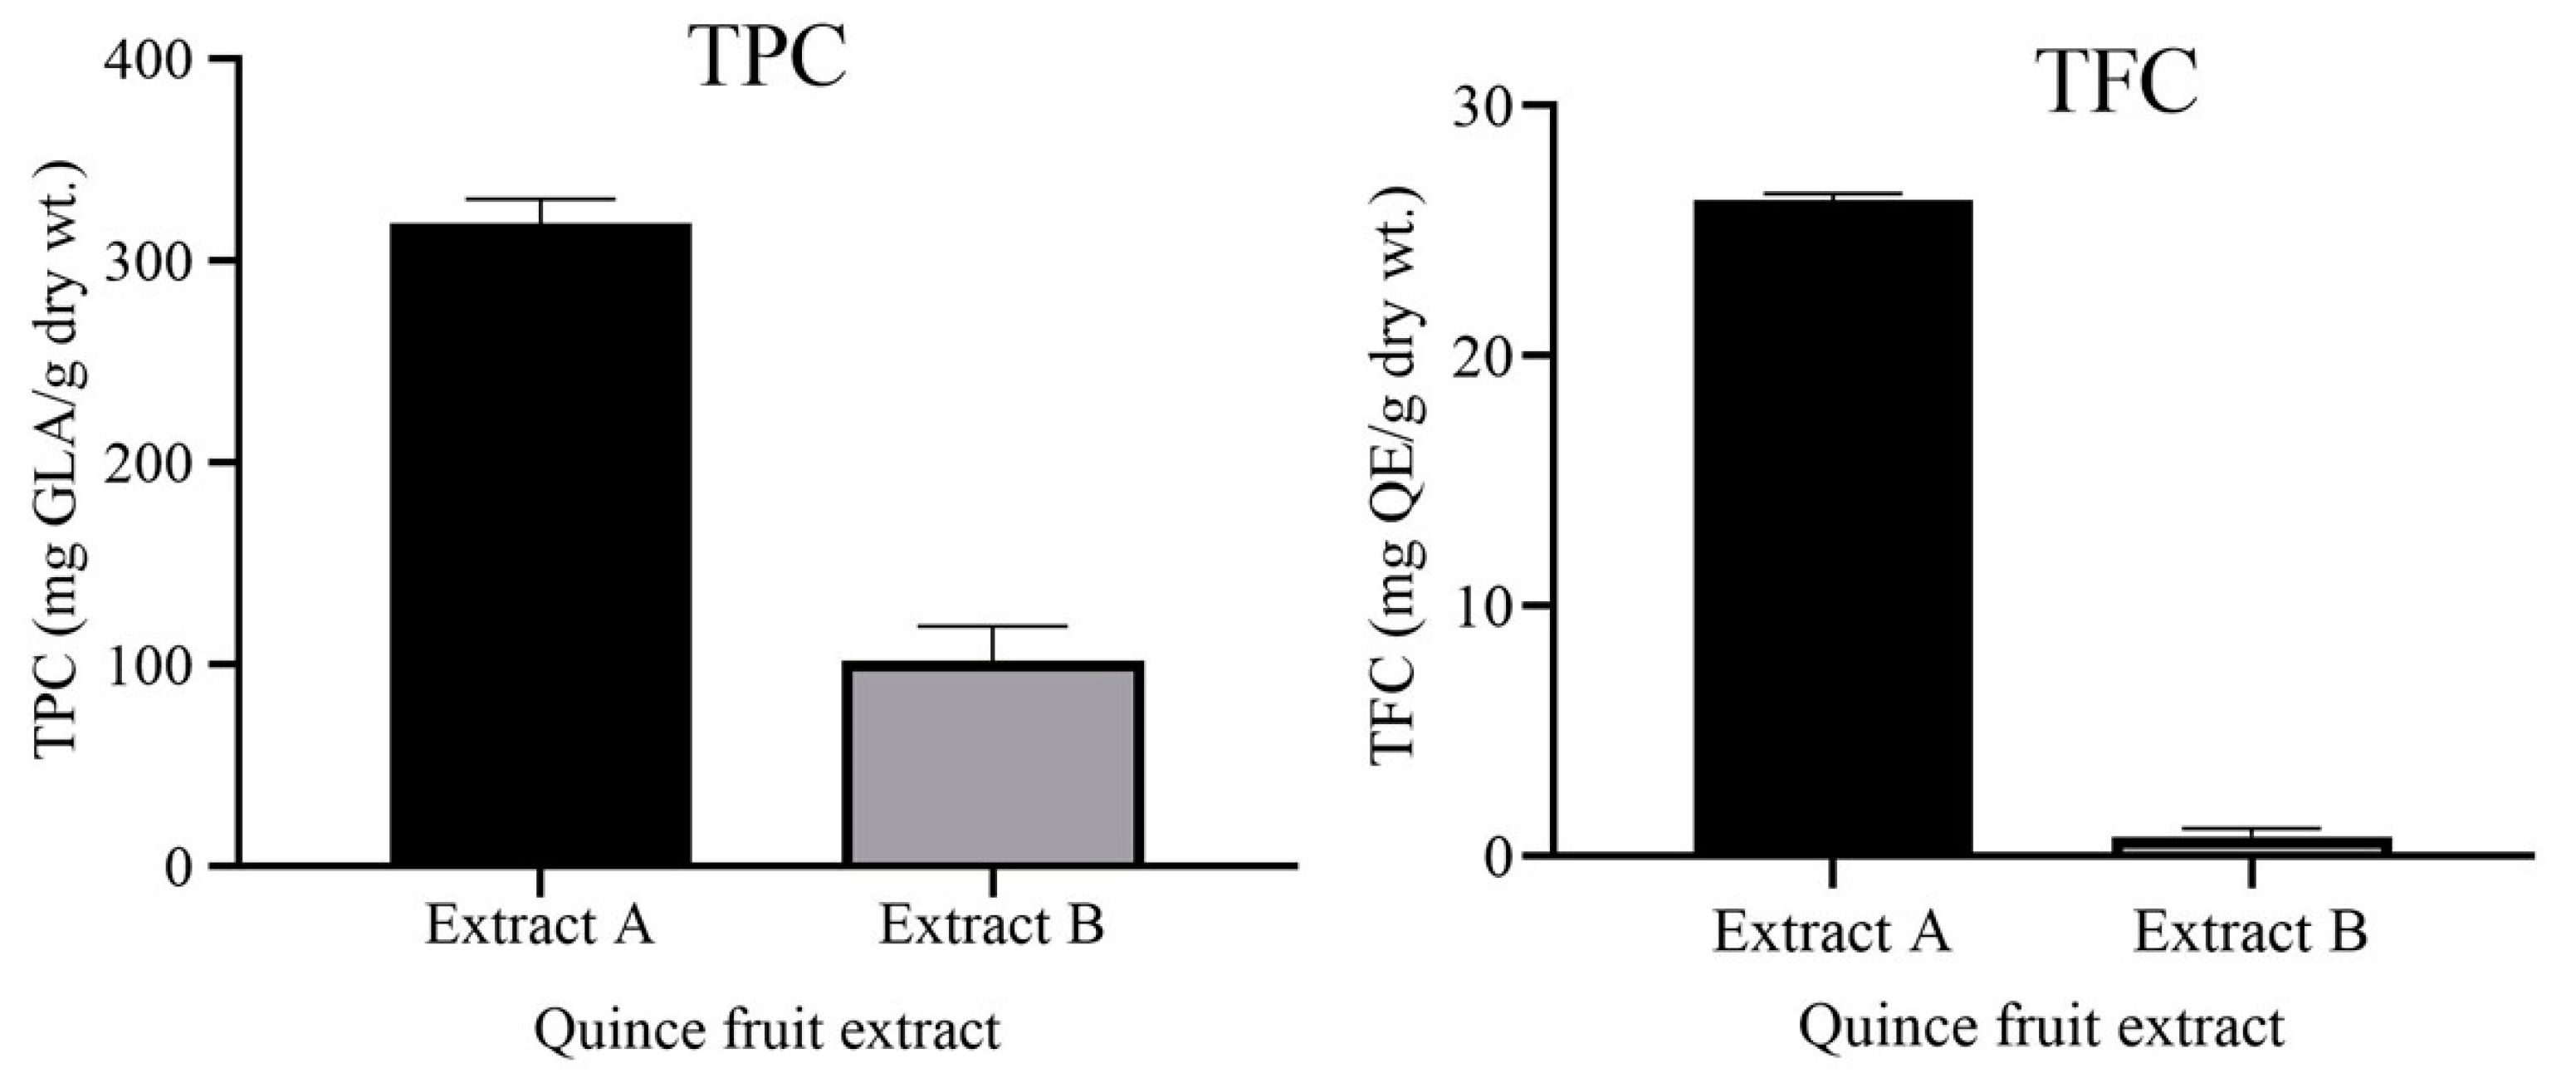
3.1. Total Phenolic Contents (TPC) and Total Flavonoid Contents (TFC)

In our experiment, the TPC and TFC have been measured for quince fruit purified and unpurified extracts. It is clear that the TPC of the purified extract (381.712 ± 0.529 mg GAE/g dry wt.) was three times greater than that of the unpurified extract (102.076 ± 0.607 mg GAE/g dry wt.). The phenolic contents of a fruit or plant indicate its phytochemical nature which plays a vital role in the prevention of different diseases such as cardiovascular diseases, diabetes, liver diseases, neurodegenerative diseases, cancer, etc. [34]. Wajdodi et al. (2013) reported the TPC of 13 different varieties of quince fruit ranging from 1709.4 mg/100 g dry wt. to 3436.6 mg/100 g dry wt. [20], which is lower than our quince purified extract. Similarly, the TFC of the purified extract (26.227 ± 0.348 mg QU/g dry wt.) seemed unexpectedly higher as compared to the unpurified extract (0.779 ± 0.074 mg QU/g dry wt.). On the other hand, the results indicate that the purification of the quince fruit extract by AB-8 microporous resins had a great impact on the retention of phenolic compounds and the removal of non-phenolic compounds, which increased the purity of the phytochemicals and provided a cost-effective and efficient source for purification. Figure 2 shows the TPC and TFC of the quince fruit’s purified and unpurified extract.

3.2. Antioxidant Activity Assay

Two different antioxidant assays, DPPH and ABTS, were performed to evaluate the antioxidant activity of the extracts. The purified extract exhibited strong antioxidant activity for both assays as compared to the unpurified extract (Table 1). In the DPPH assay, the purified extract was noticed with strong radical scavenging activity against the active radical and was multiple times more potent than the unpurified extract (EC50 = 3 µg/mL of purified extract and 62 µg/mL of unpurified extract). Regarding the ABTS assay, the extracts were observed to be less effective against the ABTS cation radical. However, in the ABTS assay, the purified extract demonstrated a lower EC50 value than the unpurified extract (EC50 = 36 µg/mL of purified extract and 69 µg/mL of unpurified extract), suggesting the high potency of the sample. In addition, the quince purified extract in the DPPH assay was observed with antioxidant potency closer to the positive control ascorbic acid (Table 1). Both the antioxidant assays performed in our experiment have different mechanisms. In the DPPH assay, the antioxidant compound donates a hydrogen atom which stabilizes the DPPH pre-existing radical and formats a stable diamagnetic molecule. Whereas, in the ABTS assay, the pre-generated cation of ABTS produced by different activators needs an electron transfer process to be scavenged [35]. Due to the different chemical nature and structure of these radicals, the affinity and kinetics of the reacting antioxidant compounds with the radicals may vary strongly, which can result in a significantly different scavenging potency [36]. In our experiment, the EC50 value of the DPPH assay was noticed to be lower than that of the ABTS assay, suggesting that the extracts’ bioactive contents were more stable and active in a methanolic or ethanolic medium. As the ABTS assay required an aqueous medium, possibly some bioactive compounds may be less soluble in the aqueous medium, which resulted in the low expression of the radical scavenging activity. Beyond the reacting medium, the results also indicate that most of the bioactive components involved in the antioxidant assay were hydrogen doners. However, in the ABTS assay, the radical needed an electron transfer process to be scavenged. The results also indicate that the purified extract had high free radical scavenging activity supporting the synergetic action of phenolic compound [37]. The IC50 values of the antioxidant assay for the purified extract, unpurified extract, and positive control are shown in Table 1.

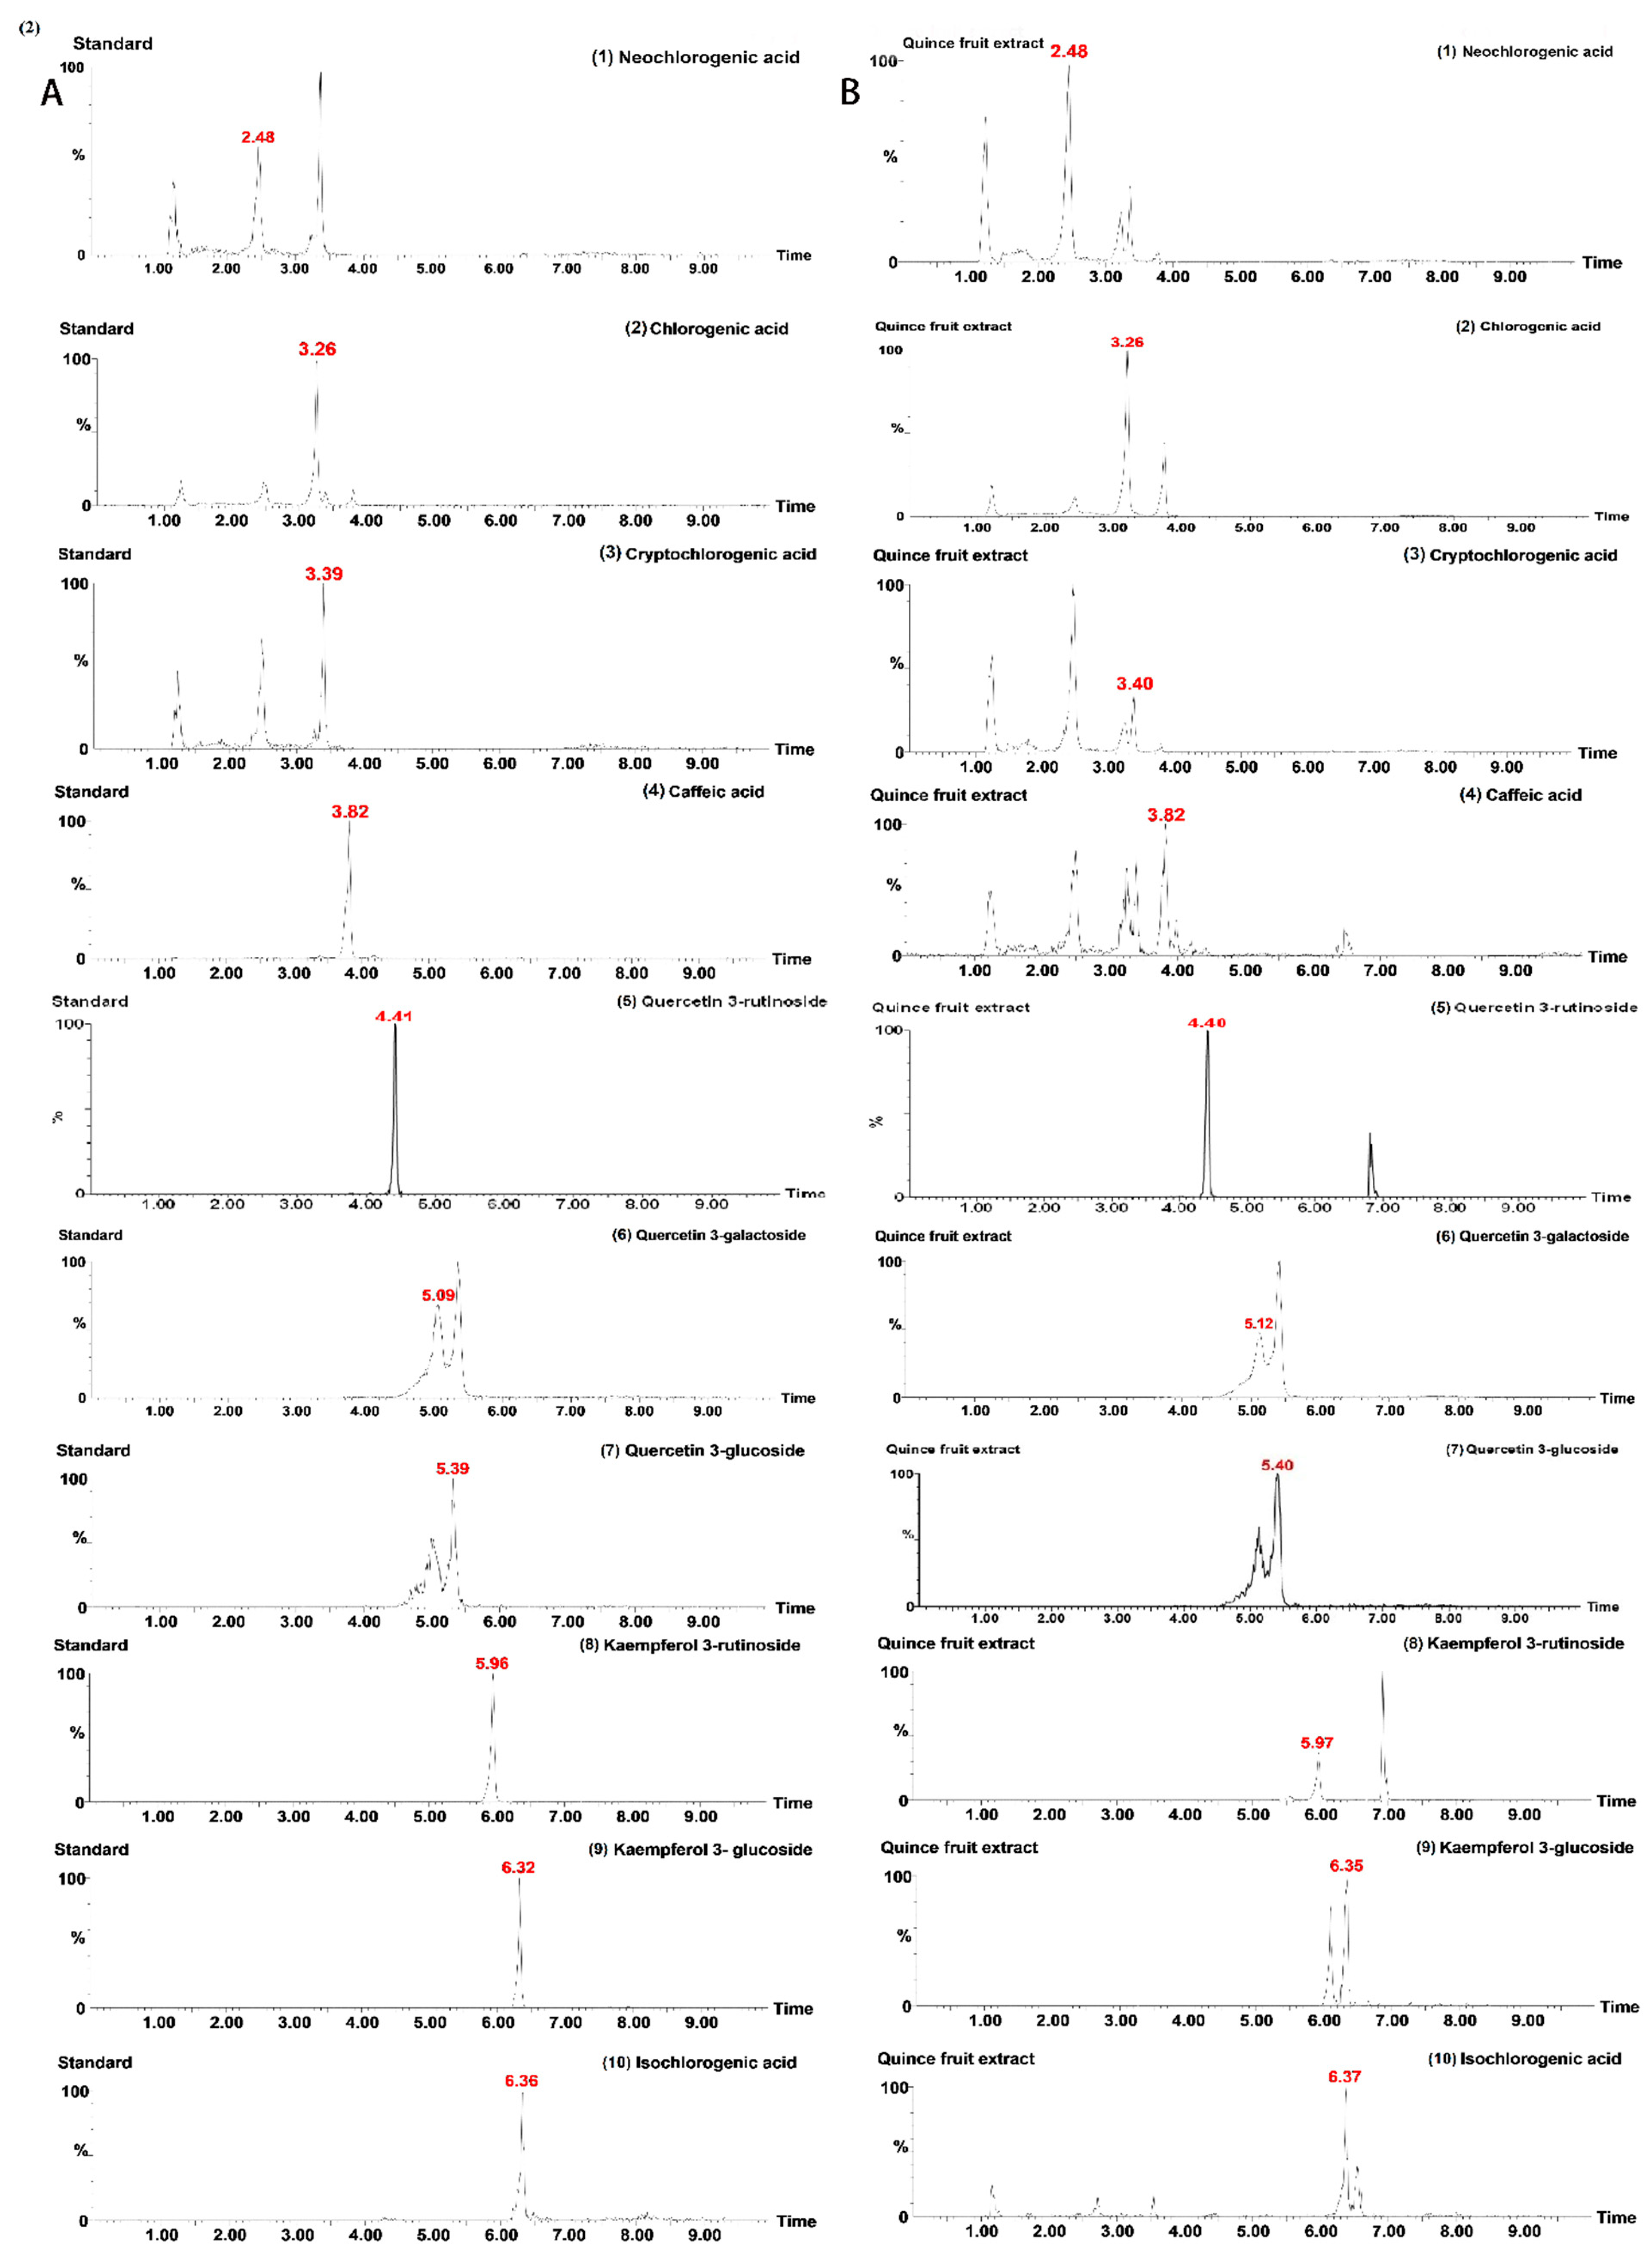
3.3. Optimization of the Chromatography and Mass Spectrometry System

To obtain the optimal mass spectroscopy condition, all the analytical standards were detected independently in the negative and positive ionization mode. All the compounds were found in a strong response to the negative ion mode compared to the positive ion mode, making them accurately and easily detectable in the fruit extract with low content levels. In the fruit extract, the identification of each peak was carried out by confirming the molecular ion or quasi-molecular ion of the compound. The characterization of the chemical structure of the 10 detected compounds was based on the data of their mass spectroscopy including the fragment ions, quasi-molecular ions, and the retention behaviors. Typical MRM chromatograms of the standards and quince fruit extract are shown in Figure 3.
For the qualitative analysis, the most abundant product ion was selected for better sensitivity, while the other representative ion fragment was selected for further identification of the analyzed compound. For example, the flavonoid glycosides quercetin 3-galactoside, quercetin 3-rutinoside, quercetin 3-glucoside, kaempferol 3-glucoside, and kaempferol 3-rutinoside could cause a glycosylic loss. On the other hand, hy-droxycinnamic acids such as chlorogenic acid and its derivatives are ester phytochemi-cals formed between quinic acid and caffeic acid. The compounds with the same quinic acid such as neochlorogenic acid, chlorogenic acid, and cryptochlorogenic acid usually do calve and lose the ester bond yielding m/z 190. 936 shows that the characteristic product ion corresponds to [quinic acid-H]. The 10 detected polyphenolic compounds in the quince fruit extract were quantified and identified under optimized UPLC-MS/MS conditions. Information regarding MS for each analyte is shown in Table 2, which includes the detail of product ions, quantitative ions, quasi-molecular ion, cV, and cE.
To achieve the most optimum UPLC separation in a short time for the assay, different UPLC conditions such as the chromatographic column, gradient program, and the mobile phases were optimized preliminarily. Two different analytical UPLC columns, the Acquity HSS T3 column (1.8 µm, 2.1 mm × 100 mm) and Acquity BEH C18 column (1.7 µm, 2.1 mm × 150 mm) were compared; no significant difference was noted in the separation process by both columns except that during separation by the BEH C18 column, the peaks produced seemed sharp as compared to the other. Thus, the final selected analytical column for the study was BEH C18. Additionally, different mobile phases such as the acetonitrile-water, methanol-water, and acetonitrile-acid aqueous solutions were tested to find an accurate mobile phase system for the experiment. Finally, 0.1% of aqueous formic acid solution (v/v) and acetonitrile were found with the best separation and ionization characteristics for the analysis and were selected as the mobile phases for the experiment.

3.4. Validation of the Method

According to our analysis, the linearity of each compound was studied at different level points that covered the concentration rate of each compound up to the estimated level in the fruit sample. For all the compounds, the linearity of the proposed method was significant with correlation coefficient (R2) values ˃0.996 (Table 3). As shown in Table 3, the estimated range of LOD and LOQ for the analyzed compounds was 0.11–1.65 ng/mL and 0.34–4.99 ng/mL, respectively. On the other hand, the precision of the method was studied for each compound as an intra-day and inter-day precession assay. The RSD percentage for the intra-day assay was <2.97%, while for inter-day assay it was <3.41%. For the repeatability assay, all the RSD values were observed to be less than 2.59 %. Similarly, in the stability assay, the RSD values of samples were not more than 3.97%. Furthermore, no significant degradation was noticed for each compound after a storage period of 24 h at room temperature. Each compound recovery was determined at three different spiked concentrations. The RSDs were observed at less than 2.25%, with the recovery values ranging between 95.6% and 99.95%. This method was found to be satisfactory through results obtained from precision, repeatability, stability, and accuracy, and thereby was further applied to investigate the polyphenolic nature of quince fruit purified and unpurified extracts. Table 4 and Table 5 show detailed results of the method validation.

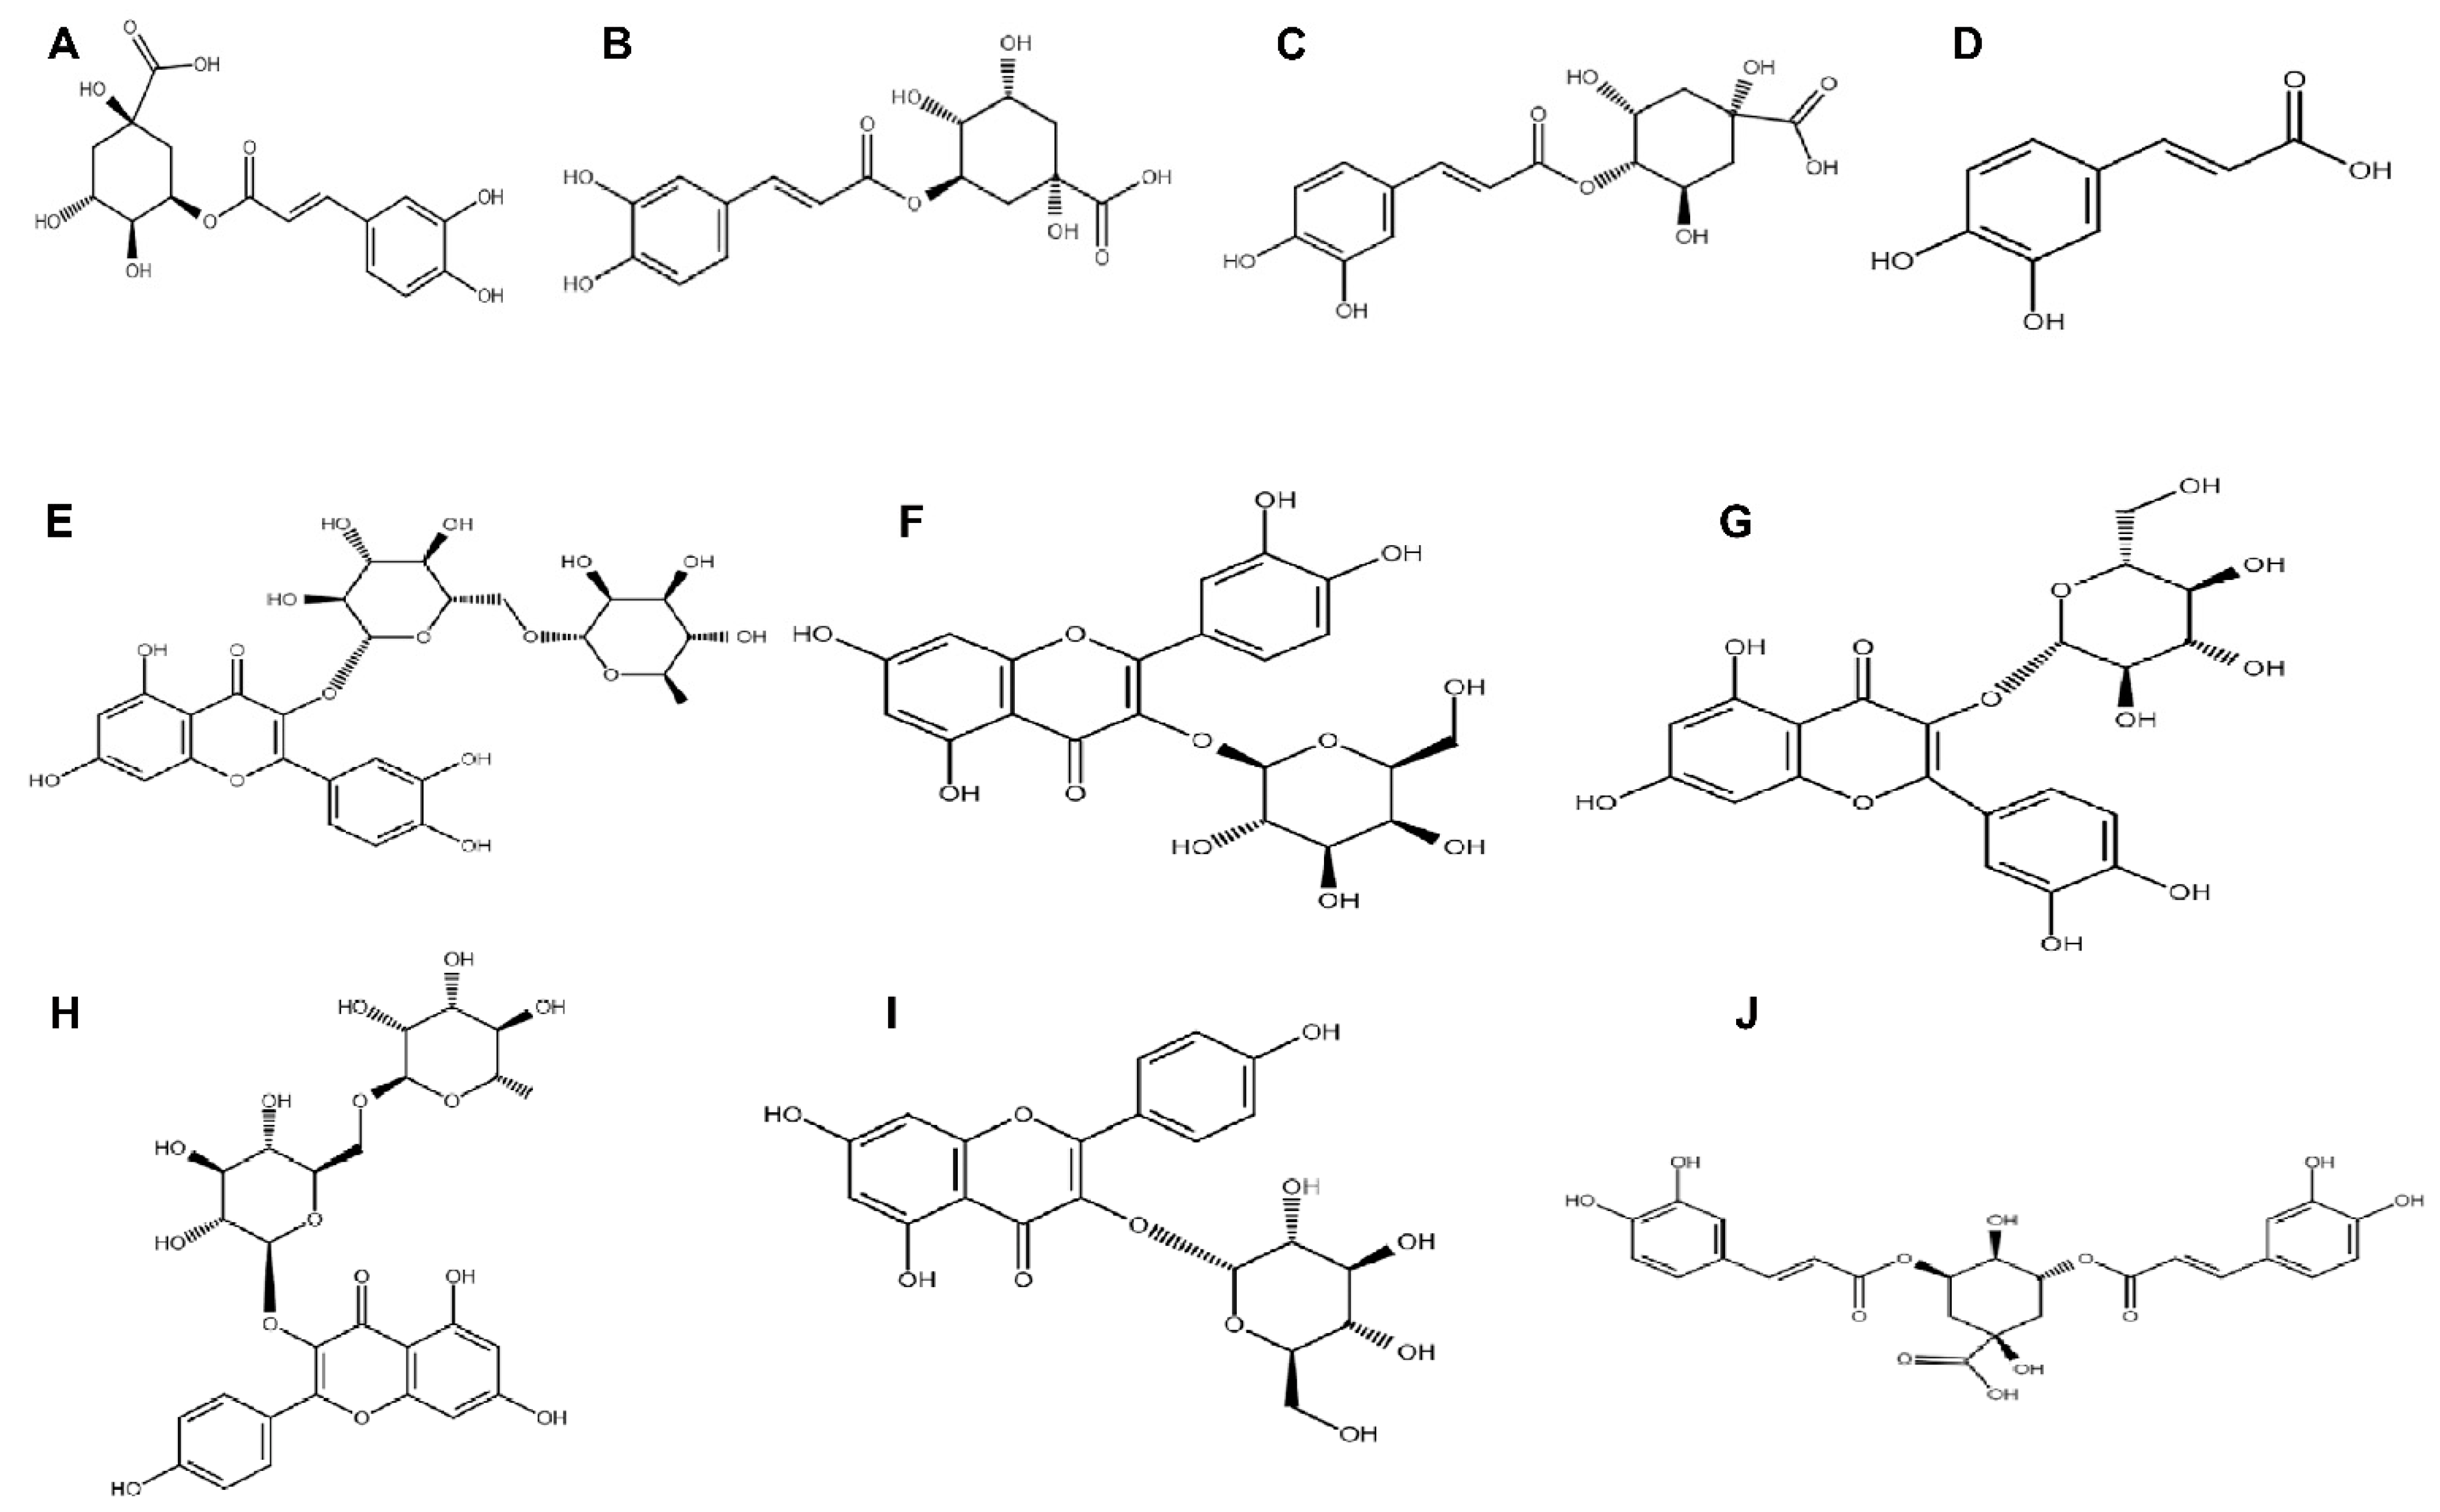
3.5. Quantitative Analysis of Quince Purified and Unpurified Extract

The newly developed analytical method was subsequently applied to determine the 10 constituents in the quince fruit extract. Three replicates of each quince fruit extract were loaded into the system for a quantitative analysis. The peak area was counted to calculate the contents of the 10 components in the extract. The retention time and peak shapes for all the analytes showed a good correlation between the standard solution and the real sample. Table 6 demonstrates that neochlorogenic acid, chlorogenic acid, cryptochlorogenic acid, caffeic acid, quercetin 3-rutinoside, quercetin 3-galactoside, quercetin 3-glucoside, kaempferol 3-rutinoside, kaempferol 3-glucoside, and isochlorogenic acid were detected successfully in the extract. The contents of each compound in the fruit purified extract and unpurified extract are shown in Table 6. Cryptochlorogenic acid was the most abundant constituent, accounting for 32.6% of the total contents. Next, quercetin 3-rutinoside and chlorogenic acid followed with 25.1% and 21.6%, respectively. Among the extracts, the purified extract was noted with high content concentrations of polyphenolic compounds (741.41 µg/mg dw for purified extract and 10.61 µg/mg dw for unpurified extract). The results presented in Table 7 indicate a remarkable difference between the phenolic acids and flavonoid contents in both extracts: the phenolic acids cover about 70% of the total polyphenolic compounds’ composition, while flavonoids cover the remaining 30%. As all the results showed that the purified extract is a rich and strong source of polyphenolic compounds, this supports that the AB-8 macroporous resins are an impressive source for polyphenol compound purification, which can be helpful in yielding a high quantity of polyphenolic compounds from quince fruit as a raw material. Additionally, the results of the current study may be beneficial for the utilization of the quince purified extract as a source of raw materials for phenolic acids and flavonoids.

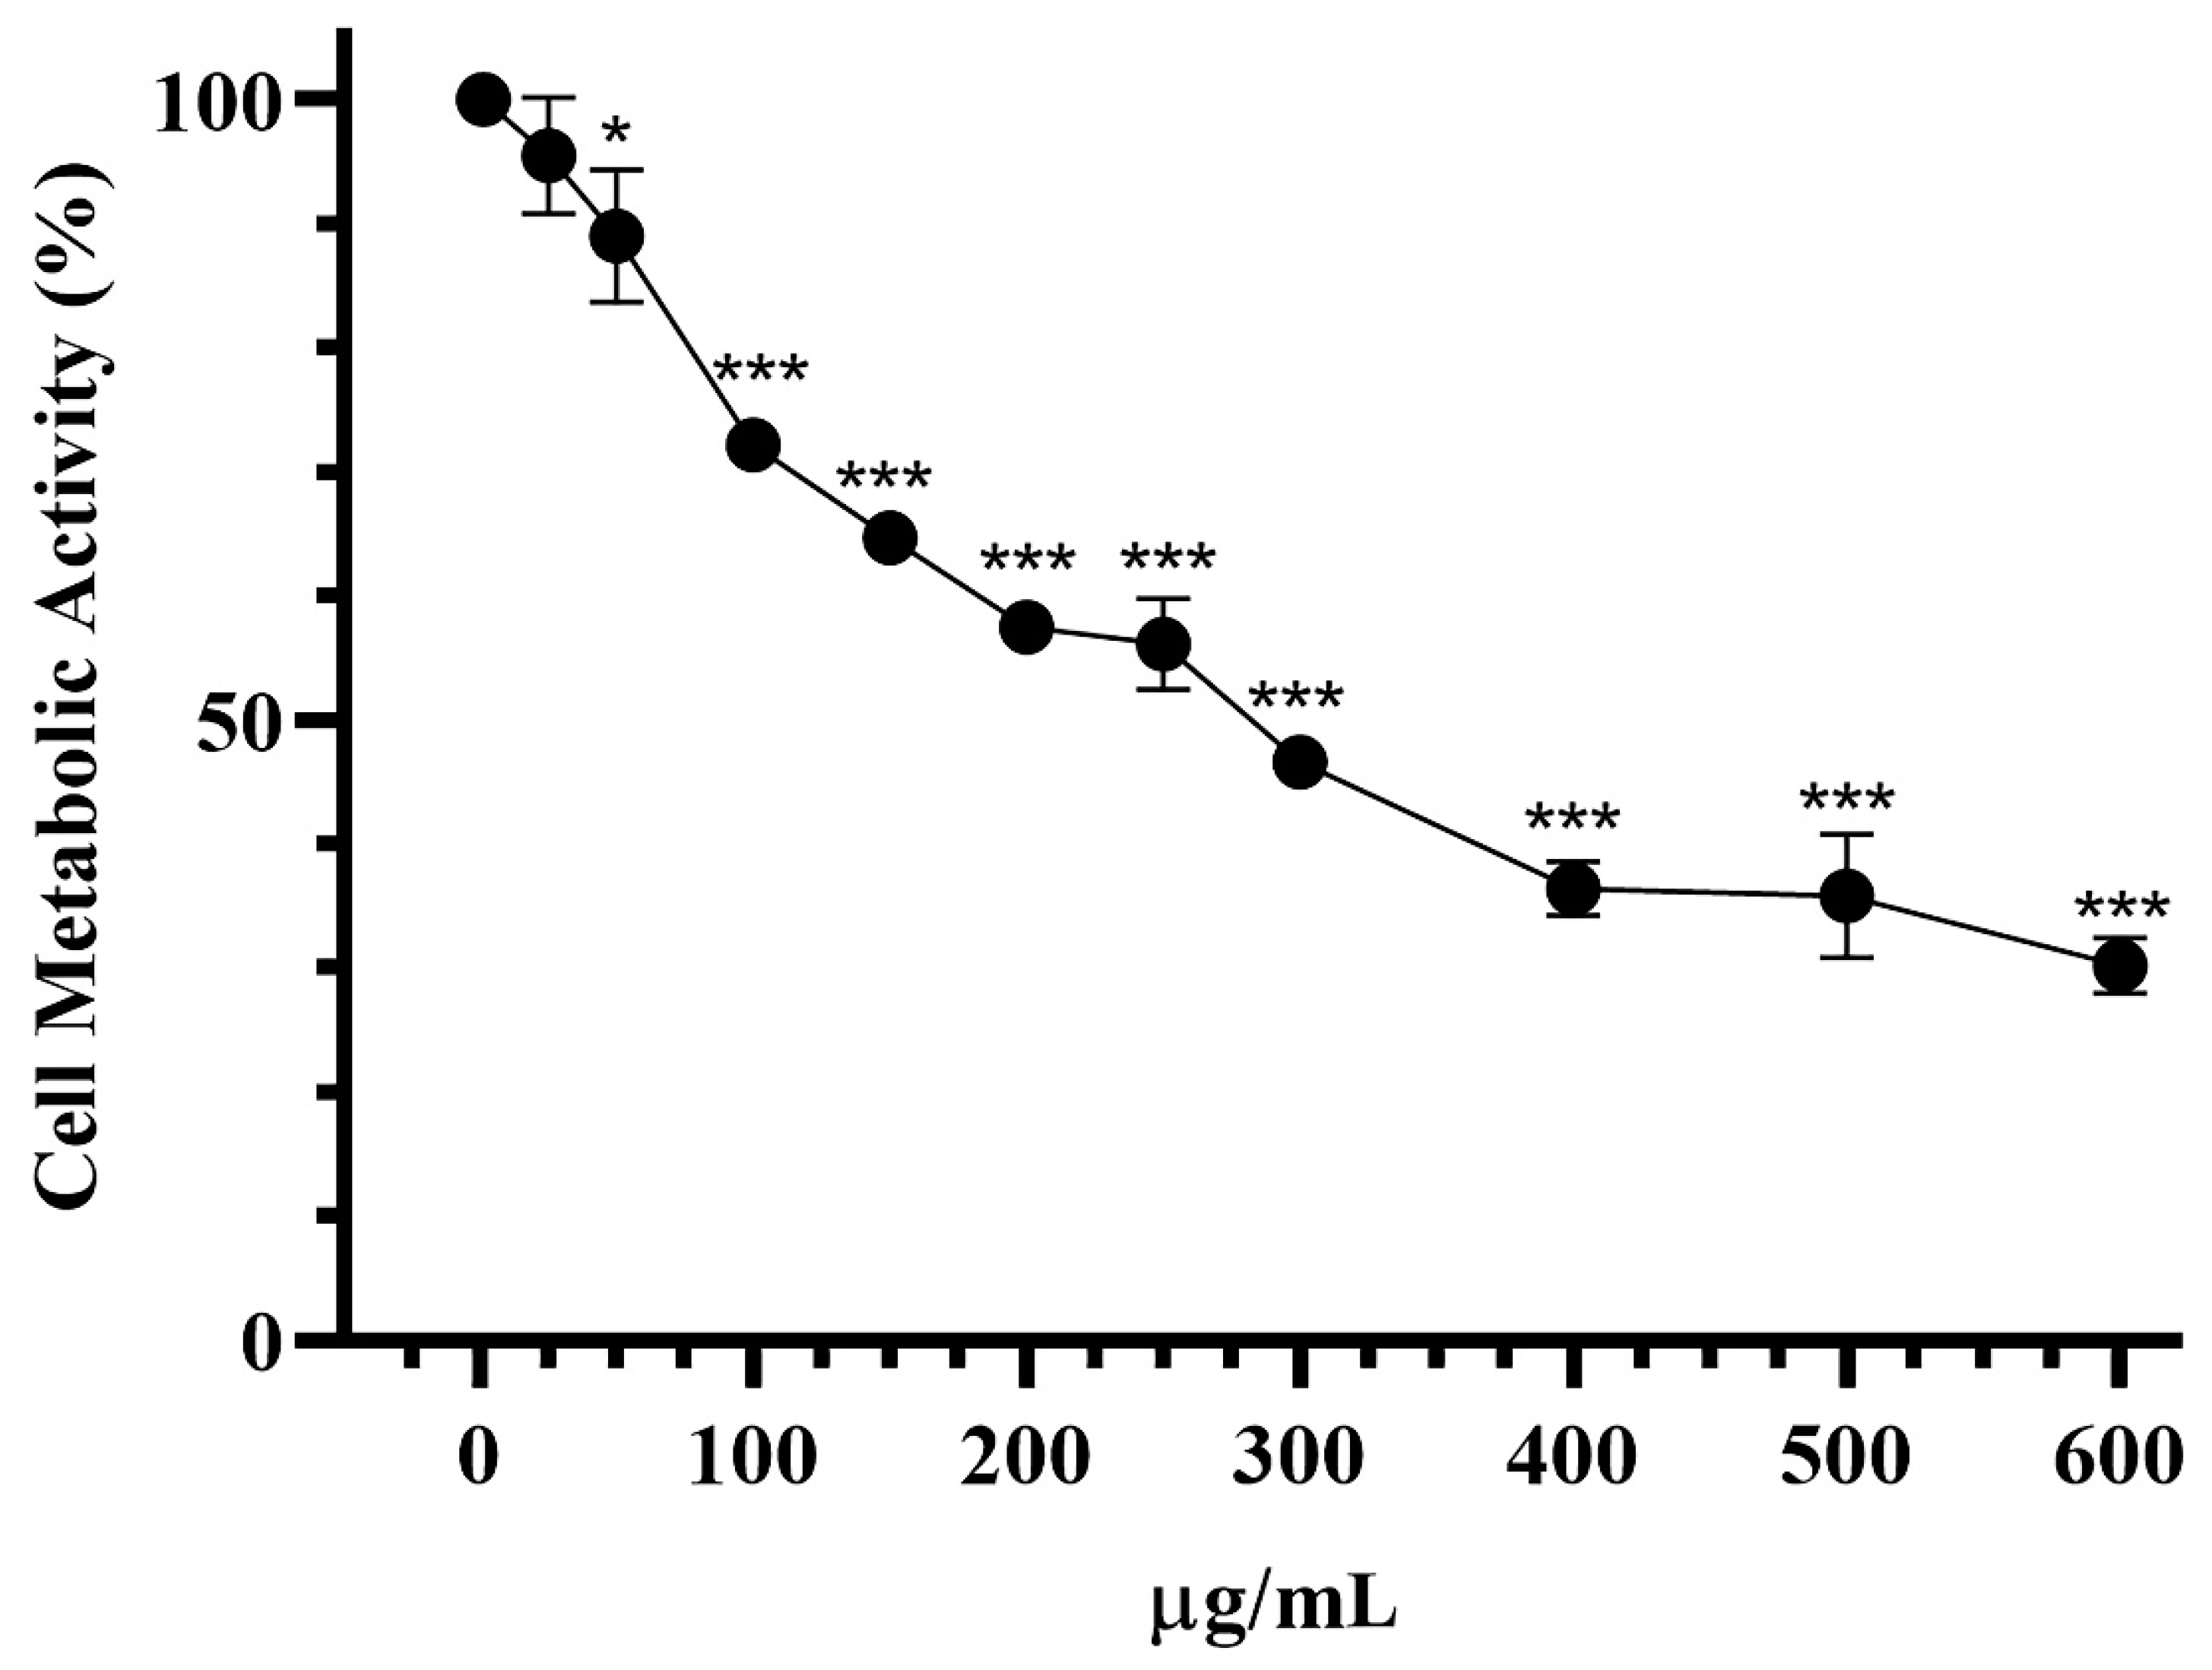
3.6. Effect on Cell Viability

To assess the effect of quince purified extract on the metabolic activity of 3T3-L1 cells, the cells were treated with increasing concentrations of the extract ranging from 25 to 600 µg/mL for 48 h after confluence. Figure 4 presents that the extract inhibited the viability of cells at a dose dependent manner. The extract was noticed to be cytotoxic at higher doses. The calculated IC50 for the extract was 145 µg/mL.

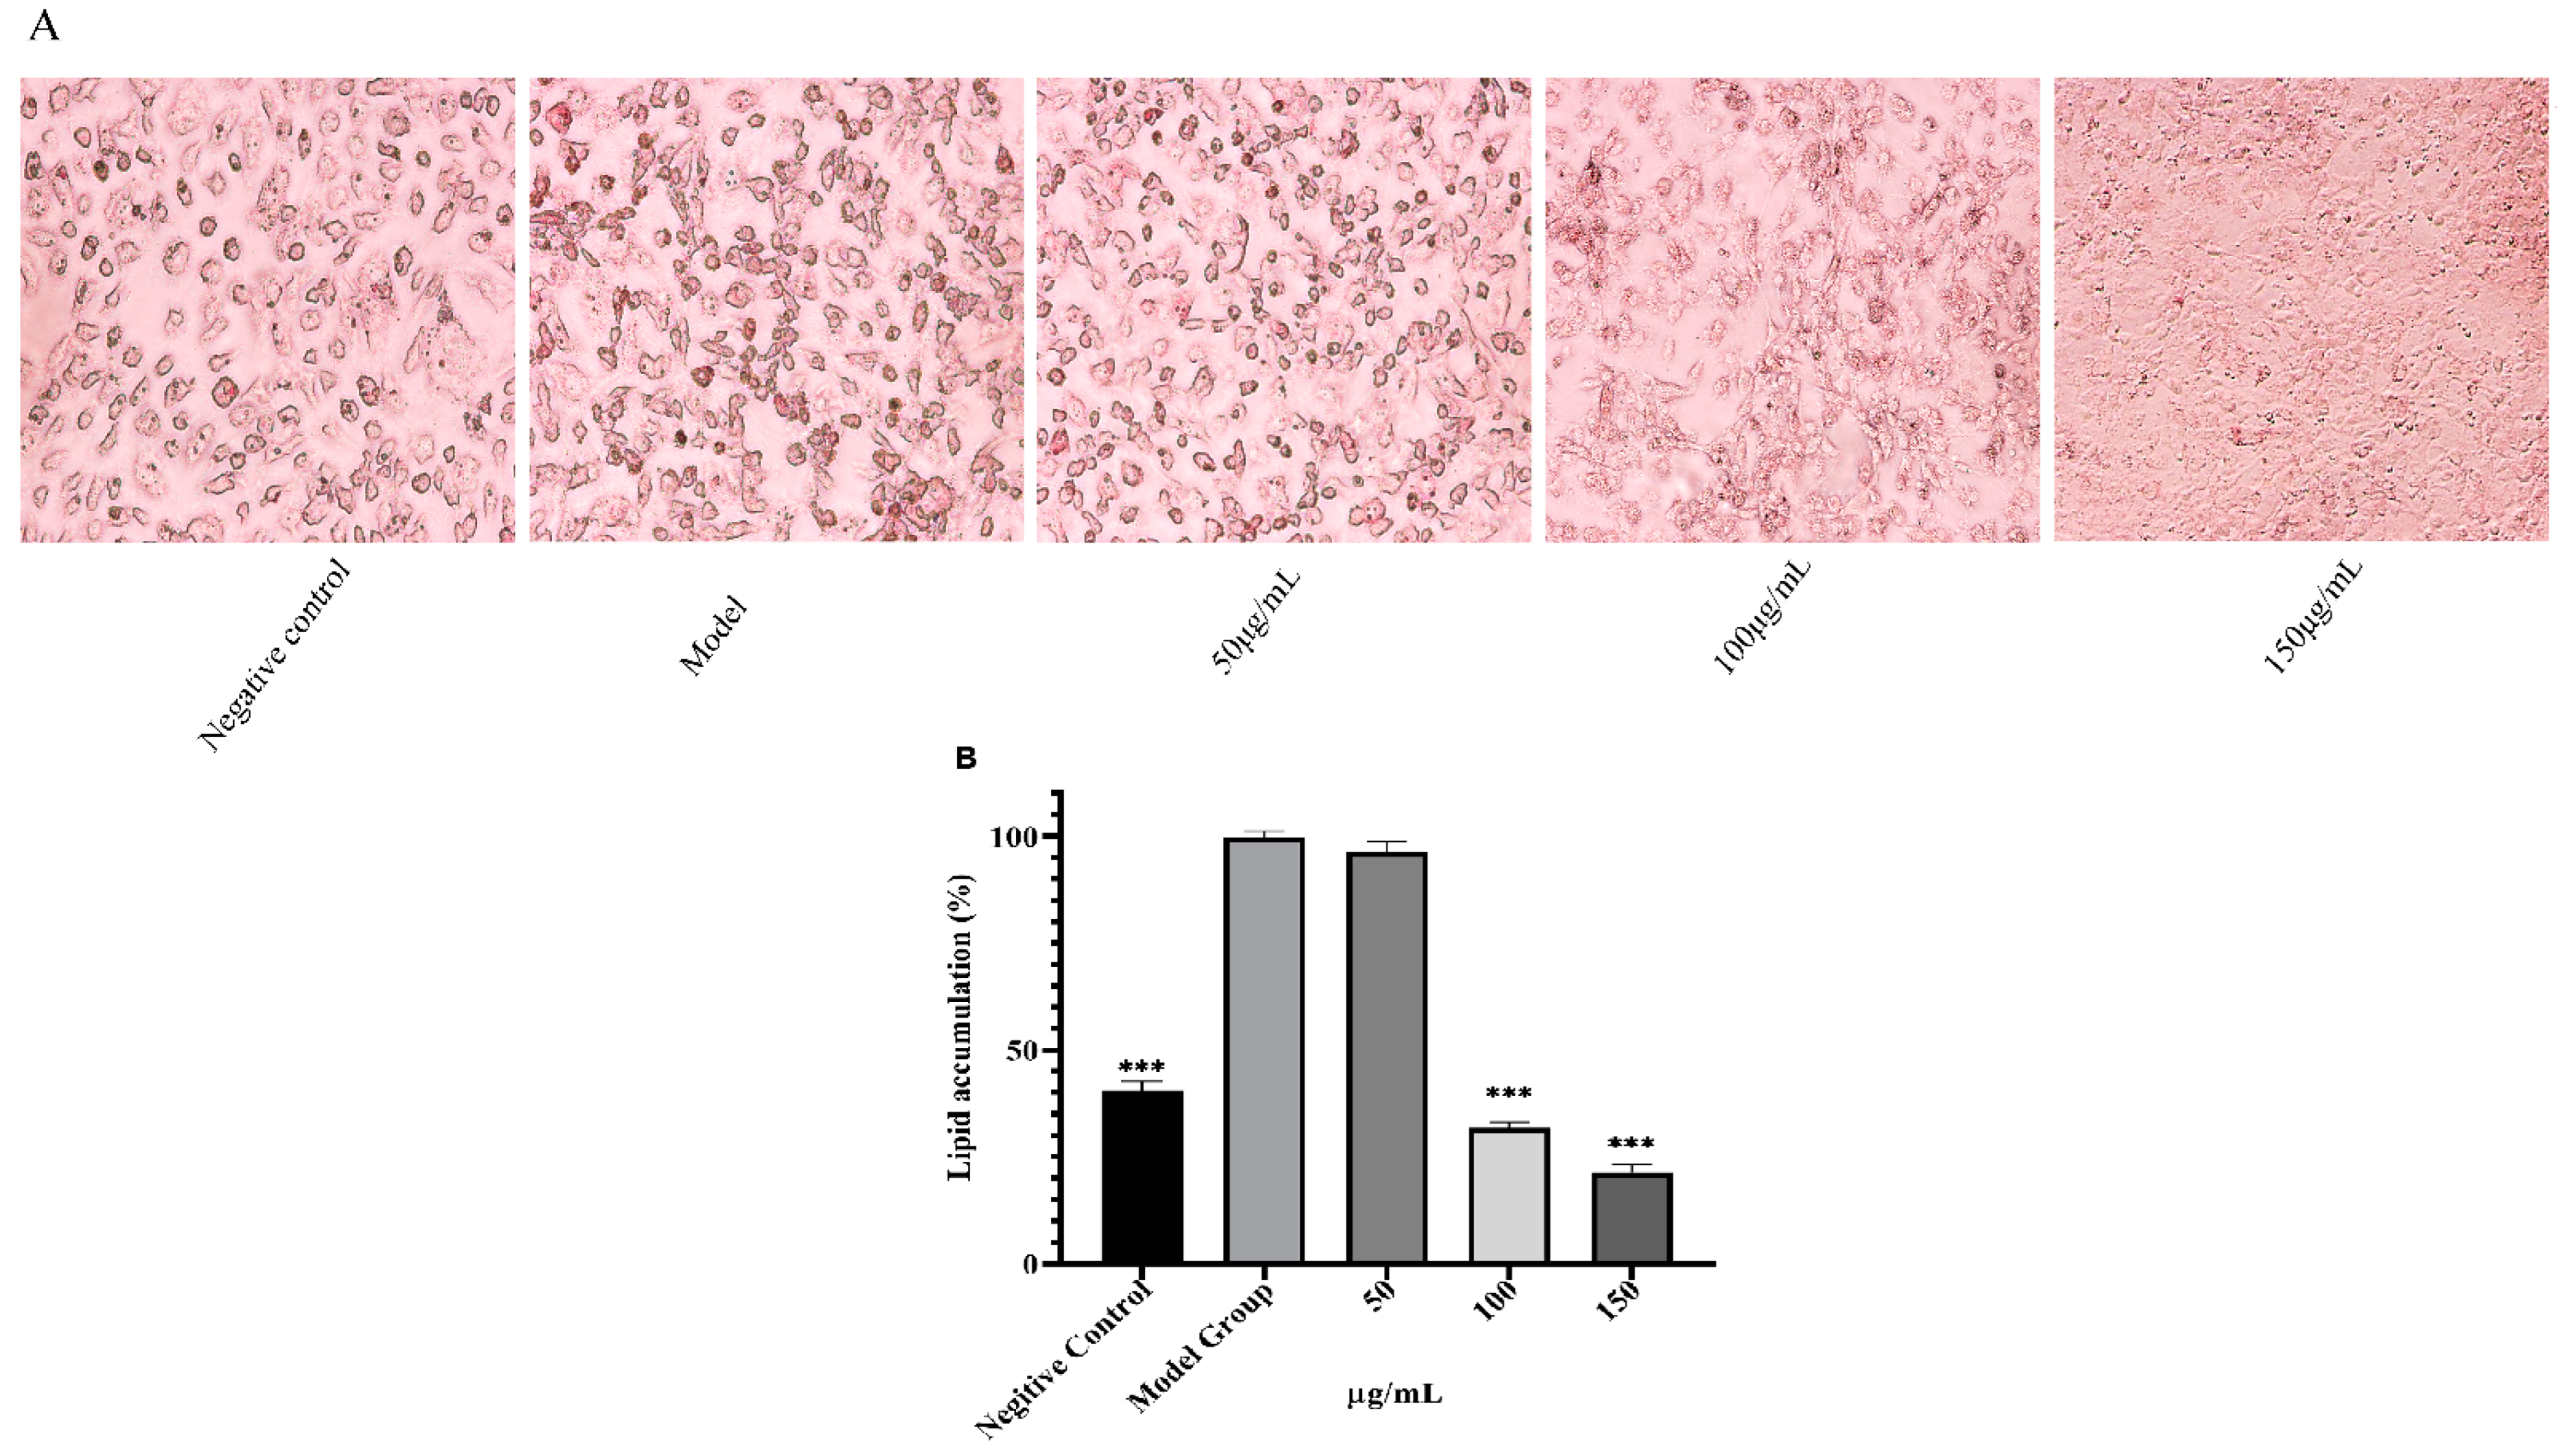
3.7. Effect on Adipogenesis

The effect of quince fruit purified extract on adipogenesis was investigated by the Oil red O staining method. All the groups were compared with the differentiated cells (model group). The lipid accumulation was primarily decreased in the treated groups (p < 0.001). The highest dose 150 µg/mL group was found with the least amount of accumulated lipids (Figure 5). The results of the collected isopropanol supernatant of the cells also indicated that quince fruit purified extract leads to a significant decrease in OD values (Figure 5). Specifically, the groups treated with 100 µg/mL and 150 µg/mL led to a decrease of 69% and 79%, respectively, compared to the model group.
The chemical investigation of quince fruit extract carried out in our study resulted in phenolic acids and flavonoid detection. These detected compounds are directly or indirectly involved in lipid metabolism [38,39,40]. Sudhakar et al. [41] reported that chlorogenic acid induces browning of white adipocytes, which increases lipid oxidation and decreases fat storage. Similarly, another study also reported the anti-adipogenic property of chlorogenic acid [42]. On the other hand, Jiang et al. [43] reported that quercetin 3-glucoside and quercetin 3-rutinoside inhibit adipogenesis promote lipid oxidation in a high-fat diet animal model. Jang, Y.S et al. [44] also investigated the effect of kaempferol 3-rutinoside isolated from Solidago virgaurea in 3T3-L1 cells for anti-adipogenic effect, which resulted in a 48.2% inhibitory effect on adipogenesis without cytotoxicity. Previous studies of our group reported the antihyperlipidemic effect of quince leaf and fruit extract in high-fat diet rat models [30,45]. From the previously reported studies, it is clear that most of the bioactive compounds detected in quince fruit extract are involved in inhibiting lipogenesis and may also be involved in lipolysis. Our study shows that quince fruit extract might have a robust antiadipogenic effect. Further studies are required to clarify the mechanism.

4. Conclusions

In the current study, a UPLC-MS/MS method was established for the simultaneous determination of 10 major polyphenolic compounds of quince fruit extract. The current method is validated as a sensitive, accurate, and rapid approach for the separation. The proposed analytical method was applied to the same extract, at two different purity levels. Moreover, the higher phenolic contacts of quince fruit extract result in higher antioxidant activity. In addition, the quince fruit purified extract also exerts anti-adipogenic effect in 3T3-L1 cells. This study suggests that the quince fruit can be a potential source of phenolic compound, that could serve as a strong antioxidant and antihyperlipidemic agent. However, further studies are required to perform on quince fruit’s extract in vivo pharmacological activities and its mechanism as an anti-adipogenic agent.

Author Contributions

Conceptualization, W.Z. and N.K.; Methodology, N.K.; Software, N.M.; Validation, M.N., N.K. and K.A.; Formal Analysis, J.S. and N.K.; Investigation, N.K. and Z.T.; Resources, W.Z.; Data Curation, N.M. and M.H.; Writing—Original Draft Preparation, N.K. and S.H.; Writing—Review and Editing, N.K. and W.Z.; Visualization, N.K.; Supervision, W.Z.; Project Administration, A.W.; Funding Acquisition, W.Z. All authors have read and agreed to the published version of the manuscript.

Funding

The study was supported by the National Natural Science Foundation of China (81660696); Natural Science Foundation of Xinjiang Uygur Autonomous Region (2019D01C217); “Fourteenth Five-Year Plan” Key Discipline Construction Project of Xinjiang Autonomous Region (2021); and the key Laboratory of Xinjiang Autonomous Region (XJDX1713).

Institutional Review Board Statement

Not applicable.

Informed Consent Statement

Not applicable.

Data Availability Statement

The supporting data of the study are available from the corresponding author upon request.

Acknowledgments

The lab facilities provided by the central research laboratory of Xinjiang Medical University are gratefully acknowledged.

Conflicts of Interest

The authors declare no conflict of interest.

References

  1. Piątczak, E.; Dybowska, M.; Płuciennik, E.; Kośla, K.; Kolniak-Ostek, J.; Kalinowska-Lis, U. Identification and accumulation of phenolic compounds in the leaves and bark of Salix alba (L.) and their biological potential. Biomolecules 2020, 10, 1391. [Google Scholar] [CrossRef]
  2. Pye, C.R.; Bertin, M.J.; Lokey, R.S.; Gerwick, W.H.; Linington, R.G. Retrospective analysis of natural products provides insights for future discovery trends. Proc. Natl. Acad. Sci. USA 2017, 114, 5601–5606. [Google Scholar] [CrossRef] [PubMed] [Green Version]
  3. Smith-Hall, C.; Larsen, H.O.; Pouliot, M. People, plants and health: A conceptual framework for assessing changes in medicinal plant consumption. J. Ethnobiol. Ethnomed. 2012, 8, 43. [Google Scholar] [CrossRef] [PubMed] [Green Version]
  4. Süntar, I. Importance of ethnopharmacological studies in drug discovery: Role of medicinal plants. Phytochem. Rev. 2020, 19, 1199–1209. [Google Scholar] [CrossRef]
  5. Zhang, J.; Onakpoya, I.J.; Posadzki, P.; Eddouks, M. The safety of herbal medicine: From prejudice to evidence. Altern. Med. 2015, 2015, 316706. [Google Scholar] [CrossRef] [Green Version]
  6. Ruhsam, M.; Hollingsworth, P.M. Authentication of Eleutherococcus and Rhodiola herbal supplement products in the United Kingdom. J. Pharm. Biomed. Anal. 2018, 149, 403–409. [Google Scholar] [CrossRef]
  7. Ji, S.; Fattahi, A.; Raffel, N.; Hoffmann, I.; Beckmann, M.W.; Dittrich, R.; Schrauder, M. Antioxidant effect of aqueous extract of four plants with therapeutic potential on gynecological diseases; Semen persicae, Leonurus cardiaca, Hedyotis diffusa, and Curcuma zedoaria. Eur. J. Med. Res. 2017, 22, 50. [Google Scholar] [CrossRef] [Green Version]
  8. Thomford, N.E.; Senthebane, D.A.; Rowe, A.; Munro, D.; Seele, P.; Maroyi, A.; Dzobo, K. Natural products for drug discovery in the 21st century: Innovations for novel drug discovery. Int. J. Mol. Sci. 2018, 19, 1578. [Google Scholar] [CrossRef] [Green Version]
  9. Kabera, J.N.; Semana, E.; Mussa, A.R.; He, X. Plant secondary metabolites: Biosynthesis, classification, function and pharmacological properties. J. Pharm. Pharmacol. 2014, 2, 377–392. [Google Scholar]
  10. Swallah, M.S.; Sun, H.; Affoh, R.; Fu, H.; Yu, H. Antioxidant Potential Overviews of Secondary Metabolites (Polyphenols) in Fruits. Int. J. Food Sci. 2020, 2020, 9081686. [Google Scholar] [CrossRef]
  11. Maaliki, D.; Shaito, A.A.; Pintus, G.; El-Yazbi, A.; Eid, A.H. Flavonoids in hypertension: A brief review of the underlying mechanisms. Curr. Opin. Pharmacol. 2019, 45, 57–65. [Google Scholar] [CrossRef] [PubMed]
  12. Bahramsoltani, R.; Ebrahimi, F.; Farzaei, M.H.; Baratpourmoghaddam, A.; Ahmadi, P.; Rostamiasrabadi, P.; Rasouli Amirabadi, A.H.; Rahimi, R. Dietary polyphenols for atherosclerosis: A comprehensive review and future perspectives. Crit. Rev. Food Sci. Nutr. 2019, 59, 114–132. [Google Scholar] [CrossRef] [PubMed]
  13. Ji, J.; Yang, X.; Flavel, M.; Shields, Z.P.-I.; Kitchen, B. Antioxidant and anti-diabetic functions of a polyphenol-rich sugarcane extract. J. Am. Coll. Nutr. 2019, 38, 670–680. [Google Scholar] [CrossRef] [PubMed]
  14. Selvakumar, P.; Badgeley, A.; Murphy, P.; Anwar, H.; Sharma, U.; Lawrence, K.; Lakshmikuttyamma, A. Flavonoids and other polyphenols act as epigenetic modifiers in breast cancer. Nutrients 2020, 12, 761. [Google Scholar] [CrossRef] [Green Version]
  15. Jeong, H.; Phan, A.N.; Choi, J.-W. Anti-cancer effects of polyphenolic compounds in epidermal growth factor receptor tyrosine kinase inhibitor-resistant non-small cell lung cancer. Pharmacogn. Mag. 2017, 13, 595. [Google Scholar]
  16. Rahaiee, S.; Assadpour, E.; Esfanjani, A.F.; Silva, A.S.; Jafari, S.M. Application of nano/microencapsulated phenolic compounds against cancer. Adv. Colloid Interface Sci. 2020, 279, 102153. [Google Scholar] [CrossRef]
  17. Abdollahi, H. A review on history, domestication and germplasm collections of quince (Cydonia oblonga Mill.) in the World. Genet. Resour. Crop Evol. 2019, 66, 1041–1058. [Google Scholar] [CrossRef]
  18. Ashraf, M.U.; Muhammad, G.; Hussain, M.A.; Bukhari, S.N. Cydonia oblonga M., A Medicinal Plant Rich in Phytonutrients for Pharmaceuticals. Front. Pharm. 2016, 7, 163. [Google Scholar] [CrossRef] [Green Version]
  19. Silva, B.M.; Andrade, P.B.; Ferreres, F.; Domingues, A.L.; Seabra, R.M.; Ferreira, M.A. Phenolic profile of quince fruit (Cydonia oblonga Miller)(pulp and peel). J. Agric. Food Chem. 2002, 50, 4615–4618. [Google Scholar] [CrossRef]
  20. Wojdyło, A.; Oszmiański, J.; Bielicki, P. Polyphenolic composition, antioxidant activity, and polyphenol oxidase (PPO) activity of quince (Cydonia oblonga Miller) varieties. J. Agric. Food Chem. 2013, 61, 2762–2772. [Google Scholar] [CrossRef]
  21. Minaiyan, M.; Ghannadi, A.; Etemad, M.; Mahzouni, P. A study of the effects of Cydonia oblonga Miller (Quince) on TNBS-induced ulcerative colitis in rats. Res. Pharm. Sci. 2012, 7, 103. [Google Scholar] [PubMed]
  22. Zhou, W.; Abdurahman, A.; Umar, A.; Iskander, G.; Abdusalam, E.; Berké, B.; Bégaud, B.; Moore, N. Effects of Cydonia oblonga Miller extracts on blood hemostasis, coagulation and fibrinolysis in mice, and experimental thrombosis in rats. J. Ethnopharmacol. 2014, 154, 163–169. [Google Scholar] [CrossRef] [PubMed]
  23. Aliasl, F.; Toliyat, T.; Mohammadi, A.; Minaee, B.; Samadi, N.; Aliasl, J.; Sadeghpour, O. Medicinal properties of Cydonia oblonga mill fruit (pulp and peel) in Iranian traditional medicine and modern phytothrapy. Tradit. Integr. Med. 2016, 1, 122–128. [Google Scholar]
  24. Pacifico, S.; Gallicchio, M.; Fiorentino, A.; Fischer, A.; Meyer, U.; Stintzing, F.C. Antioxidant properties and cytotoxic effects on human cancer cell lines of aqueous fermented and lipophilic quince (Cydonia oblonga Mill.) preparations. Food Chem. Toxicol. 2012, 50, 4130–4135. [Google Scholar] [CrossRef]
  25. Essafi-Benkhadir, K.; Refai, A.; Riahi, I.; Fattouch, S.; Karoui, H.; Essafi, M. Quince (Cydonia oblonga Miller) peel polyphenols modulate LPS-induced inflammation in human THP-1-derived macrophages through NF-κB, p38MAPK and Akt inhibition. Biochem. Biophys. Res. Commun. 2012, 418, 180–185. [Google Scholar] [CrossRef]
  26. Adiban, H.; Shirazi, F.H.; Gholami, S.; Kamalinejad, M.; Hosseini, S.H.; Noubarani, M.; Eskandari, M.R. Chemopreventive effect of quince (Cydonia oblonga Mill.) fruit extract on hepatocellular carcinoma induced by diethylnitrosamine in rats. Int. Pharm. Acta 2019, 2, e2. [Google Scholar]
  27. Parvan, M.; Sajjadi, S.-E.; Minaiyan, M. Protective effect of two extracts of Cydonia oblonga Miller (quince) fruits on gastric ulcer induced by indomethacin in rats. Int. J. Prev. Med. 2017, 8, 58. [Google Scholar]
  28. Aslam, M.; Sial, A.A. Effect of hydroalcoholic extract of cydonia oblonga miller (Quince) on sexual behaviour of wistar rats. Adv. Pharmacol. Sci. 2014, 2014, 282698. [Google Scholar] [CrossRef] [Green Version]
  29. Zhou, W.; Abdusalam, E.; Abliz, P.; Reyim, N.; Tian, S.; Aji, Q.; Issak, M.; Iskandar, G.; Moore, N.; Umar, A. Effect of Cydonia oblonga Mill. fruit and leaf extracts on blood pressure and blood rheology in renal hypertensive rats. J. Ethnopharmacol. 2014, 152, 464–469. [Google Scholar] [CrossRef]
  30. Umar, A.; Iskandar, G.; Aikemu, A.; Yiming, W.; Zhou, W.; Berké, B.; Begaud, B.; Moore, N. Effects of Cydonia oblonga Miller leaf and fruit flavonoids on blood lipids and anti-oxydant potential in hyperlipidemia rats. J. Ethnopharmacol. 2015, 169, 239–243. [Google Scholar] [CrossRef]
  31. Di Sotto, A.; Vecchiato, M.; Abete, L.; Toniolo, C.; Giusti, A.M.; Mannina, L.; Locatelli, M.; Nicoletti, M.; Di Giacomo, S. Capsicum annuum L. var. Cornetto di Pontecorvo PDO: Polyphenolic profile and in vitro biological activities. J. Funct. Foods 2018, 40, 679–691. [Google Scholar] [CrossRef]
  32. Di Sotto, A.; Durazzi, F.; Sarpietro, M.G.; Mazzanti, G. Antimutagenic and antioxidant activities of some bioflavours from wine. Food Chem. Toxicol. 2013, 60, 141–146. [Google Scholar] [CrossRef] [PubMed]
  33. Kraus, N.A.; Ehebauer, F.; Zapp, B.; Rudolphi, B.; Kraus, B.J.; Kraus, D. Quantitative assessment of adipocyte differentiation in cell culture. Adipocyte 2016, 5, 351–358. [Google Scholar] [CrossRef] [Green Version]
  34. Arora, I.; Sharma, M.; Tollefsbol, T.O. Combinatorial epigenetics impact of polyphenols and phytochemicals in cancer prevention and therapy. Int. J. Mol. Sci. 2019, 20, 4567. [Google Scholar] [CrossRef] [PubMed] [Green Version]
  35. Li, X.; Lin, J.; Gao, Y.; Han, W.; Chen, D. Antioxidant activity and mechanism of Rhizoma Cimicifugae. Chem. Cent. J. 2012, 6, 140. [Google Scholar] [CrossRef] [PubMed] [Green Version]
  36. Ak, T.; Gülçin, İ. Antioxidant and radical scavenging properties of curcumin. Chem.-Biol. Interact. 2008, 174, 27–37. [Google Scholar] [CrossRef]
  37. Wojdyło, A.; Oszmiański, J.; Czemerys, R. Antioxidant activity and phenolic compounds in 32 selected herbs. Food Chem. 2007, 105, 940–949. [Google Scholar] [CrossRef]
  38. Podsędek, A.; Zakłos-Szyda, M.; Polka, D.; Sosnowska, D. Effects of Viburnum opulus fruit extracts on adipogenesis of 3T3-L1 cells and lipase activity. J. Funct. Foods 2020, 73, 104111. [Google Scholar] [CrossRef]
  39. Hadrich, F.; Sayadi, S. Apigetrin inhibits adipogenesis in 3T3-L1 cells by downregulating PPARγ and CEBP-α. Lipids Health Dis. 2018, 17, 95. [Google Scholar] [CrossRef] [Green Version]
  40. Aranaz, P.; Navarro-Herrera, D.; Zabala, M.; Miguéliz, I.; Romo-Hualde, A.; López-Yoldi, M.; Martínez, J.A.; Vizmanos, J.L.; Milagro, F.I.; González-Navarro, C.J. Phenolic compounds inhibit 3T3-L1 adipogenesis depending on the stage of differentiation and their binding affinity to PPARγ. Molecules 2019, 24, 1045. [Google Scholar] [CrossRef] [Green Version]
  41. Sudhakar, M.; Sasikumar, S.J.; Silambanan, S.; Natarajan, D.; Ramakrishnan, R.; Nair, A.J.; Kiran, M.S. Chlorogenic acid promotes development of brown adipocyte-like phenotype in 3T3-L1 adipocytes. J. Funct. Foods 2020, 74, 104161. [Google Scholar] [CrossRef]
  42. Kong, L.; Xu, M.; Qiu, Y.; Liao, M.; Zhang, Q.; Yang, L.; Zheng, G. Chlorogenic acid and caffeine combination attenuates adipogenesis by regulating fat metabolism and inhibiting adipocyte differentiation in 3T3-L1 cells. J. Food Biochem. 2021, 45, e13795. [Google Scholar] [CrossRef] [PubMed]
  43. Jiang, H.; Horiuchi, Y.; Hironao, K.-y.; Kitakaze, T.; Yamashita, Y.; Ashida, H. Prevention effect of quercetin and its glycosides on obesity and hyperglycemia through activating AMPKα in high-fat diet-fed ICR mice. J. Clin. Biochem. Nutr. 2020, 67, 20–47. [Google Scholar] [CrossRef] [PubMed]
  44. Jang, Y.S.; Wang, Z.; Lee, J.-M.; Lee, J.-Y.; Lim, S.S. Screening of Korean natural products for anti-adipogenesis properties and isolation of kaempferol-3-O-rutinoside as a potent anti-adipogenetic compound from Solidago virgaurea. Molecules 2016, 21, 226. [Google Scholar] [CrossRef] [Green Version]
  45. Abliz, A.; Aji, Q.; Abdusalam, E.; Sun, X.; Abdurahman, A.; Zhou, W.; Moore, N.; Umar, A. Effect of Cydonia oblonga Mill. leaf extract on serum lipids and liver function in a rat model of hyperlipidaemia. J. Ethnopharmacol. 2014, 151, 970–974. [Google Scholar] [CrossRef]
Figure 1. Chemical structure of the analytical standards: (A) Neochlorogenic acid, (B) Chlorogenic acid, (C) Cryptochlorogenic acid, (D) Caffeic acid, (E) Quercetin 3-rutinoside, (F) Quercetin 3-galactoside, (G) Quercetin 3-glucoside, (H) Kaempferol 3-rutinoside, (I) Kaempferol 3-glucoside, and (J) Isochlorogenic acid.
Separations 09 00167 g001
Figure 2. Total phenolic contents (TPC) and total flavonoid contents (TFC) of quince fruit extract. Purified extract (extract A), unpurified extract (extract B).
Separations 09 00167 g002
Figure 3. Typical MRM chromatograms of (A) standards, (B) extract: (1) Neochlorogenic acid, (2) Chlorogenic acid, (3) Cryptochlorogenic acid, (4) Caffeic acid, (5) Quercetin 3-rutinoside, (6) Quercetin 3-galactoside, (7) Quercetin 3-glucoside, (8) Kaempferol 3-rutinoside, (9) Kaempferol 3-glucoside, and (10) Isochlorogenic acid.
Separations 09 00167 g003
Figure 4. Influence of quince purified extract on 3T3-L1 cell metabolic activity determined by the PrestoBlue HS assay after 48 h exposure to the extract; control cells were not exposed to any compound; values are means ± standard deviations from at least three independent experiments, n ≥ 12; statistical significance was calculated versus control cells (untreated), * p ≤ 0.05, *** p ≤ 0.001.
Separations 09 00167 g004
Figure 5. Cell lipid droplets stained with Oil red O were visualized under a microscope (A). Percentage (%) of accumulated lipid droplets in 3T3-L1 cells stained with Oil red O was observed on the 8th day of differentiation compared with the model group (B). The control cells were not exposed to any compound. The model cells were not treated with the extract; the values are means ± standard deviations from at least three independent experiments, n ≥ 12; the statistical significance was calculated versus the control cells *** p ≤ 0.001 vs. model group.
Separations 09 00167 g005
Table 1. In vitro antioxidant activities in DPPH and ABTS assays of quince purified and unpurified extract.
Antioxidant AssayPurified ExtractUnpurified ExtractPositive Control
DPPH # scavenging activity3.316 ± 0.34 ***62.32 ± 0.20 ***1.189 ± 0.13
ABTS # scavenging activity36.38 ± 0.42 ***69.59 ± 0.37 ***15.74 ± 0.21
Ascorbic acid is used as positive control. The values are means of three replicates ± SD; # EC50 the concentration of sample (µg/mL) showing 50% of maximal radical scavenging activity. *** p < 0.001 vs. positive control group.
Table 2. Retention time and related MS information of 10 compounds detected on UPLC-MS/MS.
No.AnalytesRT a (min)Ion ModePrecursor Ion (m/z) bProduct Ions (m/z) bCone Voltage (cV)Collision Energy (cE)
1Neochlorogenic acid2.48ESI-353.096190.93, 134.9583818
2Chlorogenic acid3.26ESI-353.096190.93, 134.9583832
3Cryptochlorogenic acid3.39ESI-353191, 1354025
4Caffeic acid3.82ESI-179135, 1075420
5Quercetin 3-rutinoside4.40ESI-609271,3006665
6Quercetin 3-galactoside5.09ESI-463.16299.988, 270.909828
7Quercetin 3-glucoside5.39ESI-463271, 300836
8Kaempferol 3-rutinoside5.96ESI-593.149254.955, 284.8857866
9Kaempferol 3-glucoside6.32ESI-477255, 2485838
10Isochlorogenic acid6.36ESI-515353, 1915015
a Retention times. b Mass to charge ratio.
Table 3. Linearity, calibration curves, limit of detection (LOD), and limit of quantification (LOQ) data of 10 compounds.
No.AnalytesCalibration Curves aR2Range (ng/mL)LOD (ng/mL)LOQ (ng/mL)
1Neochlorogenic acidy = 75.69x − 68380.99819.53–10,0000.872.65
2Chlorogenic acidy = 122.68x + 243320.99929.3–15,0000.581.76
3Cryptochlorogenic acidy = 19.976x − 2298.10.99819.53–10,0001.654.98
4Caffeic acidy = 64.629x + 2350.9992.92–15001.644.99
5Quercetin 3-rutinosidey = 176.09x + 126750.99924.41–12,5000.421.28
6Quercetin 3-galactosidey = 157.88x + 14990.99919.53–10,0001.484.50
7Quercetin 3-glucosidey = 176.52x + 122730.99719.53–10,0000.551.69
8Kaempferol 3-rutinosidey = 352.82x + 244260.9967.32–37500.110.34
9Kaempferol 3-glucosidey = 342.62x + 124380.9967.32–37500.491.47
10Isochlorogenic acidy = 27.534x − 2162.30.99914.64–75001.273.85
a y and x indicate the peak area and concentration of each analyte, respectively, using the standard solution.
Table 4. Precision, repeatability, and stability results of 10 compounds.
No.AnalytesPrecision aRepeatabilityStability
Intra-DayInter-Day
RSD b % (n = 6)RSD % (n = 3)RSD % (n = 6)RSD % (n = 3)
1Neochlorogenic acid1.123.371.932.31
2Chlorogenic acid1.842.691.842.79
3Cryptochlorogenic acid1.882.581.782.55
4Caffeic acid0.911.171.893.53
5Quercetin 3-rutinoside1.382.181.602.93
6Quercetin 3-galactoside1.613.261.523.97
7Quercetin 3-glucoside1.312.662.143.01
8Kaempferol 3-rutinoside2.973.412.593.37
9Kaempferol 3-glucoside2.451.902.573.05
10Isochlorogenic acid1.682.462.263.00
a Precision = (Standard deviation/mean) × 100. b RSD (%) = (Standard deviation/mean) × 100.
Table 5. Recovery results of 10 compounds.
No.CompoundsLow (n = 3)Medium (n = 3)High (n = 3)
Recovery (%) aRSD (%) Recovery (%)RSD (%)Recovery (%)RSD (%)
1Neochlorogenic acid96.440.9196.650.4797.410.87
2Chlorogenic acid98.30.0998.421.2798.820.05
3Cryptochlorogenic acid99.550.9799.560.0399.950.33
4Caffeic acid96.611.5197.090.6597.580.35
5Quercetin 3-rutinoside97.541.3397.811.0797.980.52
6Quercetin 3-galactoside98.720.9999.030.5399.080.62
7Quercetin 3-glucoside98.480.6598.591.0698.711.50
8Kaempferol 3-rutinoside96.310.7196.740.3896.690.69
9Kaempferol 3-glucoside95.61.8896.172.2196.622.25
10Isochlorogenic acid97.562.1197.730.5297.810.57
a Recovery (%) = (found concentration/spiked concentration) × 100.
Table 6. Contents (µg/mg) of the 10 analyzed polyphenolic compounds.
No.CompoundPurified ExtractUnpurified Extract
1Neochlorogenic acid56.77 ± 1.481.16 ± 0.01
2Chlorogenic acid160.67 ± 2.512.28 ± 0.01
3Cryptochlorogenic acid242.44 ± 0.733.37 ± 0.01
4Caffeic acid1.46 ± 0.050.03 ± 0.00
5Quercetin 3-rutinoside186.33 ± 1.323.13 ± 0.04
6Quercetin 3-galactoside40.24 ± 1.460.34 ± 0.01
7Quercetin 3-glucoside26.72 ± 0.820.22 ± 0.00
8Kaempferol 3-rutinoside3.10 ± 0.040.02 ± 0.00
9Kaempferol 3-glucoside1.92 ± 0.060.02 ± 0.00
10Isochlorogenic acid21.74 ± 0.570.05 ± 0.01
Total (Ʃ)741.41 ± 9.0410.61 ± 0.09
Results are expressed as mean ± standard deviation (n = 3).
Table 7. Phenolic acids and flavonoid contents (µg/mg dw).
No.ContentsPurified ExtractUnpurified Extract
1Phenolic acids483.10 ± 5.167.89 ± 0.02
2Flavonoids258.32 ± 3.022.73 ± 0.03
Results are expressed as mean ± standard deviation (n = 3).
Publisher’s Note: MDPI stays neutral with regard to jurisdictional claims in published maps and institutional affiliations.

