Article

Experimental Detection of Particle Structures Detachment from a Stretchable Single Fiber during Multiple Consecutive Stretching Cycles

Karlsruhe Instiute of Technology, Institute of Mechanical Process Engineering and Mechanics, Straße am Forum 8, 76131 Karlsruhe, Germany
*
Author to whom correspondence should be addressed.
Separations 2022, 9(7), 168; https://doi.org/10.3390/separations9070168
Submission received: 10 June 2022 / Revised: 29 June 2022 / Accepted: 1 July 2022 / Published: 5 July 2022

Abstract

:
The deposited particulate material within a fibrous filter affects the pressure drop which develops through three different stages. The implementation of a time-adjustable matrix is intended to cause detachment of particle structures from fibers within the upstream layers at low flow velocities. The deposited particle structures are transported further within the filter and clear up void space for an extension of filter service life. As in previous studies observed fiber stretching initiate cracks and following detachment of particle structures with a simultaneously applied airflow. For complete detachment of the particle structure, five consecutive stretching cycles are performed in this study. The elongation velocity, the flow velocity and the particle loading are varied. Using an image analysis technique and a laser-light measurement technique simultaneously, the cumulative fraction of detached particle structures and the size of detached particle structures are determined. A high initial particle loading on the fiber induces early detachment of larger structures from the fiber. The size of detached structures is increased by the increase of the elongation velocity. The mean value remains almost constant whether the elongation velocity or superficial velocity are increased. For small initial structures on the fiber, a decrease in superficial velocity causes detachment of larger particle fragments.

1. Introduction

Fibrous filters are mostly used in filter systems with low particle concentration. High collection efficiency is needed at low pressure drop during the entire filtration process. The primary factors to characterize the operational behavior of depth filters are the separation efficiency, pressure drop and the total loading capacity [1]. The overall depth filter service life is determined by the development of pressure drop. Typically, the pressure drop develops through three different steps. First particles are collected within the upstream layers of the fibrous filter matrix. Particulate material is collected at the surface of each single bare fiber across the depth of the filter matrix. During this depth filter step, pressure drop increases slowly [2]. As more particulate material is collected by the filter matrix, particle deposits on neighboring fibers start to from bridges. The separated particle material starts to clog. Deposition and, thus, clogging occurs mainly at the upstream section of the filter matrix. Pressure drop is increasing slightly faster at the end of the depth filter step [3,4]. During the transition step, the particulate material is collected either by the loaded fiber or within/on the surface of a clogged area. Pressure drop strongly depends on collected particle mass within the filter matrix [5]. At the end of this phase, the whole filter is switched to surface filtration. Subsequently at this surface filtration step, more particulate material accumulates on the upstream side of the filter forming a particle layer with high flow resistance. Based on the processes, the filter interior is not receiving any more particle mass. As shown in Figure 1 (LEFT), the filter remains with void space in the downstream layers that is not filled with particulate material [6]. Pressure drop is increasing linear in the surface filtration step with the deposited particle mass until critical pressure drop. At the end of the filter service life, whether in the transition step or in the surface filtration step, the filter must be replaced.
In order to extend the filter service life, a chance might be to free up some blocked space within the upstream layer. As a result, it should be possible to delay the steep increase of pressure drop at the end of the transition step. The intended trigger to remove/detach particulate material from the fiber and within the clogged areas in the upstream layers is stretching of the fiber matrix or individual fibers within the filter [8]. By stretching the collector, shear and tensile stress are applied to the deposited particulate mass on the fiber. As depicted in Figure 1 (RIGHT) the particulate material shall be transported further downstream the filter matrix to clear up void space at the upstream part of the filter. In investigations by Tippayawong, an external excitation such as vibration in addition to the applied airflow, act as a trigger for detachment of particle. The external excitation influences the threshold for removal between surface adhesion and the aerodynamic lift [9].
So far, the aspect pressure drop describes the behavior of a depth filter at the macroscopic level. To gain more detailed/fundamental information about the processes within the fibrous filter, systematic experiments at an isolated fiber are examined. Using this information from the microscopic level (single fiber), filtration behavior of fibrous filters can be modeled more precisely. As shown by Poggemann et al. [10] a mechanical elongation of individual single fibers induce shear and tensile stress to the compact particulate structure on the fiber resulting in re-arrangement and detachment of particle structures during the process. Compared to other investigations [11,12,13,14,15,16], which focused on detachment of particle or particle structures from stiff collectors, the necessary gas velocity (superficial velocity) for particle detachment at stretchable fibers have been quite low. As already shown by Beuth and Thouless, the cracking process and the size of the detached fragments on a moving substrate can be described as a function of the height of the matrix on the substrate (fiber) [17,18]. In the case of single fiber experiments, the amount of collected particulate material on the fiber is parameter for the development of filtration process. To estimate the amount of separated particulate material in the experiments, the level of fiber loading is evaluated in these investigations. The level of the particulate structure on the fiber affects the average distance between the cracks. This fact results in different sizes of the detached particle structures. A detailed view on the effects (cracking/detachment) on one filter fiber neglects the cross effects/influence of the neighboring fibers as in a filtration matrix. These bridging effects mainly occur at the end of the depth filter step and in the transition step [19].
The measurement technique to characterize the size and moment of detachment of particle structures was constructed based on the measurement method designed by Wurster et al. for continuous online detection of entrained oil droplets [20,21]. Moreover, the size of the detached particle structures gives a rough estimation of whether the structures will remain somewhere on the surface of the filter, re-deposit in the subsequent filter matrix of the filter or penetrate through the whole filter medium.
Since the particle structures have to pass through the gaps between fibers during the detachment process, the distance between several individual fibers is important for the transportation of particulate material into downstream layers. Based on the definition for depth filters, the filters have a packing density in the range of 0.1–0.02 and subsequently a porosity of up to 99.8%. This results in a distance between the individual fibers that is usually a multiple of the fiber diameter [7,22]. By the use of imaging techniques for filter characterization, the distance between individual fibers was validated [23,24,25].
For a reliable characterization of the properties and phenomena of/at a filter, process parameters and materials parameter (fibers and particulate material) were specifically varied in previous studies. The aim of these studies was to evaluate the development of pressure drop, the separation behavior of particles at the collector, the flow field or the material parameter of the used particulate material. To obtain a realistic insight of the filtration process as well as to control any influencing variable, a defined fiber distance was used in the studies. Müller et al. studied the separation behavior of particles at parallel fibers. The 25 parallel fibers had a distance of 246 μ m [26]. Kanaoka et al. investigated the development of pressure loss during particle separation on fibers of a model filter with a distance of 130 μ m and 190 μ m [27]. The fiber diameter in the corresponding studies were at most one fifth of the distance between the fibers that are used in the model filter.
In the simulation studies, the distance between the fibers is obtained by the packing density and also the fiber diameter. Mostly, the calculation of the flow field was based on the approach by Kuwabara et al. Junction points are neglected in these studies [23,28,29].
This investigation focuses on the detachment process of particle structures from a single filter fiber. Thus, the fact that any stretching of fibers in an entire filter inevitably changes the spacing between the fibers is currently neglected. The overall objective of this study is to gain basic knowledge about the impact of applied process conditions on the structure size, on the amount of detached particulate material and the kinetics in the stretching experiments. During multiple stretching cycles a low gas flow is applied to the fiber. Small structures can pass through the gaps more easily, whereas huge structures releases more space, but can be recollected effectively in downstream layers. A detailed prediction of where the particle structures migrate in a complete filter after detachment from the fiber is not possible yet, as there are no multiple parallel or stacked fibers in this study. The knowledge about the influence and interaction of the applied process parameters helps to built a base for the layout of a prospective stretchable depth filter. Construction parameters are, e.g., the space requirements for elongation the size and thickness of the filter.

2. Materials and Methods

2.1. Fibre and Particulate Material

As in the previous study, polymeric fibers made of polyurethane were used as stretchable collector for all investigations [10]. The fiber has reversible stretching behavior up to 75%, so it can be used for multiple stretching cycle up to 39.3% stretching. Isopropyl alcohol was used to clean the fiber before each loading process. For protection, the fiber was handled with tweezers and gloves during clamping only. Each fiber was replaced after nine stretching procedures. The fiber is a prototype for an application in an potential adaptive filter.
The particulate material is made from solid soda lime (A-Glass with a given material density and refractive index; ρ m a t e r i a l = 2.46 g cm 3 , n r e f r a c t i v e i n d e x = 1.51). The inert particulate material was obtained from Potters Industry and was used in all experiments in this study. The same material was used by Zoller et al. and Poggemann et al. in previous studies [10,30]. Particle size distribution is measured by laser light scattering (Helos & Rodos, Sympatec) with a dispersion pressure of 1.0 bar (g). Volume based median diameter of the particle size distribution is given with d 50 , 3 = 7.73 μ m.

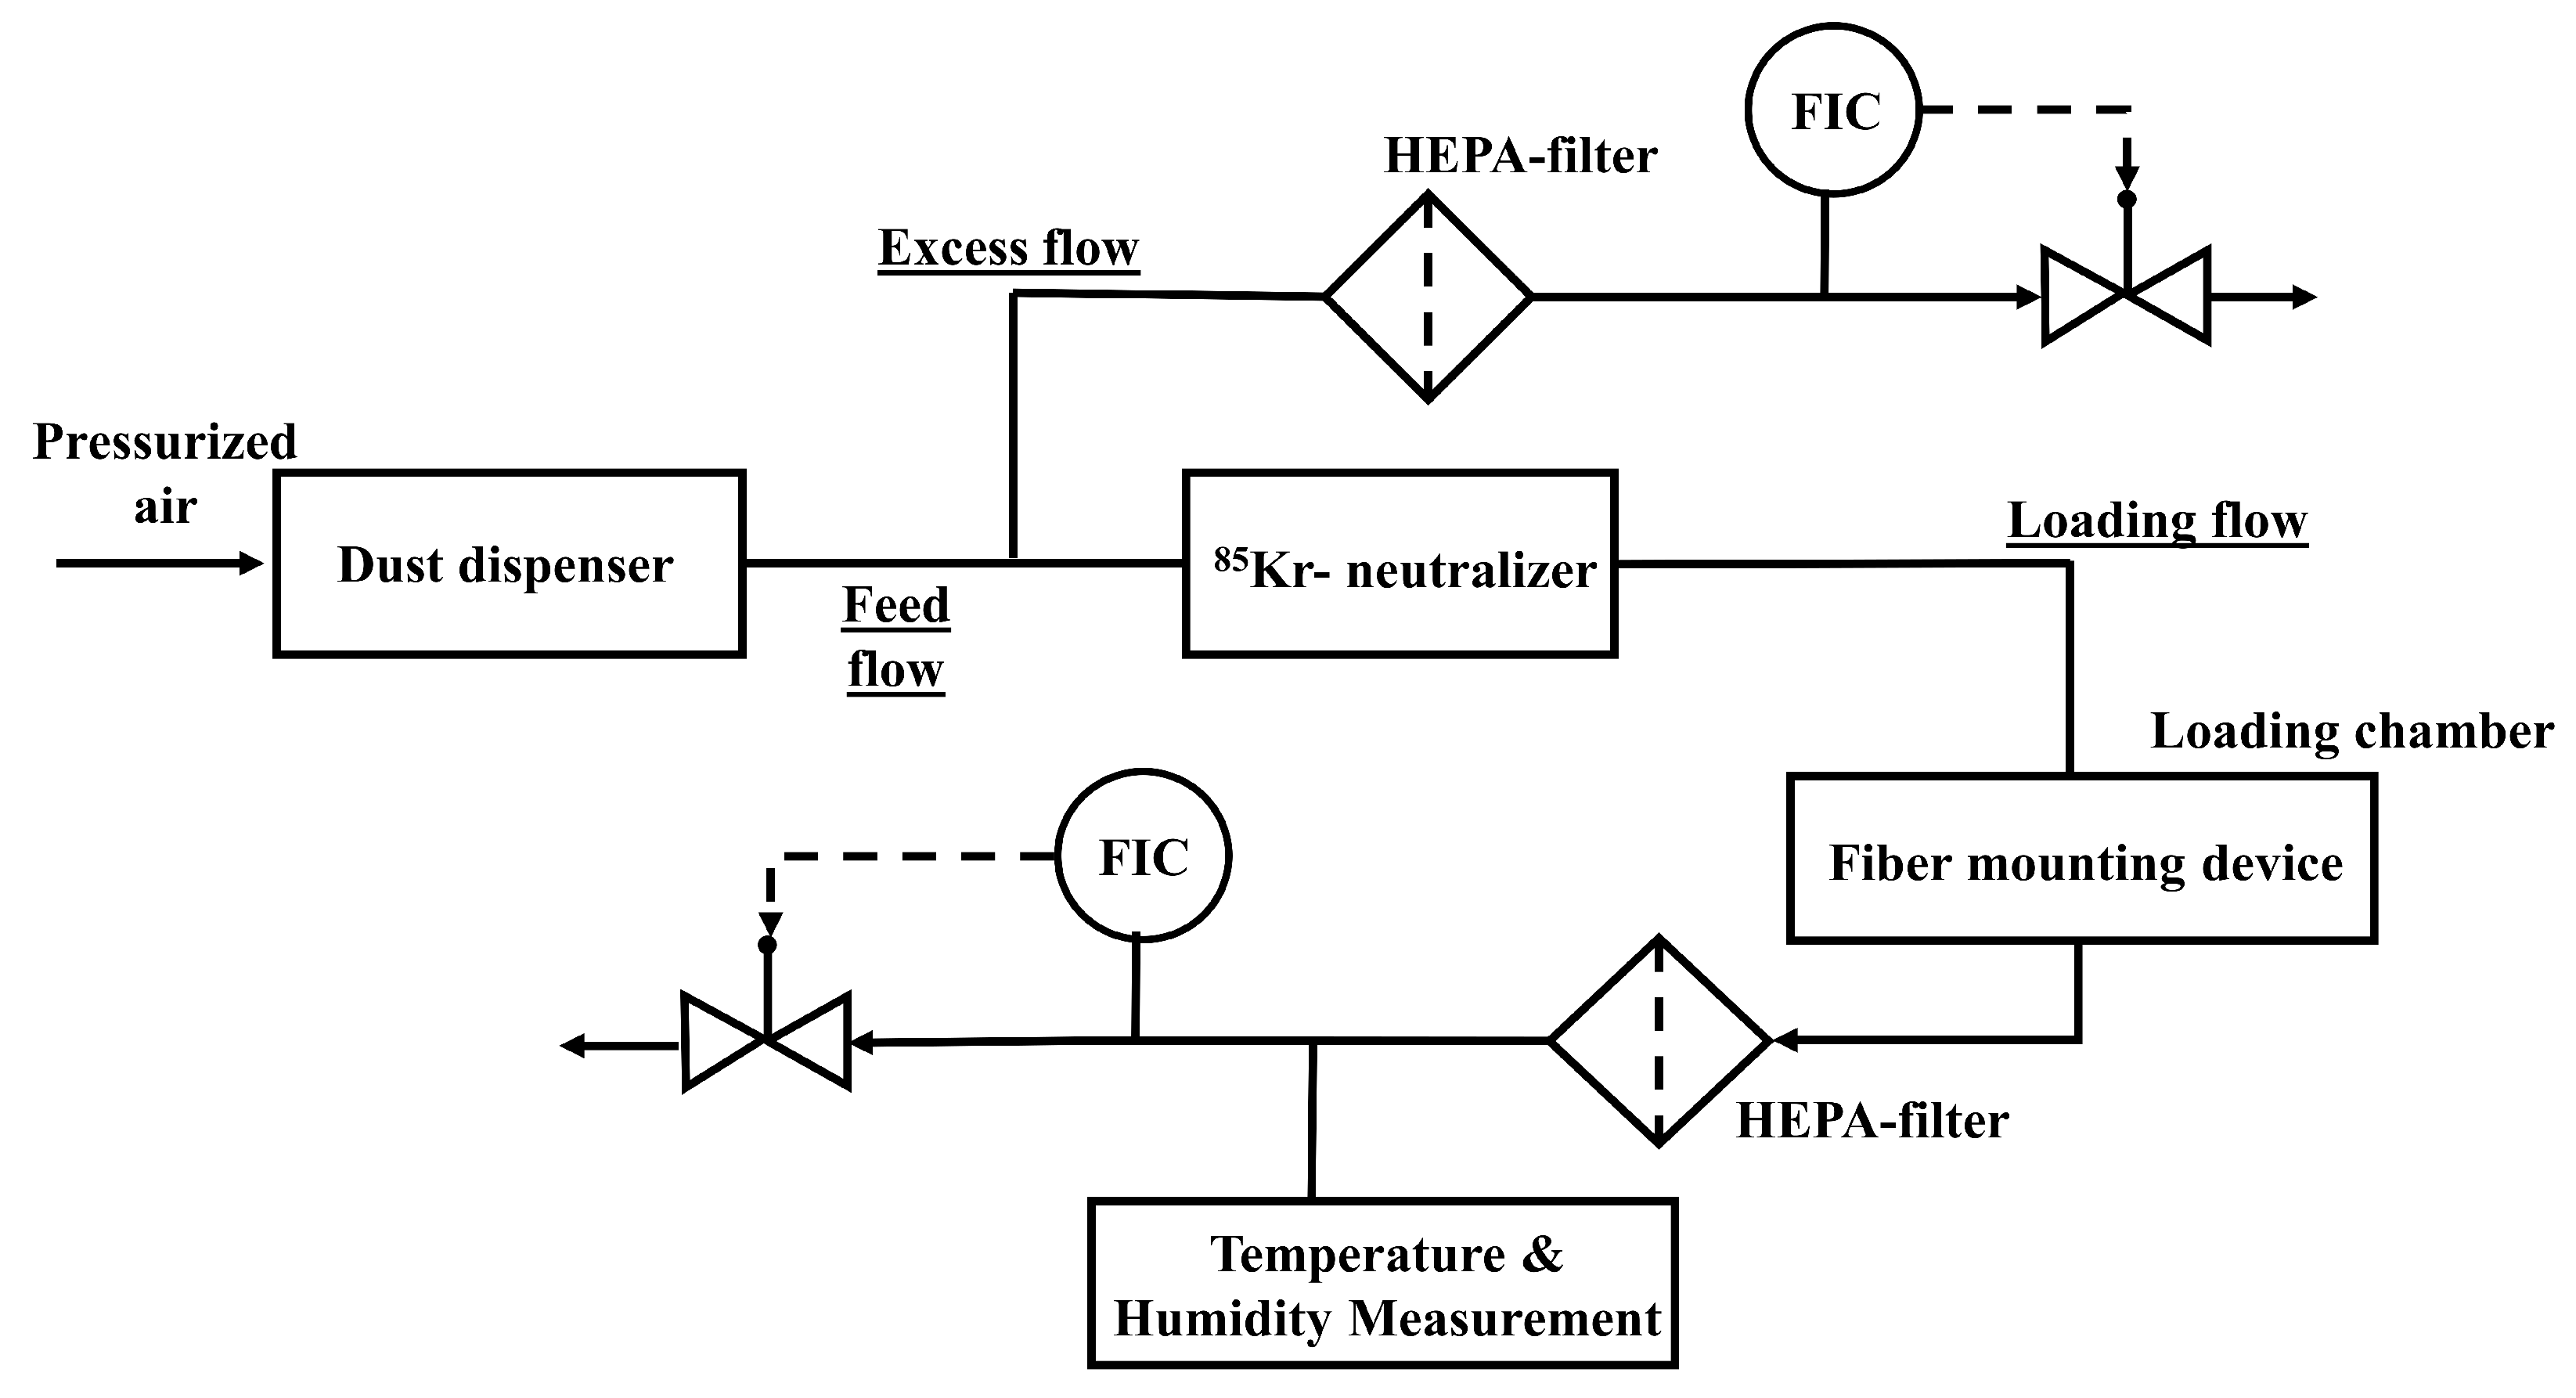
2.2. Aerosol Generation and Loading Procedure

Similar to a previous study by Poggemann et al., an experimental setup was used, which is depicted in Figure 2 [10]. Before this loading procedure, the stretchable fiber is mounted on the designed fiber-mounting device that fits into the loading chamber and the measurement chamber of large structure detection system (LSDS) (see Section 2.4).
The aerosol used in this study contained glass spheres as a disperse phase and pressurized air as a continuous phase. The particulate material is dosed by a rotating ring and an ejector nozzle (DIN ISO 5011) using the Topas SAG 410/U. The disperser worked at an ejector nozzle pressure of 2.0 bar (g). This results in a volume flow of 25 L min 1 in the feed flow. To obtain a constant humidity level in the storage tank of SAG 410/U, a sheath air flow with an indicated pressure of 1.3 bar (g) was applied. As in Poggemann et al. the mass flow rate of 4 g h 1 in the feed flow was set for the selected ring velocity (5% of the maximum velocity) in the setup of the disperser [10]. The loading procedure includes two sections upstream and downstream the loading chamber, where the fiber mounting device is placed. Upstream the loading chamber, the feed flow is split into loading flow ( V l o a d i n g = 14.28 L min 1 ) and excess flow ( V e x c e s s = 10.72 L min 1 ). To ensure a stable loading flow, a constant excess flow is drained of by a suction pump. The excess particulate material is removed by a HEPA-filter upstream a mass flow controller (MFC). After the separation of excess flow, the loading flow consecutively passes a 85 Kr—neutralizer to reduce the electrical charge of glass spheres. A following flow rectifier (consisting of a tube bundle) ensures a laminar plug flow field. The volume flow rate of loading flow is established using a MFC and a suction pump downstream the loading chamber. For a precise flow control, the MFCs were regularly calibrated using a bubble flow meter with a precision of 0.03 L min 1 . Downstream, the loading chamber all particles were separated from the gas stream using a HEPA-filter. The humidity and temperature (Sensirion, SHT85) are monitored downstream the loading chamber. The humidity of the loading flow was approximately 10%. The experiments are conducted between 20 C and 28 C and atmospheric pressure.
The loading procedure of the bare fiber takes place in a short free jet flow inside the loading chamber, which is sealed to avoid contamination by leak air. There was no extra differential pressure applied or measured across the loading chamber. Inlet and outlet pipe of the loading chamber had a diameter of 16 mm, which results in a flow velocity of u a = 1.2 m s 1 at the given volume flow. The superficial velocity for generation of the particle loading is in the range of filtration velocity for fibrous filter systems [7] A Stokes-number of 6.52 was obtained. Two different loading times (5 min and 15 min) at constant raw gas concentration were applied. Figure 3 (LEFT) shows two different particulate structures on the fiber in the non-stretched state. The heights of the particulate structures varies between approximately 103 μ m for 5 min loading time and approximately 332 μ m for 15 min loading time. The different heights of particle structures on the fiber are intended to represent different loading stages of the total filter during the transition filtration phase. In a filter matrix a linear increase of the deposited mass was observed by Thomas et al. [5]. The resulting structures (shown in Figure 3 LEFT) on the fiber are mainly located on the upstream side of the fibers. A compact structural shape has developed according to the process conditions which favor separation due to inertia [31]. As Kasper et al. described, the separated structure on the fiber can exceed the fiber diameter in height several times. The separated structures were representative for separation in a fibrous medium [30,32]. However, in a real filtration process different types of structures such as compact and diffusive with dendrites might overlap. In this study, only compact structures on the fiber are considered.
Figure 3 (RIGHT) shows the state of the interfacial layer between the fiber and the particulate structure in the non-stretched state of the fiber. The particle structure and the fiber are in a static state. In this static state, no shear stress acts within the particle structure or between the fiber and the particle structure. The indicated cohesion within the particulate structure and adhesion between the particulate structure and the fiber are significant for the behaviour of the structure on the fiber during the stretching process. For detachment of particle structures from the fiber, either the cohesion between the particles or the adhesion between the particle structure and the fiber must be eliminated. The adhesion between fibers and particles and cohesion between particles, respectively, are mainly based on intermoleculare forces. As observed during the detachment/regeneration of a filter cakes, the detachment behaviour is influenced by the properties of the particle structure (e.g., porosity ϵ and height t), the properties of the filter medium, and the filtration parameters.

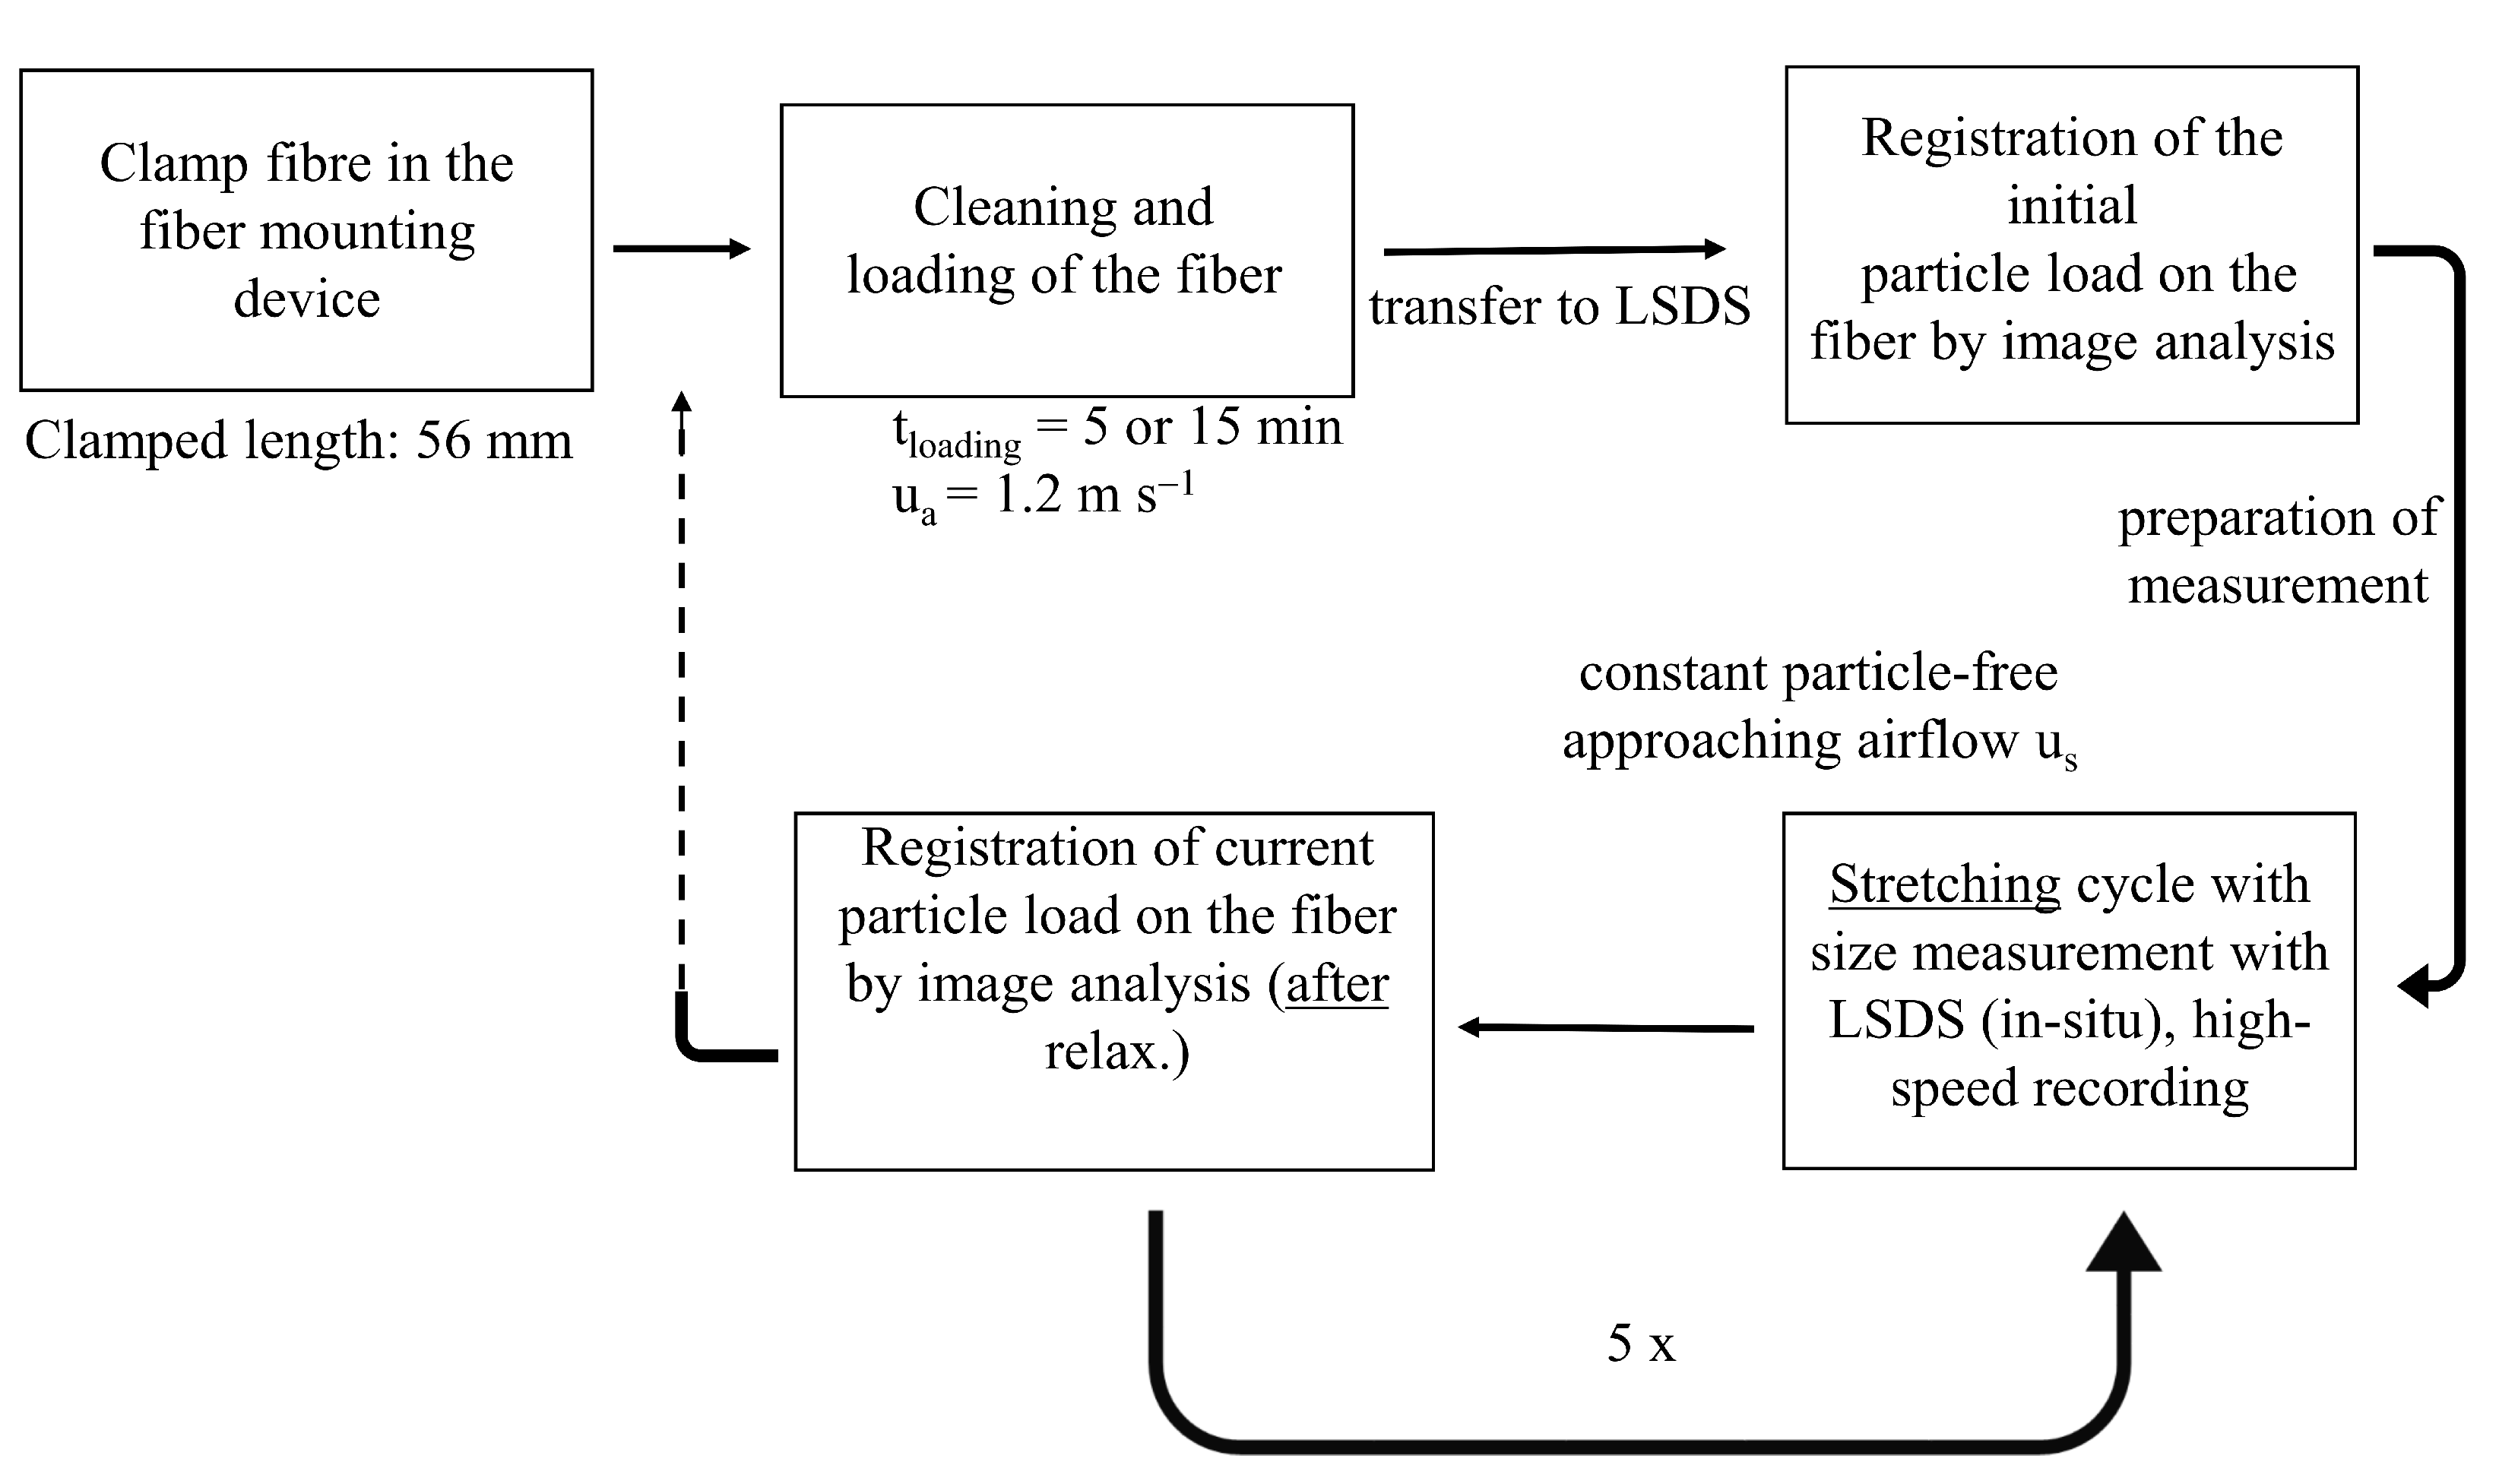
2.3. Multiple Stretching Cycle

As described in Poggemann et al. at stretching velocities of 1.2 mm s 1 and superficial velocities of 0.4 m s 1 , the compact and huge particulate structure on the fiber did not detach completely within the first cycle of stretching [10]. In this study five stretching cycles are performed consecutively. The elongation velocity and relaxation velocity are the same.
Figure 4 shows the process diagram of one stretching experiment. All experiments were performed threefold. The fiber was replaced after 45 stretching cycles. This number of stretching cycles is based on values of the tensile tests. In total, 6 fibres were used in the shown experiments. The fibers did not show any macroscopic changes before and after multiple particle loading.
The size of particle structure fragments are measured with the LSDS (quasi in-situ) during each stretching cycle.
The airflow is approaching the fiber during the whole stretching cycle. The percentage of detached particle structure is analyzed at the end of each stretching cycle via image analysis (see Section 2.5). The images after individual stretching cycles are found in the supplementary data. Table 1 summarizes the experimental parameter for the loading and the stretching process. As shown in Poggemann et al. fiber stretching is established by two synchronous moving piezo actuators placed on the fiber- mounting device [10]. The elongation velocity is varied between 0.05 mm s 1 and 12 mm s 1 . Fiber stretching was operated with an entire elongation of 22 mm. With a distance of 56 mm between the clamping points of the fiber, this results in a maximum elongation of 39.3%.

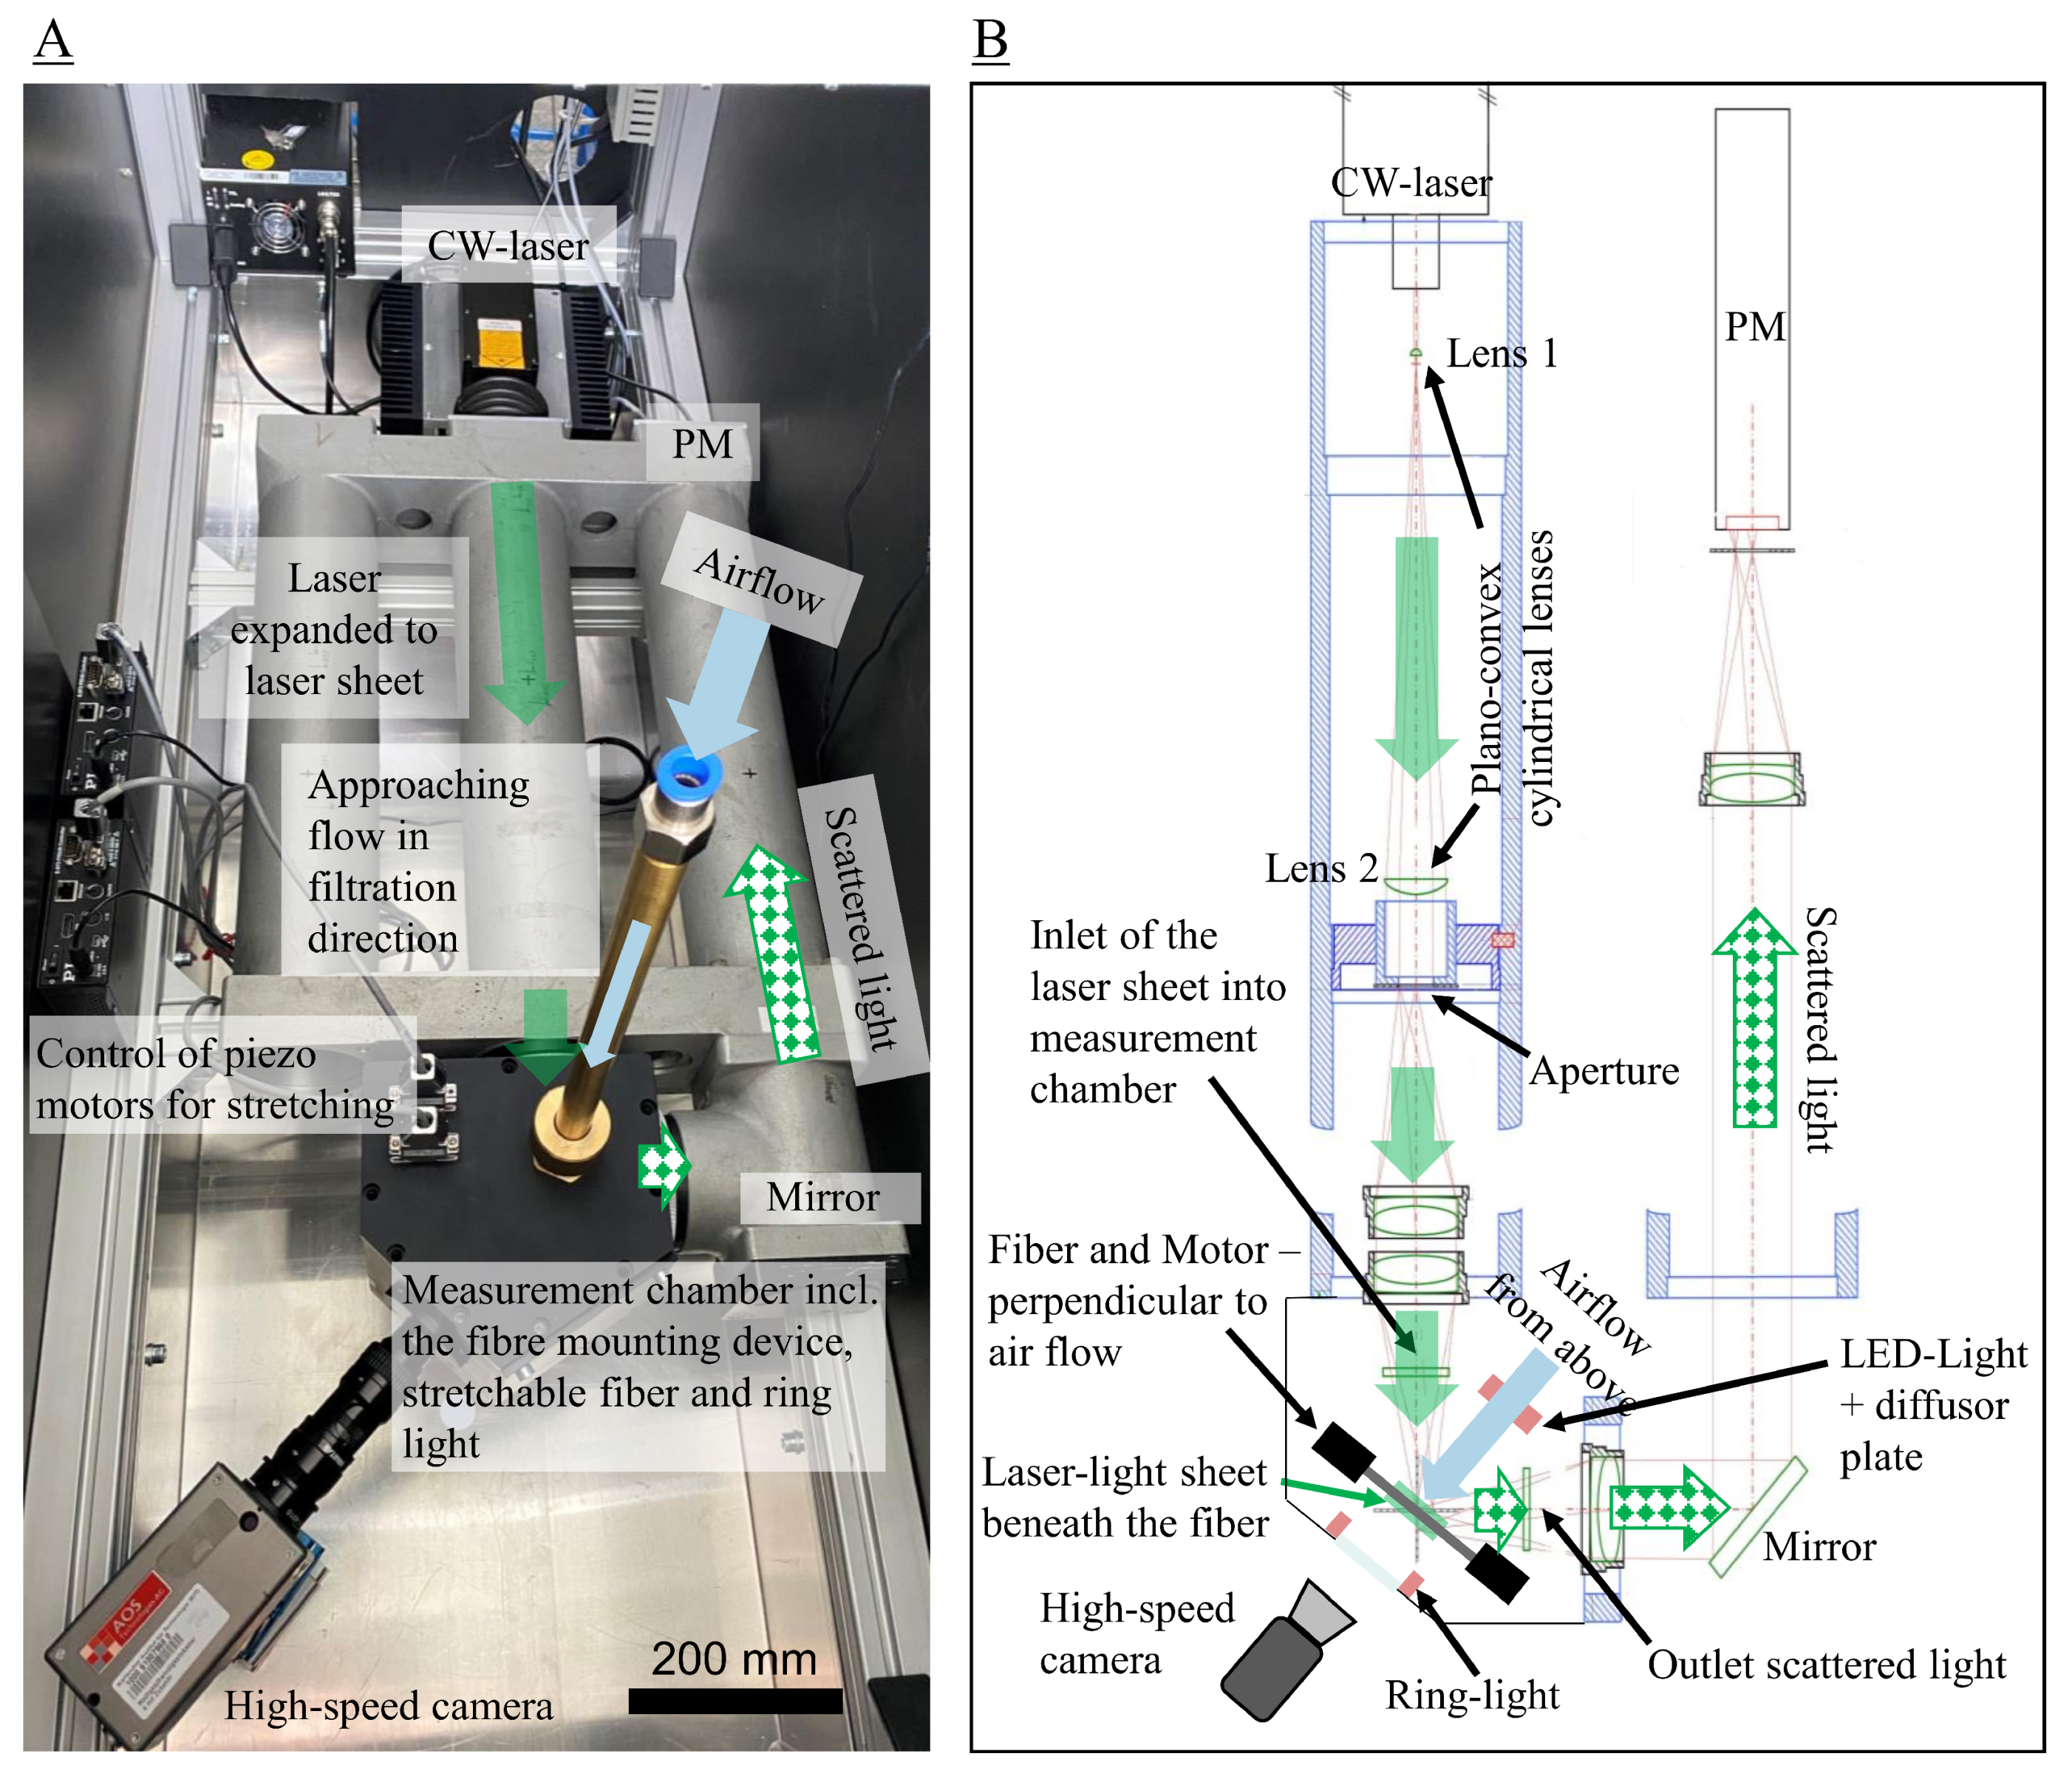
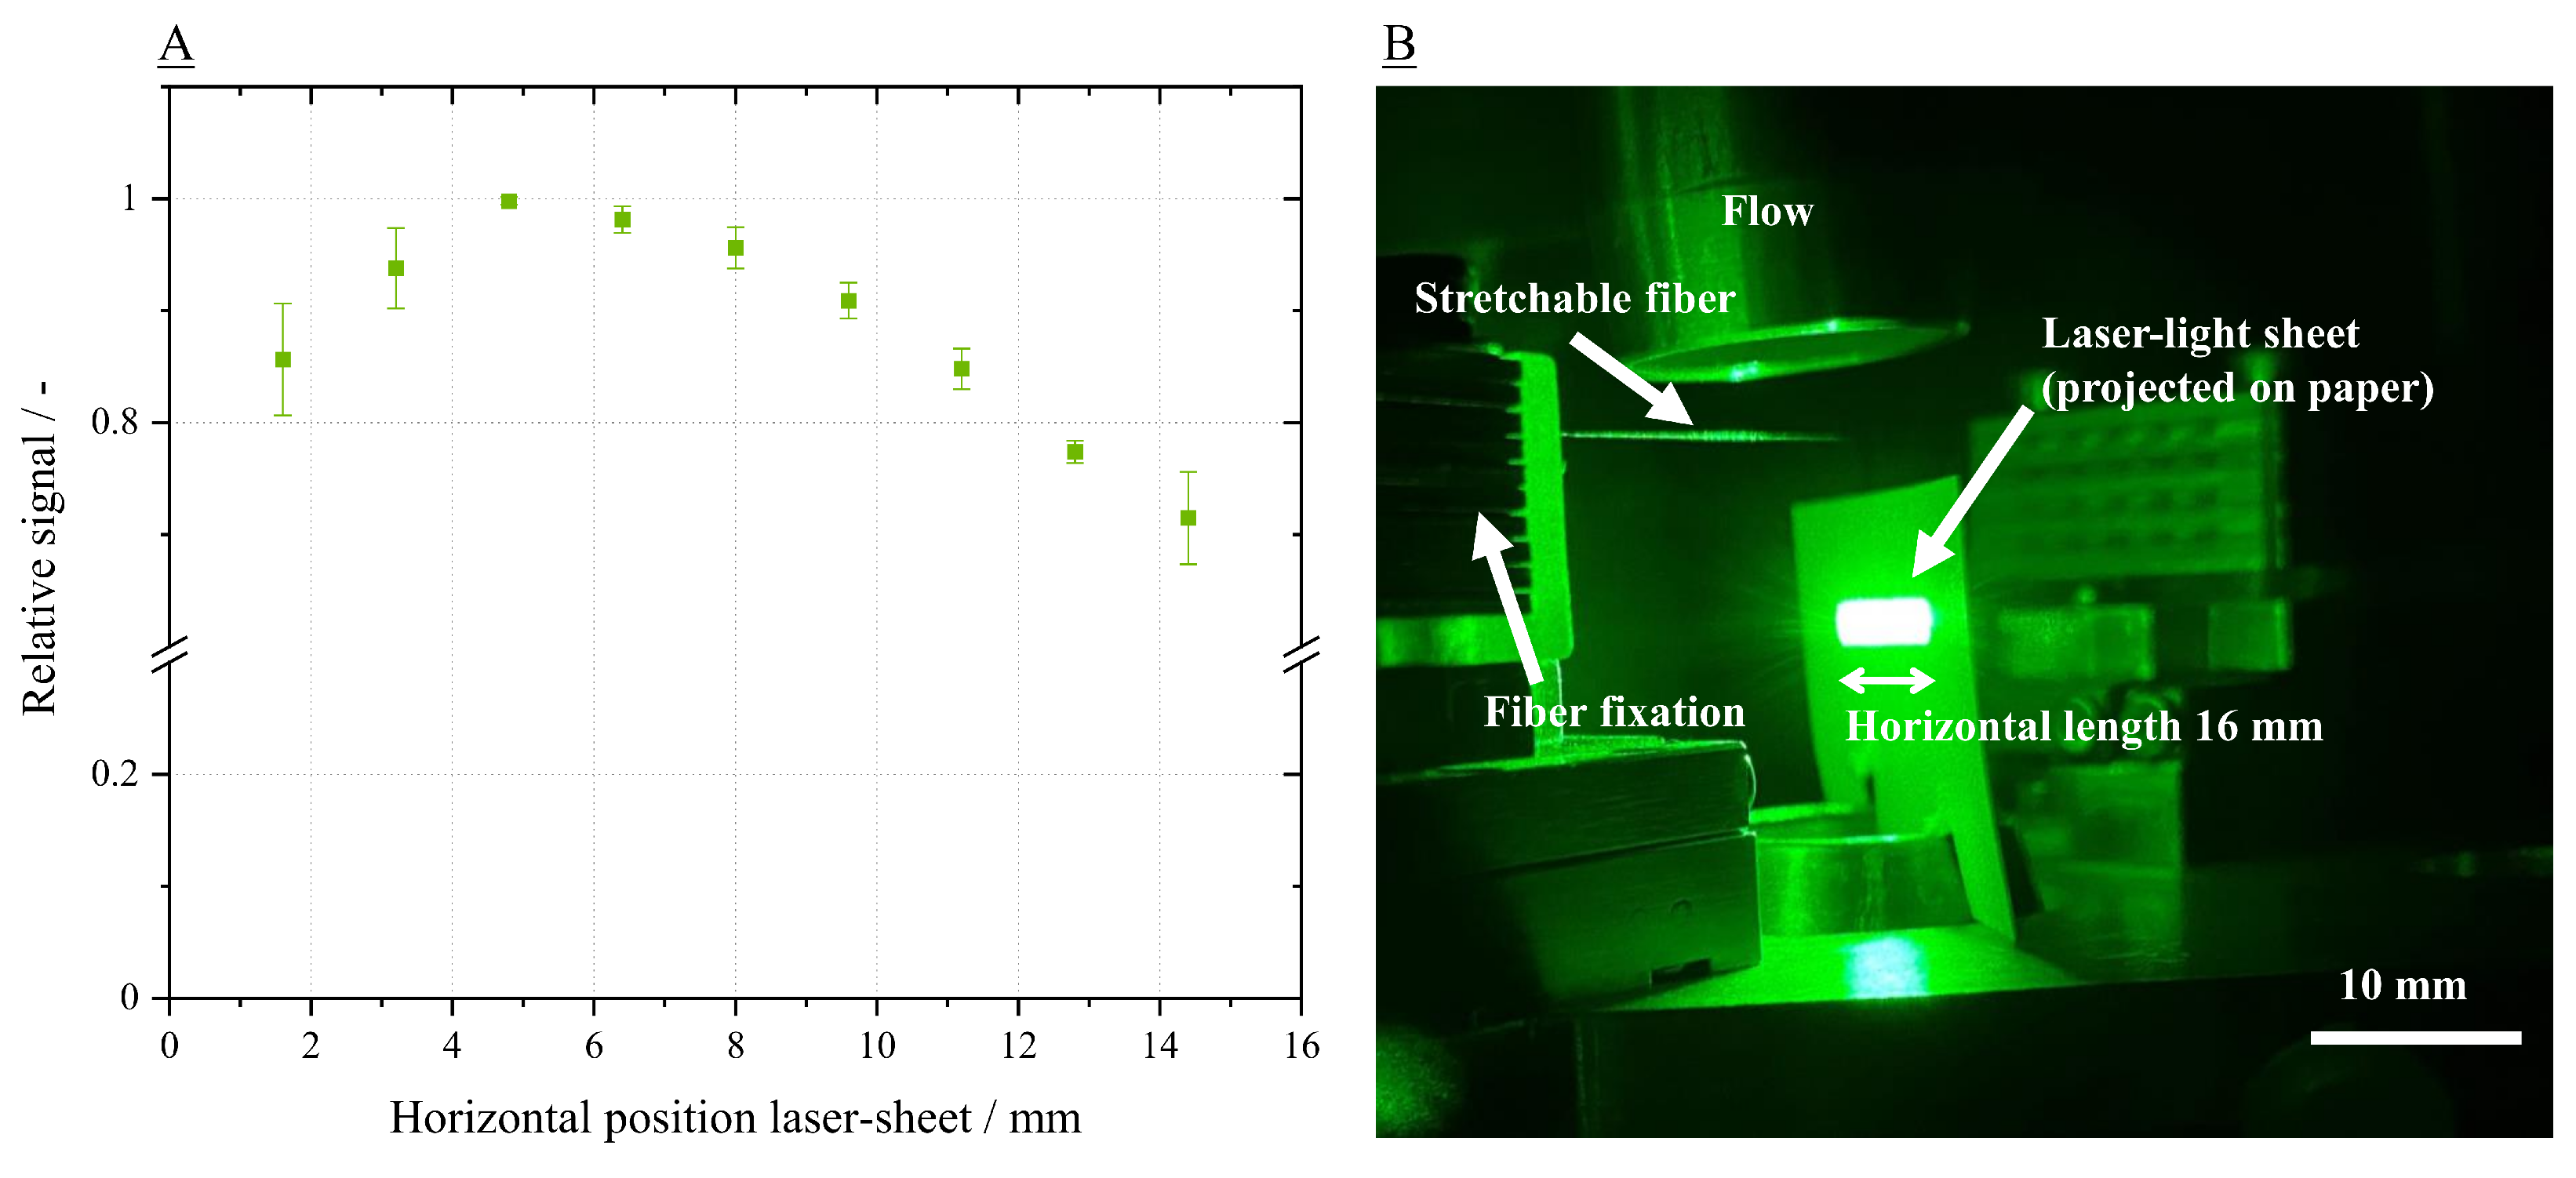
2.4. Large Structure Detection System

For the continuous counting and sizing of detached particle structures from a single fiber a dedicated measurement system was developed. Because those particle structures move very rapidly within the particle-free airflow once they are detached from the stretched fiber, it was necessary to detect and size them immediately. In addition, the structures start to disintegrate following the airflow below the fiber. A novel device based on the laser light sheet technique by Wurster et al. [20] was developed. Figure 5B shows the overall optical measurement concept of the LSDS. A thin laser sheet is placed at a distance of a few millimeter below the fiber, so detached particle falling through the light sheet directly after the detachment from the fiber. The light sheet was produced by expanding a Gaussian TEM00 laser (MGL-FN-532) of 1 W cw solid state and a wavelength of 532 nm. For this expansion in horizontal direction two cylindrical lenses are used. First the laser is expanded by a plano-convex lens with a focal length of 5 mm. The second plano-convex lens with a focal length of 200 mm has a distance of 200.5 mm to the first lens and focuses the laser on the aperture. The aperture (dimensions: 16 × 2 × 0.150 mm) was applied to sharp edges of the laser-sheet. The photomultiplier (PM) captures the scattered light against a background of stray scattered light in an angle of 90 ± 13 [33,34]. For the perpendicular optical access, the clamping points of the fiber-mounting device are arranged diagonal. The detached particle structures (detachment events) produce pulse of scattered light while passing through the light sheet. These pulses of scattered light (emitted at an angle of 90 ± 13 ) are focused onto the PM (P30CW5, Sens-Tech Limited). At the photocathode of the PM, the photons release initial electrons. These generated electrons are exponentially amplified at dynodes and result in a measurable electrical voltage signal at the anode of the PM [35]. The generated electrical impulses are filtered (low pass filter with cutoff frequency of 100 kHz) and digitized using a digital oscilloscope (Picoscope 4224, Pico Technology). Using a MATLAB© routine the separated online-signals are recorded and classified individually according to the pulse height and the time stamp.
The high-speed camera (AOS Promon 1000/U) is mounted outside of the measurement chamber perpendicular to the clamped fiber. Online observation and analysis of the remaining particle material on the fiber after the measurement procedure is performed. Further, observation of the re-arrangement process of the particle structure is possible. The used objective lens (Navitar 1-60135, 1-61387, 1-60110, 1-6010) allows a resolution of (up to) 5.2 μ m px 1 . The necessary illumination for a high-speed record was provided by using a red LED-stripe (620 nm) and a diffuser plate. The fiber including the particle structure was illuminated from the back, creating a shadow profile of the fiber and the particulate structure on the fiber. In front of the PM, a dichromatic filter (DT-green filter) culled the red light, so simultaneous LSDS measurement and high-speed recording with illumination is performed. As depicted in Figure 5A,B, a ring-light RL2 (StarLight Opto-Electronics GmbH & Co. KG, Nürnberg) was installed for photography and filming with illumination from the front (same direction as camera) during and after stretching cycle.
The laser-light system was calibrated with glass spheres in a size range of 90 μ m to 2000 μ m. The resulting signal for each size class showed a x 2 -dependence with a factor of 0.765 mV μ m 2 . The upper detection limit was at 4279 μ m due to the saturation of the oscilloscope. Larger structures are still counted, but not sized correctly. The lower detection limit is 90 μ m given by a minimum signal-to-noise ratio of 2. Samples are collected with a sample interval of 100 ns. The average amplifier voltage for the PM was 360 V. The measured signals are sorted into several channels. The LSDS provides number concentrations in 129 channels within the detection limits. Number based distribution (e.g., Q 0 ; q 0 ) was calculated assuming a uniform shape of detached particle structures. The calibration results in a function between photomultiplier signal (electrical signal captured with the digital oscilloscope) to projected structure size which is equivalent to scattered light as shown in Zoller et al. [36].
The laser beam profile was assumed to be Gaussian in all direction. To evaluate the described measurement technique, the intensity profile in the horizontal axis were probed with monodisperse glass bead of 1 mm fixed on a piezo motor for stepwise movement. The beam intensity registered (by the LSDS) is shown in Figure 6A. As depicted here, the intensity varies by a maximum of about 33% across the horizontal coordinate. This results in a variation of 16.5% in assigned size.

2.5. Determination of Cumulative Fraction of Detached Particle Structure from Total Structure and Residual Structure on Fiber

The projection area (pro. a.) of the remaining particle material is determined using a MATLAB© routine. For each cycle, the image is cropped and converted to grayscale. Before each experiment, a reference frame is created using only the bare fiber. All images are binarised according to Otsu [37]. Within the binarised images, the bright pixels are counted. Those represent the pro. a. of particulate material and fiber. In the side view, the pro. a. combine both the fiber and the compact particle structure. For the final pro. a. of the particulate structure, the pro. a. of the reference frame (only the bare fiber) is subtracted. As shown in Equation (1) the ratio of the current pro. a and the initial pro. a. at the beginning of the experiment gives the cumulative fraction of the detached particulate structure. To eliminate the influence of fiber rotation during the stretching process, image analyses is executed at the end of each stretching cycle 2 min after reaching the initial position. The residual structure on the fiber was determined using the recorded images after the fifth stretching cycle. The grayscale images were subjected to qualitative analysis.
C u m m u l a t i v e f r a c t i o n o f d e t a c h e d p a r t i c l e s t r u c t u r e f r o m t o t a l s t r u c t u r e = c r i r
With c as the current pro. a. of the fiber plus the particulate material on the fiber, r as the reference pro. a. of a bare fiber, i denotes the initial pro. a. of the fiber plus the particulate material.

3. Results and Discussion

In all experiments, a compact particle structure on the fiber was accomplished. In previous studies, a high particle loading on the fiber was used showing the basic effects of re-arrangement and detachment of particle structures [10]. As described in Section 2.2, evaluation of detachment behaviour of particle structures at different loading height/stages is necessary to gain knowledge about an optimal time for external excitation of the fiber and the filter, respectively. Therefore, results of fibers with reduced particle loading (5 min) are compared with those of high particle loading (15 min) on the fiber (see Section 2.2). The initial particle structure on the fiber at the beginning of the experiments is shown in each diagram by schematic drawings.
The detached particle structures are divided into two categories which are based on the time of detachment. The detached structures during the first elongation cycle are represented by filled symbols in the following graphs. The particle structures, which detach in the 2nd to 5th elongation cycle, are represented by hollow symbols. The cumulative number of detached particle structures during the five stretching cycles is plotted on the right y-axis. The figures depicted in the following, contain all structures, that detached during the three experiments (two replicate tests) of 5 stretching cycles each.

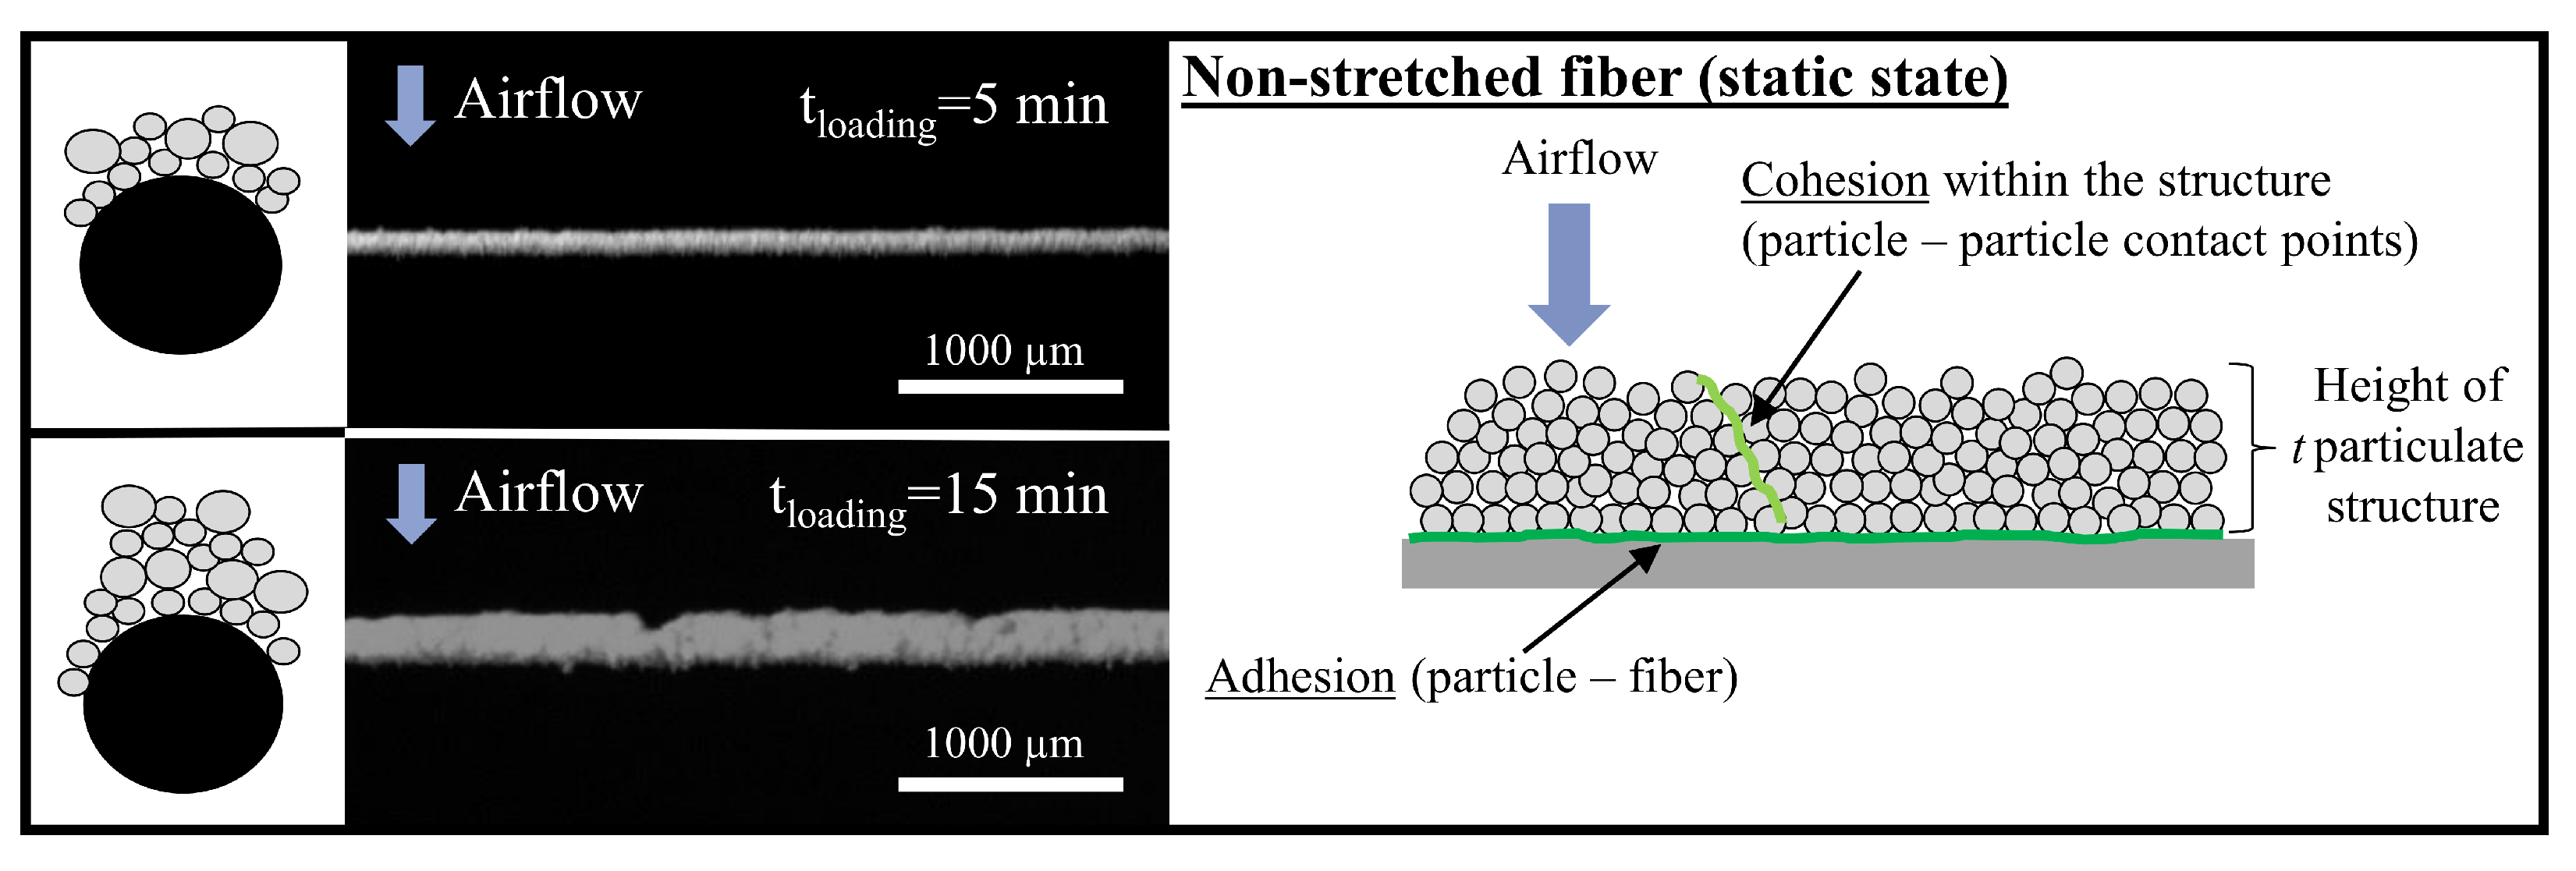
3.1. Variation of Particle Loading Time

Figure 7 (TOP, LEFT and RIGHT) shows the measured size of the detached particle structures as a function of the fiber elongation. The fiber was stretched with an elongation velocity of 0.6 mm s 1 . The airflow was orientated in the same direction as in the loading procedure. In all experiments, detachment of particle structures was observed regardless of the particle loading of the fiber.
Focusing on the experiments with a high fiber loading, the number of particle structures that detached during the first stretching cycle are significantly increased by the increase of superficial velocity. This fact results from the increase of drag force during the first weakening (from 0.05 m s 1 to 0.8 m s 1 ). However, the total number of detached structures after five cycles remains almost the same regardless the increase of superficial velocity. The increase of the superficial velocity causes a shift of the main area for detachment from 25–35% fiber elongation to 10–25% fiber elongation. For a higher superficial velocity of 0.8 m s 1 and a high fiber loading, detachment of particle structures occurred at a lower fiber elongation. Regardless the applied flow velocity the fiber rotates during the stretching procedure as described in previous experiments [10]. Thus, the face area of the particle structure and the lever arm are changing significantly due to the height of particle structure during the stretching process. Moreover, the flow velocity is included in the drag force with the power of 2, so the influence is much more pronounced.
Fiber elongation acts as a weakening factor in these experiments. In the experiments with a low fiber loading, no structure detachment during the first stretching cycle was determined. The structures are weakened by the first elongation cycle. In the following stretching cycles, particle structures detach from the fiber due to the combination of drag force and weakening by crack formation.
The main area for detachment during the 2nd to 5th stretching cycle was only slightly shifted by the increase of applied superficial velocity from 0.05 m s 1 to 0.8 m s 1 . The main area for detachment in the experiments with low fiber loading and an elongation velocity of 0.6 mm s 1 remains at a fiber elongation of 30–38% for both superficial velocities.
Regardless of the superficial velocity, the size of detached particle structures is not changed significantly compared to the experiments with the high fiber loading. On the contrary, the number of detached structures decreases by increasing the superficial velocity. The maximum structure size remains below 1200 μ m in the experiments with low fiber loading. A reason for a lower number of detected structures could be that a majority of structures in these experiments were below the detection limit of the LSDS. For the experiments with a high particle loading, the structure size is almost up to 1600 μ m or 2000 μ m in the experiments for the respective superficial velocities. A reason for the large size of detached particle structures is the difference in the distance of cracks within the particle structure on the fiber. As mentioned in Poggemann et al., the average distance of cracks l that are formed within the particle structure during stretching is a function of the height t of the particle structure on the fiber [10,18]. A more overall picture of the crack formation due to substrate/fiber stretching, might emerge from experiments with different particle materials with other surface properties.
Figure 8 (LEFT) shows the crack formation during stretching experiments for two different particle loadings on the fiber (elongation = 8%). Regardless of elongation velocity and the superficial velocity, the average distance between the cracks l differs between 515.1 ± 118.4 μ m for high particle loading and 203.3 ± 55.5 μ m for low particle loading. Cracks are formed from the surface of the particle structure to the lowest layer of particle structure on the fiber. The slope of cracks is very steep. The slope of the cracks during the breakage process of the total structure on the fiber is characteristic for the used particle material. Different particulate material may have a different fracture angle due to their properties. The size of the structures and the breakage process could be influenced. In addition, Figure 8 (RIGHT) shows schematically the state of the interfacial layer between the particle structure and the fiber during the elongation procedure. Fiber stretching introduces shear stress to the interface between particle structure and fiber. Crack formation rises from the failure of cohesion within the particle structure at weak points within the particle structure/at the surface of the structure. The distance of cracks is determined by the ratio of applied stress due to fiber elongation and the corresponding cross-sectional area of the structure on the fiber. The applied elongation velocity of the fiber and the tensile strength of the particle structure affect the breakup behavior of the structure on the fiber.
Figure 7 (BOTTOM, LEFT and RIGHT) shows the cumulative fraction of detached particle structure as a function of the number of stretching cycle. Standard deviations of the mean value result from three experiments with the same process conditions. In experiments with high particle loading, the cumulative fraction of detached particle structures after the first cycle is increased by the increase of superficial velocity. After the 2nd stretching cycle, the cumulative fraction of detached particle structures is in the range of complete detachment, regardless the superficial velocity. The missing fraction up to 100% represents the amount of residual structures on the fiber (see Figure 9). These structures can be observed by analyzing the fiber separately in all experiments with high fiber loading as described in Section 2.2. The corresponding images can be found in the supplement data.
In the experiments with a low fiber loading (5 min), a small, yet non-negligible cumulative fraction of missing–detached–structure is observed after the first and second elongation cycle, although no detached structures were registered by the LSDS in these cycles. Two possible reasons are given here: either the detached particle structures must have been smaller than the lower detection limit (90 μ m) of LSDS or the fiber including the particle structure did not rotate back to the initial position and projection size within the field of view.
Regardless the applied superficial velocity in the experiment with low particle fiber loading, the cumulative fraction of detached particles is increasing less steep than with higher particle loading.
As shown in the Figure 7 (BOTTOM) the standard deviation of the fraction is reduced by increasing the superficial velocity from 0.05 m s 1 to 0.8 m s 1 .
The experiments demonstrate that large particle structures are more likely to detach earlier during the elongation process with the same applied process conditions. As a proposal for a potential complete stretchable filter system, it can be beneficial to separate a high amount of particulate material in the filter before the start of the stretching process. For detachment of particle structures from a fiber with a low particle loading, multiple elongation cycles are required to achieve the same level of particle detachment from the fiber. This fact can be transferred to a complete filter system. The influence of neighboring fibers in a fiber array or a total filter has not been clarified yet.
Figure 9 (LEFT) shows the continued stretching procedure with proceed crack formation and first void spaces due to detachment of particle structures from the fiber. In addition, a rotation of the remaining particle structures on the fiber is observed. As in Figure 3 and Figure 8, a fiber with low and high particle loading are depicted. Figure 9 (RIGHT) shows a schematic of the fiber in the stretched state and the interfacial layer between the fiber and the particulate structure. As depicted in the images, a residual layer of particulate material is marked at the position of void spaces where structures detached. A complete failure of cohesion within the structure results in detachment of particle structures. Adhesion between the lowest layer of the particle structure and the fiber maintains mostly in the first stretching cycles. This could lead to information about the magnitude between cohesion and adhesion forces of the particle structure on the fiber. Repeated elongation of the fiber outcomes in application of shear stress, which increases the chance for detachment of particle structures.

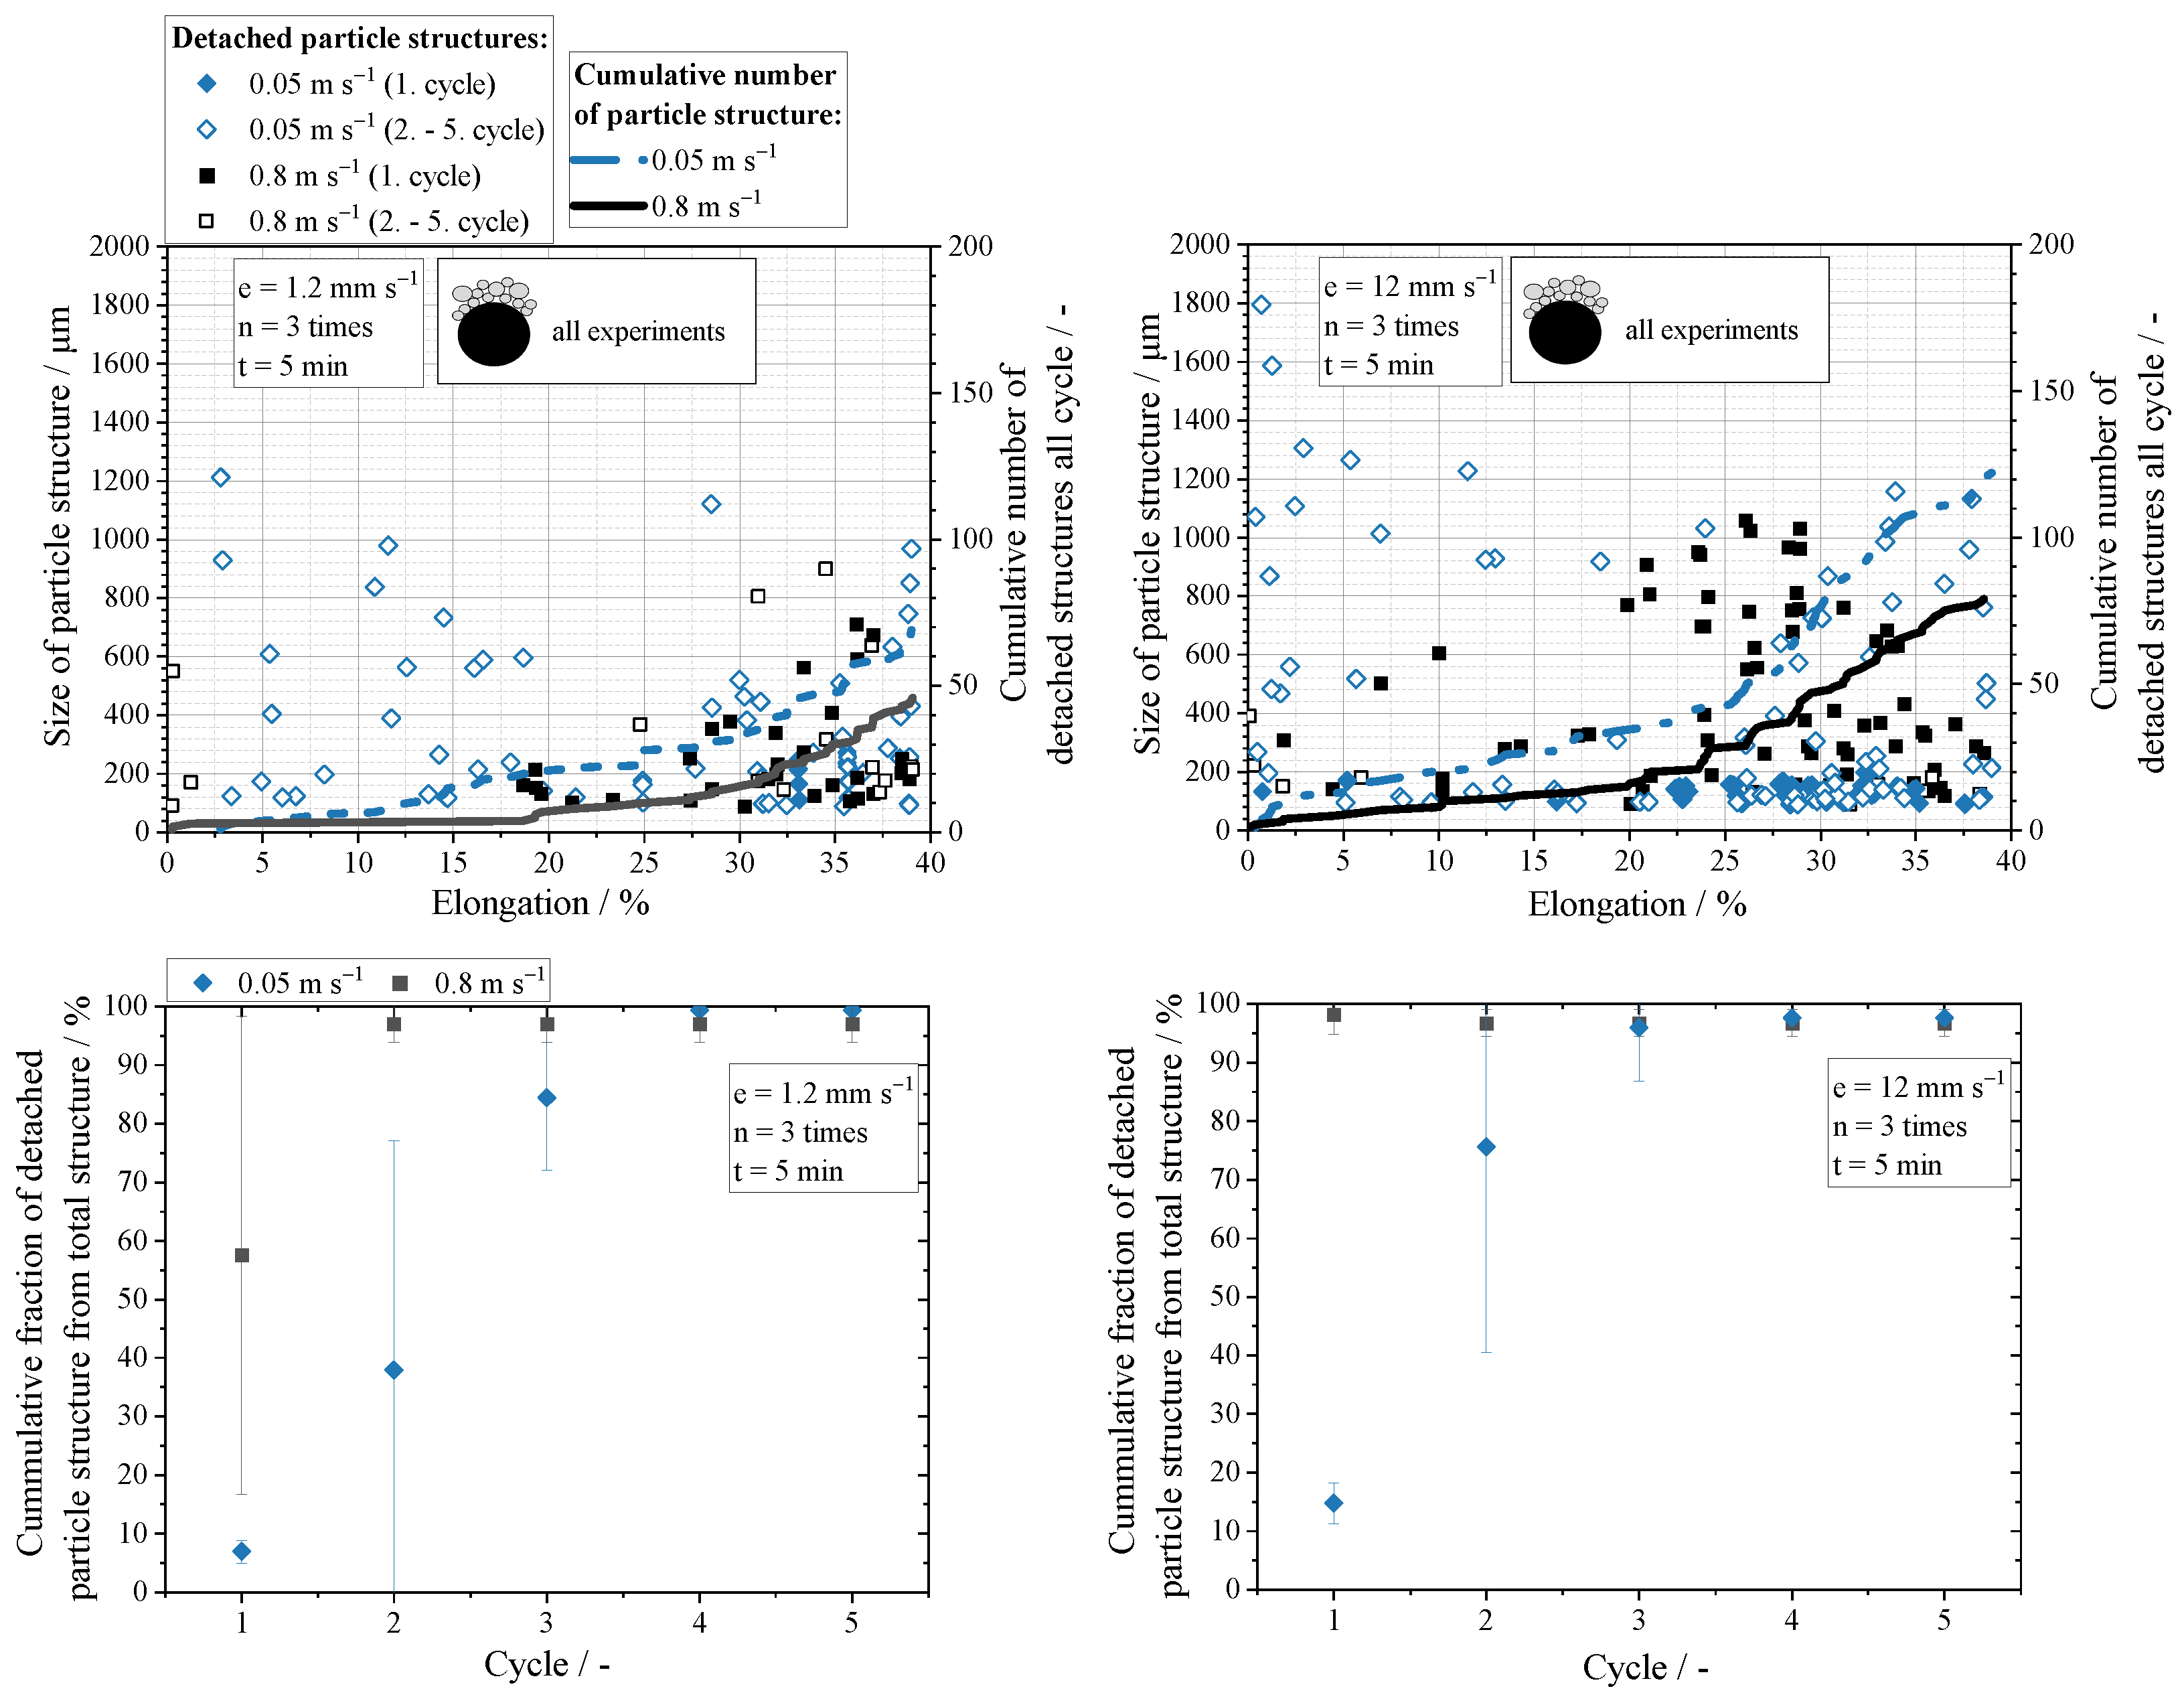
3.2. Influence of Elongation Velocity

The influence of the elongation velocity on particle structure detachment was investigated in more detail by applying two more elongation velocities, namely 1.2 mm s 1 and 12 mm s 1 . The elongation velocity of 12 mm s 1 represents the maximum elongation velocity of the setup. As in Section 3.1, the set of superficial velocities remained constant at 0.05 m s 1 and 0.8 m s 1 , respectively. As in the previous Section 3.1, a compact particle structure was deposited on the stretchable fiber. All experiments (in Figure 10) were conducted with a low particle load on the fiber (5 min) to probe the effect of external excitation at the beginning of the transition phase with a low particle structure on the fiber. The size of detached particle structures was determined using LSDS. The corresponding elongation is shown on the x-axis to provide comparability between experiments with different elongation velocities. The cumulative fraction of detached particle structure was analyzed via image analysis after each finished stretching cycle.
Figure 10 (TOP, LEFT and RIGHT) shows the measured size of the detached particle structures in the experiments with an elongation velocity of 1.2 mm s 1 and 12 mm s 1 , respectively. As shown in the diagrams, the number of detached particle structures during the first stretching cycle is increasing with the increase of the elongation velocity. Comparing to the results with the lowest elongation velocity of 0.6 mm s 1 (see Figure 7) this trend becomes even more clearly. Focusing on all experiments with a superficial velocity of 0.8 m s 1 , early detachment of structures during the first stretching cycle appears in the experiment with an elongation velocity of 1.2 mm s 1 . The tenfold increase in elongation velocity reinforces this trend. Due to the increase of the aspired elongation velocity, the acceleration of the motors for fiber elongation increases. This results in larger shear stress between the fiber and the particle structure on the fiber. As a consequence the cohesive bonds within the structure on the fiber dissolve as shown in Figure 8 and Figure 9.
By increasing the elongation velocity, a slight increase in the size of the detached structures is also noticeable. Moreover, a shift of the moment for first detachment to lower fiber elongation by increasing the elongation velocity is clearly visible. This is due to the velocity of crack formation which is increased by the elongation velocity.
As shown in Figure 10 (TOP) the actual elongation when the first particle structures detach from the fiber is reduced from 18% to 2% fiber elongation. For an elongation velocity of 0.6 mm s 1 , no detachment at all is detected during the first cycle. For experiments with a superficial velocity of 0.05 m s 1 this trend is less noticeable for structure detachment during the first cycle. However, a shift towards lower fiber elongation is visible during 2nd to 5th cycle detachment. The main range of elongation for detachment is shifted from 5–20% to 0–10% in these experiments by increasing the elongation velocity. As shown in the experiments the increase in elongation velocity enables detachment at lower elongation of the fiber. Thus, in a potential stretchable filter system less space is needed at a constant filtration velocity.
Comparing the mean size of detached particle structures during the first stretching cycle between the experiments with 0.05 m s 1 and 0.8 m s 1 , respectively (see Figure 10), the detected size of structures in experiments with 0.8 m s 1 is always larger than with a superficial velocity of 0.05 m s 1 . A high drag force at the particulate structure can overrule the cohesion within the structure during stretching process. Comparing to Ibrahim et al., with external excitation (here stretching) detachment of glass particle structures smaller than 100 μ m was observed at flow velocities of 0.05 mm s 1 .
Evaluating the size of the detached structures in the 2nd to 5th stretching cycle and the same elongation velocity, this trend is reversed, and detached structures become smaller with increasing superficial velocity. The detached structures in these stretching cycles could be structures that remained on the fiber after the first detachment of big structures. For a potential total filter system this might result in particle structures that do not move into downstream layers, but remain on the surface or at the raw gas side of the filter.
Figure 10 (BOTTOM, RIGHT and LEFT) depicts the cumulative fraction of detached particle structure as a function of the number of stretching cycle for the experiments with an elongation velocity of 1.2 mm s 1 and 12 mm s 1 , respectively. The superficial velocity remained constant at 0.05 m s 1 . Compared to the experiments with low elongation velocity (0.6 mm s 1 , see Figure 7 (BOTTOM)), the cumulative fraction of detached particulate structure increases in each stretching cycle if the elongation velocity rises to 1.2 mm s 1 and to 12 mm s 1 , respectively. For high superficial velocities, this trend (0.8 m s 1 ) is valid for all cycles including the first elongation cycle. For lower superficial velocities, this increase is more pronounced for the subsequent 2nd–5th cycle.
Considering the experiments with a superficial velocity of 0.05 m s 1 , the number of stretching cycles that are necessary for complete detachment of the initial particle structure is reduced by the increase of elongation velocity. This trend is also observed in the experiments with a superficial flow velocity of 0.8 m s 1 . A reason for this enhanced detachment of particle structure is the accelerated crack building due to higher shear stress which results in more energy at the crack tips [38]. The crack formation causes weakening of the structure by reducing cohesive bond between particle structures on the fiber. If the applied drag force remains the constant, particle structures detach more likely.

3.3. Development of Structure Size

Besides the initial height of the particle structure on the fiber, the applied process parameters as elongation velocity of the fiber and superficial velocity during the fiber stretching procedure have an influence on the re-arrangement and detachment process. For a rough estimation of the released particulate material that can be transported into downstream layers, the size of detached particle structures is measured immediately after detachment from one single fiber. In the following, the d 50 , 0 -values (hollow symbols) and the d 90 , 0 -values (filled symbols) are shown as characteristic values for the entire Q 0 -distribution of the detached particle structures. The characteristic values are defined as the particle size below 50 % or 90 % of the remaining number based particle distribution is placed. The data in Figure 11 underlines the trends in structure size caused by varying the process parameters. The complete Q 0 -distributions of all experiments are given in the supplementary data.
Figure 11 (LEFT) shows the measured size of particle structure as a function of the applied elongation velocity. Linear fits for the d 90 , 0 -values were calculated. For the experiment with a low particle loading on the fiber with an increase of elongation velocity the d 90 , 0 -values are increased. This clear trend is given for a small increase of elongation velocity from 0.6 mm s 1 to 1.2 mm s 1 and for a much bigger increase from 1.2 mm s 1 to 12 mm s 1 . The largest increase of d 90 , 0 is observed in the experiment with a superficial velocity of 0.8 m s 1 . The smallest reduction occurs at a flow velocity of 0.05 m s 1 . A high elongation velocity favors fast emerging of cracks within the particle structure on the fiber due to the high energy at the tip of cracks. The stress for formation of cracks is induced by the acceleration of substrate (see Figure 8 and Figure 9). In combination with a high drag force on the agglomerates due to the higher flow, large structures detach earlier during the stretching cycle [39].
The d 50 , 0 -value is slightly decreasing with increasing elongation velocity from 0.6 mm s 1 to 1.2 mm s 1 for all three values of superficial flow velocity. In the Q 0 -distributions (see supplementary data) of the corresponding experiments, this can be observed by a constant trend in the region below the 50% value. For the experiments with a high particle structure on the fiber, the characteristic structure sizes extracted from the Q 0 -distribution are larger than in the experiments with an low loading on the fiber. One reason for this is that the total height of the structure which is larger than with a low loading on the fiber (see Figure 8). However, as visible on the images, the average length l between the cracks of the high structures is larger than with a small structure on the fiber. This is based on the height on the matrix (particulate structure) on the stretchable substrate (fiber). A change of structure size as a function of elongation velocity is not detected yet for high structure on the fiber at the beginning of the experiment.
Figure 11 (RIGHT) shows the measured size values as a function of applied superficial velocity during the fiber stretching experiment. As mentioned before, the number median values d 50 , 0 do not differ much regardless the superficial velocity, except for the values for an elongation velocity of 12 mm s 1 , where a slight increase of the flow velocity is observed. The d 50 , 0 values are mainly below 250 μ m, so agglomerates of this size could pass through a fiber gap, which has a size 3-times the fiber diameter. The values of d 90 , 0 are decreasing with increasing superficial velocity for the experiments with low elongation velocities of 0.6 mm s 1 and 1.2 mm s 1 , respectively. For the d 90 , 0 -value of the experiments with an elongation velocity of 12 mm s 1 this trend is not visible for the highest flow velocity in the experiments. Furthermore, the difference between the d 90 , 0 -values for the experiments with 0.6 mm s 1 and 1.2 mm s 1 is very small. This fact proposes that the influence of elongation velocity on size of detached structures is less pronounced. Nevertheless, there is a clear impact on the timing for detachment, which was revealed in Section 3.1 and Section 3.2. In total, the size recordings show a clear trend for the experiments including the different elongation velocities and flow velocities. The largest detached structures are found in the experiments with low flow velocities and high elongation velocities. In addition to this, the structures at the mentioned range of settings already detach during low fiber elongations. As a consequence, little installation space is needed for a potential filter system.
However, due to the fiber distance, which has been mentioned in Section 1, some of the particle structures might be to large to pass through gaps between fibers. As a result, the structures might re-arrange on the filter surface in the area of raw gas.

4. Conclusions and Outlook

In this study, a detailed view on the influence of process parameters such as particle loading time of the fiber (height of particle structure), elongation velocity and superficial velocity on the detachment behavior of particle structures is shown. In detail, the size of the structures and the time of detachment from an elastic fiber are of interest, whether the particles are able to pass between fibers into the lower layers of the filter.
For the first time a measurement technique for online characterization of the detached particle structures during the entire stretching process of a loaded stretchable single fiber was constructed. Furthermore, a developed method to characterize the fiber loading by image analysis during five consecutive stretching cycle was applied. The size of the detached structures was measured using a laser sheet technique, which also provides information on the respective point in time of the detachment. The fiber loading time was varied between 5 min and 15 min. The elongation velocity and the superficial velocity were systematically varied between 0.6–12 mm s 1 and (0.05–0.8 m s 1 ). The main results are:
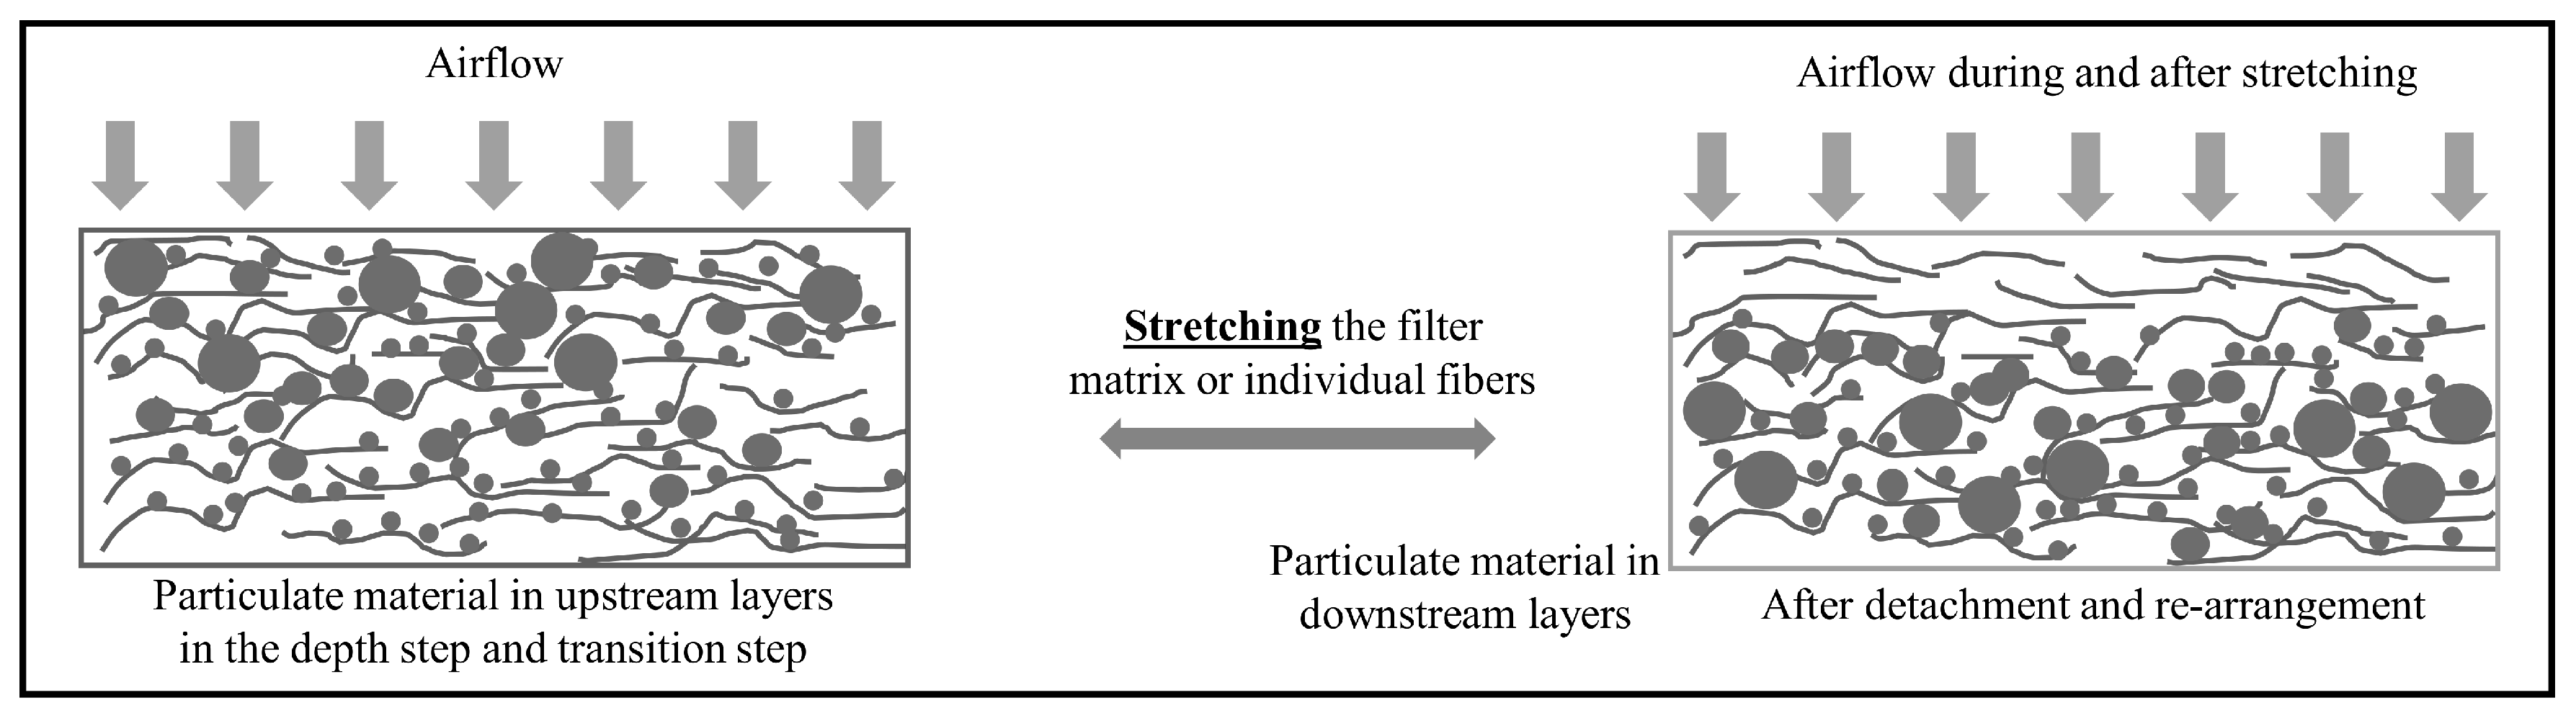
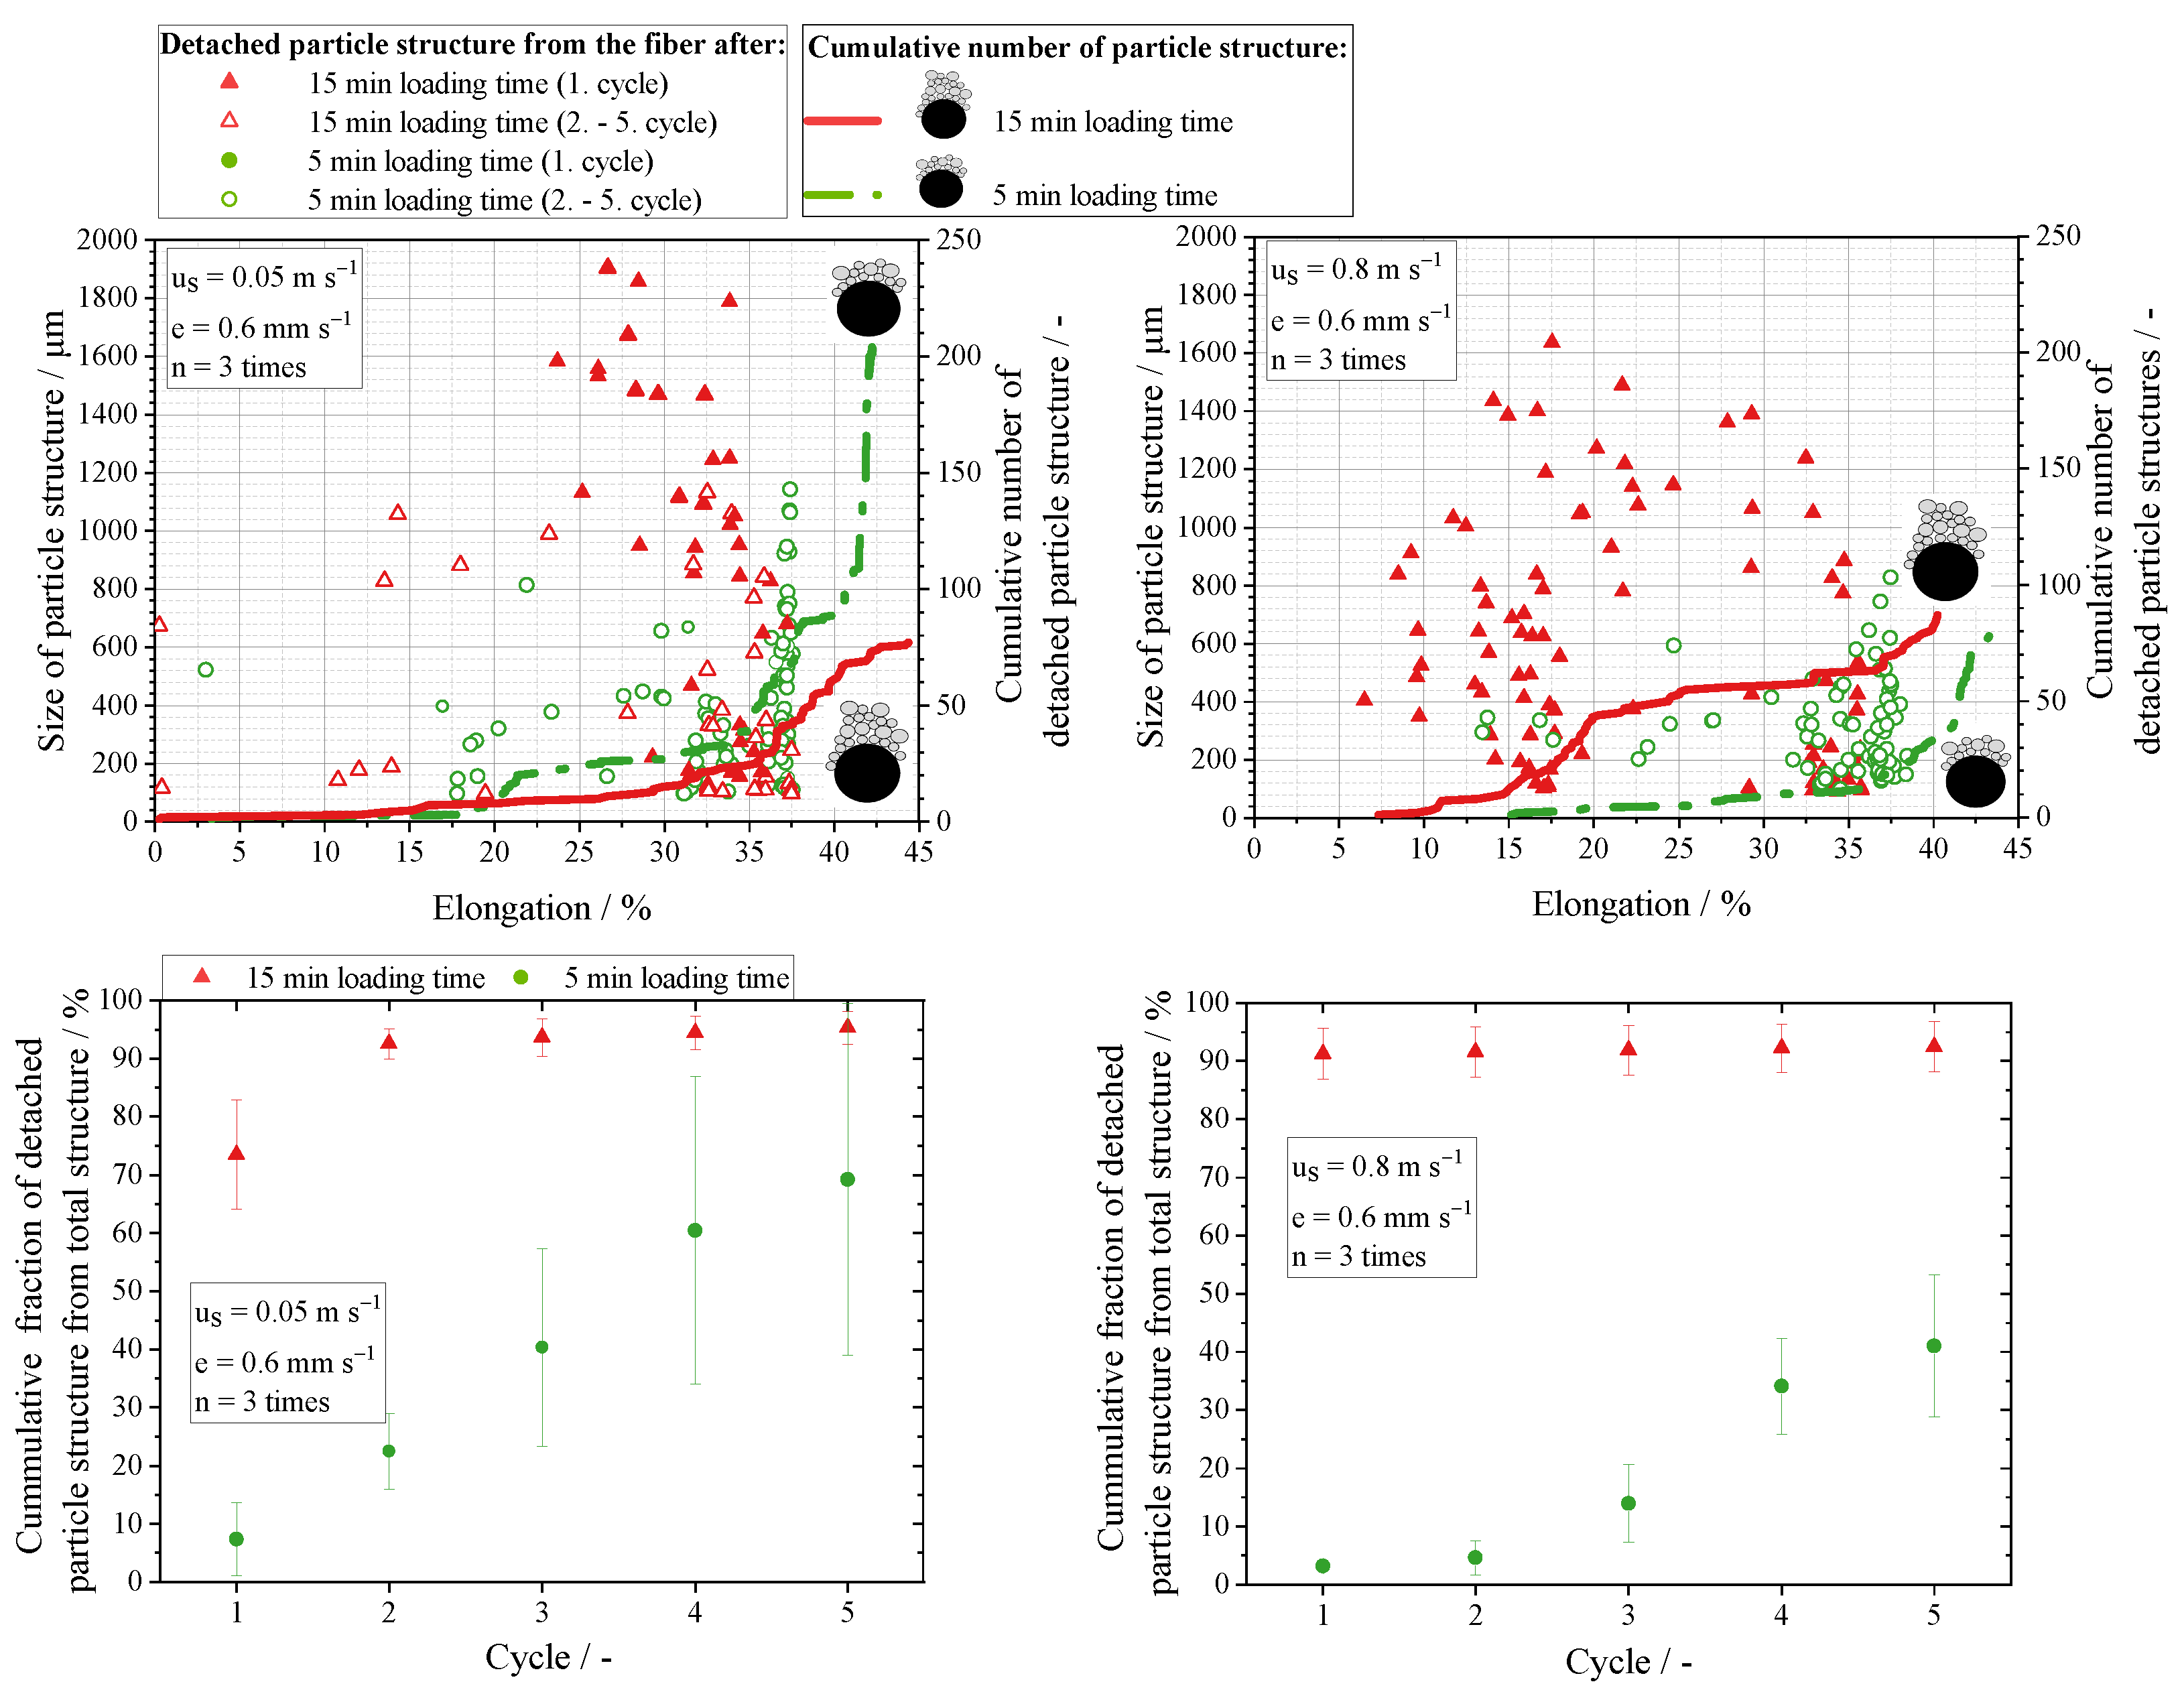
  • The application of multiple excitation cycle induces shear stress multiple times to the particle structure therefore enables complete detachment of the huge and compact particle structure from the stretchable filter fiber at low gas flow velocities of 0.05 m s 1 .
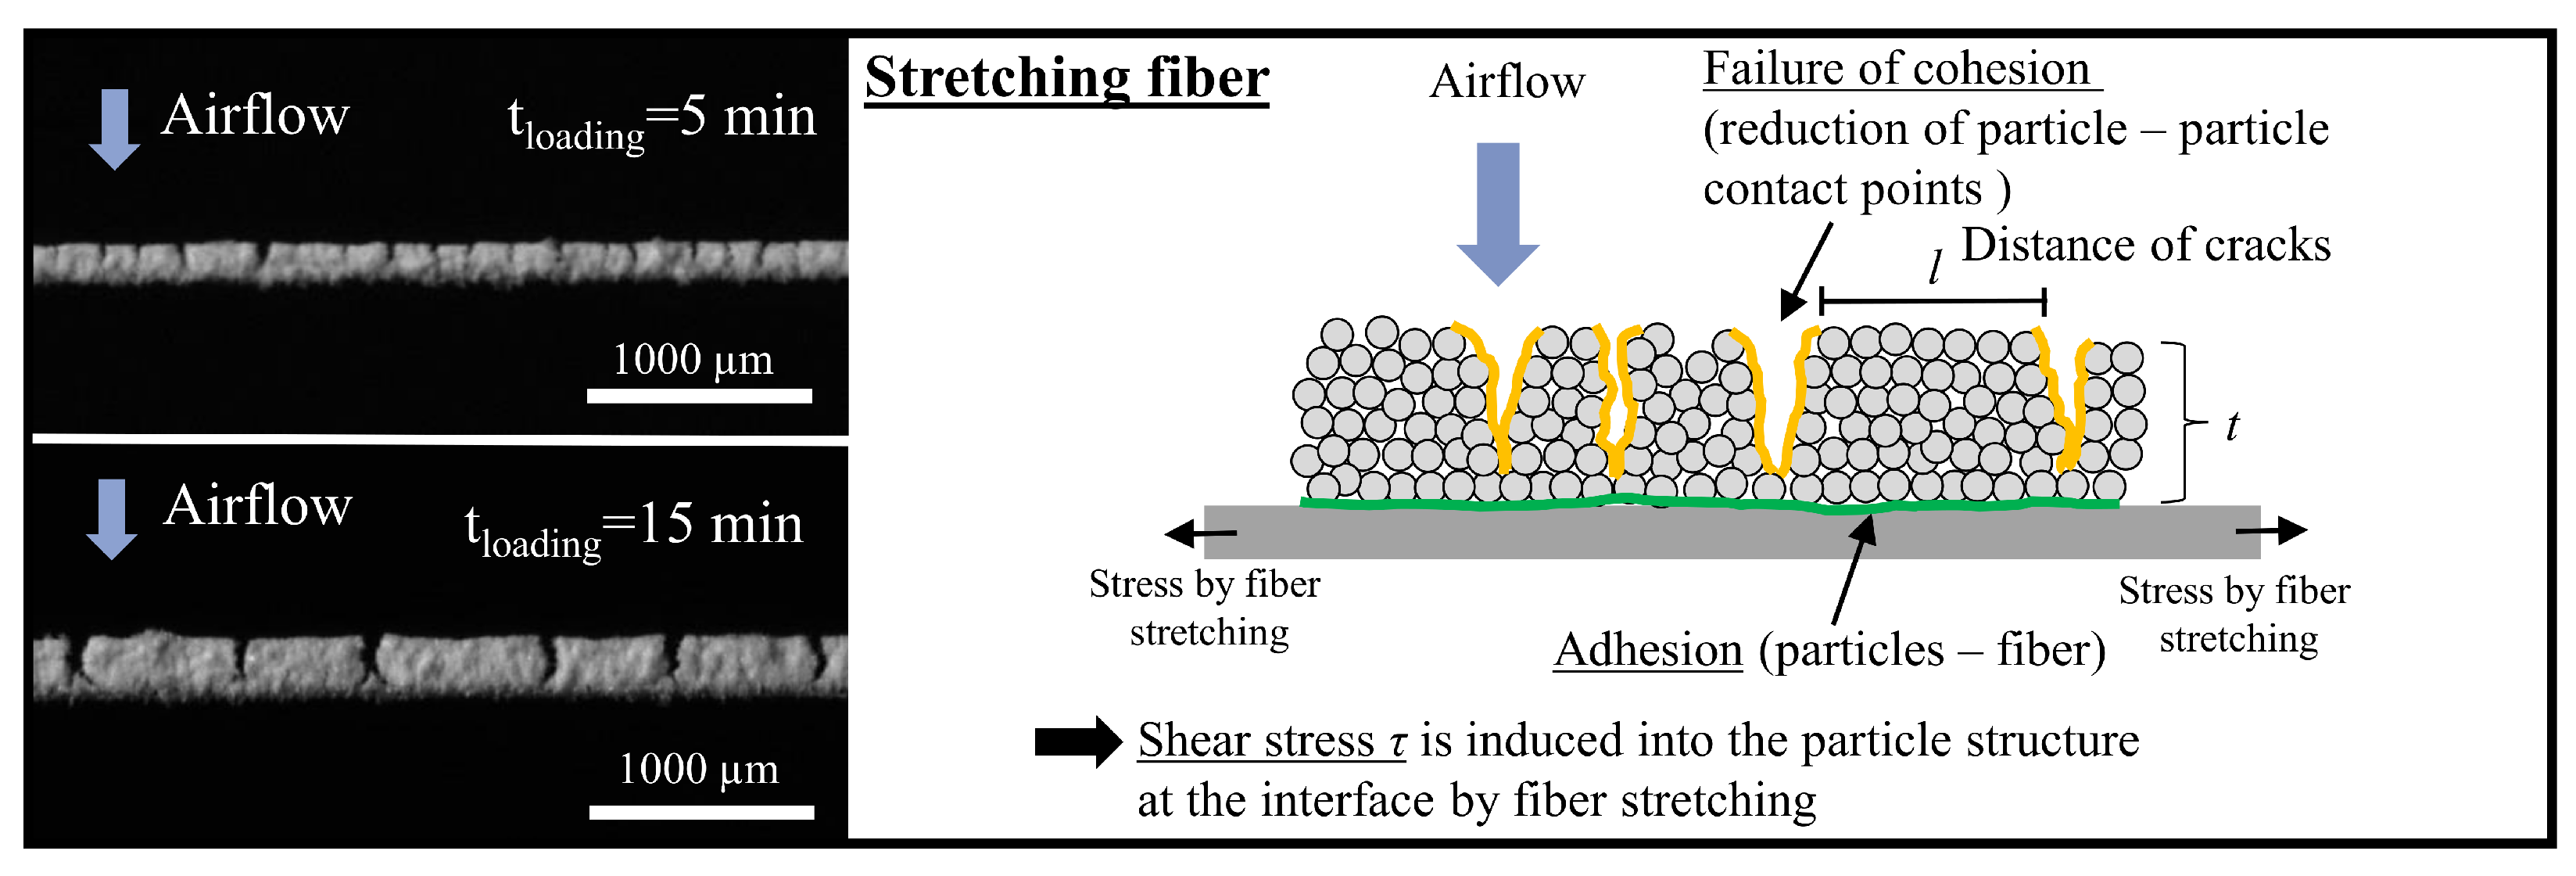
  • High initial particle loading (15 min) on the fiber induces detachment of larger particle structures from the fiber than for small initial particle loading (5 min) due to development of larger crack distances l during the stretching procedure and more particulate material on the fiber. The detected particle structures will be able to pass gaps between fibers in a total fibrous filter.
  • For high initial particle loading on the fiber, the detachment of structures starts at lower fiber elongation than for small particle structures on the fiber, regardless the superficial velocity. This fact suggests with a higher loading within the total filter, less stretching distance is required for the same detachment success.
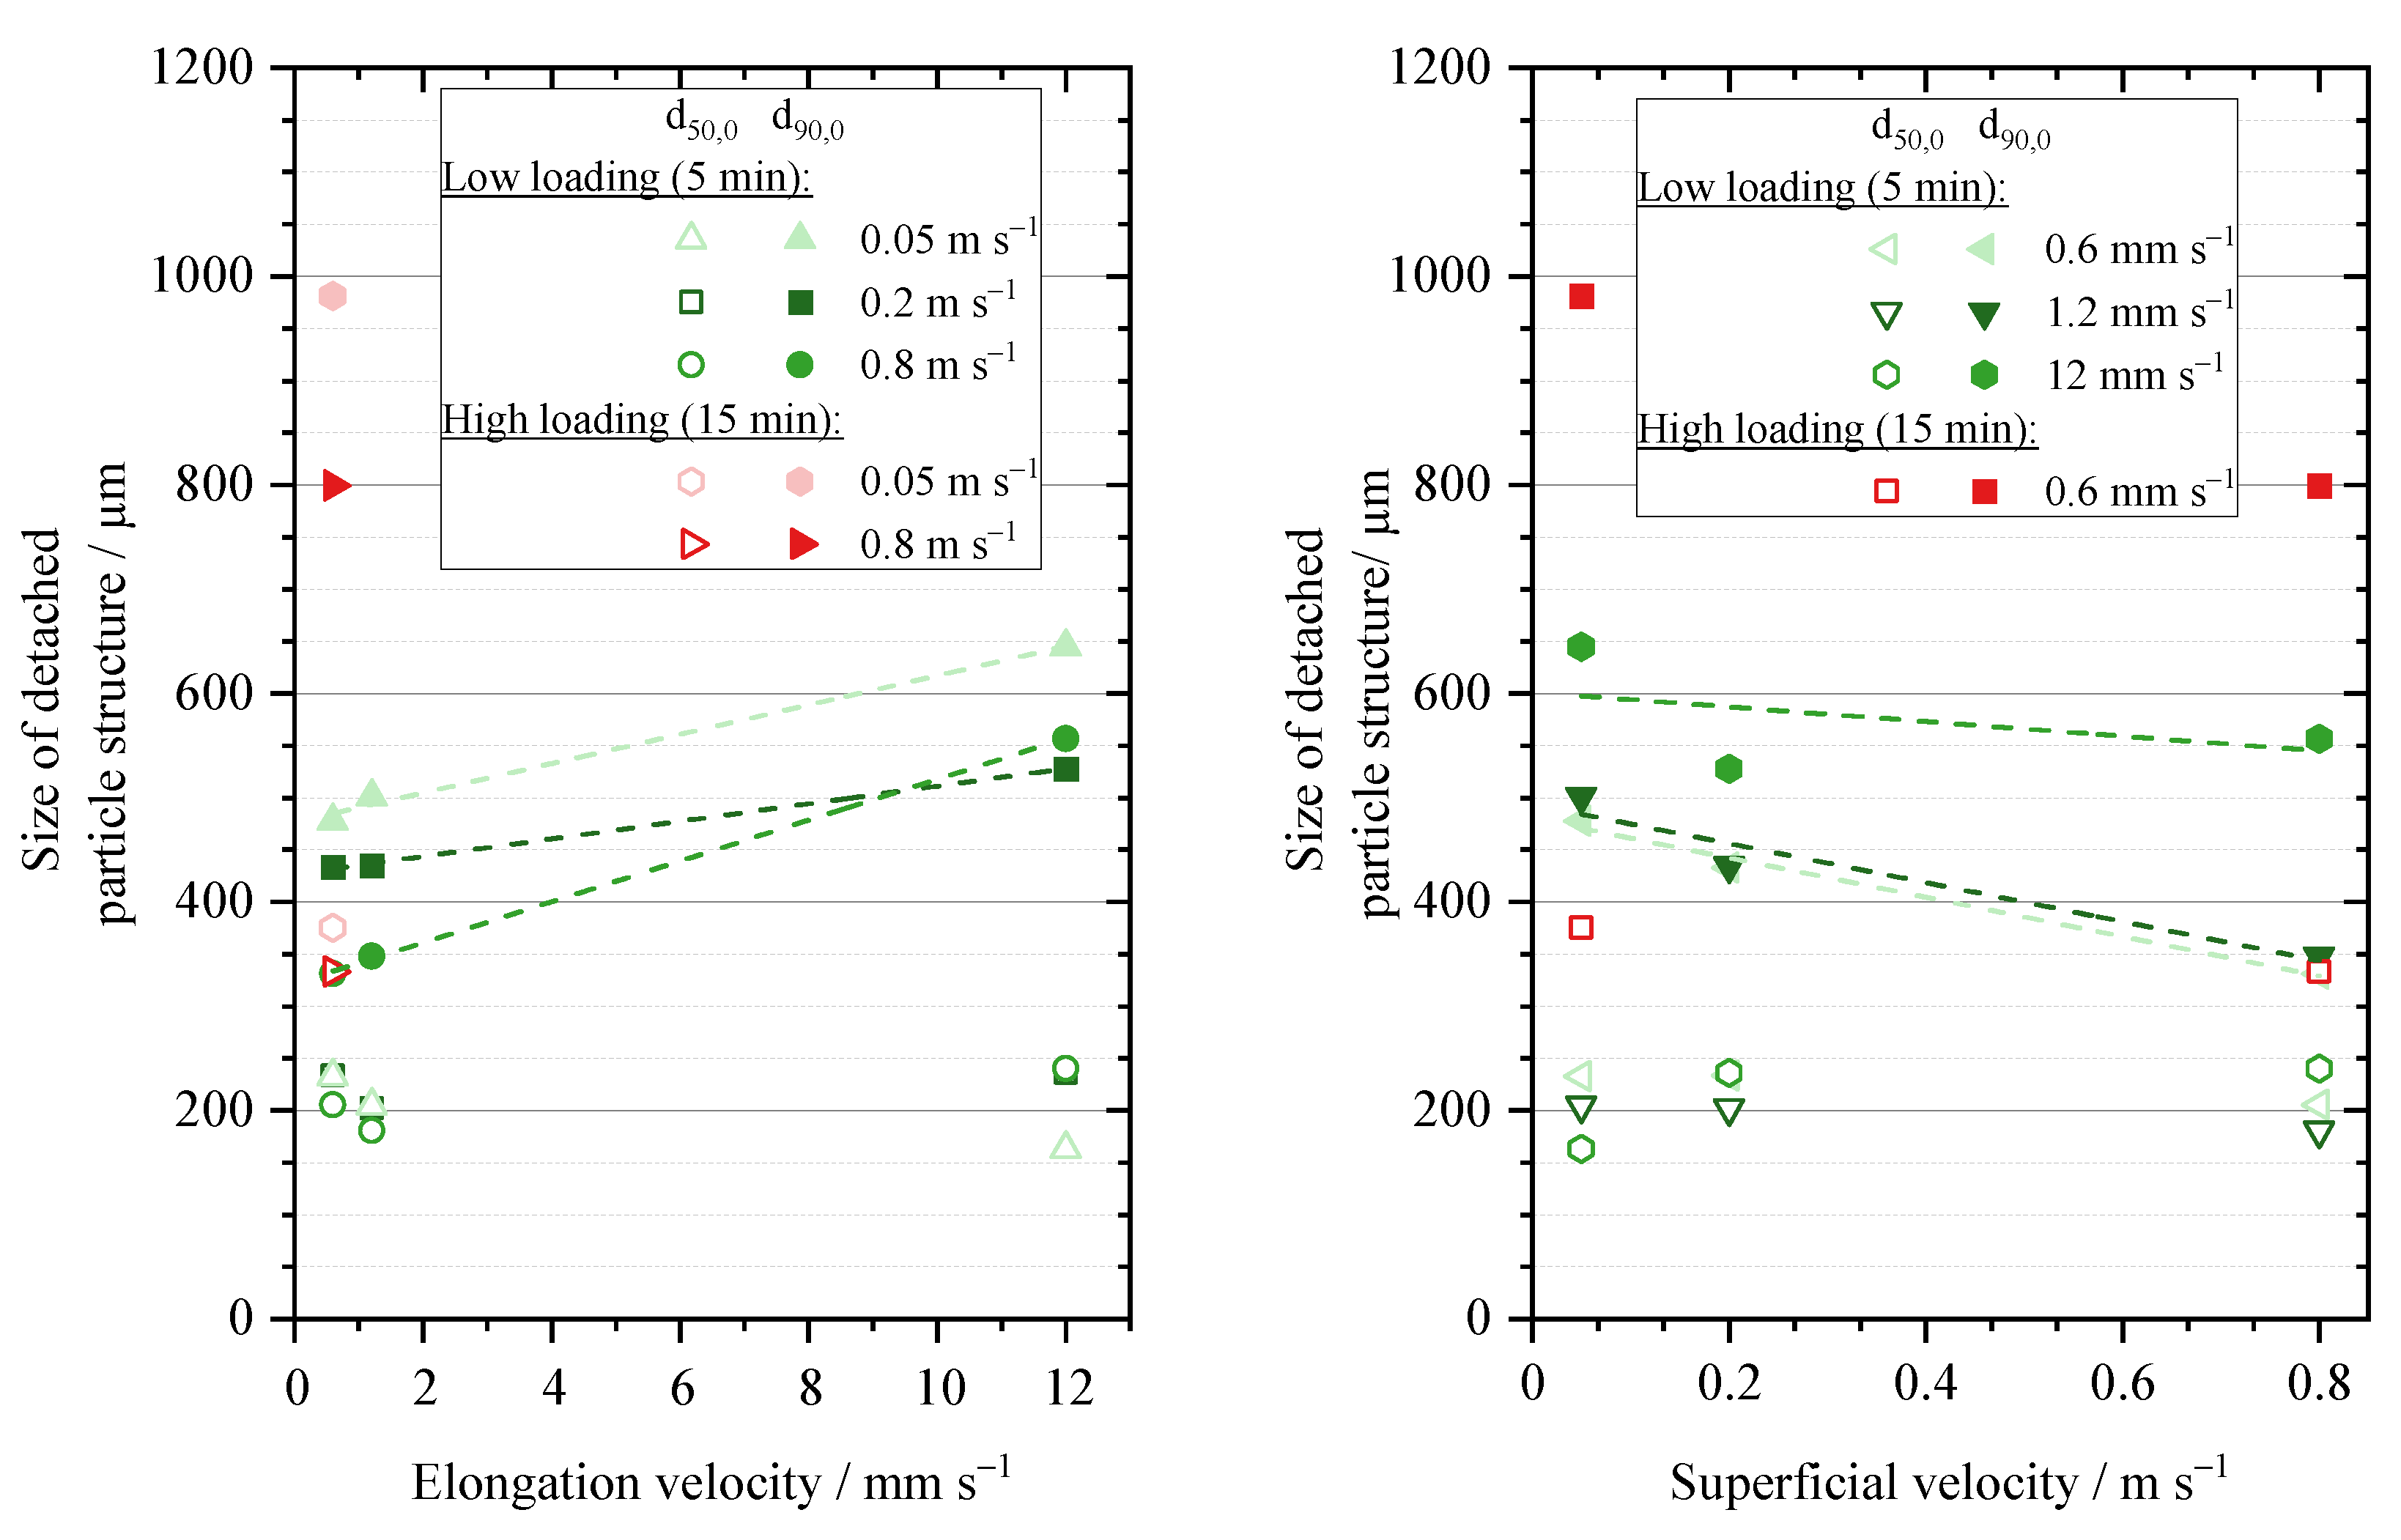
  • For small initial structures on the fiber, an increase in elongation velocity causes earlier detachment of particle fragments during the first and the 2nd–5th stretching cycle due to faster development of cracks within the particulate structure.
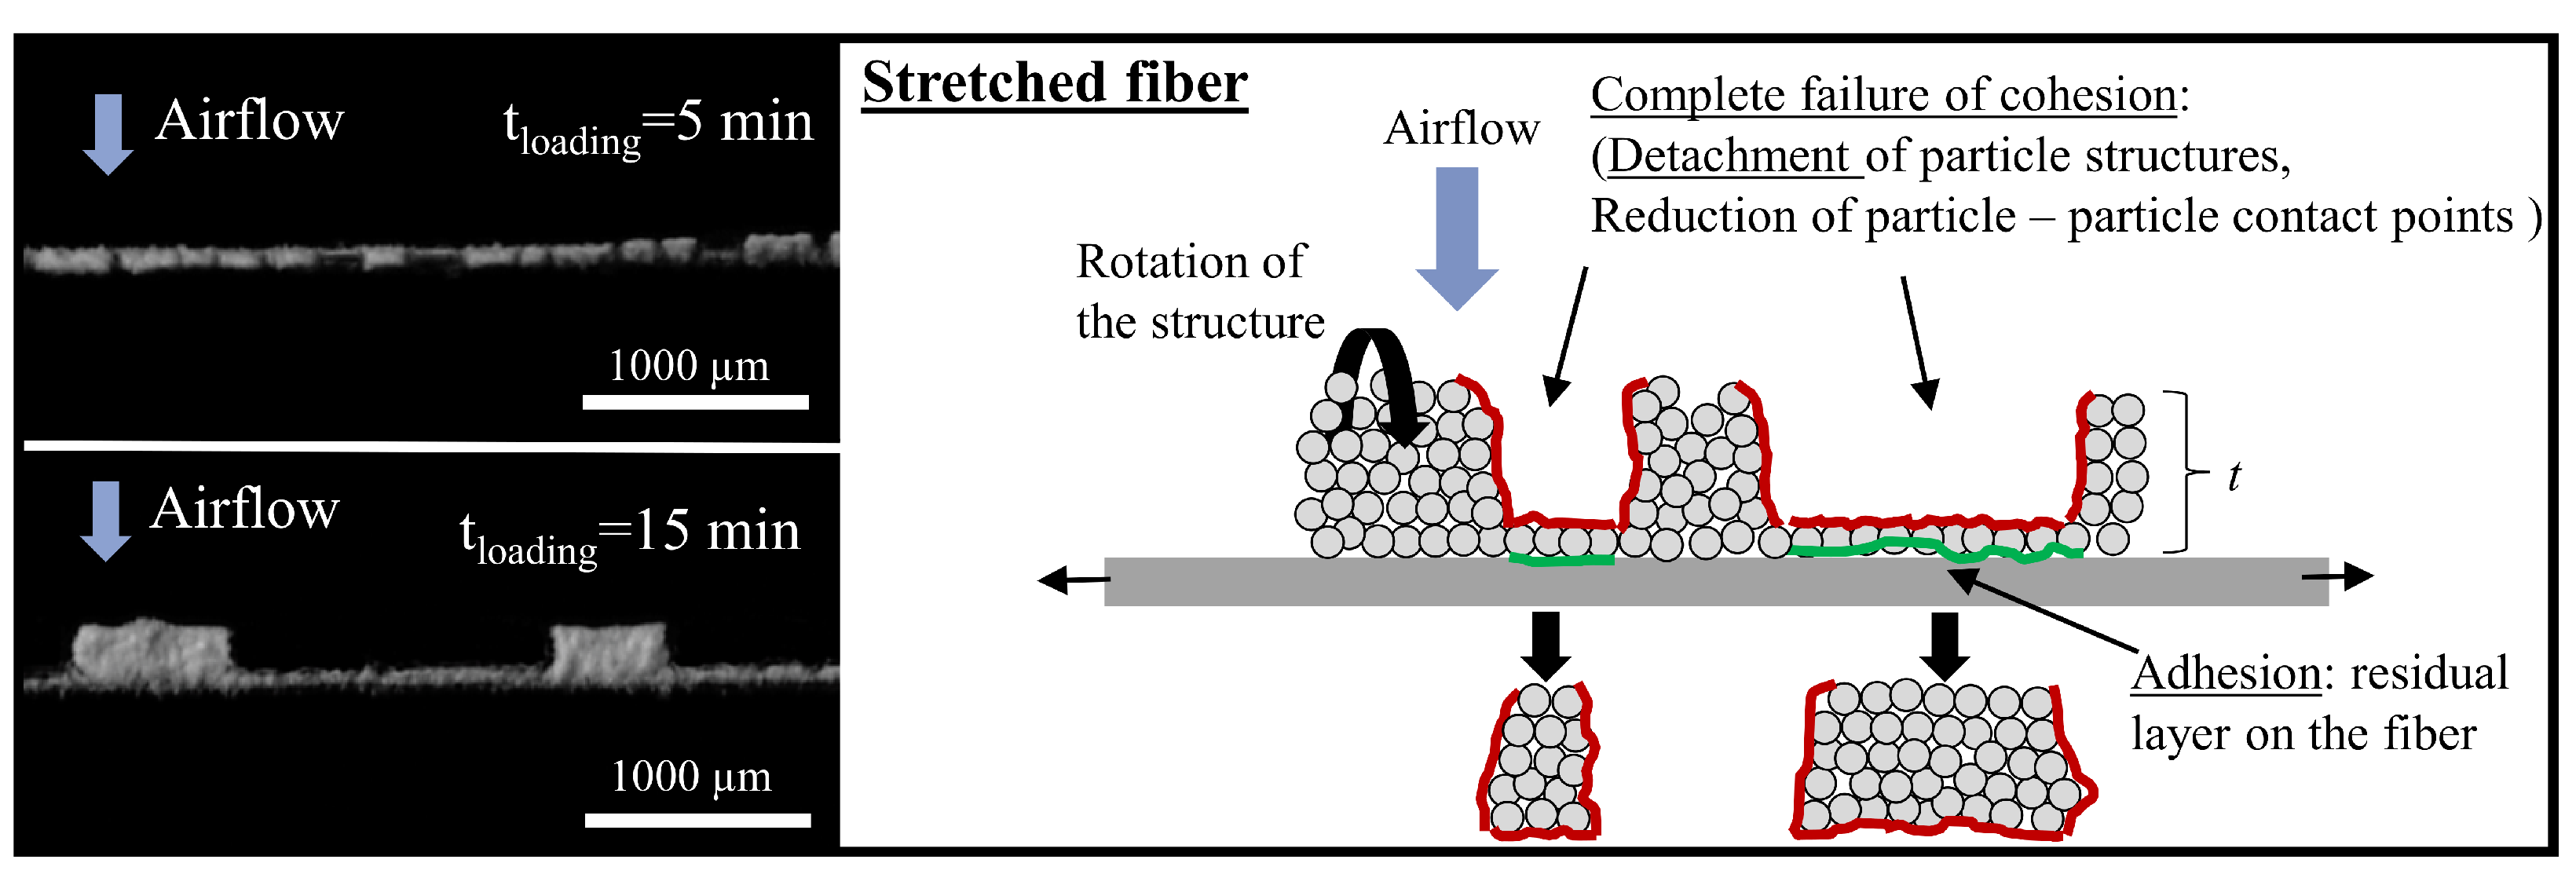
  • Detachment of particle structures occurs more likely after failure of cohesion—A small residual layer of particles remains on the fiber after the first stretching cycle due to adhesion.
  • The number of required stretching cycles for “complete detachment” is reduced by the increase of the elongation velocity.
  • The combination of low elongation velocity and low superficial velocity favours detachment of small particle structures from the fiber that can move into downstream layers of a potential filter.
  • For the experiments with an elongation velocity of 0.6 mm s 1 and a small initial structure on the fiber, detachment only is detected in the 2nd–5th cycle, regardless of the superficial velocity.
  • Regardless the superficial velocity during the fiber stretching procedure, the size of d 90 , 0 is increased by an increase of elongation velocity.
  • With an external excitation, detachment of glass particle structures smaller than 100 μ m are observed at flow velocities of 0.05 m s 1 .
  • Detachment of particle structures (piles of particles) is initiated at a superficial velocity below 1.2 m s 1 due to the multiple external excitation (fiber stretching) which causes emerging cracks and the break up of the initial structure on the fiber.
  • Detachment of particle fragments is increased due to external excitation within the range of operation filtration velocity. The size of detached structures presumes that detachment within a filter is possible, but probably no penetration through the entire filter will occur.
Based on these findings, investigations on the detachment behavior of particle structures from a loaded fiber array during stretching and simultaneous flow will be carried out in the future. Online observations of the loading procedure and the detachment of particle structure from the fiber array during the elongation are pending. A more detailed investigation of the adhesion and cohesion forces between fiber and particles is planned to gain more knowledge about the magnitude of these forces. Furthermore, clogging effects (bridging effects) during the loading procedure of a parallel fiber array will be investigated. The application of elastic fibers in filter media is an initiator for adaptive filter systems in the future.

Author Contributions

Conceptualization, A.D., J.M. and L.P.; methodology, L.P.; software, L.P.; validation, A.D. and J.M.; formal analysis, L.P.; investigation, A.D.; resources, A.D.; data curation, L.P.; writing—review and editing, A.D., J.M. and L.P.; visualization, L.P.; supervision, A.D. and J.M.; project administration, A.D. and J.M.; funding acquisition, A.D. All authors have read and agreed to the published version of the manuscript.

Funding

We gratefully acknowledge that this project was funded by the Deutsche Forschungsgemeinschaft (DFG, German Research Foundation)–427981860.

Institutional Review Board Statement

Not applicable.

Informed Consent Statement

Not applicable.

Data Availability Statement

Poggemann, Lukas (2022), “Experimental Detection of Particle Structures Detachment From a Stretchable Single Fiber During Multiple Consecutive Stretching Cycles”, Mendeley Data, V1, doi: 10.17632/242dvfx9h8.1.

Acknowledgments

We acknowledge support by the KIT-Publication Fund of the Karlsruhe Institute of Technology. We kindly thank Freudenberg Filtration Technologies SE & Co. KG for donating fiber material to this research. We also kindly thank Friedhelm Klingel for his expertise and help in designing the optical system of the laser light sheet technique.

Conflicts of Interest

The authors follow no commercial interest with this study.

Abbreviations

The following abbreviations are used in this manuscript:
DFGDeutsche Forschungsgemeinschaft
LSDSLarge Structure Detection System
pro. a.Projection Area
PMPhotomultiplier
MFCMass Flow Controller

References

  1. Song, C.B.; Park, H.S.; Lee, K.W. Experimental study of filter clogging with monodisperse PSL particles. Powder Technol. 2006, 163, 152–159. [Google Scholar] [CrossRef]
  2. Payet, S.; Boulaud, D.; Madelaine, G.; Renoux, A. Penetration and pressure drop of HEPA Filter during loading with submicron liquid particle. J. Aerosol Sci. 1992, 23, 723–735. [Google Scholar] [CrossRef]
  3. Bourrous, S.; Bouilloux, L.; Ouf, F.X.; Appert-Collin, J.C.; Thomas, D.; Tampère, L.; Morele, Y. Measurement of the Nanoparticles Distribution in Flat and Pleated Filters During Clogging. Aerosol Sci. Technol. 2014, 48, 392–400. [Google Scholar] [CrossRef] [Green Version]
  4. Bourrous, S.; Bouilloux, L.; Ouf, F.X.; Lemaitre, P.; Nerisson, P.; Thomas, D.; Appert-Collin, J.C. Measurement and modeling of pressure drop of HEPA filters clogged with ultrafine particles. Powder Technol. 2016, 289, 109–117. [Google Scholar] [CrossRef]
  5. Thomas, D.; Penicot, P.; Contal, P.; Leclerc, D.; Vendel, J. Clogging of fibrous filters by solid aerosol particles Experimental and modelling study. Chem. Eng. Sci. 2001, 56, 3549–3561. [Google Scholar] [CrossRef]
  6. Brown, R.C. Air Filtration: An Integrated Approach to the Theory and Applications of Fibrous Filters; Pergamon Press Ltd.: Oxford, UK, 1993. [Google Scholar]
  7. Verein Deutscher Ingenieure. VDI 3677; Filternde Abscheider Tiefenfilter aus Faser; Verein Deutscher Ingenieure: Dusseldorf, Germany, 2004. [Google Scholar]
  8. Jackiewicz, A.; Jakubiak, S.; Gradoń, L. Analysis of the behavior of deposits in fibrous filters during non-steady state filtration using X-ray computed tomography. Sep. Purif. Technol. 2015, 156, 12–21. [Google Scholar] [CrossRef]
  9. Tippayawong, N.; Preechawuttipong, I. (Eds.) Modified kinetic model of particle detachment by aerodynamic drag and vibration. In Proceedings of the World Congress on Engineering and Computer Science, London, UK, 30 June–2 July 2010; Volume II. [Google Scholar]
  10. Poggemann, L.; Meyer, J.; Dittler, A. A novel method to investigate detachment of particulate structures from an elastic single fiber at low gas flow velocities. J. Aerosol Sci. 2021, 156, 105785. [Google Scholar] [CrossRef]
  11. Jankowska, E.; Reponen, T.; Willeke, K.; Sergey, A.G.; Choi, K.J. Collection of fungal spores on air filters and spore reentrainment from filters into air. J. Aerosol Sci. 2000, 31, 969–978. [Google Scholar] [CrossRef]
  12. Larsen, R.I. The Adhesion and Removal of Particles Attached to Air Filter Surfaces. Am. Ind. Hyg. Assoc. J. 1958, 19, 265–270. [Google Scholar] [CrossRef]
  13. Löffler, F. Abblasen von an Filterfasern abgeschiedenen Feststoffteilchen. Verfahrenstechnik 1972, 6, 3–7. [Google Scholar]
  14. Przekop, R.e.a. Lattice-Boltzmann approach for description of the structure of deposited particulate matter in fibrous filters. J. Aerosol Sci. 2003, 34, 133–147. [Google Scholar] [CrossRef]
  15. Qian, Y.; Willeke, K.; Ulevicius, V.; Grinshpun, S.A. Particle Reentrainment from Fibrous Filters. Aerosol Sci. Technol. 1997, 27, 394–404. [Google Scholar] [CrossRef]
  16. Zoller, J.; Zargaran, A.; Braschke, K.; Meyer, J.; Janoske, U.; Dittler, A. Experimental Investigation of Reactive-Inert Particulate Matter Detachment from Metal Fibres at Low Flow Velocities and Different Gas Temperatures. Aerosol Sci. Eng. 2020. [Google Scholar] [CrossRef]
  17. Beuth, J.L. Cracking of thin bonded films in residual tension. Int. J. Solids Struct. 1992, 29, 1657–1675. [Google Scholar] [CrossRef]
  18. Thouless, M.D. Crack Spacing in Brittle Films on Elastic Substrates. J. Am. Ceram. Soc. 1990, 73, 2144–2146. [Google Scholar] [CrossRef]
  19. Leung, W.W.F.; Choy, H.F. Transition from depth-to-surface filtration for a high-efficiency, high-skin effect, nanofiber filter under continuous nano-aerosol loading. Chem. Eng. Sci. 2018, 182, 67–76. [Google Scholar] [CrossRef]
  20. Wurster, S.; Kampa, D.; Meyer, J.; Müller, T.; Mullins, B.J.; Kasper, G. Measurement of oil entrainment rates and drop size spectra from coalescence filter media. Chem. Eng. Sci. 2015, 132, 72–80. [Google Scholar] [CrossRef]
  21. Wurster, S. Entrainment von Öltropfen an der Rückwand eines Faserfilters. Ph.D. Thesis, Karlsruhe University, Karlsruhe, Germany, 2017. [Google Scholar]
  22. Japuntich, D.A.; Stenhouse, J.I.T.; Liu, B.Y.H. Experimental Results of solid monodisperse particle clogging of fibrous filters. J. Aerosol Sci. 1994, 25, 385–393. [Google Scholar] [CrossRef]
  23. Bahners, T.; Schollmeyer, E. Computer simulation of the filtration process in a fibrous filter collecting polydisperse dust. J. Aerosol Sci. 1986, 17, 191–200. [Google Scholar] [CrossRef]
  24. Schweers, E.; Umhauer, H.; Löffler, F. Experimental Investigation of Particle Collection on Single Fibres of Different Configurations. Part. Part. Syst. Charact. 1994, 11, 275–283. [Google Scholar] [CrossRef]
  25. Hoppe, K.; Maricanov, M.; Schaldach, G.; Zielke, R.; Renschen, D.; Tillmann, W.; Thommes, M.; Pieloth, D. Modeling the separation performance of depth filter considering tomographic data. Environ. Prog. Sustain. Energy 2020, 39. [Google Scholar] [CrossRef] [Green Version]
  26. Müller, T. Trägheitsabscheidung von Partikeln an parallelen Faserarrays; Verfahrenstechnik, Dr. Hut: München, Germany, 2017. [Google Scholar]
  27. Kanaoka, C.; Hiragi, S. Pressure Drop Of Air Filter With Dust Load. J. Aerosol Sci. 1990, 21, 127–137. [Google Scholar] [CrossRef]
  28. Kanaoka, C.; Emi, H.; Myojo, T. Simulation of the growing process a particle dendrite and evaluation of a single fiber collection efficiency with dust load. J. Aerosol Sci. 1979, 1980, 377–389. [Google Scholar] [CrossRef]
  29. Kuwabara, S. The Forces experienced by Randomly Distributed Parallel Circular Cylinders or Spheres in a Viscous Flow at Small Reynolds Numbers. J. Phys. Soc. Jpn. 1959, 14, 527–532. [Google Scholar] [CrossRef]
  30. Zoller, J.; Zargaran, A.; Braschke, K.; Meyer, J.; Janoske, U.; Dittler, A. Morphology of particulate deposits formed on a single filter fibre by exposure to mixed aerosol flow. J. Aerosol Sci. 2020, 152, 105718. [Google Scholar] [CrossRef]
  31. Kanaoka, C.; Emi, H.; Hiragi, S.; Myojo, T. Morphology of particulate agglomerates on a cylindrical fiber and a collection efficiency of a dust loaded fiber. Aerosols: Form. React. 1986, 2, 674–677. [Google Scholar]
  32. Kasper, G.; Schollmeier, S.; Meyer, J. Structure and density of deposits formed on filter fibers by inertial particle deposition and bounce. J. Aerosol Sci. 2010, 41, 1167–1182. [Google Scholar] [CrossRef]
  33. Broßmann, R. Die Lichtstreuung an kleinen Teilchen als Grundlage einer Teilchengrößenbestimmung. Ph.D. Thesis, Technische Hochschule, Karlsruhe, Germany, 1966. [Google Scholar]
  34. Leschonski, K. Partikelmeßtechnik. Berichte der Bunsengesellschaft für physikalische Chemie 1984, 88, 1112–1123. [Google Scholar] [CrossRef]
  35. Hamamatsu Photonics K.K. Electron Tube Division. In Photomultiplier Tubes: Basics and Application; Hamamatsu Photonics K.K. Electron Tube Division: Hamamatsu, Japan, 2007. [Google Scholar]
  36. Zoller, J.; Zargaran, A.; Braschke, K.; Meyer, J.; Janoske, U.; Dittler, A. A Novel Apparatus for Simultaneous Laser-Light-Sheet Optical Particle Counting and Video Recording in the Same Measurement Chamber at High Temperature. Sensors 2022, 22, 1363. [Google Scholar] [CrossRef]
  37. Otsu, N. A Threshold Selection Method from Gray-Level Histograms. IEEE Trans. Syst. Man, Cybern. 1979, 9, 62–66. [Google Scholar] [CrossRef] [Green Version]
  38. Nahta, R.; Moran, B. Crack Spacing in Brittle Films on Dissimilar Planar and Axisymmetric Elastic Substrates. Eng. Fract. Mech. 1995, 52, 513–524. [Google Scholar] [CrossRef]
  39. Nahta, R.; Moran, B. Film cracking and debonding in a coated fiber. Int. J. Fract. 1996, 79, 351–372. [Google Scholar] [CrossRef]
Figure 1. Schematic of the filter matrix, in a cross section. LEFT: Normal mass accumulation matrix during the first (depth filter step) and the second filter step (transition step). Ref. [4] RIGHT: Potential distribution of particulate material after detachment and re-arrangement of particles within the filter matrix. Fiber stretching was used to initiate detachment to clear up some void space. Modified from VDI 3677 [7].
Separations 09 00168 g001
Figure 2. Schematic setup to produce an aerosol containing glass spheres and the deposition on a single fibre that is clamped at the fiber mounting device [10].
Separations 09 00168 g002
Figure 3. (LEFT): Images (in the side view) of the loaded fiber after 5 min loading time (TOP) and after 15 min loading time (BOTTOM).Direction of airflow from the top to the bottom. Illumination from the front. (RIGHT): Schematic of the loaded fiber in the non-stretched state. Marked is the state of the interfacial layer and the condition of stress.
Separations 09 00168 g003
Figure 4. Procedure of a stretching experiment including the multiple stretching cycles (5 times).
Separations 09 00168 g004
Figure 5. Image (A) and schematic diagram (B) of the laser-light sheet measurement system. An expanded laser beam (thin sheet) runs below the fiber (shown in Figure 6B). The scattered light within the measurement area is captured focused onto a PM and transferred into electrical impulses.
Separations 09 00168 g005
Figure 6. (A): Relative signal of beam intensity profile, measured in horizontal direction of laser sheet (below the fiber), total horizontal length of laser sheet 16 mm. (B): Image of laser sheet in the measurement chamber. Here the laser light sheet is projected onto a piece of paper below the stretchable fiber. Distorted view due to viewing angle.
Separations 09 00168 g006
Figure 7. (TOP) Size and cumulative number of detached particle structures measured with the LSDS during the five cycles of fiber stretching, comparing low (5 min loading time, green) and high (15 min loading time, red) particle loading of the fiber for two superficial velocities ( u s = 0.05 m s 1 , left and u s = 0.8 m s 1 , right, respectively). (BOTTOM) Cumulative fraction of the detached particle structures from total particle structure determined with image analysis during the 5 cycles of fiber stretching.
Separations 09 00168 g007
Figure 8. (LEFT): Images (side view) of the loaded fiber after 5 min loading time (TOP) and after 15 min loading time (BOTTOM) at 8% fiber elongation during the first stretching cycle. Same elongation velocity of 0.6 mm s 1 . Illumination of the structure from the front. (RIGHT): Schematic of the loaded fiber in the stretched state. Marked the physical state of the interfacial layer.
Separations 09 00168 g008
Figure 9. (LEFT): Images (side view) of the loaded fiber after 5 min loading time (TOP) and after 15 min loading time (BOTTOM) at 20% fiber elongation during the second stretching cycle. Same elongation velocity of 0.6 mm s 1 . Illumination of structure from the front. (RIGHT): Schematic of the loaded fiber in the stretched state. Marked the physical state at the interfacial layer.
Separations 09 00168 g009
Figure 10. (TOP) Size and cumulative number of detached particle structures measured with the LSDS during the 5 cycles of fiber stretching. Comparing two different elongation velocities (1.2 mm s 1 , left; 12 mm s 1 , right) for two different superficial velocities during the stretching procedure (0.8 m s 1 and 0.05 m s 1 , respectively). (BOTTOM) Cumulative fraction of the detached particle structures from total particle structure.
Separations 09 00168 g010
Figure 11. d 50 , 0 and d 90 , 0 values of detached particle structures as function of elongation velocity (LEFT) and superficial velocity (RIGHT). All structures detached within 5 cycles of fiber stretching with the given parameters. Linear fits of the development of d 90 , 0 values.
Separations 09 00168 g011
Table 1. Variation of loading time, average flow velocity, superficial velocity and elongation velocity.
Fibre Loading Time/minAverage Flow Velocity during Loading Procedure/m s 1 Superficial Velocity ( u s ) during the Stretching/Relaxation Process/m s 1 Elongation Velocity (e)/mm s 1
5; 151.20.05; 0.2; 0.80.6; 1.2; 2.0; 12.0
Publisher’s Note: MDPI stays neutral with regard to jurisdictional claims in published maps and institutional affiliations.

