Article

Targeted UHPLC-ESI-MS/MS Analysis of Selected Neurotransmitters, Tryptophan and Its Metabolite Kynurenine in Tau Transgenic Rat Brain Tissue: A Pivotal Study

1
Department of Pharmaceutical Analysis and Nuclear Pharmacy, Faculty of Pharmacy, Comenius University in Bratislava, Odbojarov 10, SK-832 32 Bratislava, Slovakia
2
Toxicological and Antidoping Center, Faculty of Pharmacy, Comenius University in Bratislava, Odbojárov 10, SK-832 32 Bratislava, Slovakia
3
Institute of Neuroimmunology, Slovak Academy of Science, Dubravska Cesta 9, SK-845 10 Bratislava, Slovakia
4
Institute of Virology, Biomedical Research Center Slovak Academy of Science, Dubravska Cesta 9, SK-845 05 Bratislava, Slovakia
*
Author to whom correspondence should be addressed.
Separations 2022, 9(1), 16; https://doi.org/10.3390/separations9010016
Submission received: 16 December 2021 / Revised: 4 January 2022 / Accepted: 11 January 2022 / Published: 14 January 2022

Abstract

:
Neurotransmitters (NT) are widely distributed in the central nervous system. These molecules are important for many physiological processes and the function of the immune system. Imbalance of NT are linked to numerous neurological disorders and diseases, including tauopathies. Here, a targeted approach based on on-line combination of ultra-high performance liquid chromatography with tandem mass spectrometry was validated and applied to the quantitative analysis of nine NT (acetylcholine, choline, aspartic acid, asparagine, glutamic acid, glutamine, pyroglutamate, γ-aminobutyric acid, N-acetyl-L-aspartic acid), tryptophan and its metabolite kynurenine in brain tissue samples of a rat model for tauopathy. The applied analytical method was characterized by excellent validation parameters for all analytes, such as limits of detection in the range of 0.01–1.70 µg/mL, regression coefficients of the calibration curves ≥ 0.9946, intra-day and inter-day precision expressed as coefficient of variation in the range of 0.6–11.9% and 0.6–14.4%, and accuracy in the range of 87.6–107.1% and 87.2–119.6%. Our analytical approach led to the identification of increased levels of choline and γ-aminobutyric acid in pons, and elevated concentration levels of pyroglutamate in medulla oblongata. These findings indicate that NT could play a valuable role in the study and clarification of neuroinflammation and neurodegenerative diseases.

1. Introduction

Tau represents a microtubule-associated protein responsible for stabilizing neuronal microtubules and promoting axonal outgrowth [1]. Tau undergoes several post-translational modifications such as phosphorylation, oxidation, glycation, glycosylation, ubiquitination, nitration, and truncation that promote its transition from soluble into insoluble form. The transition of tau protein from its highly soluble form into insoluble aggregates is common in several neurodegenerative disorders known as tauopathies [2]. Tau-positive deposits in the brain were identified in progressive neurodegenerative disorders such as Alzheimer’s disease (AD), progressive supranuclear palsy, corticobasal syndrome, some frontotemporal dementias, or chronic traumatic encephalopathy [3,4]. Alzheimer’s disease is the most prevalent tauopathy and the most common cause of dementia. Its frequency of incidence is rapidly increasing due to the aging population [5]. It is expected that more than 130 million people will be affected by dementia in 2050 [6]. Therefore, there is an urgent need to dispose of effective therapeutic modalities and effective diagnostic strategies capable of capturing the disease at an early stage. Systems biology and its associated disciplines (especially metabolomics and proteomics) represent rapidly growing scientific areas effectively implemented into the clinical environment [7,8]. The findings obtained using such strategies may help reveal the mechanism of disease development and contribute to the design of new therapeutics.
A number of major breakthroughs in basic science and medical research have been possible because of observations and testing on animal models [9]. Therefore, using an appropriate animal model is essential for obtaining reliable data. Numerous genetically modified rodent models of tauopathies have been created to explore pathological mechanisms involved in neurodegeneration and to search for tau-associated disease pathways [10]. One of them is our rat model (transgenic spontaneously hypertensive rat 24–SHR24) expressing a human truncated tau that encompasses three microtubule-binding domains (3R) and a proline-rich region (3R tau151-391) [11]. This model is characterized by the development of progressive age-dependent neurofibrillary degeneration in the cortical brain areas, which fulfills several histopathological criteria used for the identification of neurofibrillary degeneration in Alzheimer’s disease [12].
Neurotransmitters (NT) are endogenous chemical messengers responsible for the transmission of the signal across the synapse and neuromuscular junctions [13]. They are stored in the synaptic vesicles and are released into the synapse after the appropriate stimulus. The released NT bind to their receptors situated on the postsynaptic membrane and modulate their activity. From the chemical point of view, the majority of NT belongs to biogenic amines or amino acids [13,14]. NT and tryptophan (Trp) metabolites are widely distributed in the central neural system (CNS) and represent important molecules for many physiological processes and the immune system.
Moreover, imbalances of these signaling molecules are linked to numerous neurological disorders and diseases, including tauopathies [15,16,17]. The research is typically focused on, but not limited to, acetylcholine [18], glutamate and glutamine [19], dopamine and serotonin [20], γ-aminobutyric acid, aspartic acid, or N-acetyl-L-aspartic acid [21]. It is expected that these molecules directly play a crucial role in Alzheimer’s disease pathogenesis or have a role in causing oxidative stress [22]. Therefore, the therapeutic strategies of Alzheimer’s disease and other neurodegenerative diseases, such as acetylcholinesterase inhibitors, antidepressants or antipsychotics, are mainly focused on the modulation of the NT levels in the brain [23,24,25,26].
Monitoring quantitative changes of such substances is also essential to better understand the pathophysiological mechanism of neurodegeneration and neuroinflammation. Reliable, highly efficient, fast, selective, and sensitive analytical methods characterized by high sample throughput are therefore demanded. The combination of liquid chromatography (LC) with highly selective and sensitive mass spectrometry (MS) detection represents a valuable tool for the simultaneous determination of a wide variety of endogenous substances in biological samples, including NT [27,28,29]. Several papers deal with the quantitation of NT by LC-MS methods in the human brain [16,30,31] and rat or mice brain [32,33,34,35,36,37,38,39,40] samples. The variability of the chemical structures of the analytes makes their analysis challenging. Therefore, some of the described methods deal with derivatization or the addition of an ion pair agent to obtain appropriate chromatographic separation [34,39,40]. However, fast and straightforward LC-MS approaches that analyze structurally heterogeneous substances simultaneously without molecule modification and intervention into the separation environment are still highly in demand. These methods could be an excellent alternative to the convenient immunoassay or positron emission tomography (PET) imaging strategies that typically suffer from insufficient selectivity or increased costs.
The present study aimed to validate an ultra-high performance liquid chromatography-tandem mass spectrometry (UHPLC-MS/MS) method and applied it for simultaneous determination of nine NT–aspartic acid (Asp), asparagine (Asn), glutamic acid (Glu), glutamine (Gln), γ-aminobutyric acid (GABA), N-acetyl-L-aspartic acid (NAA), pyroglutamic acid (PyroGlu), acetylcholine (ACh), choline (Cho); tryptophan (Trp) and its metabolite kynurenine (Kyn), in rat brain tissue samples.
Here, we for the first-time quantified NT in four different brain regions of the tau transgenic rat model—SHR 24. We found altered levels of several NTs in the tau model, suggesting that tau pathology directly contributes to NT imbalance in the brain. It is expected that the presented LC-MS approach could effectively explain the pathophysiological mechanisms of neurodegenerative disorders and the discovery of a corresponding therapeutic intervention.

2. Materials and Methods

2.1. Chemicals and Solutions

Analytical grade standards of acetylcholine, choline, aspartic acid, asparagine, glutamic acid, glutamine, γ-aminobutyric acid, N-acetyl-L-aspartic acid, pyroglutamic acid, tryptophan and kynurenine were obtained from Sigma Aldrich (Steinheim, Germany). D6-4-aminobutyric acid, D3-aspartic acid, D5-N-acetyl-L-aspartic acid, D3-glutamic acid, D5-glutamine, D9-acetylcholine, D5-pyroglutamic acid, D5-tryptophan, and D4-kynurenine were purchased from CDN isotopes (Pointe-Claire, QC, Canada), D5-asparagine was from Cambridge Isotope Laboratories (Tewksbury, MA, USA). A LC-MS quality ammonium formate, formic acid (HFo), acetonitrile, and water were obtained from Merck (Darmstadt, Germany). Hydrochloric acid (HCl) p.a. grade was purchased from Sigma Aldrich (Steinheim, Germany).

2.2. Calibration Solutions

Individual stock standard solutions of acetylcholine, choline, aspartic acid, asparagine, glutamic acid, glutamine, γ-aminobutyric acid, N-acetyl-L-aspartic acid, pyroglutamic acid, and tryptophan were prepared in 0.1 M HCl at the concentration of 1 mg/mL. Stock standard solution of kynurenine was prepared in 0.5 M HCl at the concentration of 1 mg/mL. Individual stock solutions of deuterated standards–D6-4-aminobutyric acid, D3-aspartic acid, D5-asparagine, D5-N-acetyl-L-aspartic acid, D3-glutamic acid, D5-glutamine, D9-acetylcholine, D5-pyroglutamic acid, and D5-tryptophan were prepared in 0.1 M HCl at the concentration of 10 mg/mL. Stock standard solution of D4-kynurenine was prepared in 0.5 M HCl at the concentration of 10 mg/mL. All standards were stored at −20ºC until use. Stock solutions of the analytes were combined and serially diluted with 80% acetonitrile to provide working standard solutions of the demanded concentrations. Concentration ranges of the analytes varied from 0.025 to 250 µg/mL. Calibration standards for GABA, Chol, Asp, Gln and Glu were in the range 2.5–250 µg/mL (individual concentrations were 2.5, 5, 10, 25, 50, 100, and 250 µg/mL) for PyroGlu, Asn, NAA in the range 0.25–25 µg/mL (individual concentrations were 0.25, 0.5, 1, 2.5, 5, 10, and 25 µg/mL), for Ach in the range 0.025–2.5 µg/mL (individual concentrations were 0.025, 0.05, 0.1, 0.25, 0.5, 1, and 2.5 µg/mL) and for Trp and Kyn in the range 0.1–25 µg/mL (individual concentrations were 0.1, 0.5, 1, 2.5, 5, 10, and 25 µg/mL).

2.3. Animals and Sample Collection

Heterozygous SHR-24 transgenic rats (15 month old, male/female) and non-transgenic SHR age matched controls were used in the present work. All animals were housed under standard laboratory conditions with free access to water and food and were kept under diurnal lighting conditions (12 h light/dark cycles with light starting at 7:00 a.m.). All experiments on animals were carried out according to the institutional animal care guidelines conforming to international standards and were approved by the State Veterinary and Food Committee of Slovak Republic and by Ethics Committee of Institute of Neuroimmunology. Efforts were made to minimize the number of animals utilized and to limit discomfort, pain or any other suffering of the experimental animals used in this study.

2.4. Sample Preparation

All rats (17 transgenic SHR 24 rats and 8 age matched non-transgenic SHR–control) were sacrificed by rapid decapitation. The brains were rapidly removed, frozen in liquid nitrogen, and stored at −80 °C until analysis. The frozen brain was dissected on ice to obtain tissue from following regions: frontal cortex, parietal cortex, pons, and medulla oblongata. The weight of the brain tissue regions used for further sample preparation was in the range 20–40 mg. Extraction of the different brain region tissues was performed according to the procedure described in our previous work [30]. Briefly, 600 µL of cold 80% acetonitrile with 0.1% HFo and 10 µL of internal standard solution were added to the brain tissue. The samples were homogenized using a FastPrep-24 homogenizer (MP Biomedicals, Santa Ana, CA, USA) on dry ice 3-times for 20 s. The homogenized mixture was centrifuged (30,000× g, 10 min), diluted with 600 µL of 80% acetonitrile and centrifuged again (30,000× g, 10 min). No filters were used during the centrifugation. Then, the supernatant was transferred into vials and analyzed directly.

2.5. Quality Control (QC) Samples Preparation

The QC samples were prepared from pooled brain tissues which were spiked with the selected analytes at three concentration levels—low, medium and high. The weight of the pooled brain tissue samples was in the range 20–40 mg. QC concentration levels were as follows: for Chol, GABA, Gln, Glu, and Asp 2.5 µg/mL (QC low), 10 µg/mL (QC medium), 250 µg/mL (QC high); for PyroGlu, NAA, and Asn 0.25 µg/mL (QC low), 2.5 µg/mL (QC medium), 25 µg/mL (QC high); for Trp and Kyn 0.1 µg/mL (QC low), 5 µg/mL (QC medium), 25 µg/mL (QC high); and for Ach 0.025 µg/mL (QC low), 0.25 µg/mL (QC medium) and 2.5 µg/mL (QC high). The samples were further processed according to the same extraction steps as described in the Section 2.4. Sample preparation.

2.6. Instrumentation

The LC-MS/MS experiments were performed using a Waters Acquity UPLC system (Waters, Milford, MA, USA) coupled to the Xevo TQD (Waters, Milford, MA, USA) triple quadrupole mass spectrometer. Chromatographic separation was performed on an Acquity UPLC BEH Amide column (2.1 mm × 100 mm, 1.7 µm particle size) with VanGuard precolumn. The analytes were separated with a mobile phase consisting of 50 mM ammonium formate and 0.25% HFo in water (eluent A) and 0.05% HFo in acetonitrile (eluent B). A gradient profile was used, starting at 90% of B (0–0.5 min), decreasing to 85% B in 1.5 min, to 80% B (2–4 min), to 60% in 2 min, returning to 90% B and followed by a re-equilibration (7–9 min). The total analysis time was 9 min. The flow rate was 0.7 mL/min, column temperature was set at 50 °C, and the injection volume of the sample was 5 µL.
Mass spectrometric detection was performed using a Waters triple quadrupole Xevo TQD (Waters, Milford, MA, USA) equipped with electrospray ionization source operating in positive mode (ESI +). ESI parameters were set at follows: capillary voltage 3.0 kV, source temperature 150 °C, desolvation temperature 350 °C, cone gas flow 50 L/h, and desolvation gas flow 600 L/h. The source cone voltage and collision energies were manually optimized for each selected reaction monitoring (SRM) transition. Instrument control and data acquisition was performed using MassLynx 4.1 software (Waters, Milford, MA, USA).

2.7. Statistical Data Analysis

The statistical analyses were performed using GraphPad Prism 8.0.2 (GraphPad Software, San Diego, CA, USA). Differences between means were analyzed using two-way ANOVA with Bonferroni’s multiple comparisons test. Differences at p < 0.05 were accepted as statistically significant.

3. Results and Discussion

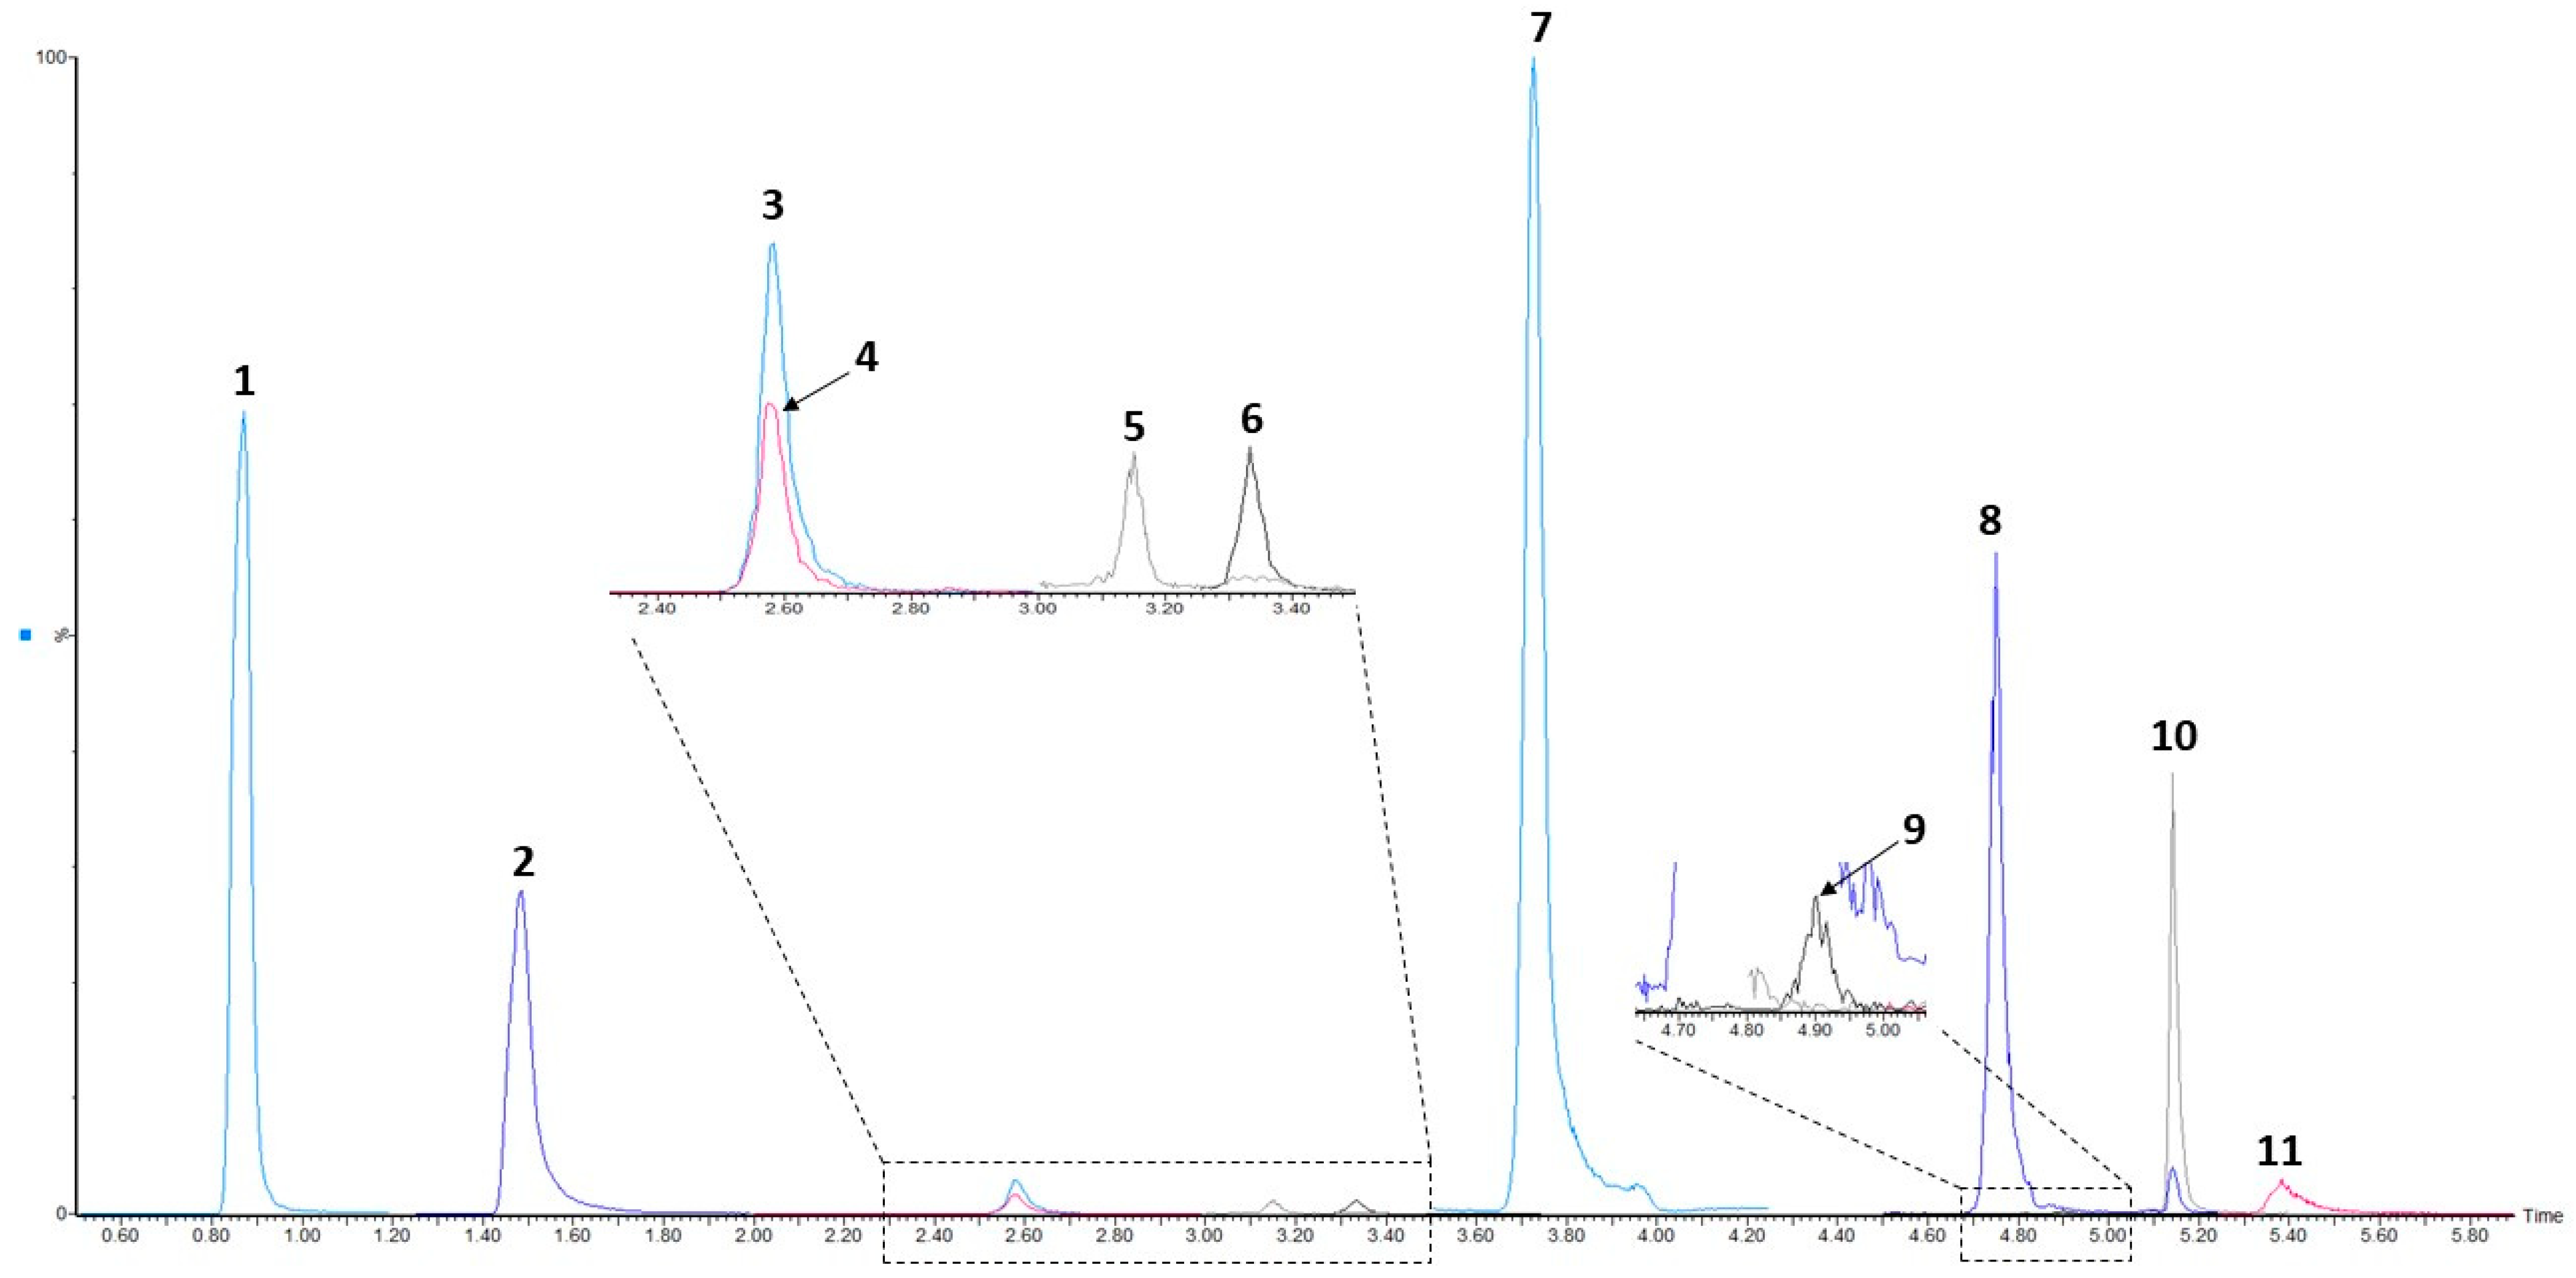
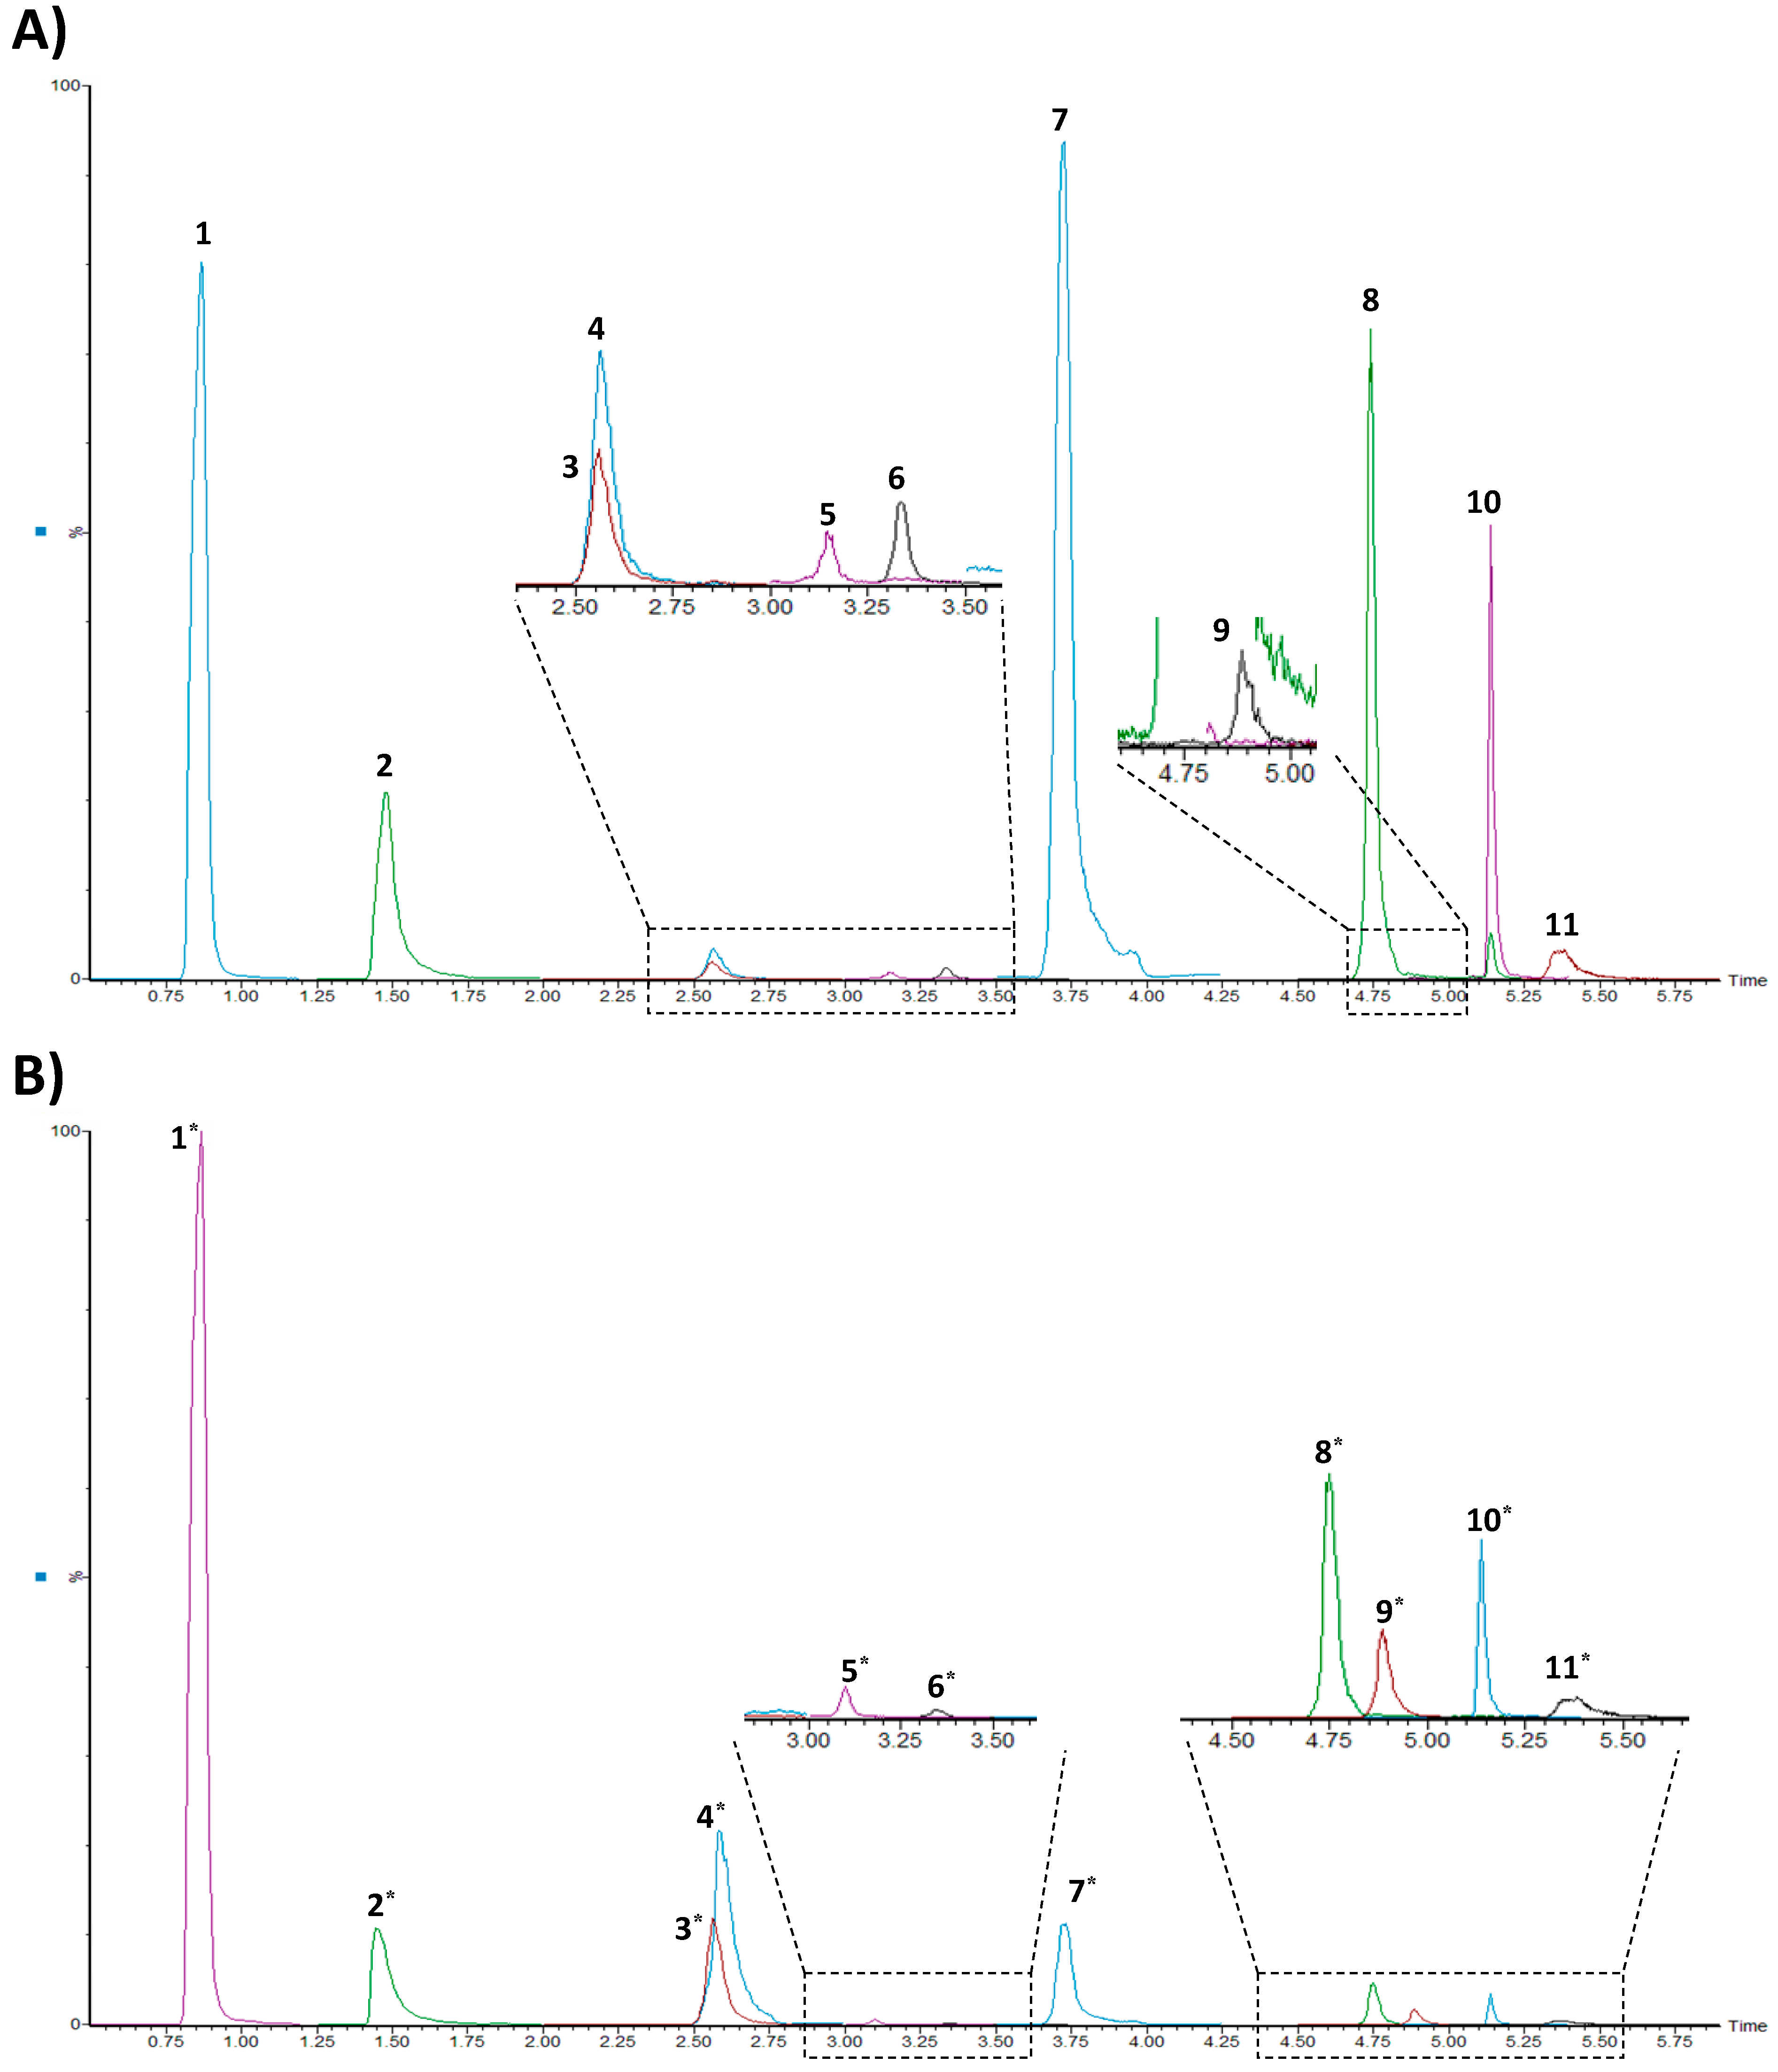
3.1. UHPLC-ESI-MS/MS Conditions

It was demonstrated that the use of the Acquity UPLC BEH Amide column represents a suitable stationary phase for the separation of a mixture of 11 substances and their internal standards with highly heterogeneous physical-chemical properties. No further extensive method optimization was necessary. However, the developed method was not able to separate Kyn and Trp from each other. The use of MS detection and isotopically labelled internal standards of the analytes provided their unequivocal identification and quantification. Maximum sensitivity of the tandem mass spectrometry detection was achieved using the selected reaction monitoring (SRM) mode. The complete overview of used mass transitions and operation conditions for each analyte and its responsible internal standard is summarized in Table 1.

3.2. Method Validation

The validation of the UHPLC-MS/MS method was carried out in compliance with the US Food and Drug Administration (FDA) [41] guideline. The validation procedure included investigation of linearity, limit of detection (LOD), lower limit of quantification (LLOQ), accuracy, precision, and stability. A complex overview of investigated operation and validation parameters is summarized in Table 2, Table 3 and Table 4.
The linearity of the method was performed with the use of calibration standards of each analyte in the selected ranges (i.e., 2.5–250 µg/mL for GABA, Chol, Asp, Gln, Glu, 0.25–25 µg/mL for PyroGlu, Asn, NAA, 0.025–2.5 µg/mL for Ach and 0.1–25 µg/mL for Trp and Kyn) by the internal standard procedure. The selected ranges of calibration curves were sufficient to cover the expected concentration values of the analytes in real brain tissue. Linear calibration curves were obtained for all analytes–correlation coefficients were in the interval of 0.9946–0.9999 (Table 2). Moreover, linear regression analysis was performed on the calibration curves and relative standard deviation of the slope (RSDb) and intercept (RSDa) were calculated (see Table 2).
The LOD (signal-to-noise ratio 3:1) and LLOQ (signal-to-noise ratio 5:1) were calculated from calibration curves, based on standard deviation of response and slope. The predicted LOD values of the analytes ranged in the interval 0.01–1.70 µg/mL (Table 2).
Quality control (QC) samples at three concentration levels–low, medium, high (see Table 3), were prepared from pooled rat brain tissue and analyzed on the same day and over three consecutive days to evaluate precision (expressed as coefficient of variation—CV) and accuracy of the UHPLC-MS/MS method. The results are summarized in Table 3. The values of intra-and inter-day precision were within the ranges of 0.6–11.9% and 0.6–14.4%, respectively. The intraday accuracy ranged in the interval of 87.6–107.1% and the interday accuracy was in the range of 87.2–119.6%. The investigated values were within the acceptance criteria of the FDA guideline (≤15%, and ≤20% for QC samples at LLOQ concentration level). An illustrative record obtained from the analysis of pooled brain tissue QC sample spiked at medium concentration level is presented in Figure 1.
The carryover effect was also investigated during the validation procedure of the UHPLC-MS/MS method. The experiment was performed by injection of blank sample (mobile phase) into the separation system after the analysis of each QC sample. No significant carryover effect was observed–no residual peaks of the analytes were present in the SRM records of the blank sample, or the investigated peak areas of the analytes in the blank sample were significantly lower than those ones recorded for QC samples at LLOQ levels (the investigated value did not exceed 1.1%).
Stability of the analytes in pooled brain tissue QC samples was examined by measuring them after storage in the autosampler for 24 h (Table 4). The obtained relative errors were less or equal to 15% compared to the initial concentration of the analytes. The freeze-to-thaw stability was assessed after performing three complete freeze-thaw cycles of the pooled brain tissue QC samples. Then, the measured data were compared with those ones obtained from the analysis of freshly prepared QC samples. The investigated concentrations of the analytes were in the range of 86.1–119.6% compared to the initial concentrations (see Table 4). The stability data were within the acceptance criteria of the FDA guideline (≤15%, and ≤20% for QC samples at LLOQ concentration level).
Moreover, the developed LC-MS/MS method was evaluated in terms of analytical performance, safety and eco-friendliness, and practical effectiveness. The approach based on RGB Additive Color Model [42] was used and the results are summarized in Supplementary Material—Figure S1. According to the obtained data, the developed method represents an effective high performance method with suitable level of greenness.

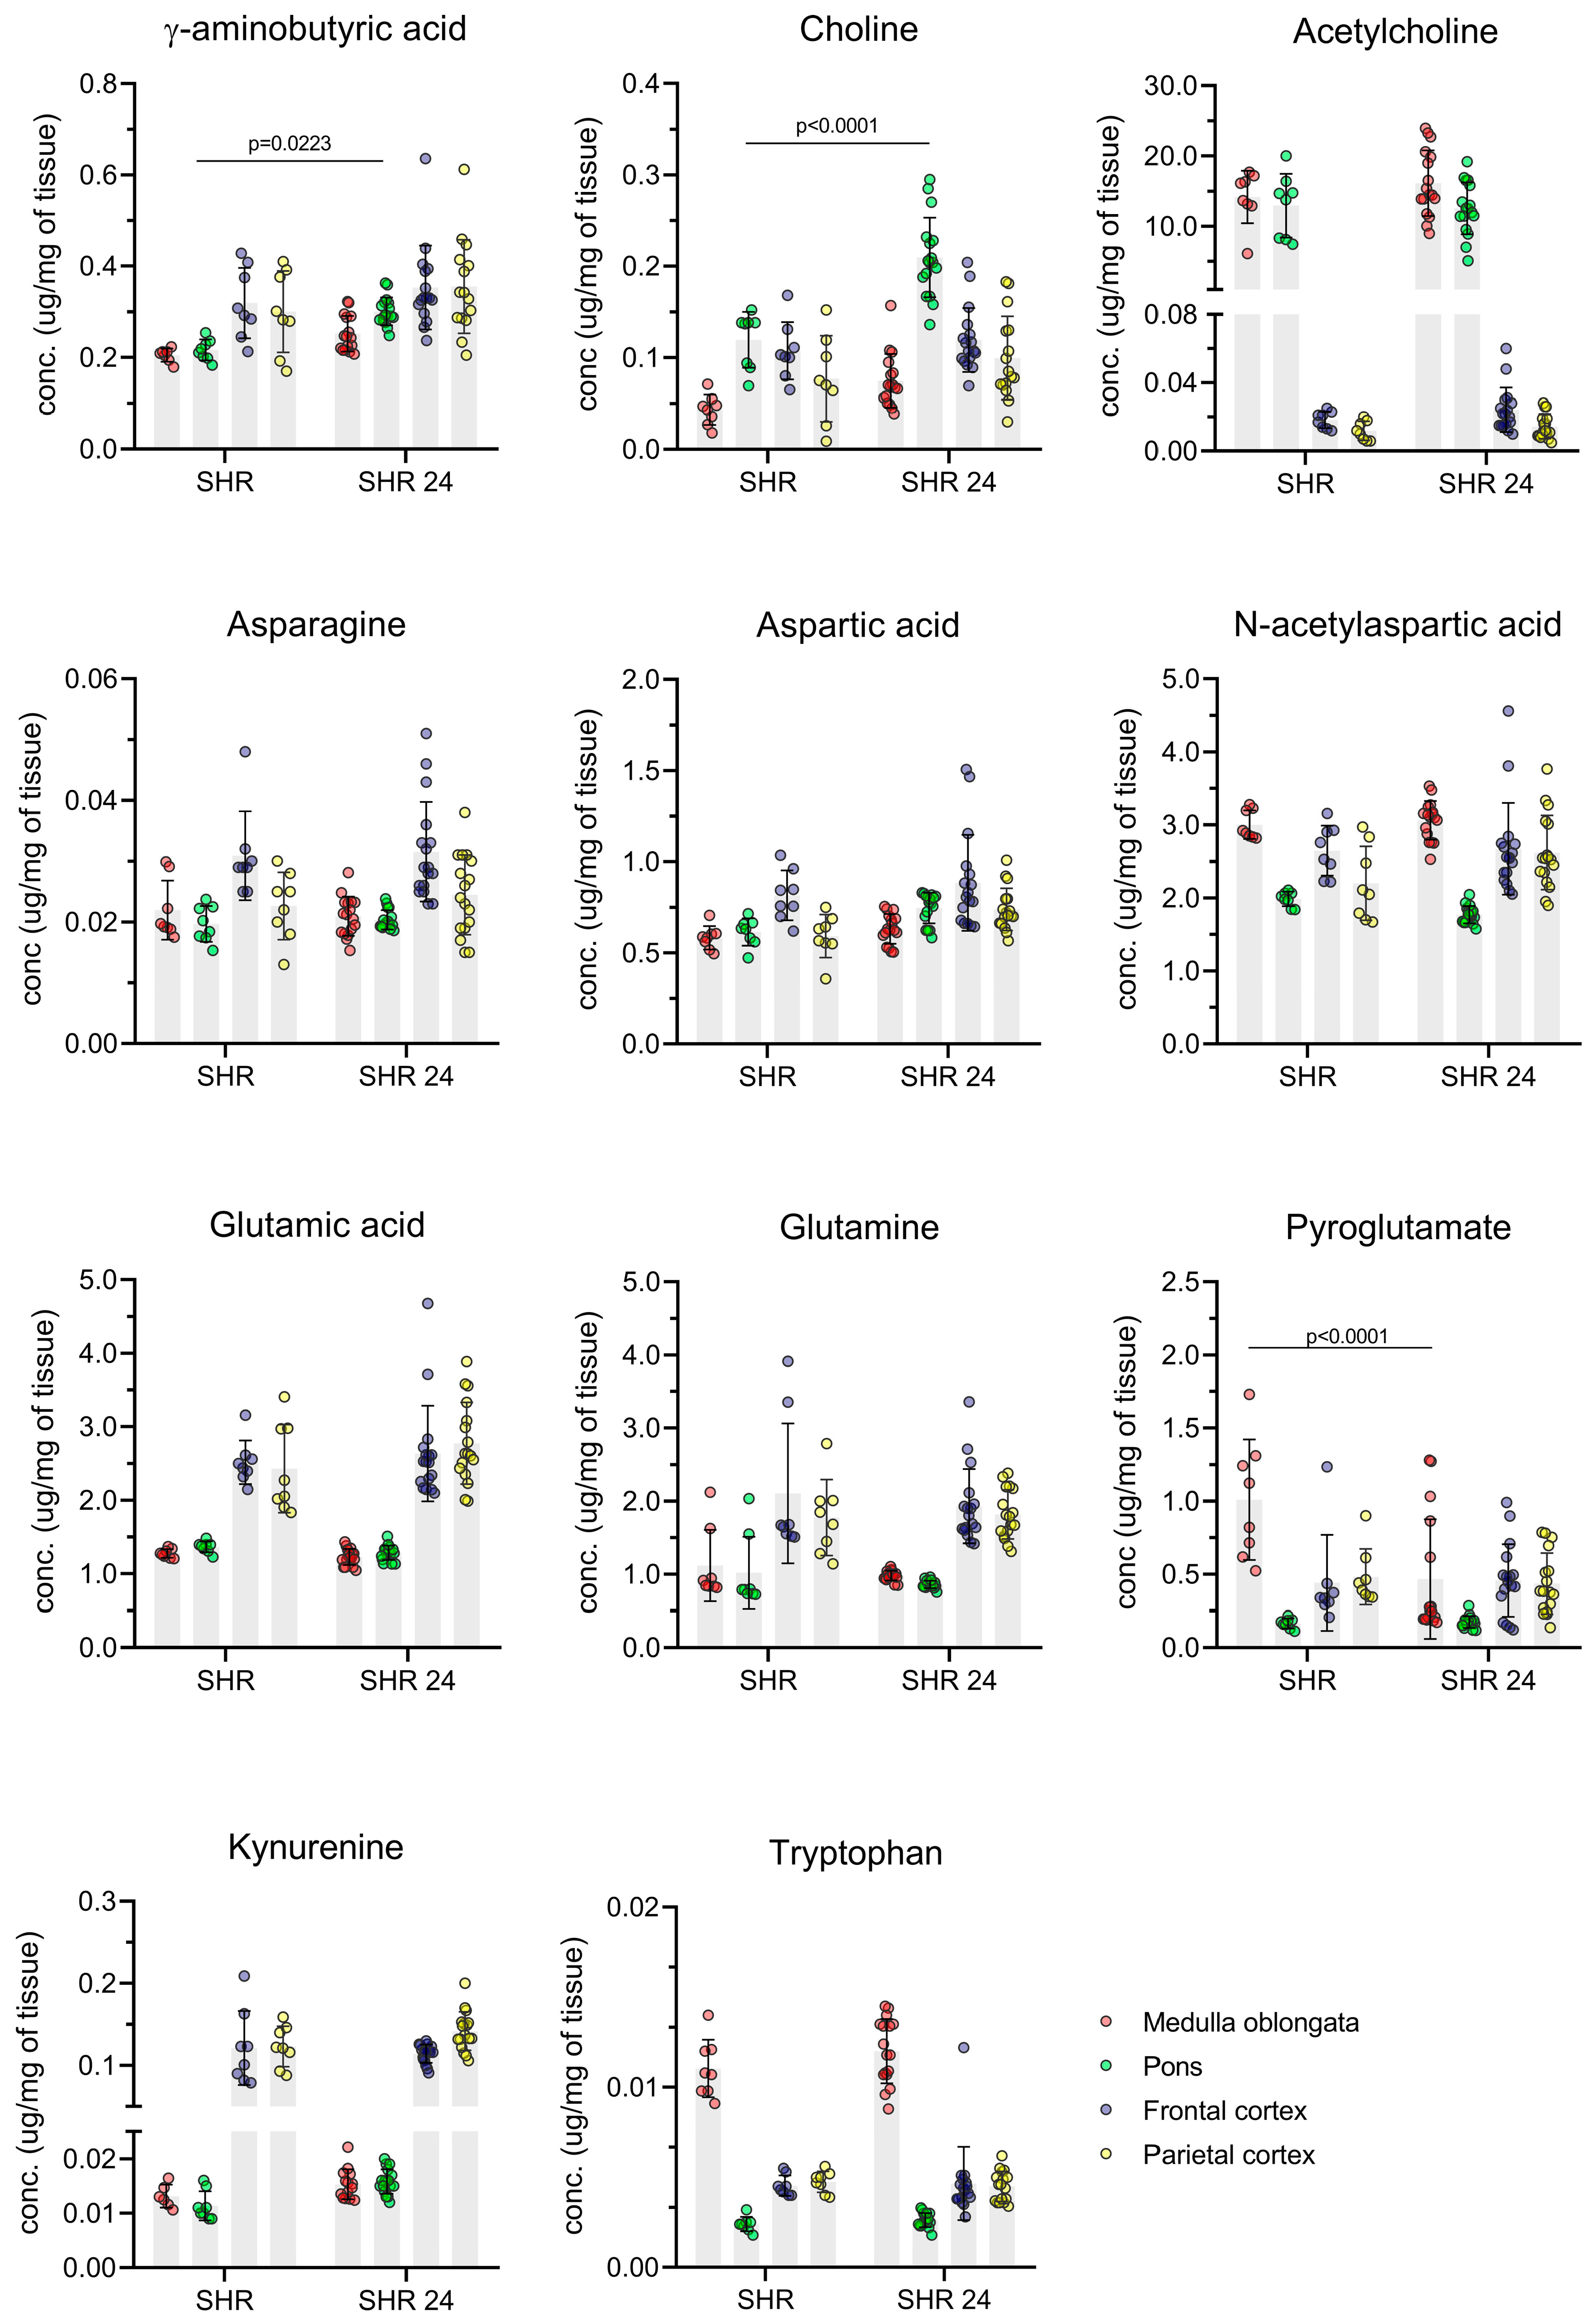
3.3. Method Application–Analysis of Brain Tissue Samples from Transgenic Rats

The validated UHPLC-ESI-MS/MS method was applied for the analysis of rat brain tissue samples from transgenic rat model for tauopathies. Concentration levels of the selected analytes were investigated in brain tissue samples obtained from four different brain regions—frontal cortex, parietal cortex, pons and medulla oblongata. The obtained results are summarized in Table 5. A representative chromatogram from the determination of selected analytes in SHR 24 brain tissue sample from medulla oblongata is presented in Figure 2. The results clearly demonstrate the ability of the method to quantify the analytes in all samples. Statistical evaluation of the changes in selected NT, tryptophan and kynurenine in the investigated brain regions from tau transgenic rats and age-matched controls is illustrated in Figure 3.
NTs are endogenous signaling compounds that allow neurons to communicate. Determining whether there are any differences in response to tau pathology is essential for understanding the brain changes in tauopathies. The results from our study show significant alterations of brain tissue NT levels in response to tau pathology.
No differences were observed in the levels of major excitatory NT such as glutamic acid, aspartic acid, their precursors’ glutamine and asparagine, and aspartic acid derivate N-acetylaspartic acid. Studies in living patients demonstrated a significant decrease of glutamate and N-acetylaspartate that correlates with the progression of dementia and neuronal loss [43,44]. However, our previous data showed that the expression of truncated tau did not cause an extensive neuronal loss in the brain stem [45]. We conclude that pathological processes other than the loss of the neurons drive the NT changes in our transgenic model.
While we found a significant increase of GABA in the pons, there was no difference in the medulla oblongata, and frontal and parietal cortex. The tau transgenic rats SHR24 used in our study have extensive pathology in the pons [12]. Moreover, we previously noticed that the transition of tau from soluble protein into insoluble neurofibrillary pathology is closely associated with activation of microglia and astrocytes [46]. It is well known that neurotransmitter receptors that are expressed by microglia regulate the microglia phenotype [47]. Microglia expressed both GABAA and GABAB receptors [48]. Stimulation of GABAB receptors attenuates the interleukin release, and in response to injury, microglia increase their expression [49]. The stimulation of GABAA receptors triggers the production of reactive oxygen species and enhances the neuroprotective phenotype [50]. Thus, it will be important to identify the exact neuroinflammatory pathways activated in our transgenic animals in response to neurofibrillary pathology.
The increased choline levels are typically found in neuroinflammatory diseases such as tauopathies [51,52,53]. Neuroinflammation triggered by tau pathology is likely responsible for the elevated choline levels we detected in the pons. Interestingly, in contrast to human studies [16,30] we noticed no change in acetylcholine in any analyzed brain area.
Pyroglutamic acid as a metabolite of glutathione degradation can induce oxidative stress connected with the AD process [54,55]. Therefore, the elevated levels of pyroglutamic acid in the medulla oblongata could be considered a sign of AD pathology changes.
The kynurenine pathway is the major route for the metabolism of the amino acid tryptophan. Alterations in kynurenine and the kynurenine pathway has been identified in several neurological and neurodegenerative diseases, including AD [56]. Increased levels of kynurenine were also identified in pathological processes accompanied with inflammation [57,58,59]. In contrast to these studies, we found no difference in tryptophan or kynurenine levels in any of the analyzed brain areas.

4. Conclusions

In conclusion, we successfully developed and validated a simple, fast, and effective UHPLC-MS/MS method for the quantification of nine NTs, tryptophan and its metabolite kynurenine in rat brain tissue. Favorable performance parameters of the UHPLC-MS/MS approach, such as high sample throughput, simple sample preparation, or robustness, are attributes demanded in routine clinical analysis. In this work, they were reflected in the successful profiling of brain tissue samples of the rat model for tauopathy.
Statistical evaluation revealed some significant changes in the GABA, choline and pyroglutamate levels in the samples obtained from tau transgenic animals. The results of this study are encouraging, as our findings (i.e., concentration differences) are in good agreement with the previously published data. However, further investigation is necessary to confirm the result of our pivotal study, especially experiments based on age dependent disease progression.

Supplementary Materials

The following are available online at https://www.mdpi.com/article/10.3390/separations9010016/s1, Figure S1: Evaluation of the LC-MS/MS method with the use of RGB Additive Color Model.

Author Contributions

Conceptualization, A.K., P.M. (Petra Majerova) and J.G.; methodology, A.K., P.M. (Petra Majerova), J.G, D.O. and J.P.; validation, J.G., A.F. and J.P.; formal analysis, P.M. (Peter Mikus); investigation, A.F., J.G., P.M. (Petra Majerova), J.P. and A.K.; data curation, A.F. and J.G.; writing—original draft preparation, A.F. and J.G.; writing—review and editing, J.P., P.M. (Petra Majerova) and A.K.; visualization, J.P., J.G. and P.M. (Petra Majerova); supervision, A.K.; project administration, A.K. All authors have read and agreed to the published version of the manuscript.

Funding

This research was funded by APVV-18-0302, APVV-15-0585, CRP/19/016, VEGA 1/0463/18, VEGA 2/0129/21, VEGA 2/0147/19 and VEGA 2/0150/19.

Institutional Review Board Statement

All experiments on animals were carried out according to the institutional animal care guide-lines conforming to international standards (Directive 2010/63/EU) and were approved by the State Veterinary and Food Committee of Slovak Republic (RO-1101/14-221C).

Informed Consent Statement

Not applicable.

Data Availability Statement

The data presented in this study are available on request from the corresponding author.

Conflicts of Interest

The authors declare no conflict of interest.

References

  1. Wang, Y.; Mandelkow, E. Tau in physiology and pathology. Nat. Rev. Neurosci. 2016, 17, 5–21. [Google Scholar] [CrossRef] [PubMed]
  2. Kovacs, G.G. Neuropathology of tauopathies: Principles and practice. Neuropathol. Appl. Neurobiol. 2015, 41, 3–23. [Google Scholar] [CrossRef]
  3. Lee, V.M.; Goedert, M.; Trojanowski, J.Q. Neurodegenerative tauopathies. Annu. Rev. Neurosci. 2001, 24, 1121–1159. [Google Scholar] [CrossRef]
  4. Orr, M.E.; Sullivan, A.C.; Frost, B. A brief overview of tauopathy: Causes, consequences, and therapeutic strategies. Trends Pharmacol. Sci. 2017, 38, 637–648. [Google Scholar] [CrossRef]
  5. Silva, M.C.; Haggarty, S.J. Tauopathies: Deciphering disease mechanisms to develop effective therapies. Int. J. Mol. Sci. 2020, 21, 8948. [Google Scholar] [CrossRef]
  6. Hansson, O. Biomarkers for neurodegenerative diseases. Nat. Med. 2021, 27, 954–963. [Google Scholar] [CrossRef]
  7. Zhang, X.-W.; Li, Q.-H.; Xu, Z.-D.; Dou, J.-J. Mass spectrometry-based metabolomics in health and medical science: A systematic review. RSC Adv. 2020, 10, 3092–3104. [Google Scholar] [CrossRef] [Green Version]
  8. Frantzi, M.; Latosinska, A.; Kontostathi, G.; Mischak, H. Clinical proteomics: Closing the gap from discovery to implementation. Proteomics 2018, 18, 1700463. [Google Scholar] [CrossRef] [Green Version]
  9. Barré-Sinoussi, F.; Montagutelli, X. Animal models are essential to biological research: Issues and perspectives. Future Sci. OA 2015, 1, FSO63. [Google Scholar] [CrossRef] [Green Version]
  10. Dujardin, S.; Colin, M.; Buée, L. Animal models of tauopathies and their implications for research/translation into the clinic. Neuropathol. Appl. Neurobiol. 2015, 41, 59–80. [Google Scholar] [CrossRef] [PubMed]
  11. Filipcik, P.; Zilka, N.; Bugos, O.; Kucerak, J.; Koson, P.; Novak, P.; Novak, M. First transgenic rat model developing progressive cortical neurofibrillary tangles. Neurobiol. Aging 2012, 33, 1448–1456. [Google Scholar] [CrossRef]
  12. Zilka, N.; Filipcik, P.; Koson, P.; Fialova, L.; Zilkova, M.; Skrabana, R.; Rolkova, G.; Kontsekova, E.; Novak, M. Truncated tau from sporadic Alzheimer’s disease suffices to drive neurofibrillary degeneration in vivo. FEBS Lett. 2006, 580, 3582–3588. [Google Scholar] [CrossRef] [Green Version]
  13. Hyman, S.E. Neurotransmitters. Curr. Biol. 2005, 15, 154–158. [Google Scholar] [CrossRef] [PubMed] [Green Version]
  14. Engelborghs, S.; De Deyn, P.P. The neurochemistry of Alzheimer’s disease. Acta Neurol. Belg. 1997, 97, 67–84. [Google Scholar]
  15. Hebron, M.L.; Javidnia, M.; Moussa, C.E.-H. Tau clearance improves astrocytic function and brain glutamate-glutamine cycle. J. Neurol. Sci. 2018, 391, 90–99. [Google Scholar] [CrossRef]
  16. Snowden, S.G.; Ebshiana, A.A.; Hye, A.; Pletnikova, O.; O’Brien, R.; Yang, A.; Troncoso, J.; Legido-Quigley, C.; Thambisetty, M. Neurotransmitter imbalance in the brain and Alzheimer’s disease pathology. J. Alzheimers Dis. 2019, 72, 35–43. [Google Scholar] [CrossRef] [PubMed] [Green Version]
  17. Kandimalla, R.; Reddy, P.H. Therapeutics of NT in Alzheimer’s disease. J. Alzheimers Dis. 2017, 57, 1049–1069. [Google Scholar] [CrossRef] [Green Version]
  18. Ferreira-Vieira, T.H.; Guimaraes, I.M.; Silva, F.R.; Ribeiro, F.M. Alzheimer’s disease: Targeting the cholinergic system. Curr. Neuropharmacol. 2016, 14, 101–115. [Google Scholar] [CrossRef] [Green Version]
  19. Madeira, C.; Vargas-Lopes, C.; Brandão, C.O.; Reis, T.; Laks, J.; Panizzutti, R.; Ferreira, S.T. Elevated glutamate and glutamine levels in the cerebrospinal fluid of patients with probable Alzheimer’s disease and depression. Front. Psychiatry 2018, 9, 561. [Google Scholar] [CrossRef] [PubMed] [Green Version]
  20. Lanari, A.; Amenta, F.; Silvestrelli, G.; Tomassoni, D.; Parnetti, L. Neurotransmitter deficits in behavioural and psychological symptoms of Alzheimer’s disease. Mech. Ageing Dev. 2006, 127, 158–165. [Google Scholar] [CrossRef]
  21. Peña-Bautista, C.; Torres-Cuevas, I.; Baquero, M.; Ferrer, I.; García, L.; Vento, M.; Cháfer-Pericás, C. Early neurotransmission impairment in non-invasive Alzheimer Disease detection. Sci. Rep. 2020, 10, 16396. [Google Scholar] [CrossRef] [PubMed]
  22. Guan, Z.-Z. Cross-talk between oxidative stress and modifications of cholinergic and glutaminergic receptors in the pathogenesis of Alzheimer’s disease. Acta Pharmacol. Sin. 2008, 29, 773–780. [Google Scholar] [CrossRef]
  23. Yi, L.; Sun, H.; Chen, Z.; Xu, H.; Bu, G.; Zheng, H. Implications of GABAergic neurotransmission in Alzheimer’s disease. Front. Aging Neurosci. 2016, 8, 31. [Google Scholar]
  24. Chen, K.H.; Reese, E.A.; Kim, H.W.; Rapoport, S.I.; Rao, J.S. Disturbed neurotransmitter transporter expression in Alzheimer’s disease brain. J. Alzheimer’s Dis. 2011, 26, 755–766. [Google Scholar] [CrossRef] [PubMed] [Green Version]
  25. Colovic, M.B.; Krstic, D.Z.; Lazarevic-Pasti, T.D.; Bondzic, A.M.; Vasic, V.M. Acetylcholinesterase inhibitors: Pharmacology and toxicology. Curr. Neuropharmacol. 2013, 11, 315–335. [Google Scholar] [CrossRef] [Green Version]
  26. Huey, E.D.; Putnam, K.T.; Grafman, J. A systematic review of neurotransmitter deficits and treatments in frontotemporal dementia. Neurology 2006, 66, 17–22. [Google Scholar] [CrossRef] [Green Version]
  27. Jacob, M.; Lopata, A.L.; Dasouki, M.; Rahman, A.M.A. Metabolomics toward personalized medicine. Mass Spectrom. Rev. 2019, 38, 221–238. [Google Scholar] [CrossRef]
  28. Khamis, M.M.; Adamko, D.J.; El-Aneed, A. Mass spectrometric based approaches in urine metabolomics and biomarker discovery. Mass Spectrom. Rev. 2017, 36, 115–134. [Google Scholar] [CrossRef]
  29. de Souza, L.P.; Alseekh, S.; Scossa, F.; Fernie, A.R. Ultra-high-performance liquid chromatography high-resolution mass spectrometry variants for metabolomics research. Nat. Methods 2021, 18, 733–746. [Google Scholar] [CrossRef]
  30. Forgacsova, A.; Galba, J.; Garruto, R.M.; Majerova, P.; Katina, S.; Kovac, A. A novel liquid chromatography/mass spectrometry method for determination of neurotransmitters in brain tissue: Application to human tauopathies. J. Chromatogr. B 2018, 1073, 154–162. [Google Scholar] [CrossRef] [PubMed]
  31. Fuertig, R.; Ceci, A.; Camus, S.M.; Bezard, E.; Luippold, A.H.; Hengerer, B. LC-MS/MS-based quantification of kynurenine metabolites, tryptophan, monoamines and neopterin in plasma, cerebrospinal fluid and brain. Bioanalysis 2016, 8, 1903–1917. [Google Scholar] [CrossRef] [Green Version]
  32. Tareke, E.; Bowyer, J.F.; Doerge, D.R. Quantification of rat brain neurotransmitters and metabolites using liquid chromatography/electrospray tandem mass spectrometry and comparison with liquid chromatography/electrochemical detection. Rapid Commun. Mass Spectrom. 2007, 21, 3898–3904. [Google Scholar] [CrossRef]
  33. Wang, L.-S.; Zhang, M.-D.; Tao, X.; Zhou, Y.-F.; Liu, X.-M.; Pan, R.-L.; Liao, Y.-H.; Chang, Q. LC-MS/MS –based quantification of tryptophan metabolites and neurotransmitters in the serum and brain of mice. J. Chromatogr. B 2019, 1112, 24–32. [Google Scholar] [CrossRef] [PubMed]
  34. González, R.R.; Fernández, R.F.; Vidal, J.L.M.; Frenich, A.G.; Pérez, M.L.G. Development and validation of an ultra-high performance liquid chromatography–tandem mass-spectrometry (UHPLC–MS/MS) method for the simultaneous determination of neurotransmitters in rat brain samples. J. Neurosci. Methods 2011, 198, 187–194. [Google Scholar] [CrossRef] [PubMed]
  35. Sun, Z.; Li, Q.; Bi, K. Rapid HPLC-ESI-MS/MS analysis of neurotransmitters in the brain tissue of Alzheimer’s disease rats before and after oral administration of Xanthoceras sorbifolia bunge. Molecules 2018, 23, 3111. [Google Scholar] [CrossRef] [PubMed] [Green Version]
  36. Xu, H.; Wang, Z.; Zhu, L.; Sui, Z.; Bi, W.; Liu, R.; Bi, K.; Li, Q. Targeted neurotransmitters profiling identifies metabolic signatures in rat brain by LC-MS/MS: Application in insomnia, depression and Alzheimer’s disease. Molecules 2018, 23, 2375. [Google Scholar] [CrossRef] [Green Version]
  37. Poh, E.Z.; Hahne, D.; Moretti, J.; Harvey, A.R.; Clarke, M.W.; Rodger, J. Simultaneous quantification of dopamine, serotonin, their metabolites and amino acids by LC-MS/MS in mouse brain following repetitive transcranial magnetic stimulation. Neurochem. Int. 2019, 131, 104546. [Google Scholar] [CrossRef]
  38. Han, X.-M.; Qin, Y.-J.; Zhu, Y.; Zhang, X.-L.; Wang, N.-X.; Rang, Y.; Zhai, X.-J.; Lu, Y.-N. Development of an underivatized LC-MS/MS method for quantitation of 14 neurotransmitters in rat hippocampus, plasma and urine: Application to CUMS induced depression rats. J. Pharm. Biomed. Anal. 2019, 174, 683–695. [Google Scholar] [CrossRef]
  39. Zhao, X.E.; Ruo, Y.R. Simultaneous determination of monoamine and amino acid neurotransmitters in rat endbrain tissues by pre-column derivatization with high-performance liquid chromatographic fluorescence detection and mass spectrometric identification. Talanta 2008, 76, 690–697. [Google Scholar] [CrossRef]
  40. De Freitas Silva, D.M.; Ferrez, V.P.; Ribeiro, A.M. Improved high-performance liquid chromatographic method for GABA and glutamate determination in regions of the rodent brain. J. Neurosci. Methods 2009, 177, 289–293. [Google Scholar] [CrossRef]
  41. U.S. Department of Health and Human Services Food and Drug Administration; Center for Drug Evaluation and Research (CDER); Center for Veterinary Medicine (CVM). Guidance for Industry: Bioanalytical Method Validation; FDA: Rockville, MD, USA, 2018.
  42. Nowak, P.M.; Kościelniak, P. What Color Is Your Method? Adaptation of the RGB Additive Color Model to Analytical Method. Anal. Chem. 2019, 91, 10343–10352. [Google Scholar] [CrossRef]
  43. Fayed, N.; Modrego, P.J.; Rojas-Salinas, G.; Aguilar, K. Brain glutamate levels are decreased in Alzheimer’s disease: A magnetic resonance spectroscopy study. Am. J. Alzheimers Dis. Other Dement. 2011, 26, 450–456. [Google Scholar] [CrossRef] [PubMed]
  44. Liu, H.; Zhang, D.; Lin, H.; Zhang, Q.; Zheng, L.; Zheng, Y.; Yin, X.; Li, Z.; Liang, S.; Huang, S. Meta-analysis of neurochemical changes estimated via magnetic resonance spectroscopy in mild cognitive impairment and Alzheimer’s disease. Front. Aging Neurosci. 2021, 13, 738971. [Google Scholar] [CrossRef]
  45. Koson, P.; Zilka, N.; Kovac, A.; Kovacech, B.; Korenova, M.; Filipcik, P.; Novak, M. Truncated tau expression levels determine life span of a rat model of tauopathy without causing neuronal loss or correlating with terminal neurofibrillary tangle load. Eur. J. Neurosci. 2008, 28, 239–246. [Google Scholar] [CrossRef] [PubMed]
  46. Zilka, N.; Stozicka, Z.; Kovac, A.; Pilipcinec, E.; Bugos, O.; Novak, M. Human misfolded truncated tau protein promotes activation of microglia and leukocyte infiltration in the transgenic rat model of tauopathy. J. Neuroimmunol. 2009, 209, 16–25. [Google Scholar] [CrossRef] [PubMed]
  47. Pocock, J.M.; Kettenmann, H. Neurotransmitter receptors on microglia. Trends Neurosci. 2007, 30, 527–535. [Google Scholar] [CrossRef]
  48. Liu, H.; Leak, R.K.; Hu, X. Neurotransmitter receptors on microglia. Stroke Vacs. Neurol. 2016, 1, 52–58. [Google Scholar] [CrossRef] [Green Version]
  49. Kuhn, S.A.; van Landeghem, K.H.; Zacharias, R.; Färber, K.; Rappert, A.; Pavlovic, S.; Hoffmann, A.; Nolte, C.; Kettenmann, H. Microgila express GABAB receptors to modulate interleukin release. Mol. Cell. Neurosci. 2004, 25, 312–322. [Google Scholar] [CrossRef]
  50. Mead, E.L.; Mosley, M.; Eaton, S.; Dobson, L.; Heales, S.J.; Pocock, J.M. Microglial neurotransmitter receptors trigger superoxide production in microglia; consequences for microglial-neuronal interactions. J. Neurochem. 2012, 121, 287–301. [Google Scholar] [CrossRef]
  51. Axford, J.S.; Howe, F.A.; Heron, C.; Griffiths, J.R. Sensitivity of quantitative (1)H magnetic resonance spectroscopy of the brain in detecting early neuronal damage in systemic lupus erythematosus. Ann. Rheum. Dis. 2001, 60, 106–111. [Google Scholar] [CrossRef]
  52. Emmer, B.J.; van der Bijl, A.E.; Huizinga, T.W.J.; Breedveld, F.C.; Steens, S.C.A.; Bosma, G.P.T.; van Buchem, M.A.; van der Grond, J. Brain involvement in rheumatoid arthritis: A magnetic resonance spectroscopy study. Arthritis Rheum. 2009, 60, 3190–3195. [Google Scholar] [CrossRef] [PubMed]
  53. Jung, C.; Ichesco, E.; Ratai, E.-M.; Gonzalez, R.G.; Burdo, T.; Loggia, M.L.; Harris, R.E.; Napadow, V. Magnetic resonance imaging of neuroinflammation in chronic pain: A role for astrogliosis? Pain 2020, 161, 1555–1564. [Google Scholar] [CrossRef] [PubMed]
  54. Pederzolli, C.D.; Sgaravatti, A.M.; Braum, C.A.; Prestes, C.C.; Zorzi, G.K.; Sgarbi, M.B.; Wyse, A.T.S.; Wannmacher, C.M.D.; Wajner, M.; Dutra-Filho, C.S. 5-oxoproline reduces non-enzymatic antioxidant defenses in vitro in rat brain. Metab. Brain Dis. 2007, 22, 51–65. [Google Scholar] [CrossRef] [PubMed]
  55. Pederzolli, C.D.; Mescka, C.P.; Zandoná, B.R.; Coelho, D.M.; Sgaravatti, A.M.; Sgarbi, M.B.; Wyse, A.T.S.; Wannmacher, C.M.D.; Wajner, M.; Vargas, C.R.; et al. Acute administration of 5-oxoproline induces oxidative damage to lipids and proteins and impairs antioxidant defense in cerebral cortex and cerebellum of young rats. Metab. Brain Dis. 2010, 25, 145–154. [Google Scholar] [CrossRef] [PubMed]
  56. Kincses, Z.T.; Toldi, J.; Vécsei, L. Kynurenines, neurodegeneration and Alzheimer’s disease. J. Cell. Mol. Med. 2010, 14, 2045–2054. [Google Scholar] [CrossRef] [Green Version]
  57. Heyes, M.P.; Saito, K.; Major, E.O.; Milsien, S.; Markey, S.P.; Vickers, J.H. A mechanism of quinolinic acid formation by brain in inflammatory neurological disease. Attenuation of synthesis from L-tryptophan by 6-chlorotryptophan and 4-chloro-3-hydroxyanthranilate. Brain 1993, 116, 1425–1450. [Google Scholar] [CrossRef] [PubMed]
  58. Naristin, D.B.; Saito, K.; Markey, S.P.; Chen, C.Y.; Heyes, M.P. Metabolism of L-tryptophan to kynurenate and quinolinate in the central nervous system: Effects of 6-chlorotryptophan and 4-chloro-3-hydroxyanthranilate. J. Neurochem. 1995, 65, 2217–2226. [Google Scholar]
  59. Campbell, B.M.; Charych, E.; Lee, A.W.; Möller, T. Kynurenines in CNS disease: Regulation by inflammatory cytokines. Front. Neurosci. 2014, 8, 12. [Google Scholar] [CrossRef] [Green Version]
Figure 1. Overlapped SRM chromatograms of nine NT, tryptophan and kynurenine (A) and their internal standards (B) obtained from the analysis of quality control (QC) sample at the medium concentration level. 1—Ach, 2—Chol, 3—Trp, 4—Kyn, 5—PyroGlu, 6—NAA, 7—GABA, 8—Gln, 9—Asn, 10—Glu, 11—Asp, 1*—D9-Ach, 2*—D9-Chol, 3*—D5-Trp, 4*—D4-Kyn, 5*—D5-PyroGlu, 6*—D3-NAA, 7*—D6-GABA, 8*—D5-Gln, 9*—D5-Asn, 10*—D93-Glu, 11*—D3-Asp.
Separations 09 00016 g001
Figure 2. Overlapped representative SRM chromatograms obtained from the analysis of SHR 24 brain tissue sample from medulla oblongata. 1—Ach, 2—Chol, 3—Trp, 4—Kyn, 5—PyroGlu, 6—NAA, 7—GABA, 8—Gln, 9—Asn, 10—Glu, 11—Asp.
Separations 09 00016 g002
Figure 3. The changes in selected NT, tryptophan and kynurenine concentrations in brain tissue samples obtained from SHR 24 transgenic rats (SHR 24) and from control age-matched rats (SHR).
Separations 09 00016 g003
Table 1. Selected MS/MS conditions for analysis of NT, Trp, Kyn and their internal standards.
Precursor Ion (m/z)Product Ion (m/z)Cone Voltage (V)Collision Energy (eV)
Ach146.160.01614
D9–Ach155.187.01614
Chol104.144.94130
D9–Chol113.169.04130
Trp204.9146.02120
D5–Trp209.9150.02120
Kyn209.694.12612
D5–Kyn213.198.12612
PyroGlu130.184.02013
D5–PyroGlu135.189.02013
NAA176.2134.11610
D3–NAA179.1137.11610
GABA104.086.92011
D6–GABA110.192.12011
Gln147.184.02018
D5–Gln152.189.12018
Asn133.187.01612
D5–Asn137.997.01612
Glu148.284.02018
D3–Glu151.186.12018
Asp134.174.01612
D3–Asp137.091.01612
Table 2. Selected operation and validation parameters of the LC-MS/MS method.
AchCholTrpKynPyroGluNAAGABAGlnAsnGluAsp
tR (min)0.871.492.602.613.163.333.734.744.915.185.38
a (counts)−0.00010.0115−0.0829−0.0752−0.0001−0.0017−0.0167−0.0145−0.0015−0.0062−0.0137
RSDa (%), n = 66.92.08.57.43.86.82.67.04.77.81.3
b (counts × µg−1 × mL)0.05480.06170.09480.08260.00730.00810.03630.19620.00670.20740.1314
RSDb (%), n = 60.30.30.50.70.80.80.30.40.40.90.8
r20.99980.99990.99520.99460.99920.99940.99930.99980.99970.99800.9985
Linear range
(µg/mL)
0.025–2.52.5–2500.1–250.1–250.25–250.25–252.5–2502.5–2500.25–252.5–2502.5–250
LOD (µg/mL)0.010.910.070.070.050.240.971.220.121.681.70
LLOQ (µg/mL)0.0252.50.10.10.250.252.52.50.252.52.5
tR—retention time, RSDa—relative standard deviation of the intercept, RSDb—relative standard deviation of the slope. The calibration curve is expressed by the equation y = bx + a, where b is slope and a is intercept.
Table 3. Accuracy, precision and recovery of the UHPLC-MS/MS method for analysis of selected NT, tryptophan and kynurenine.
Intra-Day, n = 6Inter-Day, n = 12
AnalyteQC LevelNominal (µg/mL)Found (µg/mL)CV (%)Accuracy (%)Found (µg/mL)CV (%)Accuracy (%)Recovery (%)
AchLow0.0250.02511.3101.60.0214.399.391.8
Medium0.250.254.2100.20.263.9102.288.2
High2.52.510.7100.22.531.4101.190.1
CholLow2.52.647.2105.62.489.399.387.0
Medium1010.150.7101.510.160.5101.694.3
High250250.800.9100.3250.561.6100.294.6
TrpLow0.10.1011.9101.30.1114.5111.487.3
Medium54.955.599.04.615.492.190.2
High2526.033.1104.124.833.999.390.0
KynLow0.10.119.5107.10.1212.4119.690.5
Medium54.384.887.64.527.490.481.6
High2524.312.797.323.454.793.892.6
PyroGluLow0.250.2310.792.20.2214.488.974.8
Medium2.52.542.0101.62.553.6102.075.2
High2525.332.8101.325.043.6100.287.8
NAALow0.252.6110.1104.52.1814.487.285.0
Medium2.523.986.395.910.054.5100.588.8
High25249.793.299.9257.725.0103.188.1
GABALow2.52.364.994.32.553.5101.979.4
Medium1010.241.1102.410.271.1102.799.3
High250250.560.8100.2252.091.1100.8103.3
GlnLow2.52.276.690.62.508.7100.187.4
Medium1010.160.7101.610.150.6101.594.3
High250250.400.6100.2249.700.899.993.3
AsnLow0.250.257.298.70.249.297.173.4
Medium2.52.552.3102.02.513.2100.597.5
High2524.911.199.724.871.199.5103.7
GluLow2.52.405.896.12.416.396.392.5
Medium1010.334.6103.310.165.0101.691.1
High250250.742.7100.3249.643.199.989.9
AspLow2.52.366.494.42.386.195.385.3
Medium109.702.397.09.613.996.189.7
High250250.572.8100.2252.042.2100.894.1
Table 4. Stability testing of the NT, tryptophan and kynurenine.
Autosampler Stability (24 h), n = 6Freeze-to-Thaw Stability, n = 6
AnalyteQC LevelNominal (µg/mL)Found (µg/mL)Accuracy (%)Found (µg/mL)Accuracy (%)
AchLow0.0250.03101.90.0296.3
Medium0.250.2495.50.2497.4
High2.52.64105.72.62104.6
CholLow2.52.50100.12.4798.8
Medium1010.25102.510.25102.5
High250244.1197.6243.6497.5
TrpLow0.10.0986.60.0986.1
Medium109.3993.99.2992.9
High2525.33101.323.3093.2
KynLow0.10.0880.00.0883.9
Medium109.4394.39.3393.3
High2522.9390.723.2593.0
PyroGluLow0.250.2598.80.2183.0
Medium2.52.4698.42.58103.0
High2523.7995.2253.04101.2
NAALow0.250.25100.20.29116.0
Medium2.52.71108.22.80111.9
High2524.3497.326.08104.3
GABALow2.52.4196.42.52100.7
Medium1010.23102.39.7297.2
High250243.1897.3248.5099.4
GlnLow2.52.5099.92.54101.5
Medium109.7297.29.5595.5
High250246.5198.6246.6098.6
AsnLow0.250.2185.00.26104.2
Medium2.52.51100.32.53101.2
High2525.17100.724.4497.7
GluLow2.52.4798.82.69107.7
Medium108.7887.89.7897.8
High250241.5196.6252.23100.9
AspLow2.52.3794.72.3092.1
Medium109.3593.510.24102.4
High250242.7497.1252.4101.0
Table 5. Brain tissue concentrations of NT, tryptophan and kynurenine in different parts of brain. Data are presented as mean ± standard deviation (SD).
Medulla OblongataPonsFrontal CortexParietal Cortex
SHR 24 (µg/mg)Control (µg/mg)SHR 24 (µg/mg)Control (µg/mg)SHR 24 (µg/mg)Control (µg/mg)SHR 24 (µg/mg)Control (µg/mg)
Ach16.120 ± 4.67114.154 ± 3.72912.559 ± 3.69412.942 ± 4.5290.024 ± 0.0130.018 ± 0.0050.014 ± 0.0070.012 ± 0.006
Chol0.075 ± 0.0290.043 ± 0.0170.203 ± 0.0630.119 ± 0.0310.229 ± 0.0350.107 ± 0.0310.087 ± 0.0530.077 ± 0.047
Trp0.012 ± 0.0020.011 ± 0.0020.003 ± 0.0010.002 ± 0.0010.007 ± 0.0110.005 ± 0.0010.005 ± 0.0010.005 ± 0.001
Kyn0.014 ± 0.0030.015 ± 0.0030.025 ± 0.0370.044 ± 0.0440.114 ± 0.0110.121 ± 0.0450.142 ± 0.0240.123 ± 0.025
PyroGlu0.527 ± 0.4661.010 ± 0.4120.175 ± 0.0390.166 ± 0.0330.458 ± 0.2470.441 ± 0.3270.436 ± 0.2080.482 ± 0.190
NAA3.062 ± 0.2643.002 ± 0.1961.770 ± 0.1191.986 ± 0.0992.672 ± 0.6282.647 ± 0.3442.621 ± 0.5092.200 ± 0.507
GABA0.247 ± 0.0440.215 ± 0.0320.301 ± 0.0310.216 ± 0.0230.378 ± 0.1370.319 ± 0.0770.380 ± 0.1200.300 ± 0.089
Gln0.980 ± 0.0671.117 ± 0.4870.859 ± 0.0511.018 ± 0.4951.928 ± 0.5092.105 ± 0.9571.818 ± 0.3361.774 ± 0.520
Asn0.021 ± 0.0030.022 ± 0.0050.020 ± 0.0020.020 ± 0.0030.032 ± 0.0080.031 ± 0.0070.025 ± 0.0070.023 ± 0.006
Glu1.227 ± 0.1091.276 ± 0.0591.285 ± 0.0981.365 ± 0.0742.634 ± 0.6502.516 ± 0.2972.774 ± 0.5552.429 ± 0.599
Asp0.632 ± 0.0810.582 ± 0.0640.746 ± 0.0840.615 ± 0.0750.885 ± 0.2640.815 ± 0.1370.739 ± 0.1160.592 ± 0.118
Publisher’s Note: MDPI stays neutral with regard to jurisdictional claims in published maps and institutional affiliations.

