Article

Comparison between Mid-Infrared (ATR-FTIR) Spectroscopy and Official Analysis Methods for Determination of the Concentrations of Alcohol, SO2, and Total Acids in Wine

1
Department of Pharmacy, University of Naples Federico II, Via Domenico Montesano 49, 80131 Napoli, Italy
2
Lcm Laboratorio Chimico Merceologico, Corso Meridionale, 80143 Napoli, Italy
*
Author to whom correspondence should be addressed.
Separations 2021, 8(10), 191; https://doi.org/10.3390/separations8100191
Submission received: 29 August 2021 / Revised: 2 October 2021 / Accepted: 15 October 2021 / Published: 17 October 2021

Abstract

:
The determination of alcohol, SO2, and total acids in wine through conventional laboratory techniques have some limitations related to the amount of the samples, analytical preparation of laboratory staff, and time to carry out the analysis. In recent years, spectroscopic and chromatographic methods have been proposed to determinate simultaneously multiple analytical parameters. The new methods claim the speed of analysis and easy execution. However, they need a validation process that guarantees the reliability of the results to be used in official determinations. This study aimed to evaluate the usefulness of FT-infrared reflectance (FT-IR) to quantify total acid, alcohol, and SO2 concentration in the wines. For this purpose, 156 DOC Italian wines were tested with IR technology, and results were compared to those obtained by official analysis methods. The comparison was performed using two non-parametric statistical methods: the Bland & Altman test and Passing & Bablok regression. Our results showed that the spectrophotometric methods make errors due to interfering contaminants in the sample that can be corrected by blank determination. Therefore, the spectrophotometric methods that use the infrared region of the electromagnetic spectrum can be used by the wine industry and regulators for the wine routine as an alternative to official methodologies.

1. Introduction

Ischia DOC Piedirosso (or Per’e Palummo) wine is one of the types of wine provided by the Ischia DOC denomination, a DOC of the Campania region (Italy). DOC wines are characterized by the vines used for their production, vinification procedures, and the specific organoleptic characteristics of the wine. The vines included in the composition of the Ischia DOC Piedirosso or Per’e Palummo wine are at least 85% Piedirosso [1]. The organoleptic characteristics of Ischia DOC Piedirosso or Per’e Palummo include a ruby red color. The olfactory profile of the Ischia DOC Piedirosso or Per’e Palummo wine is vinous, characteristic, and pleasant, and on the palate, it is dry, medium-bodied, and tannic.
As with all wines, total acidity, alcoholic strength, and SO2 concentration are indicators of wine qualities [2]. Organic acid (malic, lactic, and tartaric acids), together with tannins, ethanol, sugars (glucose and fructose), and glycerol, affects wine taste [3]. Acetic and formic acids can alter the balance between acidity, volatile notes, and sweetness in the wine aroma. Sulfur dioxide is used in winemaking as an antioxidant to prevent color changes due to undesirable reactions [4,5], a disinfectant, and a preventer of microbial spoilage [6]. However, an excess of SO2 increases unpleasant wine flavor and can cause allergy, asthma, and damage to human organs and tissues [7]. Alcohol concentration is essential for the stability, aging, and organoleptic assets of wine. Ethanol affects ‘microorganisms’ growth during fermentation [8], determines the types and the concentrations of aromatic compounds [9], defines the balance of the wine, and solves aromatic and coloring compounds. High alcohol content covers some volatile aromatic compounds, enhances the perception of hotness and bitterness while decreasing the astringency of tannins [10]. During wine production, analytical tests are performed to ensure the optimum conditions to enhance the fermentation. Depending on the scale of production, classical chemical analysis or modern analytical instruments are employed. The official methods [11] used to perform the wine analysis are precision manual tests with high robustness, but at the same time are laborious, destructive, expensive, and have time-consuming characters. Spectrophotometric non-destructive and fast methods that could evaluate in real-time and make a broader range of analyses, requiring minimal preparation procedure, have been developed to test the wine parameters, avoiding the problem due to many samples to be analyzed. Among these, the IR technology has proven precise, accurate, and gives valuable information about the chemical properties, permitting the identification, characterization, and quality control of several analytical parameters from a single measurement [12]. IR spectra are due to the transitions within the vibrational level. The IR region is at wavelengths ~2500–25,000 nm. The energy of this spectrum domain promotes vibrational excitation of covalently bonded atoms, offering information about the chemical and physical properties of samples. In food analysis, medium and near-infrared spectra are diagnostic [13]. The medium infrared (MIR) spectrum (4000–500 cm−1) gives information due to the rotational fingerprint absorptions and excitation of specific fundamental vibrational of molecular species [14]. Instead, the near infrared (NIR) spectrum is related to combination bands and overtones of the fundamental vibrations [15]. New technologies increase the volume and quality of data obtainable in real-time and decrease the cost of the analyses. If comparable with those obtained with official methods, these data are a resource for advancing applications, systems, and models.
On the other hand, an incorrect quantification of analytical parameters determines consequences on human health and damages the laboratory’s reputation. Therefore, it is essential to validate automated spectrophotometric methods to establish their use in the enological laboratories and traceability of the data obtained. Governments have created Legal agencies to verify if the analytical laboratories perform their work correctly and explain the guidelines for validating the analytical method [16]. To pass the accreditation, the laboratories must verify the compliance of the tested method with the national and international regulations ISO/IEC, 2005 [17]. Validation exercise interrupts the normal working of the laboratory and is time-consuming and expensive. It would be helpful if the results of the validations found more and more space among the scientific works to create a collection of analytical methods for the analysis of food matrices that serve as references for analytical laboratories to avoid unnecessary wastes of time [18,19,20]. This study aimed to validate FT-IR reflectance methods to quantify wine’s total acid, alcohol, and SO2 levels.

2. Materials and Methods

2.1. Chemicals

Chemicals were bought from Sigma Aldrich (St. Louis, MO, USA). Solvents, either analytical or spectrophotometric grade, were bought from Sigma Aldrich (St. Louis, MO, USA).

2.2. Samples

Wine samples “Ischia Piedirosso” (2015 vintage) were bought from commercial wineries in South Italy. A total of 156 DOC non-pretreated wines was analyzed. Samples were analyzed immediately upon opening and placed into the instrument without any centrifugation.

2.3. Official Methods

All wines were analyzed by official methods to analyze wines [11].
  • Alcohol determination was performed as follows: 50 mL of the wine sample was distilled, and the alcohol was calculated from the density of the distillate by an oscillation-type density meter (DMA 48, Anton Paar GmbH, Graz, Austria).
  • Total acids were calculated as tartaric acid by titrating to pH 7.0 with 0.33 mol/L NaOH with a pH-meter (Crison Basic 20 Crison Strumenti S.p.A. Carpi (MO), Italy).
  • Total SO2 was measured by iodometric titration. Sodium hydroxide solution 1 M (25 mL) was pipetted into a conical flask containing a wine sample (50 mL). The flask was shaken well and left (15 min). The 25% sulfuric acid (10 mL) and the starch indicator (2–3 drops) were added. The solution was titrated with iodine solution (0.01 M) until blue color appeared.
[SO2] = 12.8× iodine (mL).

2.4. Winescan Technology

The wine analysis was performed by WineScan FT 120 (FOSS, Hillerod, Denmark), equipped with an FT-IR equalizer, a DTGS pyroelectric detector, a HeNe laser (632 nm), and a silicium detector to track the position of the moving mirror in the interferometer. Cell (volume of 3.276 mL) was equipped with two CaF2 windows (10 mm diameter circle with 2 mm thickness and an optical aperture of 88.54 mm2. An optical resolution of 14 cm−1 × 2000 cm−1 and averaging based on 10 scans was used. Wave numbers were reported in the WineScan software as pin-numbers. The relationship between wavenumbers and pin-numbers was as follows: Wavenumber (cm−1) = 3.858 × pin-number (wavenumbers were quoted with pin-numbers in parentheses).
Multivariate calibration, specifically PLSR (partial least squares regression), was used to adjust the calibration equations for each parameter. A background single-beam spectrum was used as blank. The instrument automatically carries out two acquisitions for each sample, each of which has an average of 10 scans. Teflon put on the same glass slides employed for the spectral acquisition was used to prevent interferences due to the glass slide. The minimum point on the predicted residual error sum of squares plot regulated the number of factors used for each constituent. The suitability of the calibration model was measured by calculating the standard errors (SE) between the reference method(s) and the values obtained by leave-one-out cross-validation predictions. The method’s performance was validated by calculating the standard deviation error between the predicted and reference values obtained by analyzing 157 samples. The normality of the data was verified by applying the Kolmogorov–Smirnov test. The non-parametric Bland & Altman test and Passing & Bablok test determined the outliers.
Five broad spectral regions were considered in developing the PLS calibration models by examining the pure component spectra. The optimal spectral region (or combination of spectral regions) for the estimation of each of the 3 parameters were selected by cross-validation statistics. The spectral regions used in the PLS calibration model were: SO2 (1500−850 cm−1), total acidity (1500−1108 cm−1; 1801−1500 cm−1), and alcohol (1500−850 cm−1; 1500−1108 cm−1; 1801−1500 cm−1).
The apparatus was washed with a cleaning agent (S-470) and zeroed with Zero set liquid (S-6060) every 120 min with the proprietary solutions supplied by FOSS (FOSS, Hillerod, Denmark), and performed in the standardization procedure with the “Equalizer” solution supplied by FOSS (FOSS, Hillerod, Denmark).

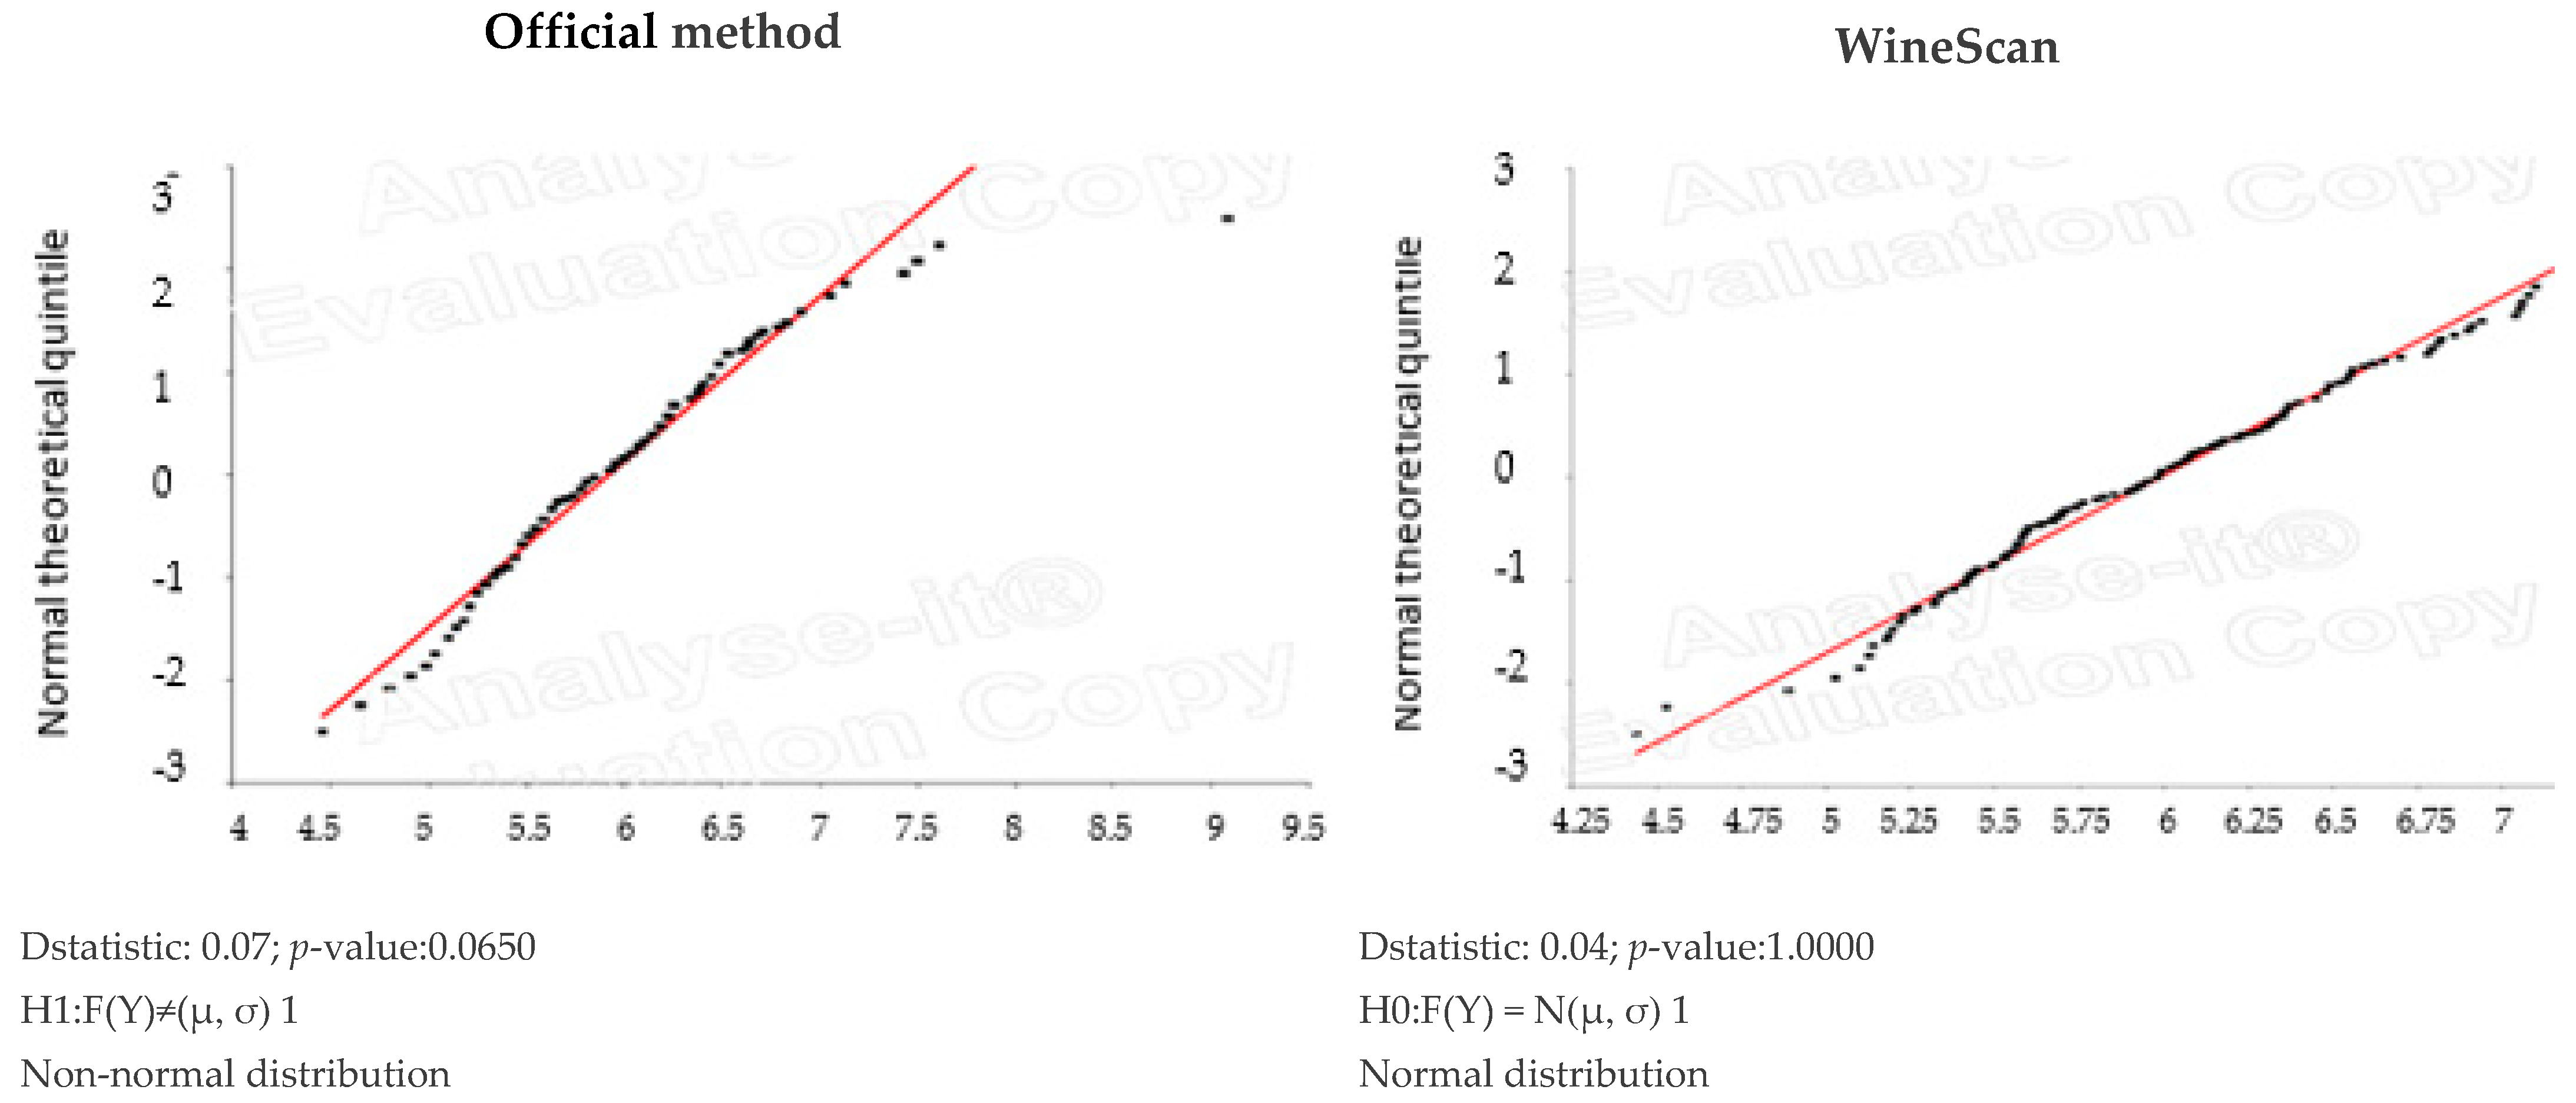
2.5. Statistical Analysis

Kolmogorov–Smirnov, Bland & Altman test, and Passing & Bablok tests were carried out by Analyse-it software (Analyse-it Software, Ltd., Leeds, UK). A p-value > 0.05 was considered significant.

3. Results

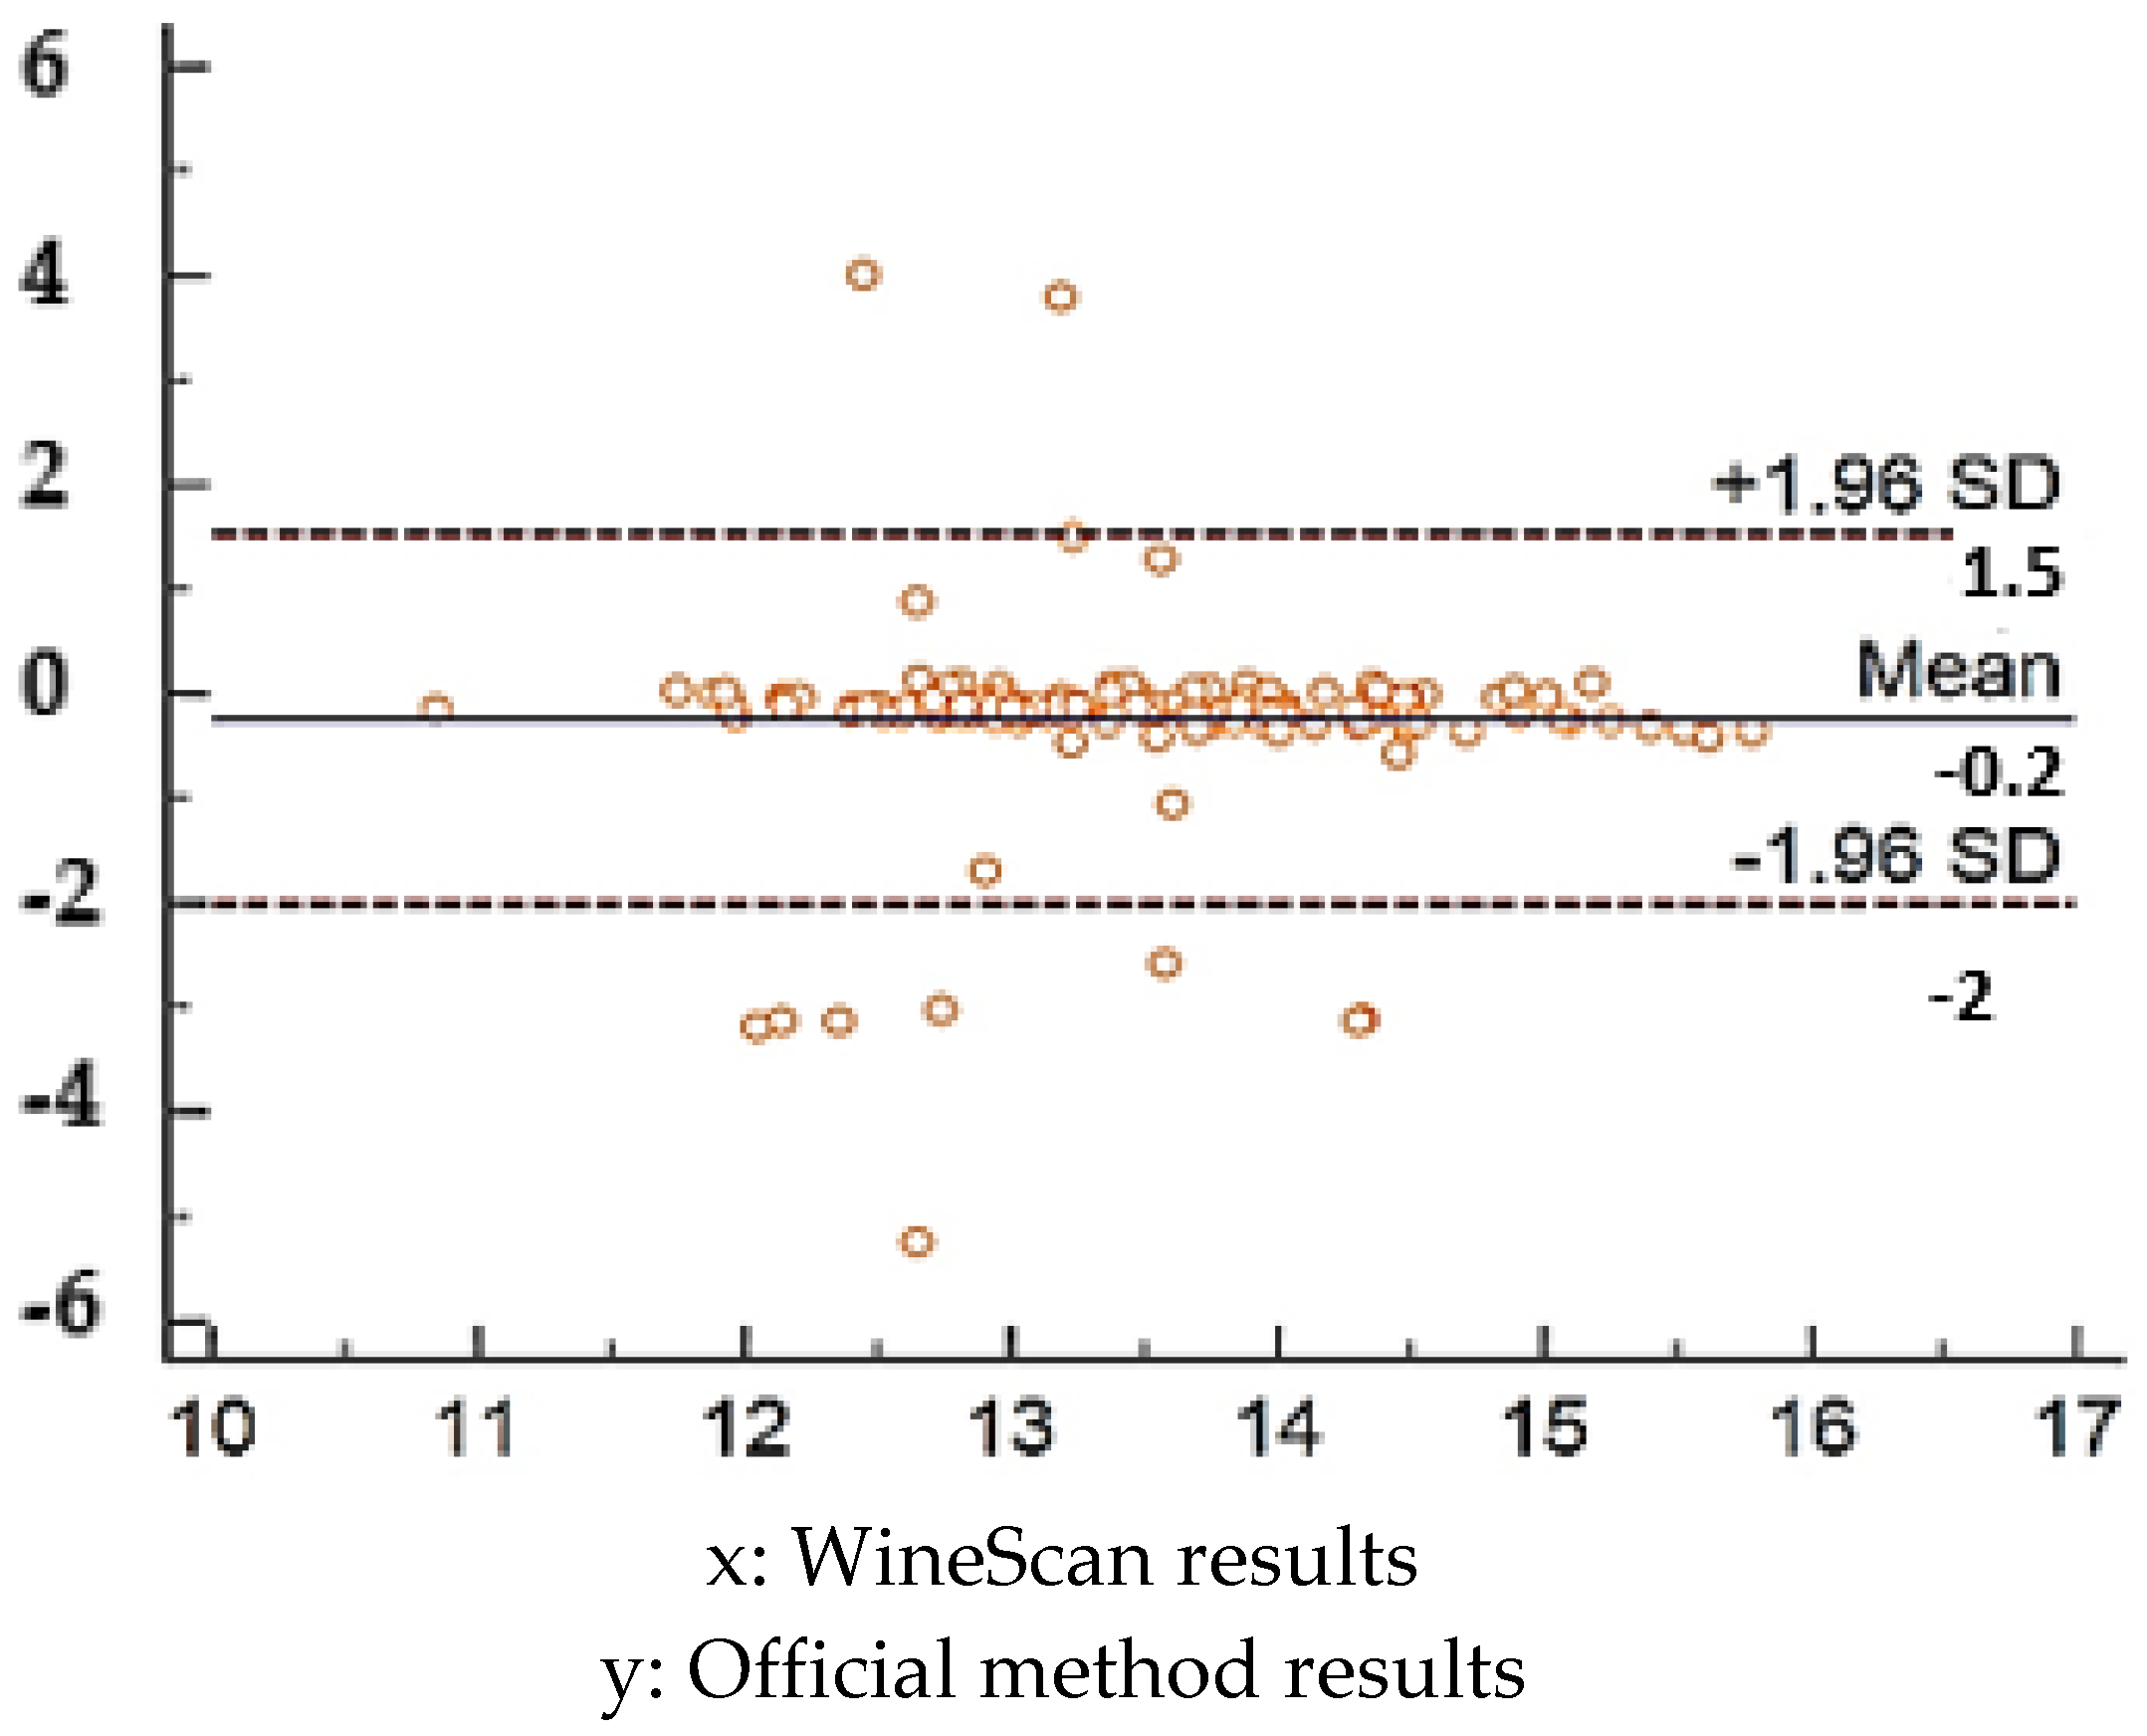
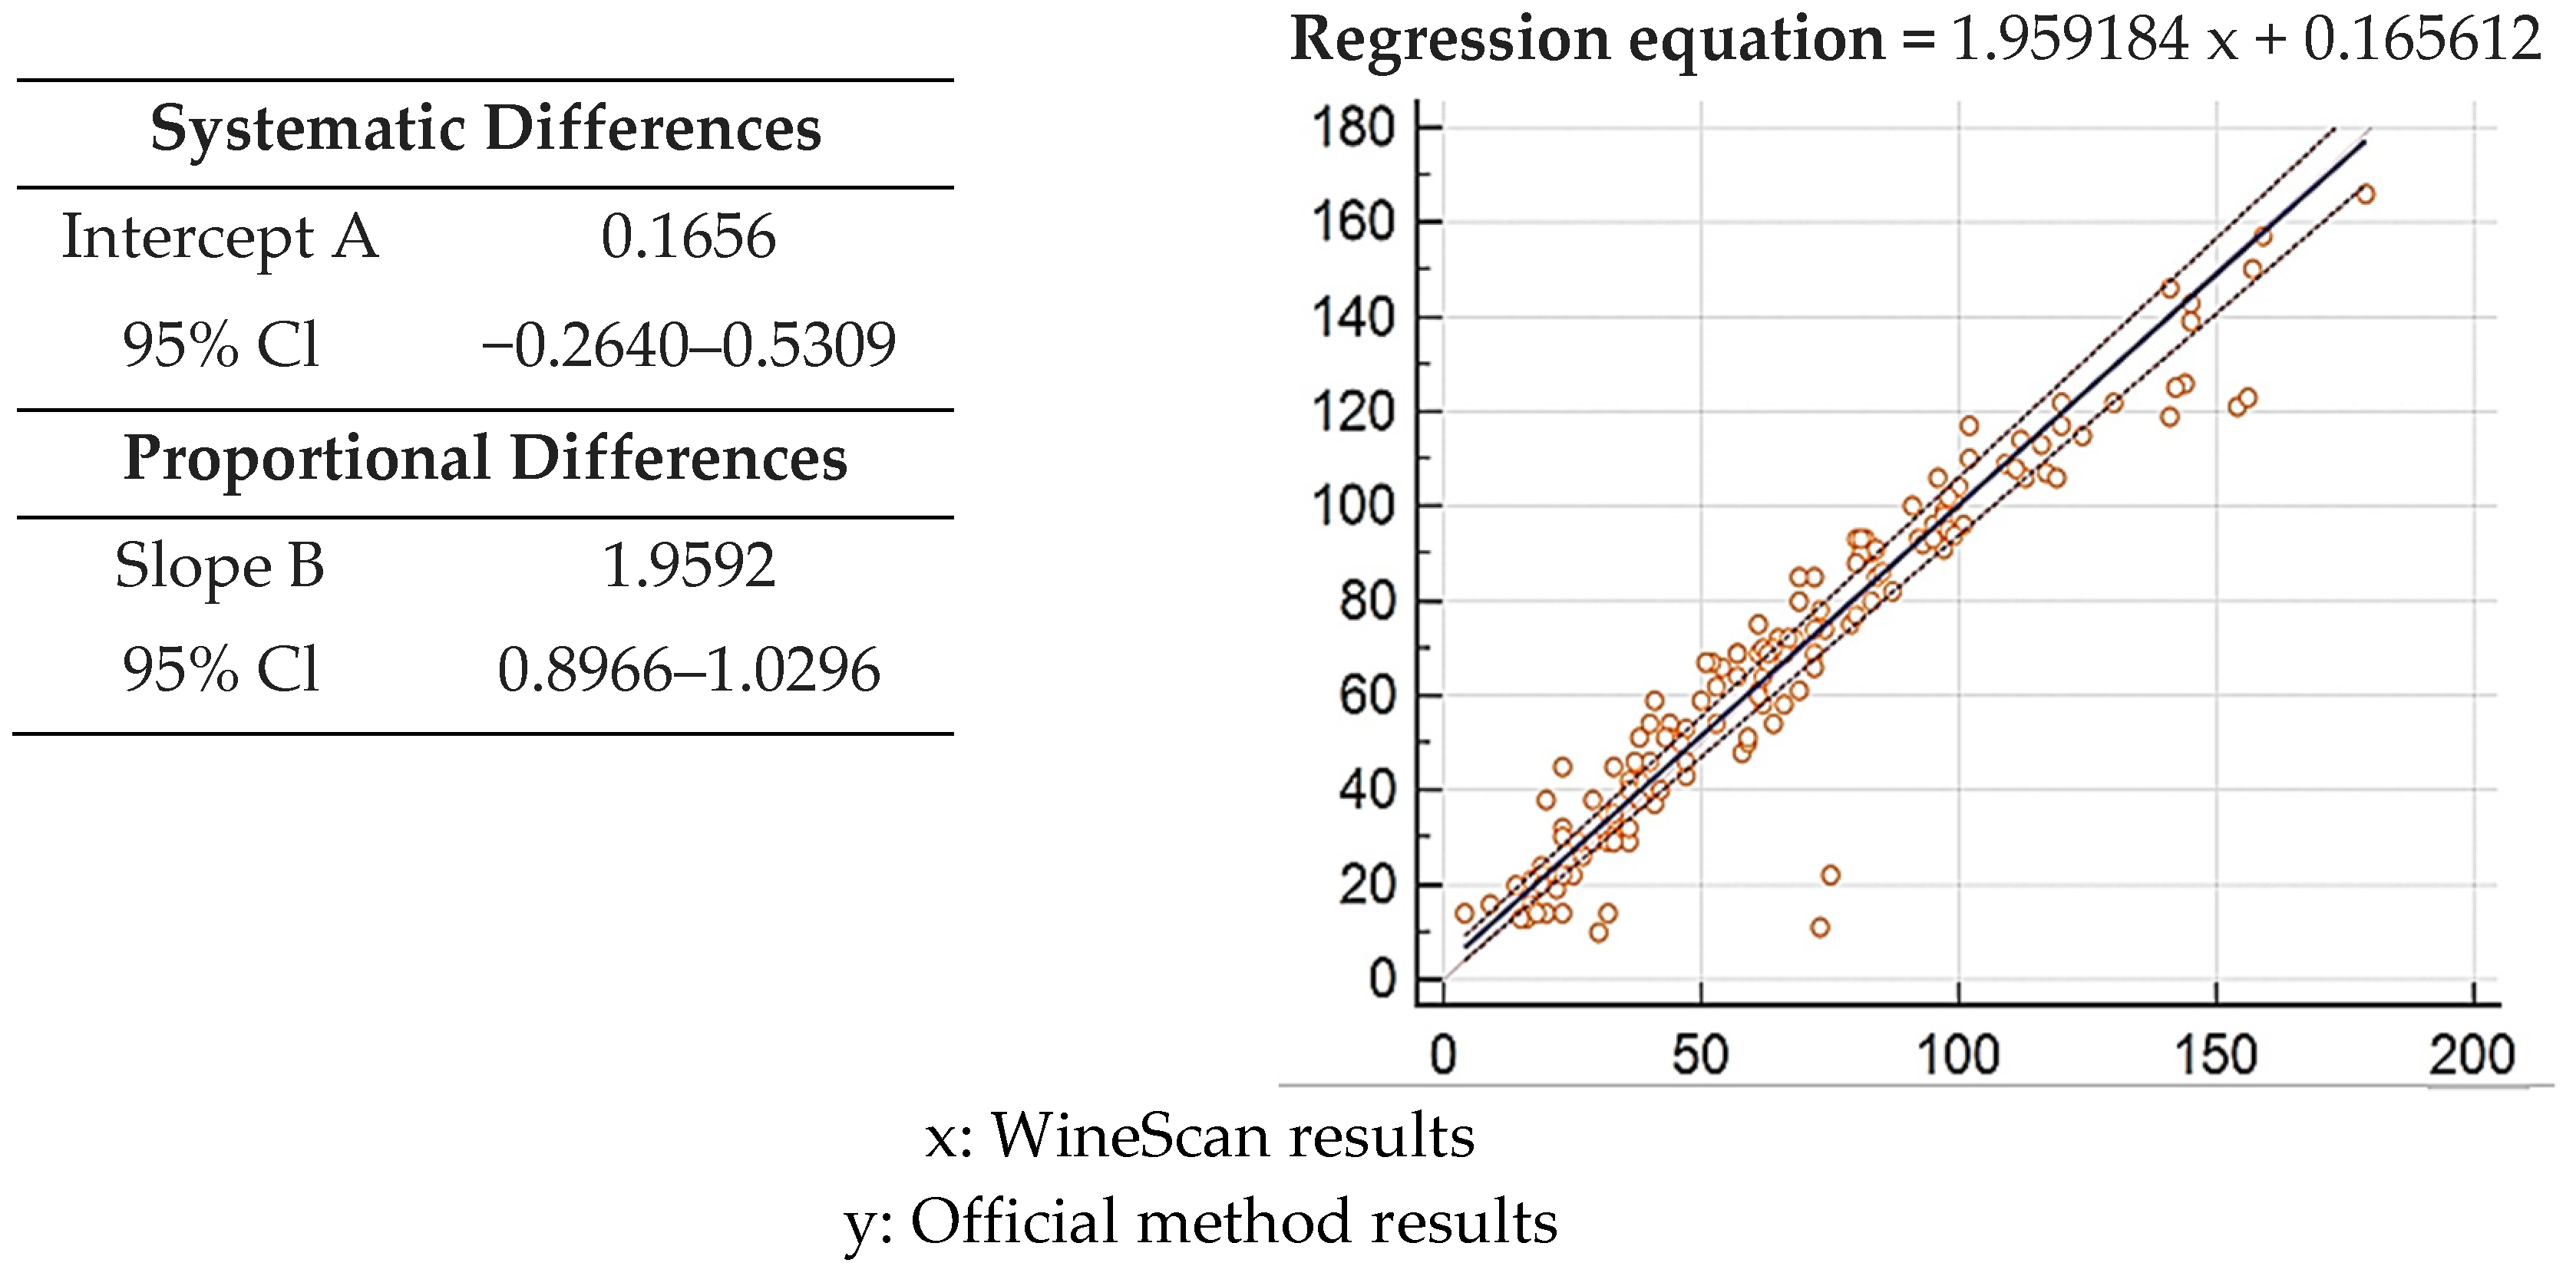
3.1. Validation of SO2 Concentration Obtained by Winescan Technology

In wine, SO2 is free (SO2, SO32−, H2SO3, and HSO3) or linked to aldehydes or ketones. It is one of the most analyzed wine components to guarantee performance without sensory impacts. The European Union (EU) regulated the maximum concentration of SO2 that can be added to the wine (red wine 160 μg mL−1 and white/rosé wine 210 μg mL−1) [11]. The World Health Organization (WHO) and the Food and Agriculture Organization (FAO) established the acceptable SO2 daily intake (0.7 μg g−1 body weight) [21]. The official methods [11] measure SO2 by titration (Ripper method) [22]. This method depends on the conversion of sulfite to sulfur dioxide in acidic acid. Successively, SO2 is distilled and collected in a hydrogen peroxide solution that oxidizes SO2 to sulfuric acid. Finally, H2SO4 is titrated with sodium hydroxide solution using bromophenol or blue methyl red as indicators. Alternatively, after distillation, a titration was employed against standard iodine in the presence of starch [23]. In recent years, new methods, including chromatographic [24], spectrometric [25,26,27,28,29,30], and electrochemistry methodologies [31], have been developed to allow faster determination to analyze many samples in a short time. Headspace gas chromatography [30,32,33], liquid chromatography (LC) [34], and high-performance liquid chromatography (HPLC) were chromatographic apparatuses used to isolate sulfur dioxide in wine, and ultraviolet-visible (UV-Vis), phosphorescence, chemiluminescence, infrared (IR), and mass spectrometer dose it. UV–Vis detection is based on radiation emission, determining transitions between distinct electronic states [34].
Fluorescence emission (visible and IR range) regulates transitions of the singlet excited electronic state from the lowest vibrational level to the ground state. In both cases, the sulfites’ determination in wine implies a reaction with an agent and stabilizes the reaction product. The pentacyanidonitrosylferrate II [35], the Schiff’s fuchsin reagent [36,37], or the chromate [38] is used to determine it in the visible spectrum. The 2-(2-(9-(2-carboxyphenyl)−6(diethylamino)−3-oxo-3H-xanten-2-yl)vinyl)−3-methyl benzothiazole-3-ium [39], the (E)−2-(benzothiazol-2-yl)−3-(6-hydroxynaphthalen-2-yl) [40], the benzopyrylium-based heterocyclic [41], or silica nanoparticles with iridium (III) complex [42] are employed as fluorescent probe. Chemiluminescence is light emission that occurs when peroxide and luminol react in alkaline media. The immobilization of peroxidase and sulfite oxidase on polycarbonate membranes acts as a fiber-optic biosensor [43].
Finally, voltammetry and amperometry techniques were proposed. The sulfur dioxide voltametric analytical peak is due to its oxidation to sulfate. Cyclic voltammograms showing sulfite electro-oxidation at a glassy carbon or platinium electrode at pH = 7.0 [35,36,37]. In this study, the WineScan FT 120 instrument was employed to generate the spectra in the mid-infrared region (926 to 5000 cm−1) (Figure 1 and Figures S1–S4). The WineScan FT 120 instrument is a speed and multicomponent analytical instrument already employed in studies on wine quality determinations [44].
The measure of the calibration exactness
The standard error (SE) proved the exactness of calibration
The average and standard deviation of the data found with the official and spectrophotometric methods were calculated. The results obtained by the official method were 0.4% higher than those got by WineScan technology (Figure 2).
The mean and the deviation standard of samples were compared with the Kolmogorov-Smirnov test to establish if the two datasets differed significantly [45] (Figure 3).
The results of the Kolmogorov–Smirnov test revealed that some data were not normally distributed. Therefore, two non-parametric tests (Bland & Altman test and Passing & Bablok test) [24,46] were used to evaluate a significant difference between the factor levels. The Bland & Altman test [24] was performed to define the limits of agreement between official and WineScan methods (Figure 4).
The Bland–Altman analysis suggests that the WineScan and standard methods used for quantitative measurements of samples agree within 95% of probability. Proportional and constant errors were checked by the Passing & Bablok regression analysis (Figure 5).
Our results showed that most values are distributed around the regression line. Therefore, the data obtained with the two types of analysis are comparable in dosage.

3.2. Validation of Alcohol Concentration Obtained by WineScan Technology

The reference method to determine alcohol concentration in wine consists of density and pycnometric determinations preceded by a distillation step. Some new, inexpensive procedures are proposed, including electronic densimetry [47,48,49,50], titration methods [51], enzymatic analysis [52,53], and chromatographic methods (liquid chromatography or gas chromatography) [54,55]. However, these methods do not offer a clear advantage over reference methods and are complex, labor-intensive, and time-consuming.
In this work, the results obtained by WineScan were compared with those obtained by the official method. The results obtained by WineScan technology were 1.4% higher than those obtained by the official method (Figure 6).
The normality of the data sets was verified by the Kolmogorov–Smirnov test (Figure 7).
The results of the official method were non-normally distributed. Instead, the WineScan results were normally distributed. Therefore, also, in this case, the statistical analysis continued using non-parametric analysis methods. The Bland–Altman analysis showed that the results of WineScan and standard methods agreed within 95% of probability (Figure 8).
The Passing & Bablok (P&B) regression analysis confirmed the comparable dosages obtained with two methods. (Figure 9).

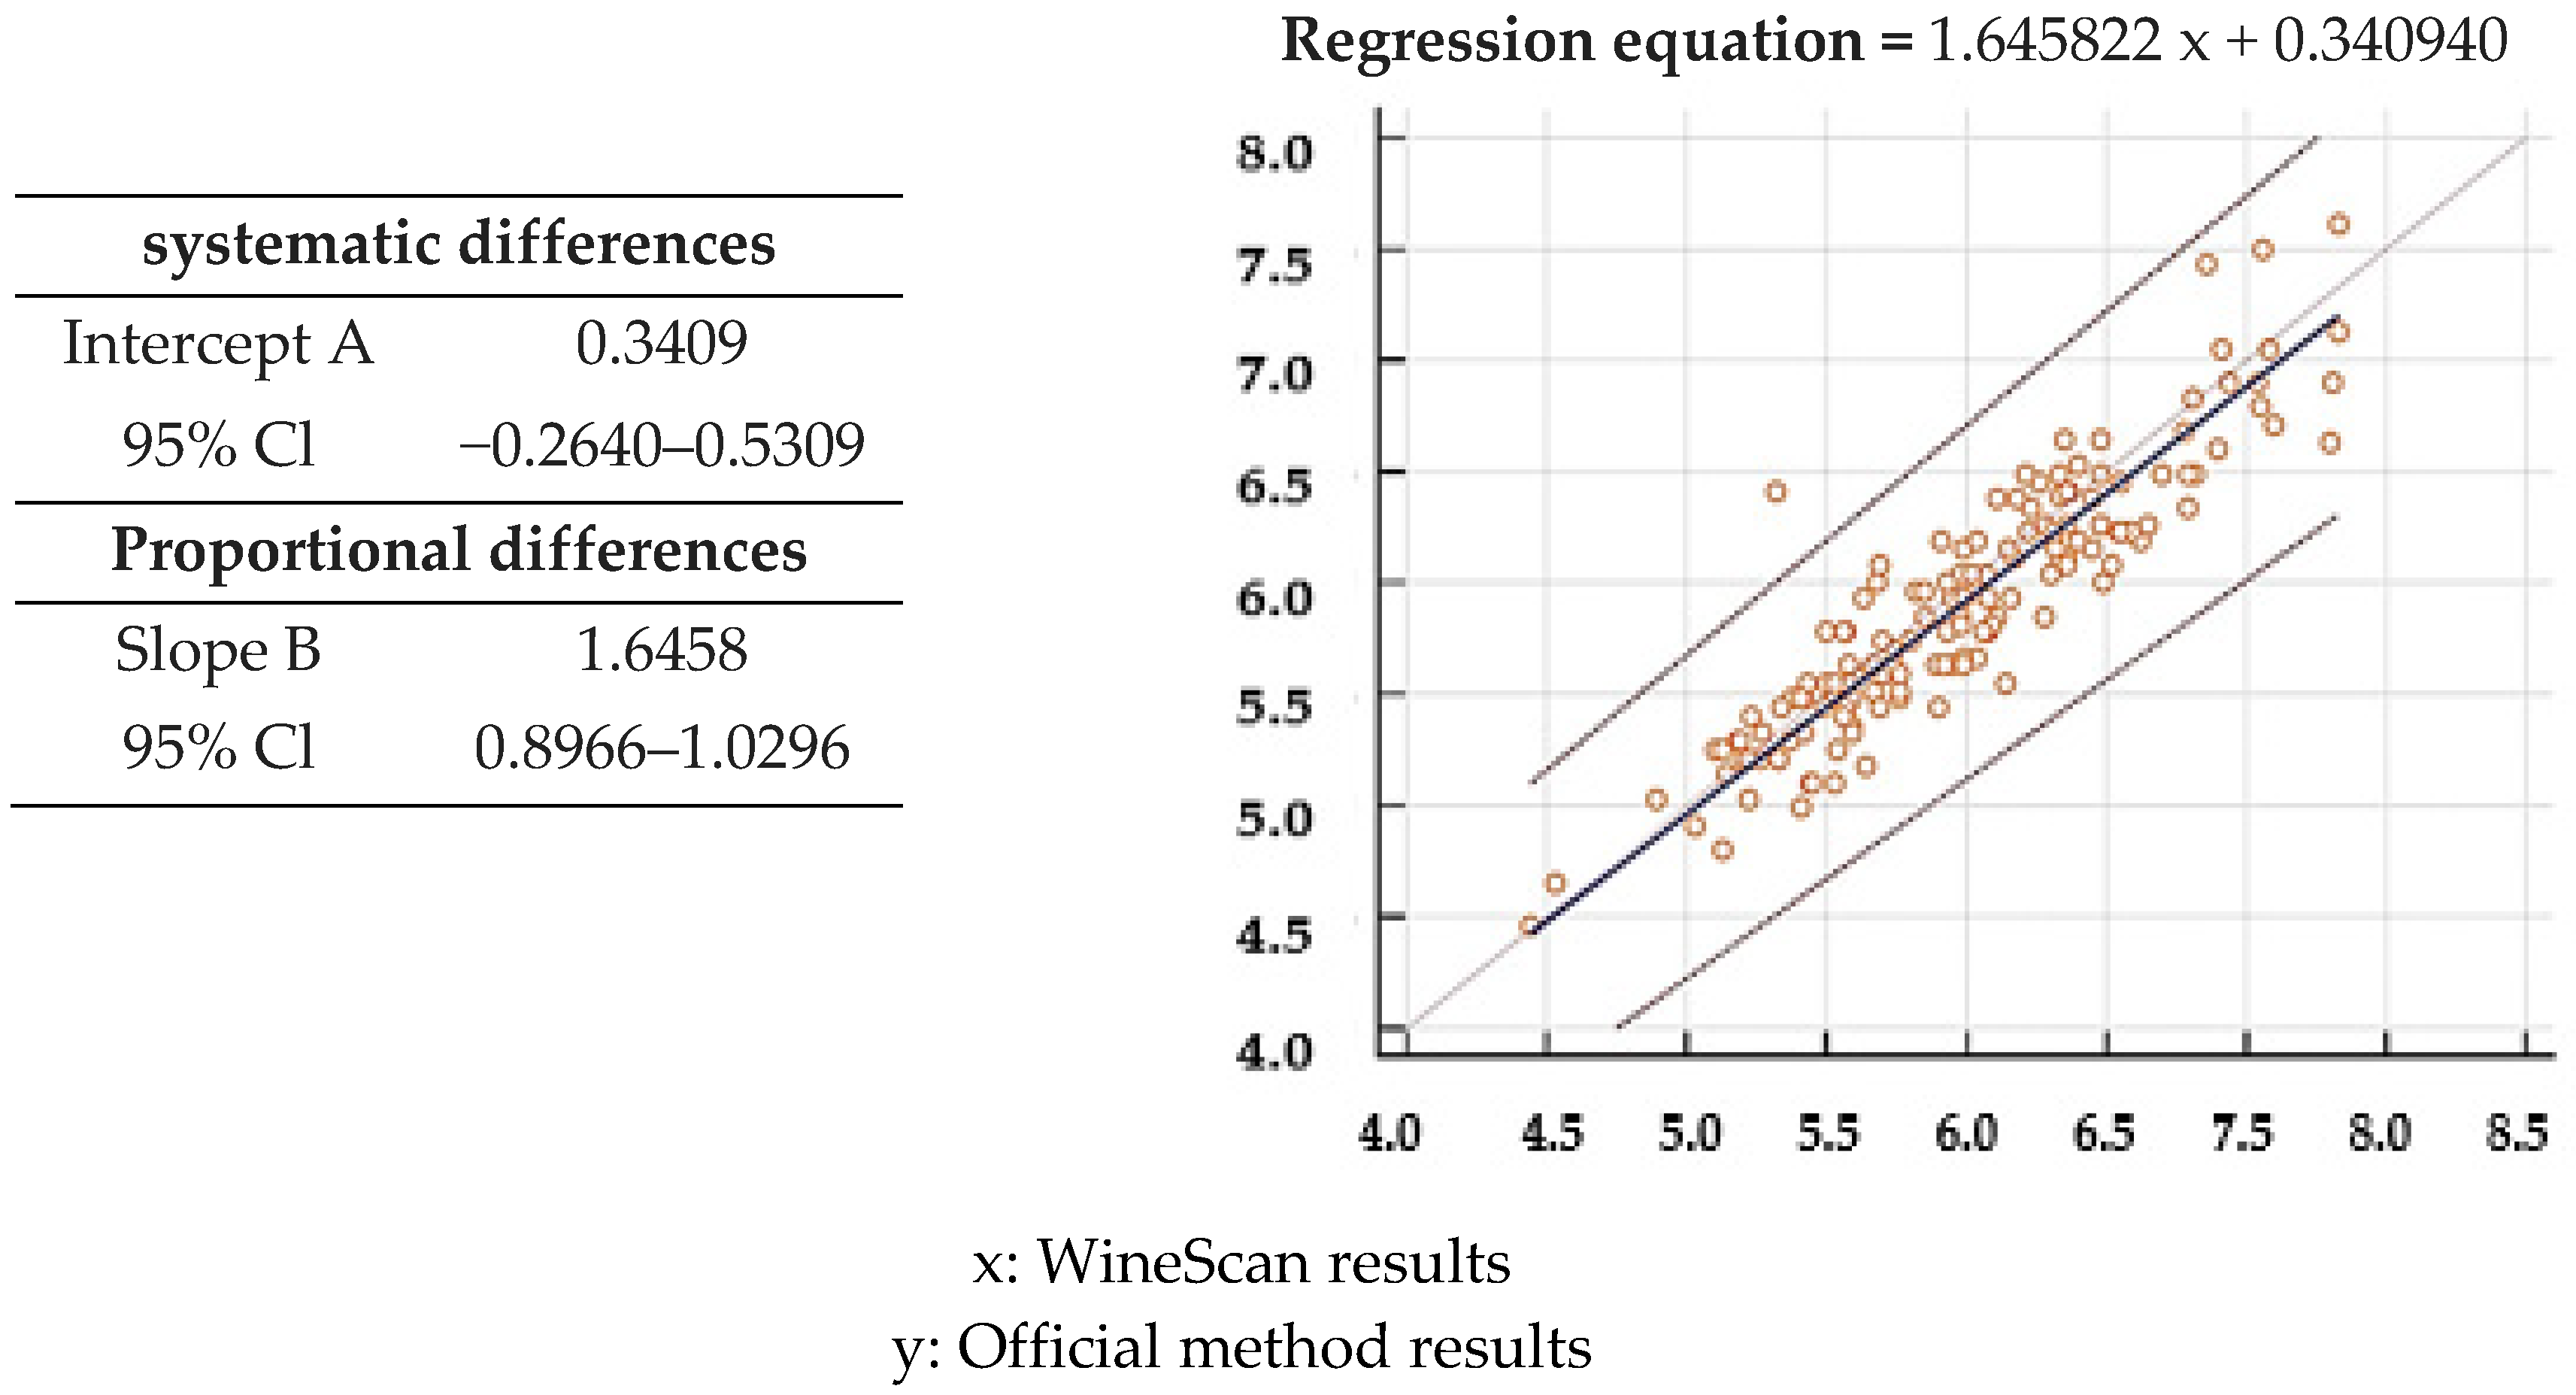
3.3. Validation of Total Acid Concentration Obtained by Winescan Technology

Organic and inorganic acids determine the total acidity in wine except for carbonic acids (H2CO3 or H2O + CO2). The acid amount in wine depends on the grape variety, climatic conditions during maturing, ripeness degree, soil, vineyard position, phytosanitary condition of grapes, grape processing, agrotechnical measures, alcohol fermentation, and wine storage [56]. In wine, there are more than 40 organic acids. Tartaric, malic, and citric acid are a component of grapes. Succinic, 2-dimethylglicerine acid, 2-ketoglutaric, hexane, octane, and decane acids are products of alcohol fermentation. Phenol-carbonic acids are present in trace amounts and influence wine sensory characteristics (taste, color) [57]. The official method used to determine total acids consists of wine titration (after removal of CO2) with a strong base. Other analytical methods proposed were chromatography [58], spectroscopy [59,60,61,62], and electrochemical methods [63,64]. Comparing the data obtained with WineScan and official methods, it appears that WineScan technology overestimated the total acid concentration of 1.8% (Figure 10).
Results of both data sets were non-normal distributed (Kolmogorov-Smirnov test) (Figure 11).
The Bland–Altman analysis showed that the results of WineScan and standard methods agreed within 95% of probability (Figure 12).
The Passing & Bablok regression analysis confirmed these data. (Figure 13).

4. Discussion

In food, chemistry is essential to provide consistent and accurate results with known uncertainty. Therefore, when methods are developed, it is necessary to determine the criteria to ensure their validity (ISO/IEC, 2005) [17]. Each method must be validated for each matrix and working range. Complete method validation involves linearity, accuracy, precision, repeatability, and robustness [65,66,67]. Alternatively, it is possible to compare the results of different analytical methodologies to proficiency testings, interlaboratory, and round-robin trials to obtain the working range concentration or employ reference materials obtained by reference methods (metrological approach) [19,68,69]. In this study, a metrological approach was applied to verify the reliability of the results. The significance level is set at 5%. The mean (or average), standard deviation, relative standard deviation, regression analysis, and confidence intervals were used to validate the analytical method. Statistical analyses verify if the experimental data were consistent with the null hypothesis (H0 0). H0 defines if two elements or a series of elements are equal. If H0 is true, the deviation between different characteristics and the probability p to have this deviation must also be determined. H0 is plausible when p is large. p is fixed according to the level of confidence or significance (usually p = 0.95 as a level of confidence; α = 0.05 as a significance level) [70]. When we reject the null hypothesis, although that hypothesis was true, two types of errors can occur: Type I error, or alpha (false positive), occurs when the research hypothesis (H1) is accepted and the null hypothesis (H0) is rejected, when in reality the ‘null’ is correct. It is due to random chance [71]. Type II errors, or beta (false negatives), occur when the research hypothesis is rejected, but it is correct. It occurs when there is insufficient sample size for detecting an effect of interest [72]. Wine spectra are incredibly complex. The FT-IR technique is an indirect analytical method [73] that gives the analytical results applying an algorithm based on partial least squares (PLS) regression. The interferences are pretty balanced to the wavelengths absorbances characteristic of the parameter to study. Infrared spectra of a group of wine samples have been made to compensate for the interferences and calibrate the parameters quantified by standard methods. The mean and standard deviation related to the distributions were calculated. Total acidity and sulfur dioxide give similar media and standard deviation results. Instead, alcoholic volume content differs slightly according to the method used. We have calculated the maximum distance between the WineScan distribution function and the official method distribution function by the Kolmogorov–Smirnov test (K–S test). Data follows a normal distribution if p < 0.05. The results of the Kolmogorov–Smirnov test revealed that some data were not normally distributed. Therefore, two non-parametric tests (Bland & Altman test and Passing & Bablok test) were used to evaluate a significant difference between the factor levels. Non-parametric statistical analysis focuses on the order of the data size. They convert the original data in size and use + or − signs or data size rank. Bland & Altman plot describes the agreement between two quantitative measurements using a graphical approach. Limits of the agreement are obtained by calculating the mean and standard deviation of the differences between the two analysis methods. The resulting graph is a scatter plot XY in which the Y-axis shows the difference between the two paired measurements (A-B), and the X-axis represents the average of these measures ((A + B)/2). In other words, the difference between the two paired measurements is plotted against the mean of the two measurements. B&A recommended that 95% of the data points should lie within ± 2 s of the mean difference. It is also possible to plot the differences as percentages or ratios. The bias is computed as the value determined by one method minus the value determined by the other method. If the average of the differences is not close to zero, the two assay methods are systematically producing different results [74]. The Bland–Altman analysis suggests that the WineScan and standard methods used for quantitative measurements of samples agree within 95% of probability. These findings (Figure 3 and Figure 4) indicate that the values fall within the desired confidence interval, and the points are distributed randomly around the average. Therefore, the two methods are compared with the 95% probability. The statistical analysis continued with the Passing & Bablok regression analysis. It is a statistical procedure, non-sensitive to data outliers and distribution of errors, that allows valuation of analytical methods agreement and systematic bias between them. The Scatter diagram, regression equation, and regression line displayed the results. The line slope of the results indicates proportional errors, while the line intercept indicates constant errors. It is necessary to calculate the 95% confidence intervals to check these errors. Constant errors are absent when the intercept confidence interval includes the value 0. Proportional errors are absent when the slope confidence interval includes the value 1 [75]. Our results showed that most values are distributed around the regression line. Therefore, the data obtained with the two types of analysis are comparable in dosage. The slope and intercept values show the lack of constant errors (the value 0 is in the intercept confidence interval) and the possibility of proportional errors (the value 1 is not in the slope confidence interval) due to interfering contaminants in the sample.

5. Conclusions

The WineScan method is rapid and has high automation (data processing and an autosampler). It is well verified in daily routine analyses, is environment friendly, and has low maintenance costs. The validation procedure made on Italian wines showed that WineScan determination of alcohol, SO2, and total acid concentrations are comparable to that obtained by the respective official methods. Statistical methods showed that WineScan do not make indeterminate errors (instrumental and method errors), but it could make proportional errors due to interfering contaminants in the sample. These errors are corrected by blank determination. Therefore, the regulators can indicate the non-invasive technology WineScan for routine analysis.

Supplementary Materials

The following are available online at https://www.mdpi.com/article/10.3390/separations8100191/s1, Figure S1: Ischia DOC Piedirosso or Per’e Palummo wine total spectrum, Figure S2: Most significant spectral frequencies for the identification of sulfur dioxide in Ischia DOC Piedirosso (or Per’e Pa-lummo) wine (1203.7 cm−1, 1184.41 cm−1, 3391.18 cm−1, 1199.84 cm−1, 3360.32 cm−1,1064.81 cm−1), Figure S3: Most significant spectral frequencies for the determination of alcohol in Ischia DOC Piedirosso (or Per’e Palummo) wine (1103.39 cm−1, 2982.23 cm−1, 2970.66 cm−1, 1126.54 cm−1), Figure S4: Most significant spectral frequencies for the determination of total acidity in Is-chia DOC Piedirosso (or Per’e Palummo) wine (3001.52 cm−1, 2997.67 cm−1, 3005.38 cm−1, 1219.13 cm−1, 1068.67 cm−1,1064.81 cm−1).

Author Contributions

I.D., data curation and writing—review and editing; R.D.L., investigation; A.S., investigation; D.C., investigation; S.L., investigation. All authors have read and agreed to the published version of the manuscript.

Funding

This research received no external funding.

Institutional Review Board Statement

Not applicable.

Informed Consent Statement

Not applicable.

Data Availability Statement

Data is contained within the article or Supplementary Material.

Conflicts of Interest

The authors declare no conflict of interest.

References

  1. Wines of Campania. Ischia Doc. Available online: http://www.agricoltura.regione.campania.it/viticoltura/ischia.html (accessed on 20 November 2017).
  2. de Villiers, A.; Alberts, P.; Tredoux, A.G.; Nieuwoudt, H.H. Analytical techniques for wine analysis: An African perspective; a review. Anal. Chim. Acta 2012, 730, 2–23. [Google Scholar] [CrossRef] [PubMed]
  3. Robles, A.; Fabjanowicz, M.; Chmiel, T.; Płotka-Wasylka, J. Determination and identification of organic acids in wine samples. Problems and challenges. TrAC-Trends Anal. Chem. 2019, 120, 115630–115644. [Google Scholar] [CrossRef]
  4. Sáenz-Navajas, M.P.; Henschen, C.; Cantu, A.; Watrelot, A.A.; Waterhouse, A.L. Understanding microoxygenation: Effect of viable yeasts and sulfur dioxide levels on the sensory properties of a Merlot red wine. Food Res. Int. 2018, 108, 505–515. [Google Scholar] [CrossRef] [PubMed]
  5. Fazio, T.; Warner, C.R. A review of sulfites in foods—Analytical methodology and reported findings. Food Addit. Contam. 1990, 7, 433–454. [Google Scholar] [CrossRef] [PubMed]
  6. Nisiotou, A. New Frontiers in Wine Microbiology. Foods 2021, 10, 1077. [Google Scholar] [CrossRef] [PubMed]
  7. Raposo, R.; Ruiz-Moreno, M.J.; Garde-Cerdán, T.; Puertas, B.; Moreno-Rojas, J.M.; Gonzalo Diago, A.; Guerrero, R.F.; Ortiz, V.; Cantos-Villar, E. Effect of hydroxytyrosol on quality of sulfur dioxide-free red wine. Food Chem. 2016, 192, 25–33. [Google Scholar] [CrossRef]
  8. Costa, M.A.S.; Cerri, B.C.; Ceccato-Antonini, S.R. Ethanol enhances acid treatment to eliminate Lactobacillus fermentum from the fermentation process for fuel ethanol production. Lett. Appl. Microbiol. 2018, 66, 77–85. [Google Scholar] [CrossRef] [PubMed]
  9. Aragón-García, F.; Ruíz-Rodríguez, A.; Palma, M. Changes in the Aromatic Compounds Content in the Muscat Wines as a Result of the Application of Ultrasound during Pre-Fermentative Maceration. Foods 2021, 10, 1462. [Google Scholar] [CrossRef]
  10. King, E.S.; Dunn, R.L.; Heymann, H. The influence of alcohol on the sensory perception of red wines. Food Qual. Prefer. 2013, 28, 235–243. [Google Scholar] [CrossRef]
  11. Community Methods for Wine Analysis Commission Regulation (EEC) No 2676/90 of 17 September 1990. Available online: https://op.europa.eu/en/publication-detail/-/publication/6528497d-1ece-4355-ab08-c73b3242f7ee (accessed on 17 September 1990).
  12. Moros, J.; Garrigues, S.; de la Guardia, M. Vibrational spectroscopy provides a green tool for multi–component analysis. Trends Anal. Chem. 2010, 29, 578–591. [Google Scholar] [CrossRef]
  13. Zeng, J.; Guo, Y.; Han, Y.; Li, Z.; Yang, Z.; Chai, Q.; Wang, W.; Zhang, Y.; Fu, C. A Review of the Discriminant Analysis Methods for Food Quality Based on Near-Infrared Spectroscopy and Pattern Recognition. Molecules 2021, 26, 749. [Google Scholar] [CrossRef] [PubMed]
  14. López-Lorente, Á.I.; Mizaikoff, B. Mid-infrared spectroscopy for protein analysis: Potential and challenges. Anal. Bioanal. Chem. 2016, 408, 2875–2889. [Google Scholar] [CrossRef]
  15. Pasquini, C. Near infrared spectroscopy: A mature analytical technique with new perspectives—A review. Anal. Chim. Acta 2018, 1026, 8–36. [Google Scholar] [CrossRef] [PubMed]
  16. Huber, L. Validation and Qualification in Analytical Laboratories; CRC Press: New York, NY, USA, 2007; pp. 1–288. [Google Scholar]
  17. General Requirements for the Competence of Testing and Calibration Laboratories. Available online: https://www.iso.org/obp/ui/#iso:std:iso-iec:17025:ed-2:v1:en (accessed on 15 September 2020).
  18. Dini, I.; Seccia, S.; Senatore, A.; Coppola, D.; Morelli, E. Development and Validation of an Analytical Method for Total Polyphenols Quantification in Extra Virgin Olive Oils. Food Anal. Meth. 2019, 13, 457–464. [Google Scholar] [CrossRef]
  19. Dini, I.; Di Lorenzo, R.; Senatore, A.; Coppola, D.; Laneri, S. Validation of Rapid Enzymatic Quantification of Acetic Acid in Vinegar on Automated Spectrophotometric System. Foods 2020, 9, 761. [Google Scholar] [CrossRef] [PubMed]
  20. Dini, I.; Laneri, S. The New Challenge of Green Cosmetics: Natural Food Ingredients for Cosmetic Formulations. Molecules 2021, 26, 3921. [Google Scholar] [CrossRef] [PubMed]
  21. Summary of Evaluations Performed by the Joint FAO/WHO Expert Committee on Food Additives: Sulfur Dioxide. Available online: http://www.inchem.org/documents/jecfa/jeceval/jec_2215.htm (accessed on 12 November 2017).
  22. Vahl, J.M.; Converse, J.E. Ripper procedure for determining sulfur dioxide in wine: Collaborative study. J. Assoc. Off. Anal. Chem. 1980, 63, 194–199. [Google Scholar] [CrossRef] [PubMed]
  23. Yu, H.; Hu, J.; Jiang, X.; Hou, X.; Tian, Y. Point discharge microplasma reactor for high efficiency conversion of H2S to SO2 for speciation analysis of sulfide and sulfite using molecular fluorescence spectrometry. Anal. Chim. Acta 2018, 1042, 79–85. [Google Scholar] [CrossRef] [PubMed]
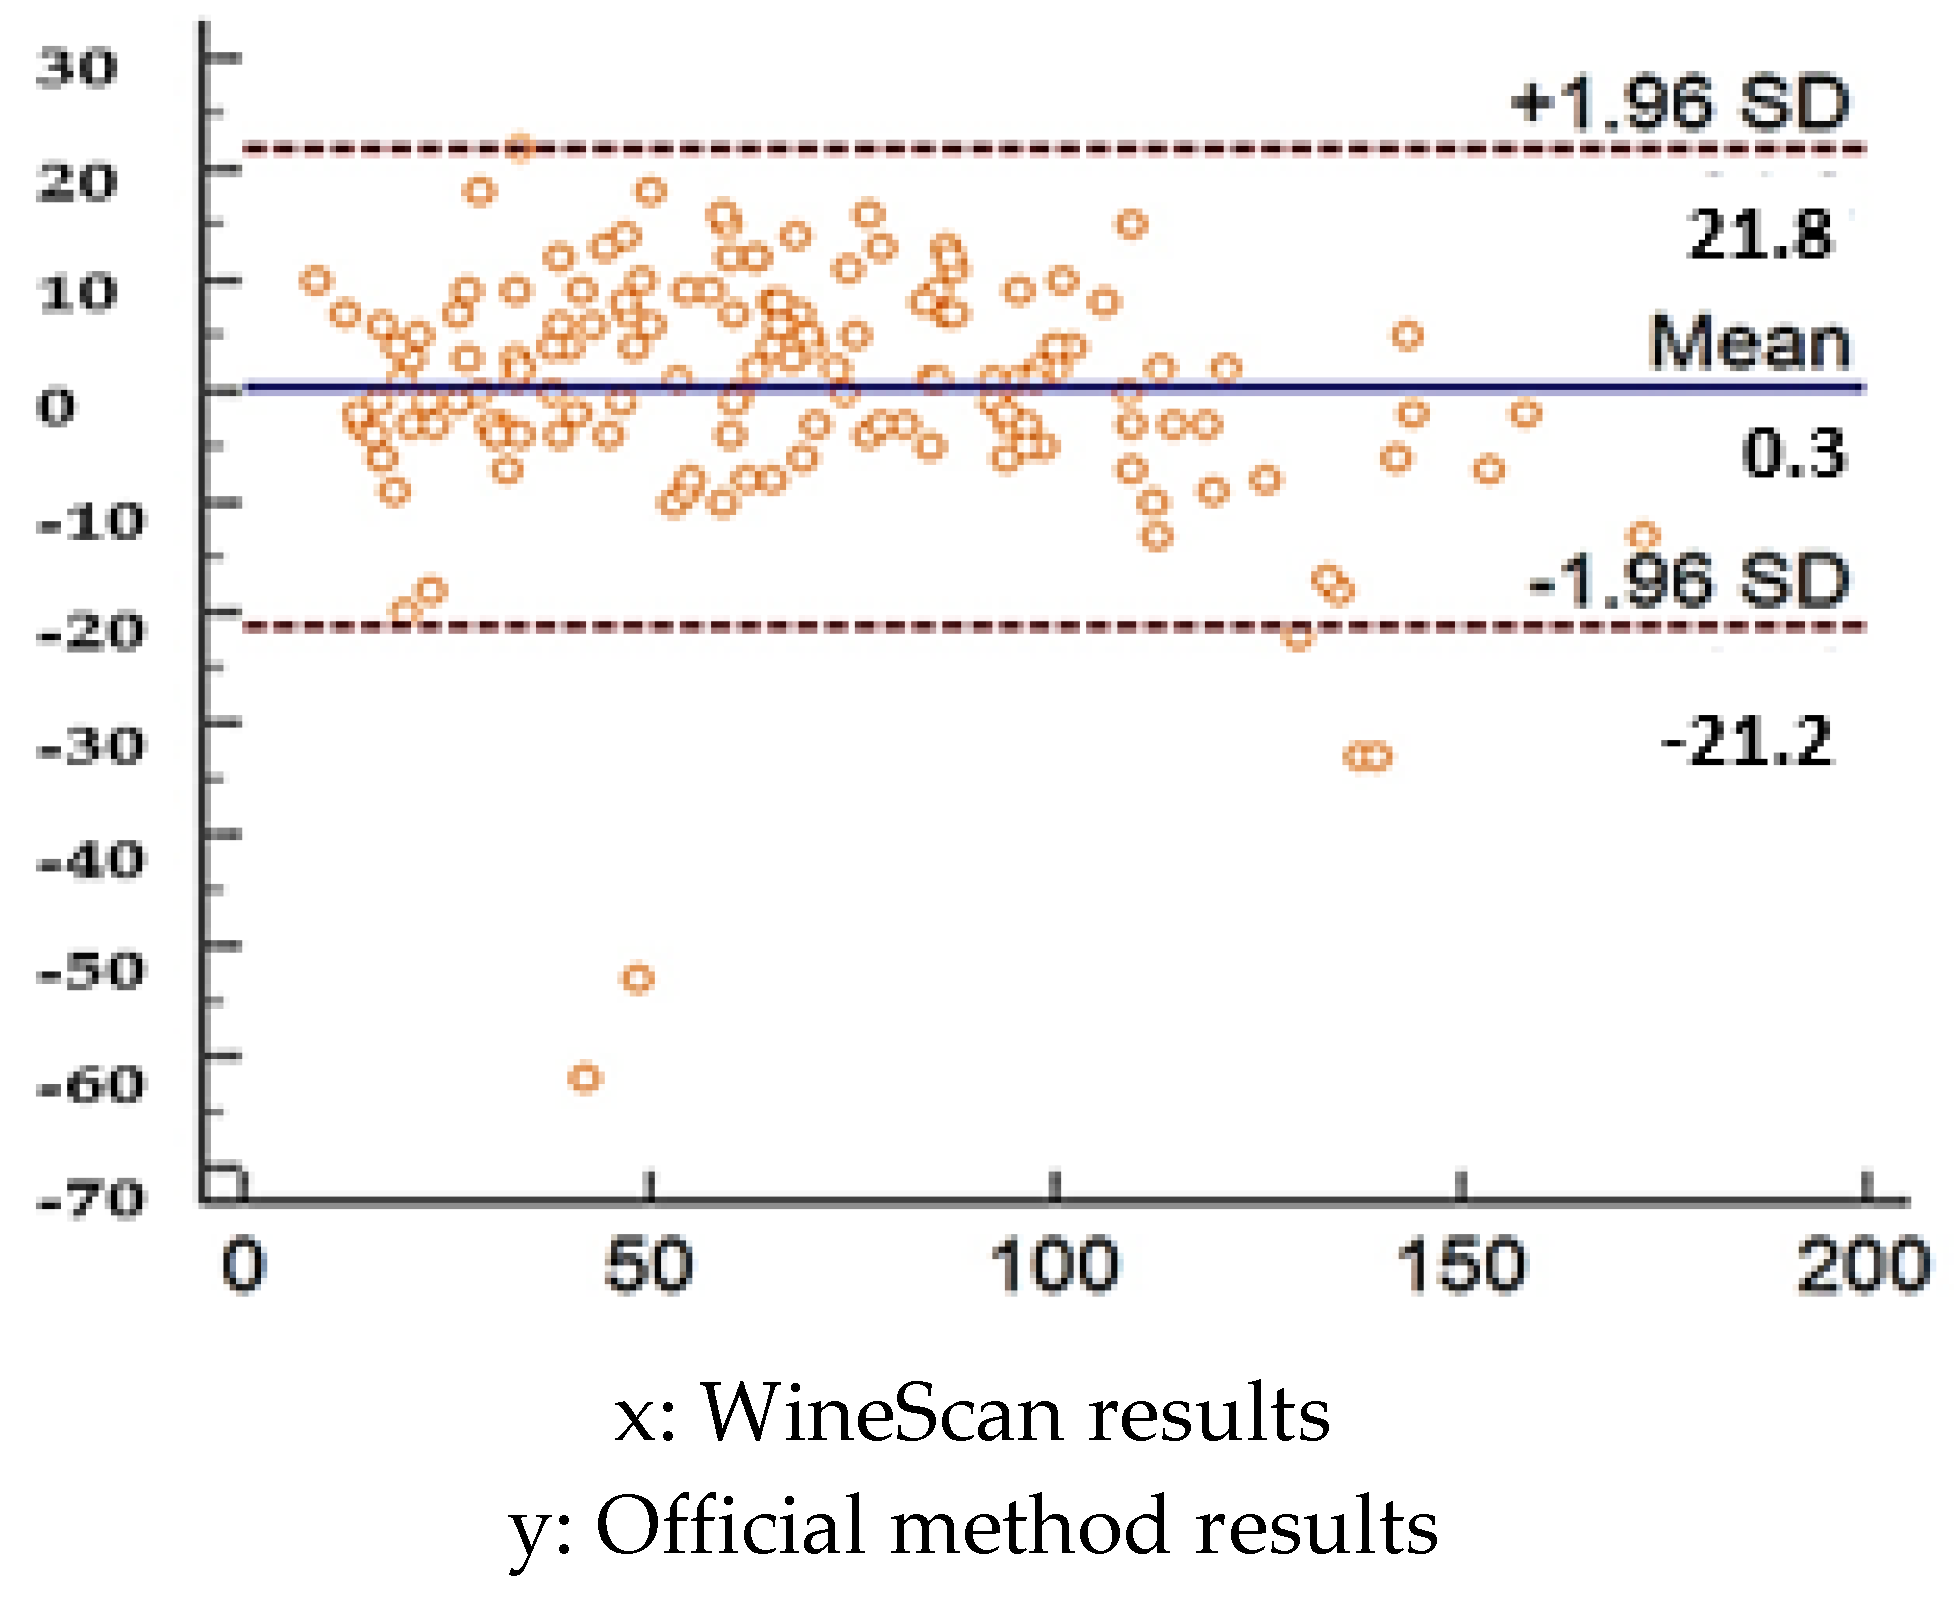
  24. Altman, D.G.; Bland, J.M. Measurement in medicine: The analysis of method comparison studies. Statistician 1983, 32, 307–317. [Google Scholar] [CrossRef]
  25. Aberl, A.; Coelhan, M. Determination of sulfur dioxide in wine using headspace gas chromatography and electron capture detection. Food Addit. Contam. Part A 2013, 30, 226–233. [Google Scholar] [CrossRef]
  26. García-Guzmán, J.J.; Hernández-Artiga, M.P.; Palacios-Ponce de León, L.; Bellido-Milla, D. Selective methods for polyphenols and sulphur dioxide determination in wines. Food Chem. 2015, 182, 47–54. [Google Scholar] [CrossRef]
  27. Migneault, D.R. Enhanced Detection of Sulfite by Inductively Coupled Plasma Atomic Emission Spectroscopy with High-Performance Liquid Chromatography. Anal. Chem. 1989, 61, 272–275. [Google Scholar] [CrossRef]
  28. Nakahara, T.; Mori, T.; Morimoto, S.; Ishikawa, H. Continuous-flow determination of aqueous sulfur by atmospheric-pressure helium microwave-induced plasma atomic emission spectrometry with gas-phase sample introduction. Spectrochim. Acta Part B 1995, 50, 393–403. [Google Scholar] [CrossRef]
  29. Robbins, K.S.; Shah, K.S.; MacMahon, R.S.; de Jager, L.S.J. Development of a Liquid Chromatography–Tandem Mass Spectrometry Method for the Determination of Sulfite in Food. J. Agric. Food Chem. 2015, 63, 5126–5132. [Google Scholar] [CrossRef] [Green Version]
  30. Carrascon, V.; Ontañón, I.; Bueno, M.; Ferreira, V. Gas chromatography-mass spectrometry strategies for the accurate and sensitive speciation of sulfur dioxide in wine. J. Chromatogr. A 2017, 1504, 27–34. [Google Scholar] [CrossRef]
  31. Silva, E.M.; Takeuchi, R.M.; Santos, A.L. Carbon nanotubes for voltammetric determination of sulphite in some beverages. Food Chem. 2015, 17, 763–769. [Google Scholar] [CrossRef]
  32. Endecott, B.R.; Sanders, D.C.; Chaturvedi, A.K. Simultaneous gas chromatographic determination of four toxic gases generally present in combustion atmospheres. J. Anal. Toxicol. 1996, 20, 189–194. [Google Scholar] [CrossRef] [Green Version]
  33. Wang, H.; Li, C.S.; Zhou, L.; Shi, S.; Wang, Y.; Sun, J. Effective and inexpensive gas chromatography method for detection of trace level SO2 in H2 fuel. J. Shanghai Univ. Eng. Ed. 2010, 14, 322–325. [Google Scholar] [CrossRef]
  34. Xiong, Y.; Wang, Q.; Li, X.; Fang, S.; Duan, M. Total sulfur dioxide determination in red wine by suppressed ion chromatography with in-sample oxidation and SPE. Chromatographia 2018, 81, 1003–1011. [Google Scholar] [CrossRef]
  35. Araujo, C.S.T.; de Carvalho, J.L.; Mota, D.R.; Coelho, N.M.M. Determination of sulphite and acetic acid in foods by gas permeation flow injection analysis. Food Chem. 2005, 92, 765–770. [Google Scholar] [CrossRef]
  36. Leinweber, F.J.; Monty, K.J. Sulfite determination: Fuchsin method. Methods Enzymol. 1987, 143, 15–17. [Google Scholar] [PubMed]
  37. Brychkova, G.; Yarmolinsky, D.; Fluhr, R.; Sagi, M. The determination of sulfite levels and its oxidation in plant leaves. Plant Sci. 2012, 190, 123–130. [Google Scholar] [CrossRef] [PubMed]
  38. Shekho, N.H.; Al-Hadi, B.A.A. Spectrophotometric determination of sulphite in various water samples via chromium-1,5-diphenylcarbazide complex. Baghdad Sci. J. 2018, 15, 181–188. [Google Scholar]
  39. Lv, H.M.; Wang, Z.Y.; Gao, N. A fluorescence method of detecting sulfur dioxide derivatives. In Proceedings of the 4th International Conference on Water Resource and Environment (WRE 2018), Kaohsiung City, Taiwan, 17–21 July 2018; IOP Conference Series: Earth and Environmental Science; Li, P., Ed.; IOP publishing: Bristol, UK, 2018; Volume 191, p. UNSP 012107. [Google Scholar] [CrossRef]
  40. Chen, H.; Wu, X.; Wang, J.; Wang, H.; Tao, F.; Yang, S.; Tian, H.; Liu, Y.; Sun, B. A fluorescent probe for colorimetric detection of bisulfite and application in sugar and red wine. Food Sci. Biotechnol. 2019, 28, 983–990. [Google Scholar] [CrossRef]
  41. Li, J.; Gao, Y.; Guo, H.; Li, X.; Tang, H.; Li, J.; Guo, Y. A novel colorimetric and ratiometric fluorescent probe for selective detection of bisulfite in real samples and living cells. Dyes Pigment. 2019, 163, 285–290. [Google Scholar] [CrossRef]
  42. Li, X.; Zeng, R.; Xi, C.; Tang, D.; Li, Q.; Zhang, B.; Huang, T. Silica nanoparticles doped with a benzo[e]indolium-tethered iridium(III) complex for reversible detection of HSO3−and Hg2+/Cu2+ in water. Dyes Pigment. 2019, 165, 128–136. [Google Scholar] [CrossRef]
  43. Hlavay, J.; Guilbault, G.G. Determination of sulfite by use of a fiber-optic biosensor based on a chemiluminescent reaction. Anal. Chim. Acta 1994, 299, 91–96. [Google Scholar] [CrossRef]
  44. Culbert, J.; Cozzolino, D.; Ristic, R.; Wilkinson, K. Classification of Sparkling Wine Style and Quality by MIR Spectroscopy. Molecules 2015, 20, 8341–8356. [Google Scholar] [CrossRef]
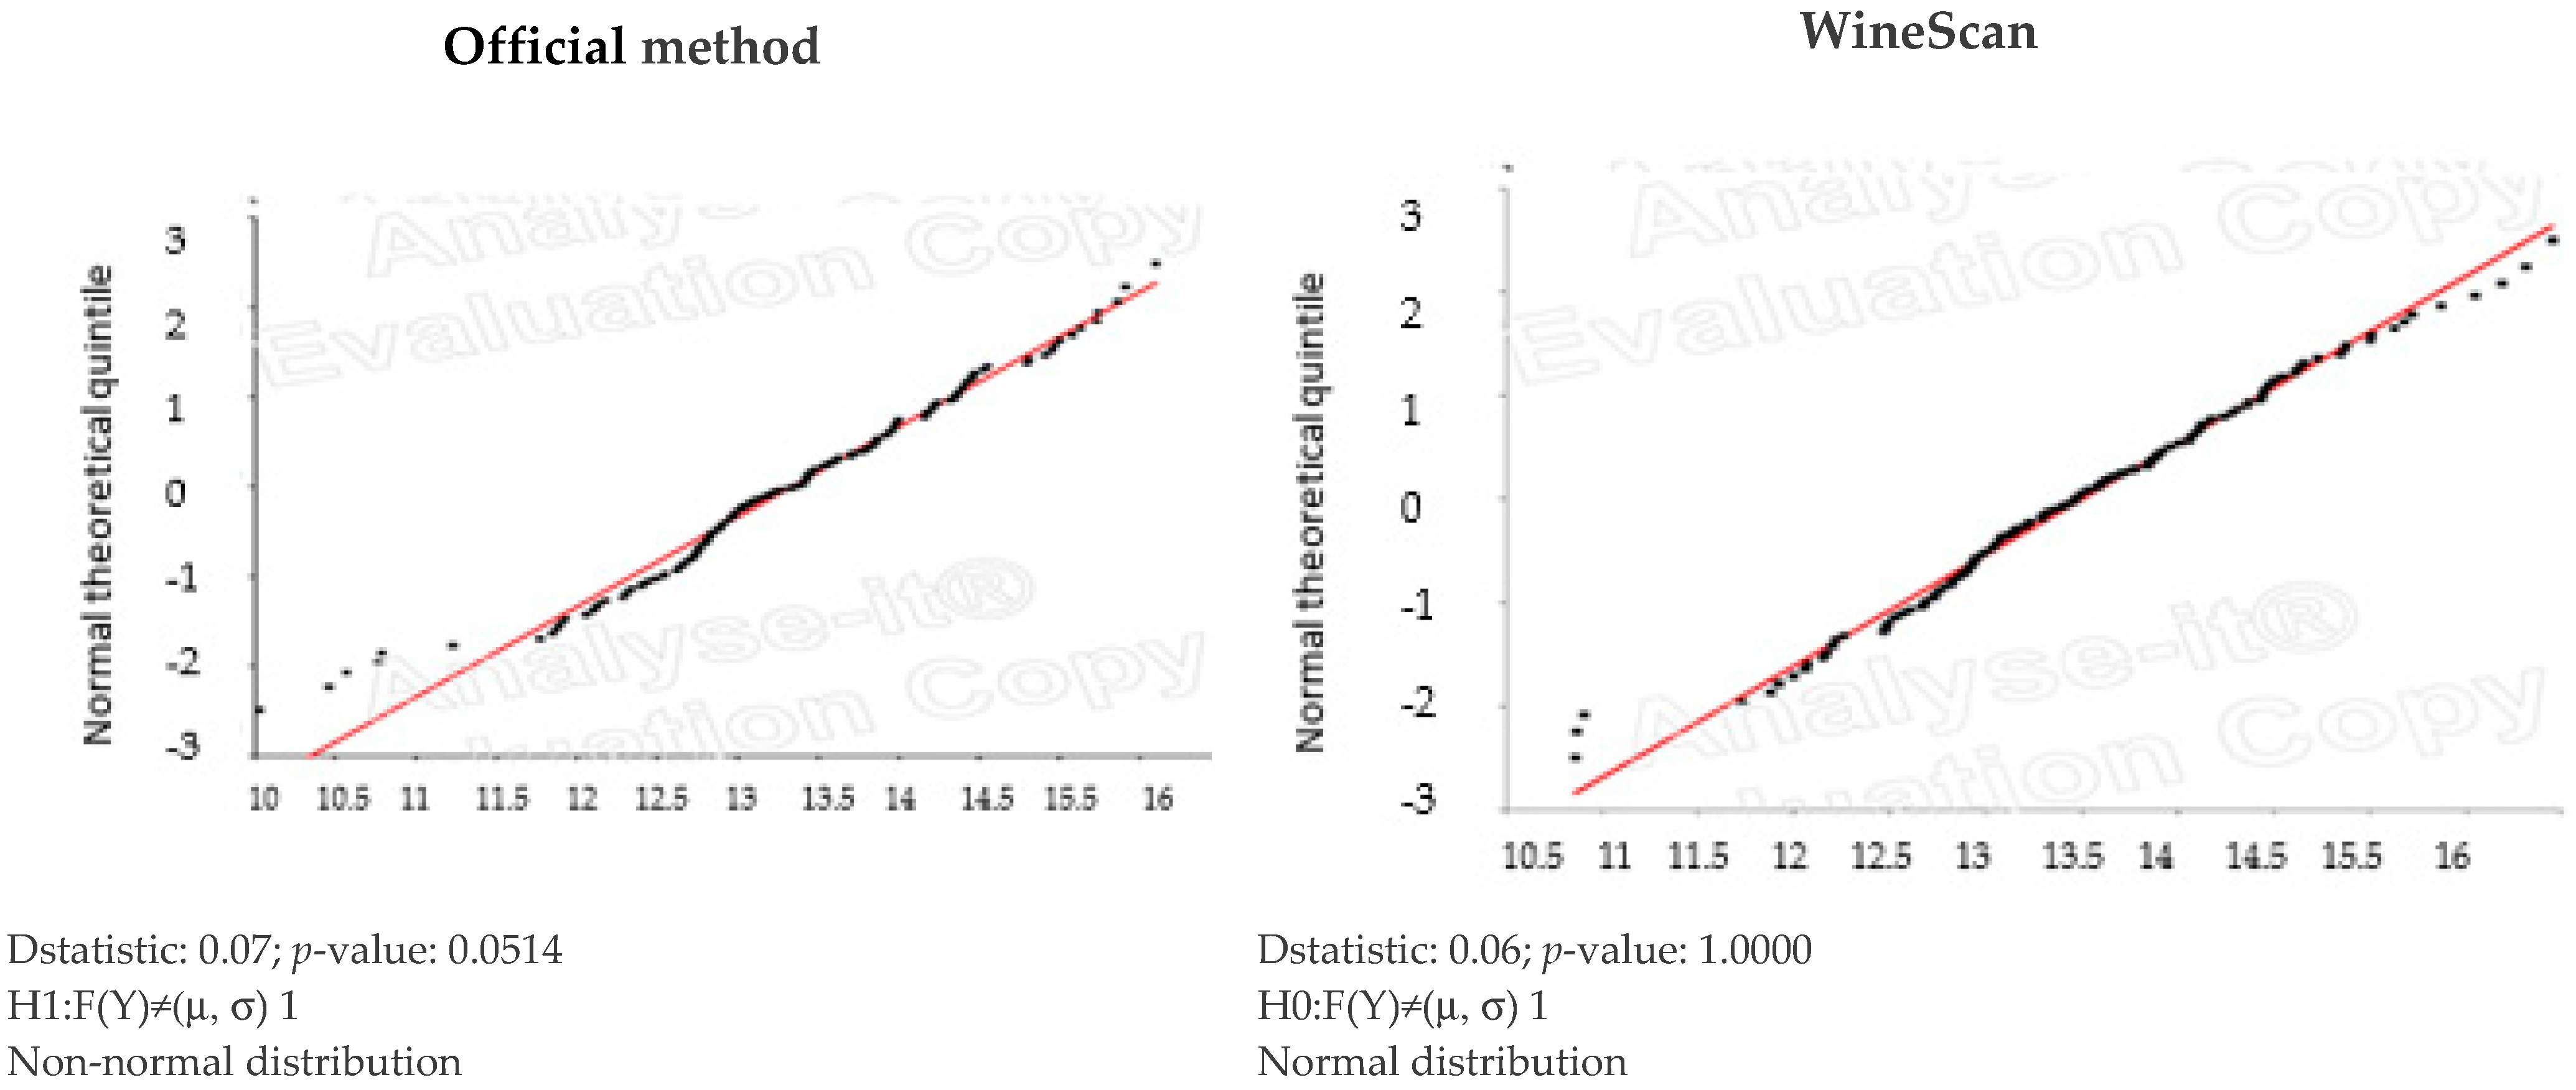
  45. Lilliefors, H.W. On the Kolmogorov-Smirnov Test for normality with mean and variance unknown. J. Am Stat Assoc. 1967, 62, 399–402. [Google Scholar] [CrossRef]
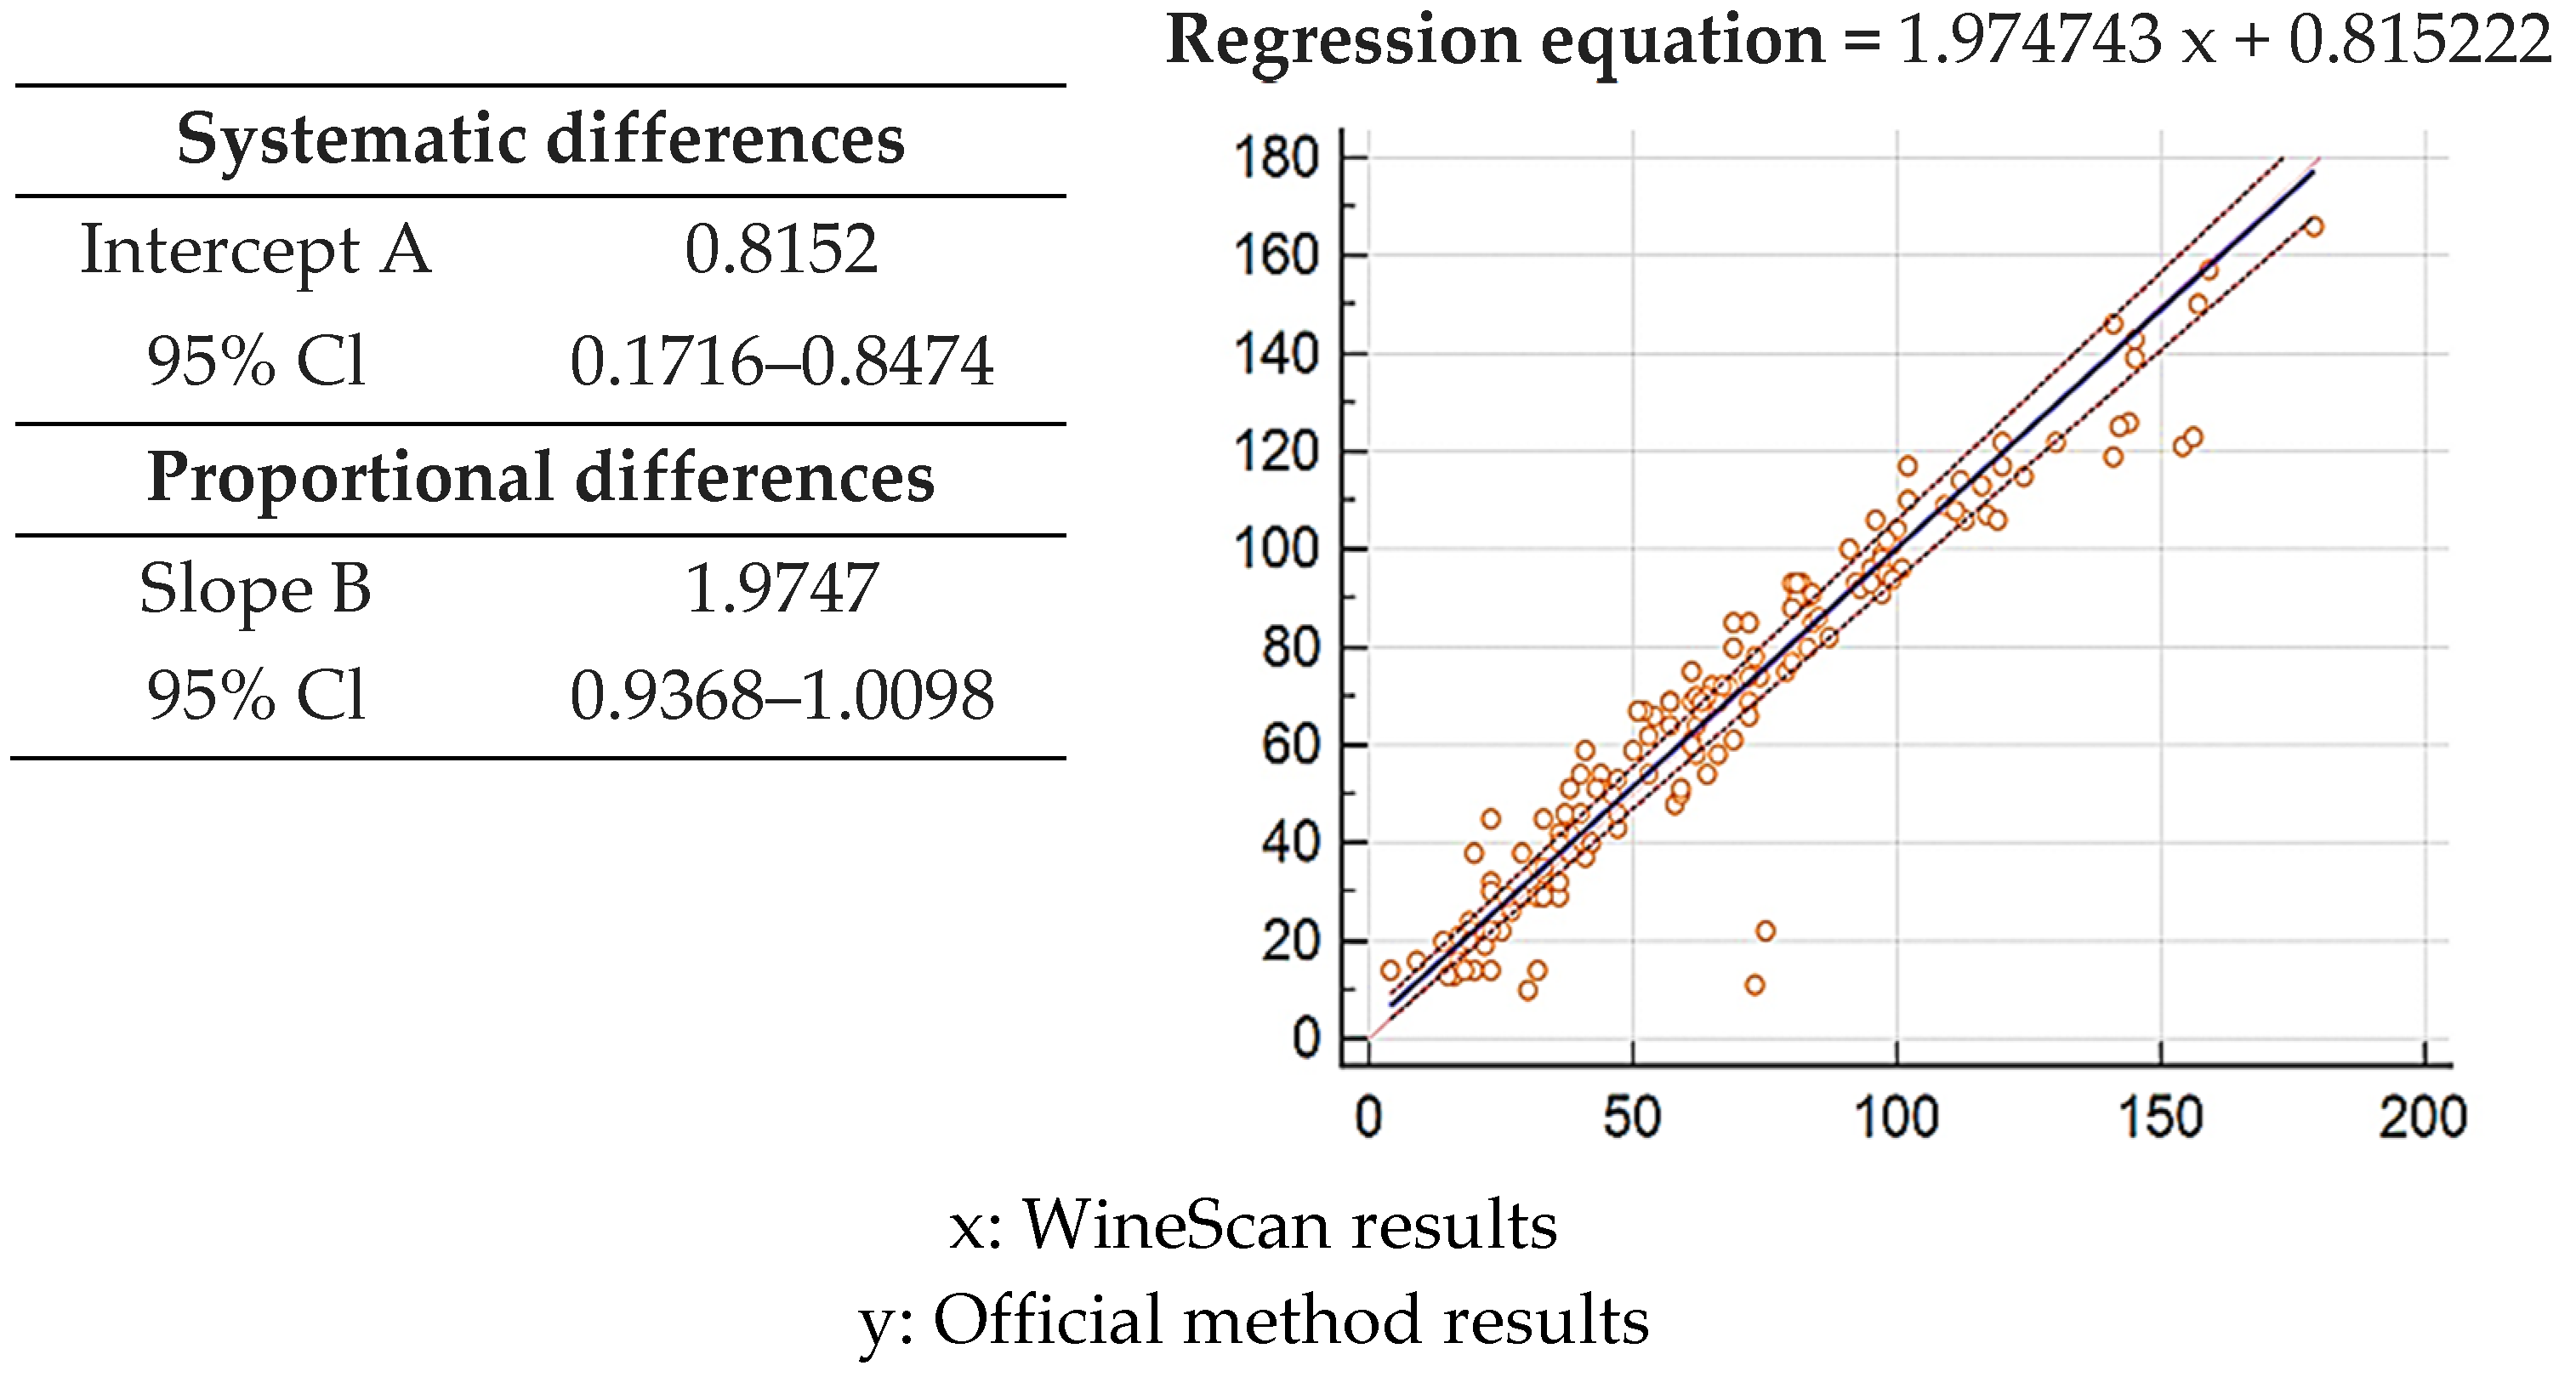
  46. Passing, H.; Bablok, W. A new biometrical procedure for testing the equality of measurements from two different analytical methods. Application of linear regression procedures for method comparison studies. J. Clin. Chem. Clin. Biochem. 1983, 21, 709–720. [Google Scholar] [CrossRef]
  47. Brereton, P.; Hasnip, S.; Bertrand, A.; Wittkowski, R.; Guillou, C. Analytical methods for the determination of spirit drinks. Trends Anal Chem. 2003, 22, 19–25. [Google Scholar] [CrossRef]
  48. Strunk, D.H.; Hamman, J.W.; Timmel, B.M. Determination of proof of distilled alcoholic beverages, using an oscillating U-tube density meter. J. AOAC 1979, 62, 653–658. [Google Scholar] [CrossRef]
  49. Mark, F.G.; Vaughn, T.E. Determination of proof of alcoholic beverages using oscillating U-tube density meter. J. AOAC 1980, 63, 970–972. [Google Scholar] [CrossRef]
  50. Kovár, J. Oscillating U-tube density meter determination of alcoholic strength: Analysis of paramter errors. J. AOAC 1981, 64, 1424–1430. [Google Scholar] [CrossRef]
  51. Rebelein, H. Schnellmethode zur Bestimmung des Alkoholgehaltes in Likören und Branntweinen. Alkohol-Industrie 1995, 16, 376–378. [Google Scholar]
  52. Beutler, H.-O.; Michal, G. Neue Methode zur enzymatischen Bestimmung von Äthanol in Lebensmitteln. Z. Anal. Chem. 1977, 284, 113–117. [Google Scholar] [CrossRef]
  53. Tomassetti, M.; Angeloni, R.; Marchiandi, S.; Castrucci, M.; Sammartino, M.P.; Campanella, L. Direct Methanol (or Ethanol) Fuel Cell as Enzymatic or Non-Enzymatic Device, Used to Check Ethanol in Several Pharmaceutical and Forensic Samples. Sensors 2018, 18, 3596. [Google Scholar] [CrossRef] [Green Version]
  54. Zhang, C.Y.; Lin, N.B.; Chai, X.S.; Zhong, L.; Barnes, D.G. A rapid method for simultaneously determining ethanol and methanol content in wines by full evaporation headspace gas chromatography. Food Chem. 2015, 183, 169–172. [Google Scholar] [CrossRef]
  55. Yaritaa, T.; Nakajima, R.; Otsuka, S.; Ihara, T.; Takatsu, A.; Shibukawa, M. Determination of ethanol in alcoholic beverages by high-performance liquid chromatography-flame ionization detection using pure water as mobile phase. J. Chromatogr. A 2002, 976, 387–391. [Google Scholar] [CrossRef]
  56. Abreu, T.; Perestrelo, R.; Bordiga, M.; Locatelli, M.; Daniel Coïsson, J.; Câmara, J.S. The Flavor Chemistry of Fortified Wines—A Comprehensive Approach. Foods 2021, 10, 1239. [Google Scholar] [CrossRef] [PubMed]
  57. Gutiérrez-Escobar, R.; Aliaño-González, M.J.; Cantos-Villar, E. Wine Polyphenol Content and Its Influence on Wine Quality and Properties: A Review. Molecules 2021, 26, 718. [Google Scholar] [CrossRef]
  58. Zaky, A.S.; Pensupa, N.; Andrade-Eiroa, Á.; Tucker, G.A.; Du, C.Y. A new HPLC method for simultaneously measuring chloride, sugars, organic acids and alcohols in food samples. J. Food Compos. Anal. 2017, 56, 25–33. [Google Scholar] [CrossRef]
  59. Peres, R.G.; Moraes, E.P.; Micke, G.; Tonin, F.; Tavares, M.F.M.; Rodriguez-Amaya, D.B. Rapid method for the determination of organic acids in wine by capillary electrophoresis with indirect UV detection. Food Control 2009, 20, 548–552. [Google Scholar] [CrossRef]
  60. Pereira, A.C.; Reis, M.S.; Saraiva, P.M.; Marques, J.C. Madeira wine ageing prediction based on different analytical techniques: UV-vis, GC-MS, HPLC-DAD. Chemom. Intell. Lab. Syst. 2011, 105, 43–55. [Google Scholar] [CrossRef]
  61. Kim, D.Y.; Cho, B.K. Rapid monitoring of the fermentation process for Korean traditional rice wine ‘Makgeolli’ using FT-NIR spectroscopy. Infrared Phys. Technol. 2015, 73, 95–102. [Google Scholar] [CrossRef]
  62. Egidio, V.D.; Sinelli, N.; Giovanelli, G.; Moles, A.; Casiraghi, E. NIR and MIR spectroscopy as rapid methods to monitor red wine fermentation. Eur. Food Res. Technol. 2010, 230, 947–955. [Google Scholar] [CrossRef]
  63. Lourenço, A.S.; Nascimento, R.F.; Silva, A.C.; Ribeiro, W.F.; Araujo, M.C.U.; Oliveira, S.C.B.; Nascimento, V.B. Voltammetric determination of tartaric acid in wines by electrocatalytic oxidation on a cobalt(II)-phthalocyanine-modified electrode associated with multiway calibration. Anal. Chim. Acta 2018, 1008, 29–37. [Google Scholar] [CrossRef]
  64. Pigani, L.; Simone, G.V.; Foca, G.; Ulrici, A.; Masino, F.; Cubillana-Aguilera, L.; Calvini, R.; Seeber, R. Prediction of parameters related to grape ripening by multivariate calibration of voltammetric signals acquired by an electronic tongue. Talanta 2018, 178, 178–187. [Google Scholar] [CrossRef] [PubMed]
  65. Laneri, S.; Di Lorenzo, R.; Sacchi, A.; Dini, I. Dosage of Bioactive Molecules in the Nutricosmeceutical Helix aspersa Muller Mucus and Formulation of New Cosmetic Cream with Moisturizing Effect. Nat. Prod. Commun. 2019, 14, 1–7. [Google Scholar] [CrossRef] [Green Version]
  66. Dini, I.; Graziani, G.; Gaspari, A.; Fedele, F.L.; Sicari, A.; Vinale, F.; Cavallo, P.; Lorito, M.; Ritieni, A. New Strategies in the Cultivation of Olive Trees and Repercussions on the Nutritional Value of the Extra Virgin Olive Oil. Molecules 2020, 25, 2345. [Google Scholar] [CrossRef] [PubMed]
  67. Dini, I.; Graziani, G.; Fedele, F.L.; Sicari, A.; Vinale, F.; Castaldo, L.; Ritieni, A. An Environmentally Friendly Practice Used in Olive Cultivation Capable of Increasing Commercial Interest in Waste Products from Oil Processing. Antioxidants 2020, 9, 466. [Google Scholar] [CrossRef] [PubMed]
  68. Taverniers, I.; de Loose, M.; van Bockstaele, E. Trends in quality in the analytical laboratory. II. Analytical method validation and quality assurance. TrAC Trends Anal. Chem. 2004, 23, 535–552. [Google Scholar] [CrossRef]
  69. BIPM Bureau International des Poids et Mesures (2017). What Is Metrology? Available online: https://www.bipm.org/en/worldwide-metrology/ (accessed on 28 September 2008).
  70. Belouafa, S.; Habti, F.; Benhar, S.; Belafkih, B.; Tayane, S.; Hamdouch, S.; Bennamara, A.; Abourriche, A. Statistical tools and approaches to validate analytical methods: Methodology and practical examples. Int. J. Metrol. Qual. Eng. 2017, 8, 9. [Google Scholar] [CrossRef]
  71. Parampreet, K.; Stoltzfus, J. Type I, II, and III statistical errors: A brief overview. Biostatistics 2017, 3, 268–270. [Google Scholar]
  72. Robin, E.D.; Lewiston, N.J. Type 3 and type 4 errors in the statistical evaluation of clinical trials. Chest 1990, 98, 463–465. [Google Scholar] [CrossRef]
  73. Patz, C.D.; David, A.; Hente, K.T. Wine Analysis using FTIR. Focus 2000, 24, 16–18. [Google Scholar]
  74. Giavarina, D. Understanding Bland Altman analysis. Biochem. Med. 2015, 25, 141–151. [Google Scholar] [CrossRef] [PubMed] [Green Version]
  75. Bilic-Zulle, L. Comparison of methods: Passing and Bablok regression. Biochem. Med. 2011, 21, 49–52. [Google Scholar] [CrossRef] [PubMed]
Figure 1. Ischia DOC Piedirosso or Per’e Palummo wine total spectrum.
Separations 08 00191 g001
Figure 2. Average of SO2 concentrations in wine samples determined by official method and WineScan technology.
Separations 08 00191 g002
Figure 3. Statistical differences (Kolmogorov–Smirnov Test) between SO2 results obtained by the official method and winescan technology. The continuous line represents the normal distribution. The dashed dots represent the observed distribution.
Separations 08 00191 g003
Figure 4. Bland–Altman Test of SO2 results obtained by the official method and WineScan technology. The dashed line represents the regression confidence. The continuous line represents the interval limits.
Separations 08 00191 g004
Figure 5. Passing & Bablok regression analysis of SO2 results obtained by the official method and WineScan technology. The line y = x is represented by the dashed line. The regression line corresponds to the solid line.
Separations 08 00191 g005
Figure 6. Average of alcohol concentrations in wine samples determined by official method and WineScan technology.
Separations 08 00191 g006
Figure 7. Statistical differences (Kolmogorov–Smirnov test) between alcohol concentration results obtained by the official method and WineScan technology. The continuous line represents the normal distribution. The dashed dots represent the observed distribution.
Separations 08 00191 g007
Figure 8. Bland–Altman Test of alcohol concentration results obtained by the official method and WineScan technology. The dashed line represents the regression confidence. The continuous line represents the interval limits.
Separations 08 00191 g008
Figure 9. Passing & Bablok regression analysis of alcohol concentration results obtained by the official method and WineScan technology. The line y = x is represented by the dashed line. The regression line corresponds to the solid line.
Separations 08 00191 g009
Figure 10. Average of total acid concentrations in wine samples determined by official method and WineScan technology.
Separations 08 00191 g010
Figure 11. Statistical differences (Kolmogorov–Smirnov test) between total acid concentration results obtained by the official method and WineScan technology. The continuous line represents the normal distribution. The dashed dots represent the observed distribution.
Separations 08 00191 g011
Figure 12. Bland–Altman Test of total acid results obtained by the official method and WineScan technology. The dashed line represents the regression confidence. The continuous line represents the interval limits.
Separations 08 00191 g012
Figure 13. Passing & Bablok regression analysis of total acid results obtained by the official method and WineScan technology. The line y = x is represented by the dashed line. The regression line corresponds to the solid line.
Separations 08 00191 g013
Publisher’s Note: MDPI stays neutral with regard to jurisdictional claims in published maps and institutional affiliations.

