Article

Optimisation, Component Analysis, and Bioactivity Evaluation of Sunflower Calathide Flavonoids Obtained Using Ultra-High-Pressure Extraction


1
College of Pharmacy, Chengdu University of Traditional Chinese Medicine, Chengdu 610075, China
2
State Key Laboratory of Biopharmaceutical Preparation and Delivery, Institute of Process Engineering, Chinese Academy of Sciences, Beijing 100190, China
3
School of Traditional Chinese Medicine, Capital Medical University, Beijing 100069, China
*
Authors to whom correspondence should be addressed.
Separations 2026, 13(4), 114; https://doi.org/10.3390/separations13040114
Submission received: 3 March 2026 / Revised: 31 March 2026 / Accepted: 7 April 2026 / Published: 9 April 2026

Abstract

This study aims to achieve the efficient preparation of sunflower calathide flavonoids (SCF) through optimized processes and to elucidate their composition and bioactivity. Total flavonoids were prepared by optimizing the ultra-high-pressure extraction (UHPE) process using a combination of single-factor experiments and response surface methodology, followed by purification and enrichment via macroporous resin. The components were identified with UPLC-QTOF-MS/MS technology, and their antioxidant activity and inhibitory capacity against xanthine oxidase (XOD) were systematically evaluated. The optimal extraction conditions were determined as follows: an extraction pressure of 290 MPa, a holding time of 8 min, an ethanol concentration of 67%, and a solid-to-liquid ratio of 1:14 g/mL. Under these conditions, the total flavonoid extraction yield reached 13.52 mg/g, which was further enriched to 16.74 mg/g after purification by macroporous resin. A total of 32 flavonoid compounds were identified, and the purified extract exhibited stronger free radical scavenging ability, total reducing power, ferric ion reducing activity, and XOD inhibitory effect compared to the unpurified extract. The combination of UHPE with macroporous resin separation technology effectively enriches SCF, and the resulting extract possesses both antioxidant and xanthine oxidase inhibitory activities, providing a theoretical basis and technical support for its industrial production and application.

1. Introduction

Helianthus annuus L., belonging to the Asteraceae family, is a plant valued for both medicinal and culinary purposes, known for its effects in expelling wind, calming the liver, clearing heat, promoting urination to dampness, and detoxifying [1]. Various parts of the sunflower possess medicinal value, with its flower head being particularly notable. The sunflower calathide is recognized for its properties in clearing heat and stopping bleeding [2] and is rich in various active components, primarily including flavonoids [3], pectin [4,5], polysaccharides [6], proteins [7], alkaloids [8], and essential oils [9]. Flavonoids are prominent bioactive constituents in sunflower calathide, with a content ranging from 0.67% to 0.82% [10]. Zhang Bairong et al. [11] employed an ultrasonic-assisted enzymatic extraction method to obtain a total flavonoid yield of 20.45 ± 0.13 mg/g from sunflower calathides, and the resulting extract demonstrated significant antioxidant activity. In another study, Wang Kaiyu [12] utilized 30% ethanol as a solvent for reflux extraction to isolate flavonoids from sunflower calathides. Subsequent analysis by LC-MS technology led to the identification of 16 flavonoid components, such as quercetin. They have been scientifically validated for various pharmacological activities, including antioxidant [10], uric acid-lowering [13], and anti-tumor effects [14]. Given the excellent bioactivities of flavonoid compounds, research in this area has garnered increasing attention. However, the current low extraction efficiency of SCF leads to resource wastage, creating an urgent need to optimize the extraction and purification processes for the efficient preparation of these active components.
As an emerging non-thermal processing technology, UHPE applies high pressure to raw materials, exerting significant force on the cells. This leads to the rupture of the cell walls, which accelerates the contact between active ingredients and the solvent, thereby facilitating the dissolution of these components into the extraction solvent [15]. Moreover, this process does not damage the chemical structure of small-molecule active substances. Compared with traditional extraction techniques, UHPE offers significant advantages, including low-temperature operation, short processing times, and high yields of active components. Zhou et al. [16] employed ultra-high-pressure technology to extract flavonoids from hawthorn (Crataegus pinnatifida), and their results showed that the extraction rate was significantly higher than that of the traditional water extraction method. Similarly, Wang [15] et al. compared the extraction efficiency of flavonoids from Abelmoschus manihot using UHPE, ultrasonic, and solvent extraction methods, confirming that UHPE is particularly time-saving and efficient. Currently, research on the extraction process of sunflower calathide total flavonoids (SCTF) has predominantly focused on techniques such as ultrasonic extraction [17], reflux extraction [3], and degummed sunflower calathide ultrasonic extraction [18]. However, studies utilizing UHPE technology for the extraction of flavonoids from sunflower calathide have not yet been reported.
This study aims to establish a combined technique of UHPE coupled with macroporous resin adsorption and separation to achieve the efficient and stable preparation of SCF. The in vitro antioxidant activity of the flavonoids will be systematically evaluated by determining their scavenging abilities against DPPH and hydroxyl radicals, as well as their total reducing power. Concurrently, the potential uric acid-lowering activity will be investigated using XOD inhibition rate as the key indicator. The findings are intended to provide a theoretical basis and technical support for the high-value utilization of sunflower calathide resources and the development of functional health products containing SCF.

2. Materials and Methods

2.1. Materials and Reagents

The sunflower calathides were sourced from an authentic saline-alkali land in Chifeng City, Inner Mongolia, China, and were provided by Lei hetang Chinese Medicinal Materials Co., Ltd. (Hefei, Anhui, China). The experimental material was prepared from mature sunflower calathides, from which the sunflower seeds, outer ray florets, and tubular flowers were removed, leaving only the receptacle tissue. This material was subsequently cleaned and dried for use in the following extraction experiments. Rutin standard (Solarbio, Shanghai, China, HPLC ≥ 98%), ascorbic acid (AR, >99.0%, Aladdin Biochemical Technology Co., Ltd., Shanghai, China), allopurinol standard (98%, Merck & Co., Inc. Rahway, NJ, USA), and bovine milk xanthine oxidase (X1875-5UN, Merck Group, Darmstadt, Germany) were purchased from Aladdin (Shanghai, China). LSA-21 macroporous adsorption resin (Shanghai YuanYe BioTechnology Co., Ltd., Shanghai, China) and 1,1-diphenyl-2-picrylhydrazyl (DPPH) radical (Aladdin) were also obtained from Aladdin. Chromatographic-grade acetonitrile and formic acid were purchased from Merck (Kenilworth, NJ, USA). All other analytical chemicals were acquired from Shanghai Aladdin Biochemical Technology Co., Ltd. (Shanghai, China).

2.2. Flavonoid Content Determination

Following the method of Chang [19]. A stock solution of rutin (0.1 mg/mL) was prepared by accurately weighing a constant mass of the standard powder. A series of standard solutions was prepared by transferring aliquots (0.5, 1.0, 1.5, 2.0, and 2.5 mL) of the stock solution into separate 10 mL centrifuge tubes. A control was prepared using distilled water. Each tube was brought to a volume of 2.5 mL with 30% ethanol. Subsequently, 0.15 mL of 5% Na2SO3 and 0.15 mL of 10% Al(NO3)3 were added to each tube, followed by a 6-min incubation period. After the addition of 2 mL of sodium hydroxide solution, the volume of each tube was adjusted to 5 mL with distilled water. For the color development, 2 mL of 4% NaOH was added, and the solution was diluted to a final volume of 5 mL with distilled water.
The sunflower head alcohol extract was diluted appropriately and prepared in the same manner as the standard solutions, with each sample analyzed in triplicate. The absorbance of each reaction mixture was measured at 510 nm using a microplate reader. A standard curve was constructed by plotting absorbance against the known rutin concentration. The flavonoid content in the samples was then calculated from this standard curve and expressed as mg/g.
The absorbance of the reaction mixture at 510 nm was linearly fitted against the rutin concentration to obtain the regression equation (Equation (1)): Y = 0.0025X − 0.0026 (R2 = 0.9990). This indicates a strong linear relationship between concentration and absorbance in the tested range of 0–100 μg/mL.
X = m W   × d   ×   1000
where:
X = Total flavonoid content, mg/g
m = Mass of the analyte determined from the standard curve, in milligrams (mg)
W = Mass or volume of the sample, in grams (g) or milliliters (mL)
d = Dilution factor

2.3. Preparation of SCTF

The dried sunflower calathides were crushed and passed through a 40-mesh sieve, then stored in a sealed, light-proof container at 4 °C. The sunflower calathide powder was defatted with petroleum ether for 24 h in a thermostatic shaker at 4 °C and 180 rpm. After naturally evaporating the solvent, residual fats and pectin were removed using a composite enzymatic method [20]. The pre-treated sunflower calathide powder was then used to prepare the SCTF extract using UHPE technology. Subsequently, 2% CaCl2 was added, and the mixture was left to stand for 4 h before being vacuum-filtered to further remove pectin. Finally, the ethanol was removed by concentration with a rotary evaporator.

2.4. Optimization of the UHPE Process

Based on the ultra-high-pressure system (Model HPP.W1–600/0.5, Tianjin Huataisenshao Bioengineering Technology Co., Ltd., Tianjin, China), the extraction process was optimized by single-factor and response surface methodology. With a fixed system extraction solvent volume, the effects of holding time (A), extraction pressure (B), ethanol concentration (C), and solid-to-liquid ratio (D) on the extraction yield of SCTF (X, mg/g) were investigated. The single-factor experiment levels included A (2, 4, 6, 8, 10, 12 min), B (0, 100, 200, 300, 400, 500 MPa), C (40%, 50%, 60%, 70%, 80%, 90%), and D (1/5, 1/10, 1/15, 1/20, 1/25, 1/30 g/mL). The factor levels for the response surface experiments are presented in Table 1.

2.5. Purification and Enrichment of SCF

An accurately weighed amount of pre-treated dried resin was placed into a beaker, and the concentrated sunflower calathide extract was added. The mixture was shaken for 4 h, followed by standing for 20 h to achieve saturated adsorption. The resin, saturated with adsorbed flavonoids, was then filtered out. Unadsorbed impurities were removed by washing the resin with distilled water using vacuum filtration. Subsequently, a 70% (v/v) ethanol solution was precisely added for desorption. After shaking for 4 h, the eluent was collected and concentrated by rotary evaporation, followed by lyophilization to obtain the SCF. After the extraction, the extraction yield was calculated (mg/g).

2.6. Study on the Microstructural Changes in the Extract Residue by Scanning Electron Microscopy (SEM)

The microstructures of the residues, both untreated and after extraction by UHPE, were observed using a Sigma 300 high-resolution field emission scanning electron microscope (FE-SEM, Zeiss, Cambourne, UK). Prior to observation, the samples were dried at a low temperature.

2.7. Qualitative Analysis by UPLC-Q-TOF-MS/MS

The flavonoid components in SCF were identified using a liquid chromatography–mass spectrometry system, which consisted of an Agilent 1290 UPLC (Agilent Technologies, Inc., Santa Clara, CA, USA) coupled to an Agilent Q-TOF 6550 mass spectrometer (GangaGen Biotechnologies Pvt. Ltd., Bangalore, India). An electrospray ionization source was utilized, supporting both positive and negative ion scanning modes. After separation by UPLC, the sample entered the ion source, where charged quasi-molecular ions ([M−H] or [M+H]+) were formed under the influence of a high-voltage electric field. An information-dependent acquisition mode was employed; in this mode, quasi-molecular ions with high intensity in the first-stage mass spectrum were selected and fragmented in a collision cell with accelerated high-voltage gas, generating characteristic fragment ions. Agilent MassHunter Qualitative Analysis software (version B.04.00) was used to integrate the UPLC retention time, the accurate mass of the quasi-molecular ions from the first-stage mass spectrum, and the MS/MS fragment ion information, thereby constructing a multi-dimensional identification system.
Chromatographic Conditions: The separation was performed on a Waters BEH C18 column (2.1 × 100 mm, 1.7 μm, Shanghai Baiguan Scientific Instruments Co., Ltd., Shanghai, China) at a flow rate of 0.3 mL/min with an injection volume of 5 μL. The mobile phase consisted of (A) 0.1% formic acid in water and (B) acetonitrile. A gradient elution program was applied.
Mass Spectrometry Conditions: The mass spectrometer was operated in both positive (ESI+) and negative (ESI−) electrospray ionization modes. The full scan range for mass spectra was set from m/z 240 to 650. The source parameters were optimized as follows: sheath gas temperature at 350 °C, sheath gas flow at 12 L/min, with capillary voltages of 4000 V for ESI+ and 3200 V for ESI−.

2.8. Determination of Antioxidant Activity

2.8.1. DPPH Radical Scavenging Activity (%)

A stock solution of DPPH was prepared and stored in an amber bottle to protect it from light. A series of concentrations of Ascorbic acid (Vc, AR, >99.0%, Aladdin), SCF, and SCTF were added to an aliquot of the diluted DPPH solution, with each sample receiving an equal volume of the test substance [21]. The reaction mixtures were then incubated in the dark at 37 °C for a specified time. Following the incubation, the absorbance was measured at 515 nm. The DPPH radical scavenging activity (%) was calculated using Equation (2).
DPPH   Scavenging   Rate   ( % ) = A 0     ( A 1     A 2 ) A 0 %
where:
A0: Absorbance of the blank control group.
A1: Absorbance of the experimental group.
A2: Absorbance of the sample solution itself.

2.8.2. Hydroxyl Radical Scavenging Activity (%)

The Vc solution and the SCF, SCTF solution were added to a 96-well plate. Subsequently, FeSO4 solution and salicylic acid solution were added. Immediately after, hydrogen peroxide solution was added, and the mixture was thoroughly mixed. The plate was then incubated in a 37 °C constant temperature box for 40 min [22]. After incubation, the absorbance was measured at 510 nm using a microplate reader (Spectra Max M5, Molecular Devices, San Jose, CA, USA). The calculation formula is shown in Equation (3).
Hydroxyl   radical   scavenging   rate   ( % ) = A 0 ( A 1 A 2 ) A 0   ×   100 %
where A0 is the absorbance of the blank control, A1 is the absorbance of the experimental group, and A2 is the absorbance of the sample solution itself.

2.8.3. Ferric Reducing Ability (%)

Preparation of the Standard Curve: To prepare the standard curve, 0.02 mL of FeSO4 solutions at concentrations of 0.04, 0.08, 0.12, 0.16, and 0.20 mmol/L were added to separate centrifuge tubes. This was followed by the addition of 0.6 mL of FRAP working solution (prepared by mixing 0.3 mol/L acetate buffer, 10 mmol/L 2,4,6-tris(2-pyridyl)-s-triazine solution, and 20 mmol/L FeCl3 in a 10:1:1 ratio, v/v/v) and 0.06 mL of distilled water. The mixtures were thoroughly vortexed and incubated in a 37 °C water bath for 10 min. The absorbance was then measured at 593 nm using a microplate reader. A blank was prepared using distilled water in place of the FeSO4 solution. The standard curve was constructed and fitted to the equation: y = 0.0116x − 0.0028, R2 = 0.9993.
Sample Analysis: For the analysis of samples, 0.02 mL of solutions of Vc, SCF, and SCTF at various concentrations were added to separate centrifuge tubes. Then, 0.6 mL of FRAP working solution and 0.06 mL of distilled water were added. The mixtures were vortexed, incubated in a 37 °C water bath for 10 min, and the absorbance was read at 593 nm using a microplate reader. A blank was prepared using distilled water.

2.8.4. Total Reducing Capacity (%)

Vc, SCF, and SCTF were mixed with phosphate buffer and potassium ferricyanide. The mixture was then incubated at 50 °C for a specific period of time. After cooling to room temperature, trichloroacetic acid solution, water, and FeCl3 were added sequentially. The reaction was allowed to proceed for 10 min at the same temperature (50 °C). Vc was used as a positive control, and the absorbance was measured at 700 nm [23].

2.9. Analysis of XOD Inhibitory Activity

According to the method described in reference [24], SCTF and SCF were mixed uniformly with XOD (at a final concentration of 20 U·L−1) and incubated at 37 °C for 30 min. Subsequently, a xanthine solution (at a final concentration of 1.0 mmol·L−1) was added to initiate the reaction. After a specific reaction time, the absorbance was measured at 295 nm. Phosphate-buffered saline was used as the blank group, and each measurement was repeated three times. An inhibition curve for each test solution against XOD was plotted, and the half-maximal inhibitory concentration (IC50) (mg/mL, μg/mL) value was determined. The calculation formula is shown in Equation (4).
Inihibition   rate ( % ) = [ ( A B ) ( C D ) ] A B × 100 %
Note: A is the OD value of the reaction mixture containing XOD and xanthine; B is the OD value of the mixture containing buffer solution and xanthine; C is the OD value of the reaction mixture containing XOD, sunflower calathide ethanol extract, and xanthine; D is the OD value of the mixture containing buffer solution, sunflower calathide ethanol extract solution, and xanthine.

2.10. Data Processing

All experiments were performed in triplicate. The response surface methodology and corresponding data were analyzed and graphed using Design-Expert 13 and GraphPad Prism 9 software. For this study, all experimental data were statistically analyzed with [Origin 2024/Design-Expert 13] software. The results for antioxidant activity and XOD inhibition effects are expressed as “mean ± standard deviation (Mean ± SD)”. Each experimental group consisted of three parallel replicates to ensure the reliability and reproducibility of the data.

3. Results

3.1. Results of Single-Factor Experiments Based on UHPE

3.1.1. Effect of Extraction Time on the Extraction Yield of SCTF

The extraction time is closely related to the solid–liquid diffusion rate of bioactive components under UHPE conditions. As shown in Figure 1a, within the 2 to 8 min range, the SCTF extraction yield exhibited a gradual upward trend with the extension of the pressure-holding time. The yield reached its peak value of 13.60 mg/g when the pressure-holding time was 8 min. However, upon further extension of the pressure-holding time, the SCTF extraction yield subsequently decreased. Therefore, 8 min was determined to be the optimal pressure-holding time. The underlying mechanism is as follows: within a certain time frame, extending the pressure-holding time promotes the dissolution of flavonoids from the sunflower calathide cells. Once the system reaches a solid–liquid dissolution equilibrium, a continuous extension of the pressure-holding time can lead to an increased dissolution of impurities in the system, and the structure of some flavonoid components may also degrade. These factors ultimately result in a decrease in the SCTF extraction yield.

3.1.2. Effect of Extraction Pressure on the Extraction Yield of SCTF

During the UHPE process, extraction pressure is a critical factor affecting the release efficiency of flavonoid components and plays a significant regulatory role in the efficiency of the overall extraction process. As shown in Figure 1a, after UHPE, the SCTF extraction yield was significantly higher than that of the atmospheric pressure extraction group. The reason for this is that UHPE can rapidly rupture the cell walls of sunflower calathides, break the structural integrity of the cells, thereby accelerating the dissolution rate of intracellular active components and the diffusion kinetics of the solvent, which in turn enhances the extraction yield of the target components [25]. Within the 0 to 300 MPa range, the SCTF extraction yield showed an increasing trend with the rise in pressure; it reached a maximum value of 13.38 mg/g at an extraction pressure of 300 MPa. However, when the pressure exceeded 300 MPa, the extraction yield began to decrease. The primary reason for this phenomenon is that excessively high extraction pressure can induce the osmotic migration of macromolecules within the sunflower calathide powder, which blocks the diffusion channels for the small-molecule active components, thereby reducing the SCTF extraction yield. In summary, 300 MPa was determined to be the optimal extraction pressure.

3.1.3. Effect of Ethanol Concentration on the Extraction Yield of SCTF

The solubility of flavonoid compounds changes positively with increasing ethanol concentration, which in turn affects the partition coefficient of flavonoid components during the solid–liquid extraction process. As shown in Figure 1c, within the ethanol concentration range of 40% to 70%, the SCTF extraction yield showed an increasing trend with the rise in ethanol concentration. The yield reached its peak value of 13.47 mg/g when the ethanol concentration was 70%. However, when the ethanol concentration exceeded 70%, the SCTF extraction yield began to decrease. The reason for this phenomenon may be that the sunflower calathide raw material contains a certain amount of liposoluble impurities. As the ethanol concentration increases, the dissolution of these lipophilic components also increases, competing with the flavonoid components for dissolution space, which thereby reduces the extraction efficiency of the target components. Therefore, a 70% ethanol concentration was selected as the central level for the response surface optimization experiment.

3.1.4. Effect of Solid-to-Liquid Ratio on the Extraction Yield of SCTF

The solid-to-liquid ratio is another critical factor affecting the release rate of active components and the recovery rate of flavonoid components during the UHPE process. By adjusting the solid-to-liquid ratio, the effect on the SCTF extraction yield was investigated. As shown in Figure 1d, within the solid-to-liquid ratio range of 1:5 to 1:15 (g/mL), the SCTF extraction yield showed a gradual upward trend as the solid-to-liquid ratio increased. The yield reached a maximum value of 13.69 mg/g at a solid-to-liquid ratio of 1:15 (g/mL). This is because a lower solid-to-liquid ratio implies a relatively insufficient volume of solvent, which compresses the dissolution space for active components, thereby limiting the dissolution efficiency of SCTF. In summary, a solid-to-liquid ratio of 1:15 (g/mL) was determined as the parameter for the response surface optimization experiment.

3.2. Optimization of SCTF Extraction by Response Surface Methodology

In this study, a Response Surface Methodology with a Box–Behnken Design was employed to optimize the extraction process of SCTF. The data were processed using Design-Expert 13 software to perform multiple quadratic regression analyses and Analysis of Variance. The core objectives were to validate the effectiveness of the regression model, assess the significance of the influencing factors, and determine the weight of each factor’s influence on the extraction yield, thereby providing statistical support for the process optimization.
Based on the Box–Behnken Design method, a total of 27 experimental runs with different combinations were designed, and the corresponding response surface analysis is presented in Table 2. Through linear regression analysis of the independent variables and the response value, the following quadratic regression model was obtained: y = 13.86 + 0.56A − 0.47B + 0.97C − 0.80D + 0.88AB − 0.34AC + 0.37AD + 0.0314BC − 1.68BD + 0.36CD − 1.42A2 − 1.74B2 − 3.29C2 − 1.59D2. The Analysis of Variance results in Table 3 show that the regression model has a p-value < 0.0001, indicating that the model is extremely significant. This means the established regression equation can accurately reflect the quantitative relationship between the influencing factors and the SCTF extraction yield. Furthermore, the influencing patterns reflected by the model are not caused by random error, confirming its reliability from a statistical standpoint. Among the factors, A, C, D, BD, A2, B2, C2, and D2 had an extremely significant effect on the SCTF extraction yield (p < 0.0001), while B, AB, AC, AD, and CD had a significant effect (p < 0.05). The relative impact of each main effect factor on the SCTF extraction yield can be quantitatively assessed by comparing their respective F-values in Table 3. In Analysis of Variance, the F-value is the ratio of the sum of squares for the factor effect to the sum of squares for error. Consequently, a higher F-value signifies a more pronounced effect on the response and a greater contribution to the model. Analysis of the F-values in Table 3 indicated that the order of the factors’ influence on the SCTF yield was C > D > A > B. This ranking provides a basis for establishing the priority of process optimization. In practical operations, the levels of factors C and D can be prioritized for adjustment to improve the extraction yield more efficiently. To further validate the practicality and accuracy of the regression model, a comprehensive assessment was performed based on three key metrics: the correlation coefficient (R2), the adjusted R2 (Radj2), and the signal-to-noise ratio (RS/N): The performance of the optimized model is confirmed by its high-quality metrics: an R2 of 0.9954, indicating a 99.54% success rate and a highly significant linear relationship within the fitted equation. With Radj2 of 0.9900, the model demonstrates excellent precision. Furthermore, RS/N of 30.1695 confirms the high reliability of the model’s results.
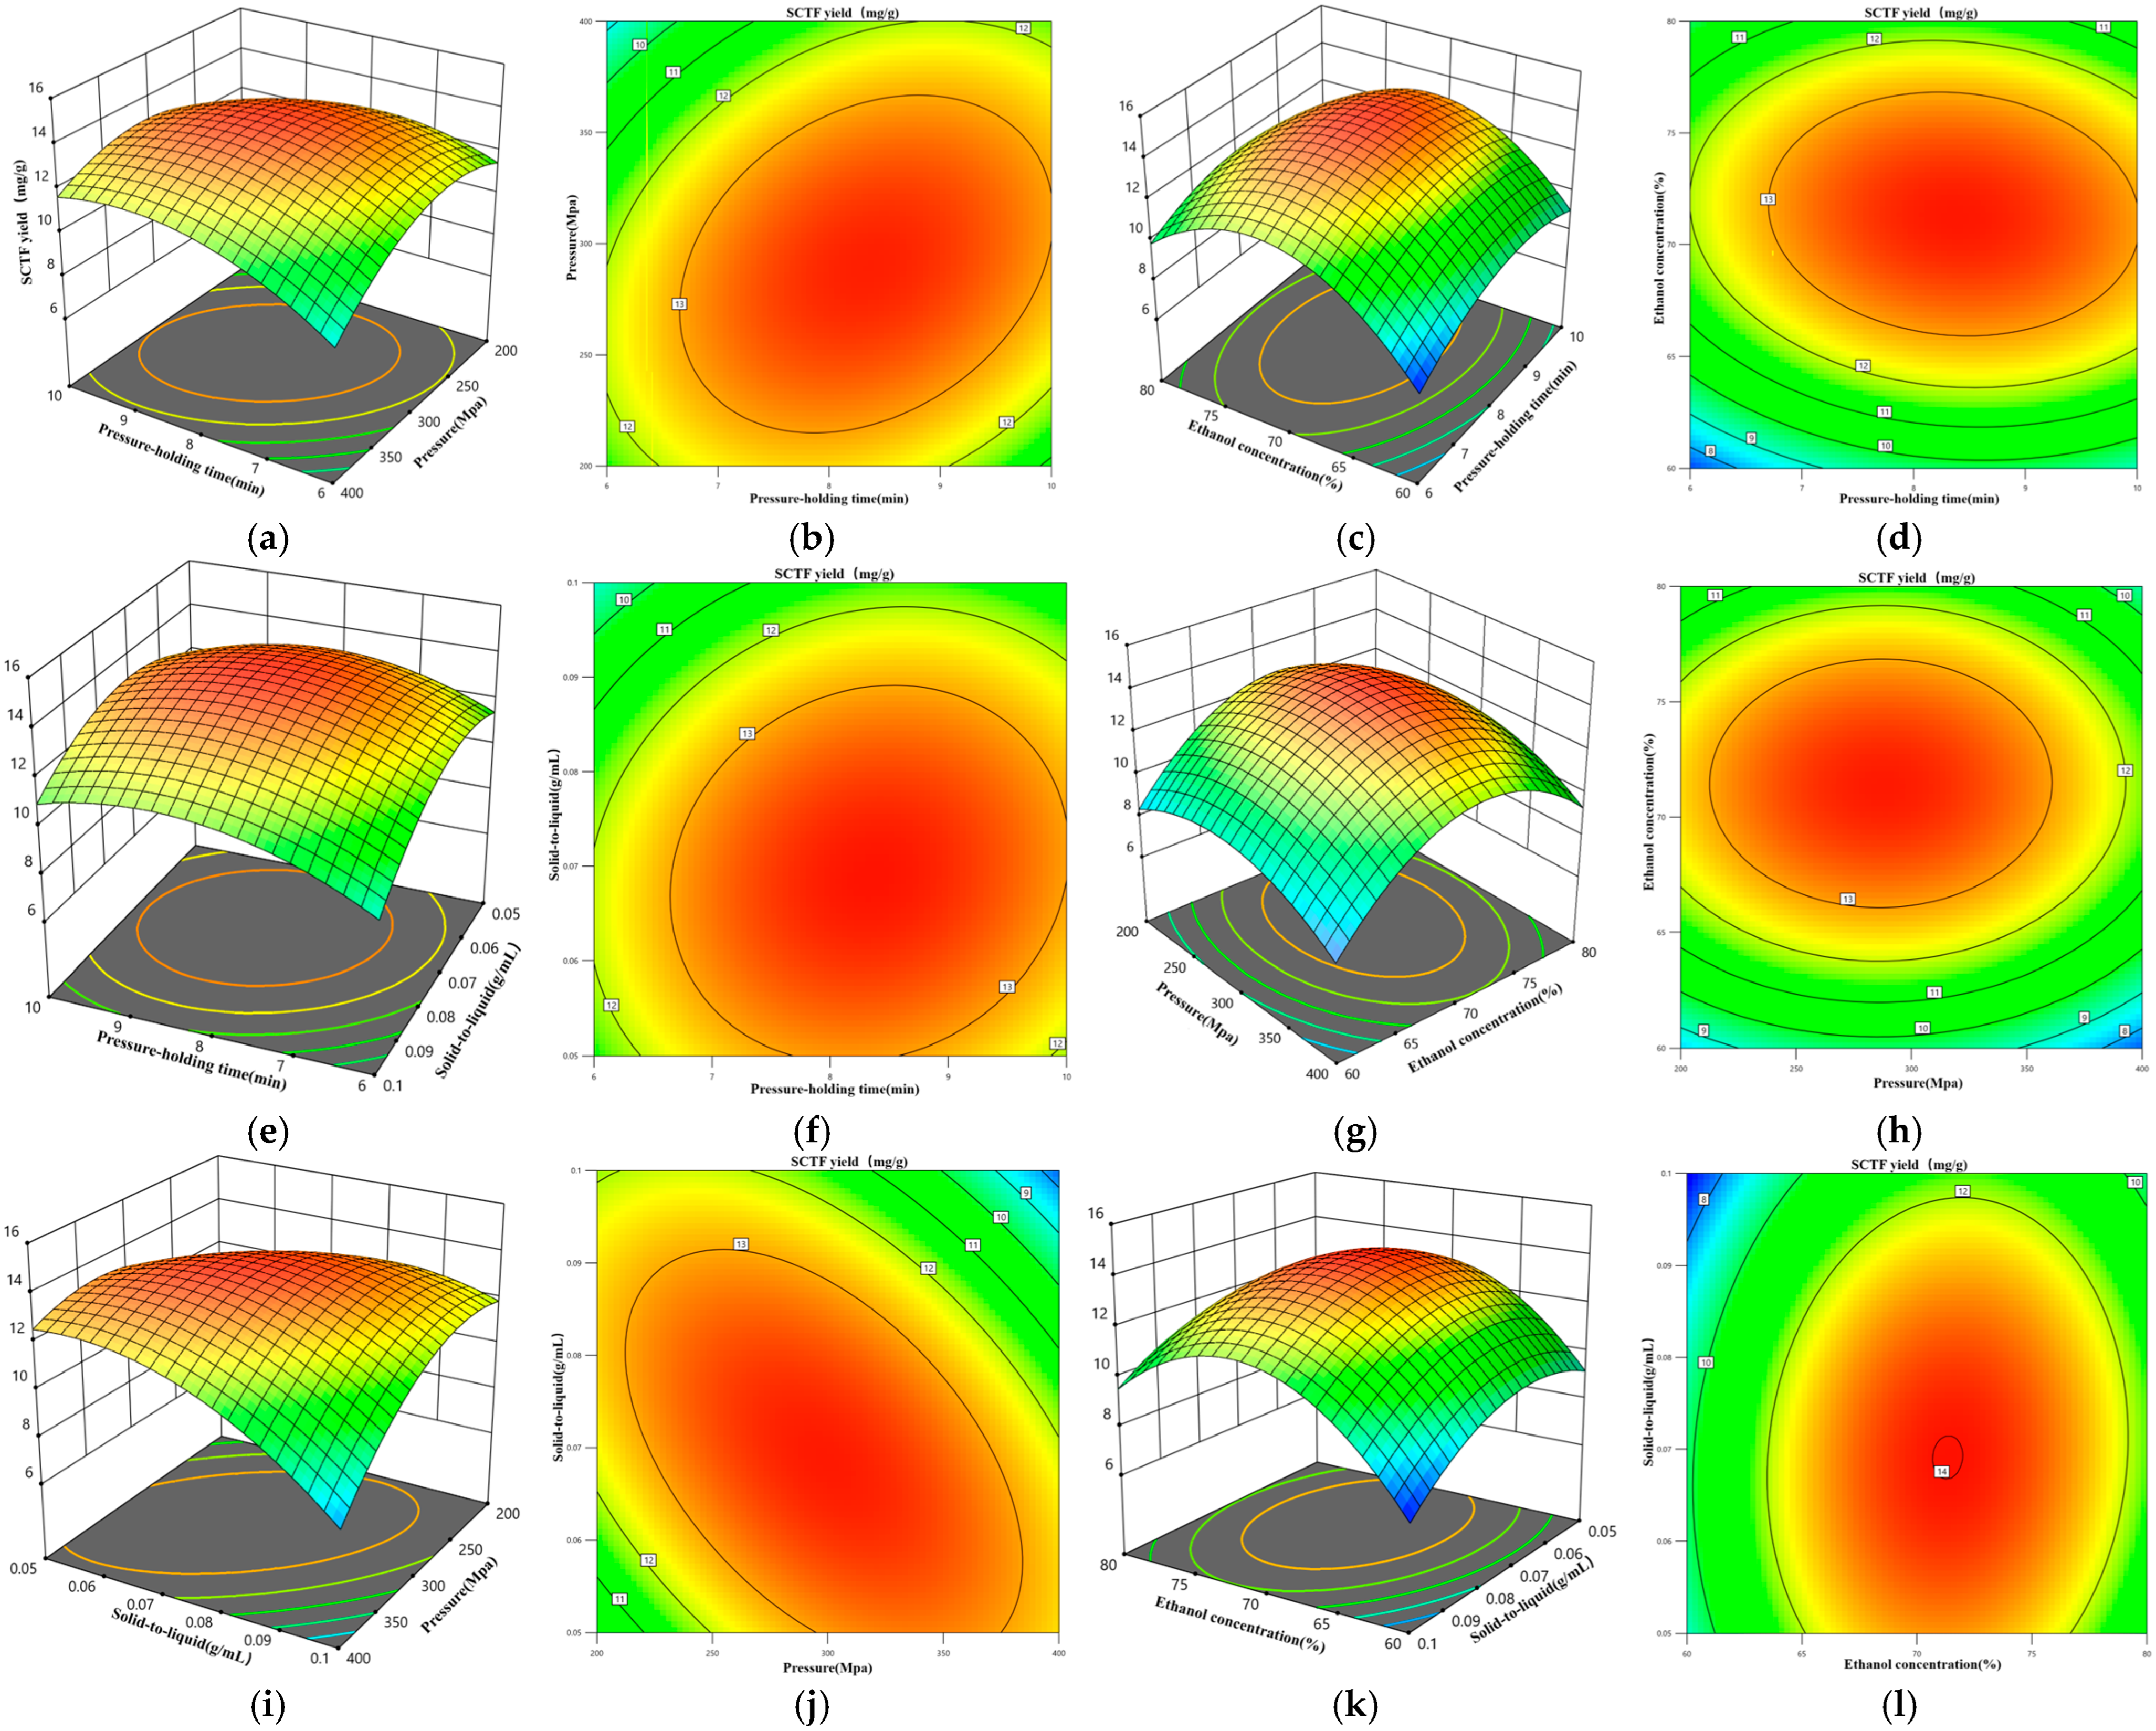
Three-dimensional response surface plots were used to visually illustrate the interactive effects of the variables—ethanol concentration, solid-to-liquid ratio, extraction pressure, and holding time—on the SCTF extraction yield (Figure 2).
Three-dimensional response surface plots were utilized to illustrate the effects of pairwise interactions among four variables (ethanol concentration, solid-to-liquid ratio, extraction pressure, and pressure holding time) on SCTF extraction yield (Figure 2). Analysis of the response surface slopes and contour line shapes revealed that the interaction between extraction pressure and solid-to-liquid ratio was the steepest, characterized by elliptical contour lines, indicating a highly significant effect on extraction yield. In contrast, the interactions involving pressure holding time with extraction pressure, ethanol concentration, and solid-to-liquid ratio, as well as solid-to-liquid ratio with ethanol concentration, exhibited relatively steep response surfaces with near-elliptical contours, suggesting statistically significant effects that can effectively enhance extraction efficiency. Conversely, the interaction between extraction pressure and ethanol concentration displayed a relatively flat response surface with circular contours, indicating a weaker, yet still significant, influence on extraction yield. The morphological characteristics of the 3D response surface plots align with the interaction effect patterns indicated by the p-values from the ANOVA, further validating the reliability of these interactions and offering an intuitive foundation for the subsequent optimization of the SCTF extraction process.
Using Design-Expert 13 software for statistical analysis, the model was used to predict the optimal extraction conditions for the SCTF yield. The predicted optimal conditions were: holding time of 7.72 min, pressure of 289.63 MPa, ethanol concentration of 67.41%, and a solid-to-liquid ratio of 1:14.02 g/mL, with a theoretical yield of 13.40 mg/g. Considering practical feasibility, these conditions were adjusted to: holding time of 8 min, pressure of 290 MPa, ethanol concentration of 67%, and a solid-to-liquid ratio of 1:14 g/mL. Under these adjusted conditions, the experimental yield was 13.52 mg/g, which is close to the predicted value, further confirming the validity of the established model. After purification by macroporous resin, the content of the active pharmaceutical ingredient was 16.73 mg/g, representing a 23.75% increase compared to the SCTF yield.

3.3. Microstructure of Residue After UHPE

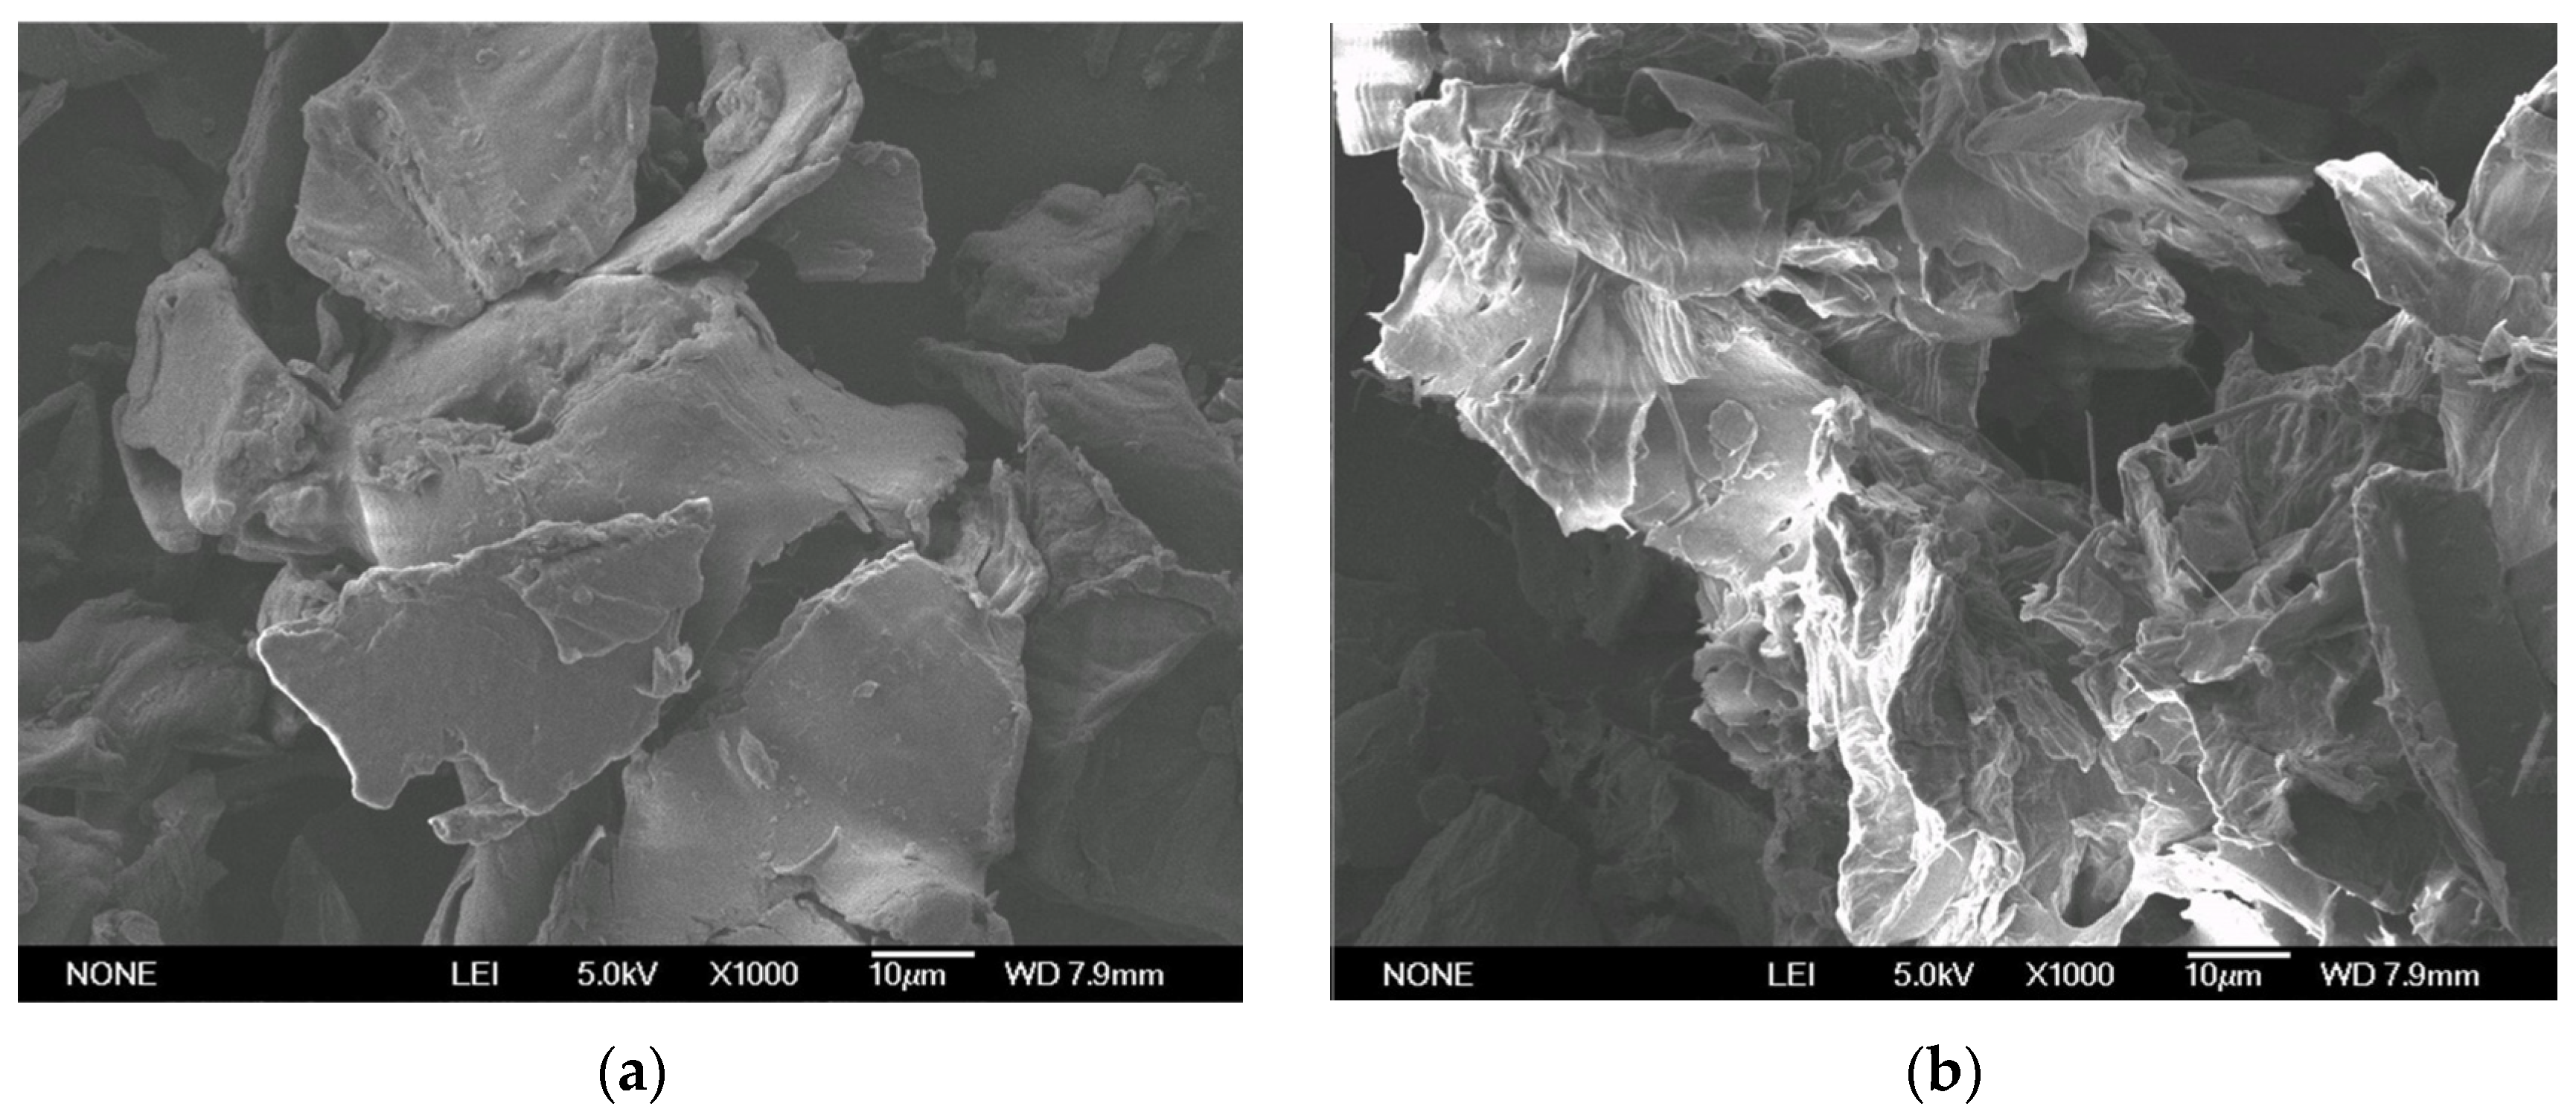
As shown in Figure 3, the particles of the sunflower calathide residue (particle size 0.42 mm) that had not undergone UHPE exhibited a compact and dense structure with a smooth and even surface. In contrast, the residue from the UHPE sample (particle size 0.42 mm) showed a significantly disrupted microstructure, displaying a loose and porous characteristic, which consequently increased its specific surface area. This change in microstructure provides more sufficient mass transfer channels and contact area for the dissolution of flavonoid compounds, facilitating the rapid diffusion of the target components from the solid phase to the liquid phase. This finding further confirms that UHPE can effectively enhance the extraction efficiency of flavonoids from sunflower calathides.

3.4. UPLC-QTOF-MS/MS Analysis

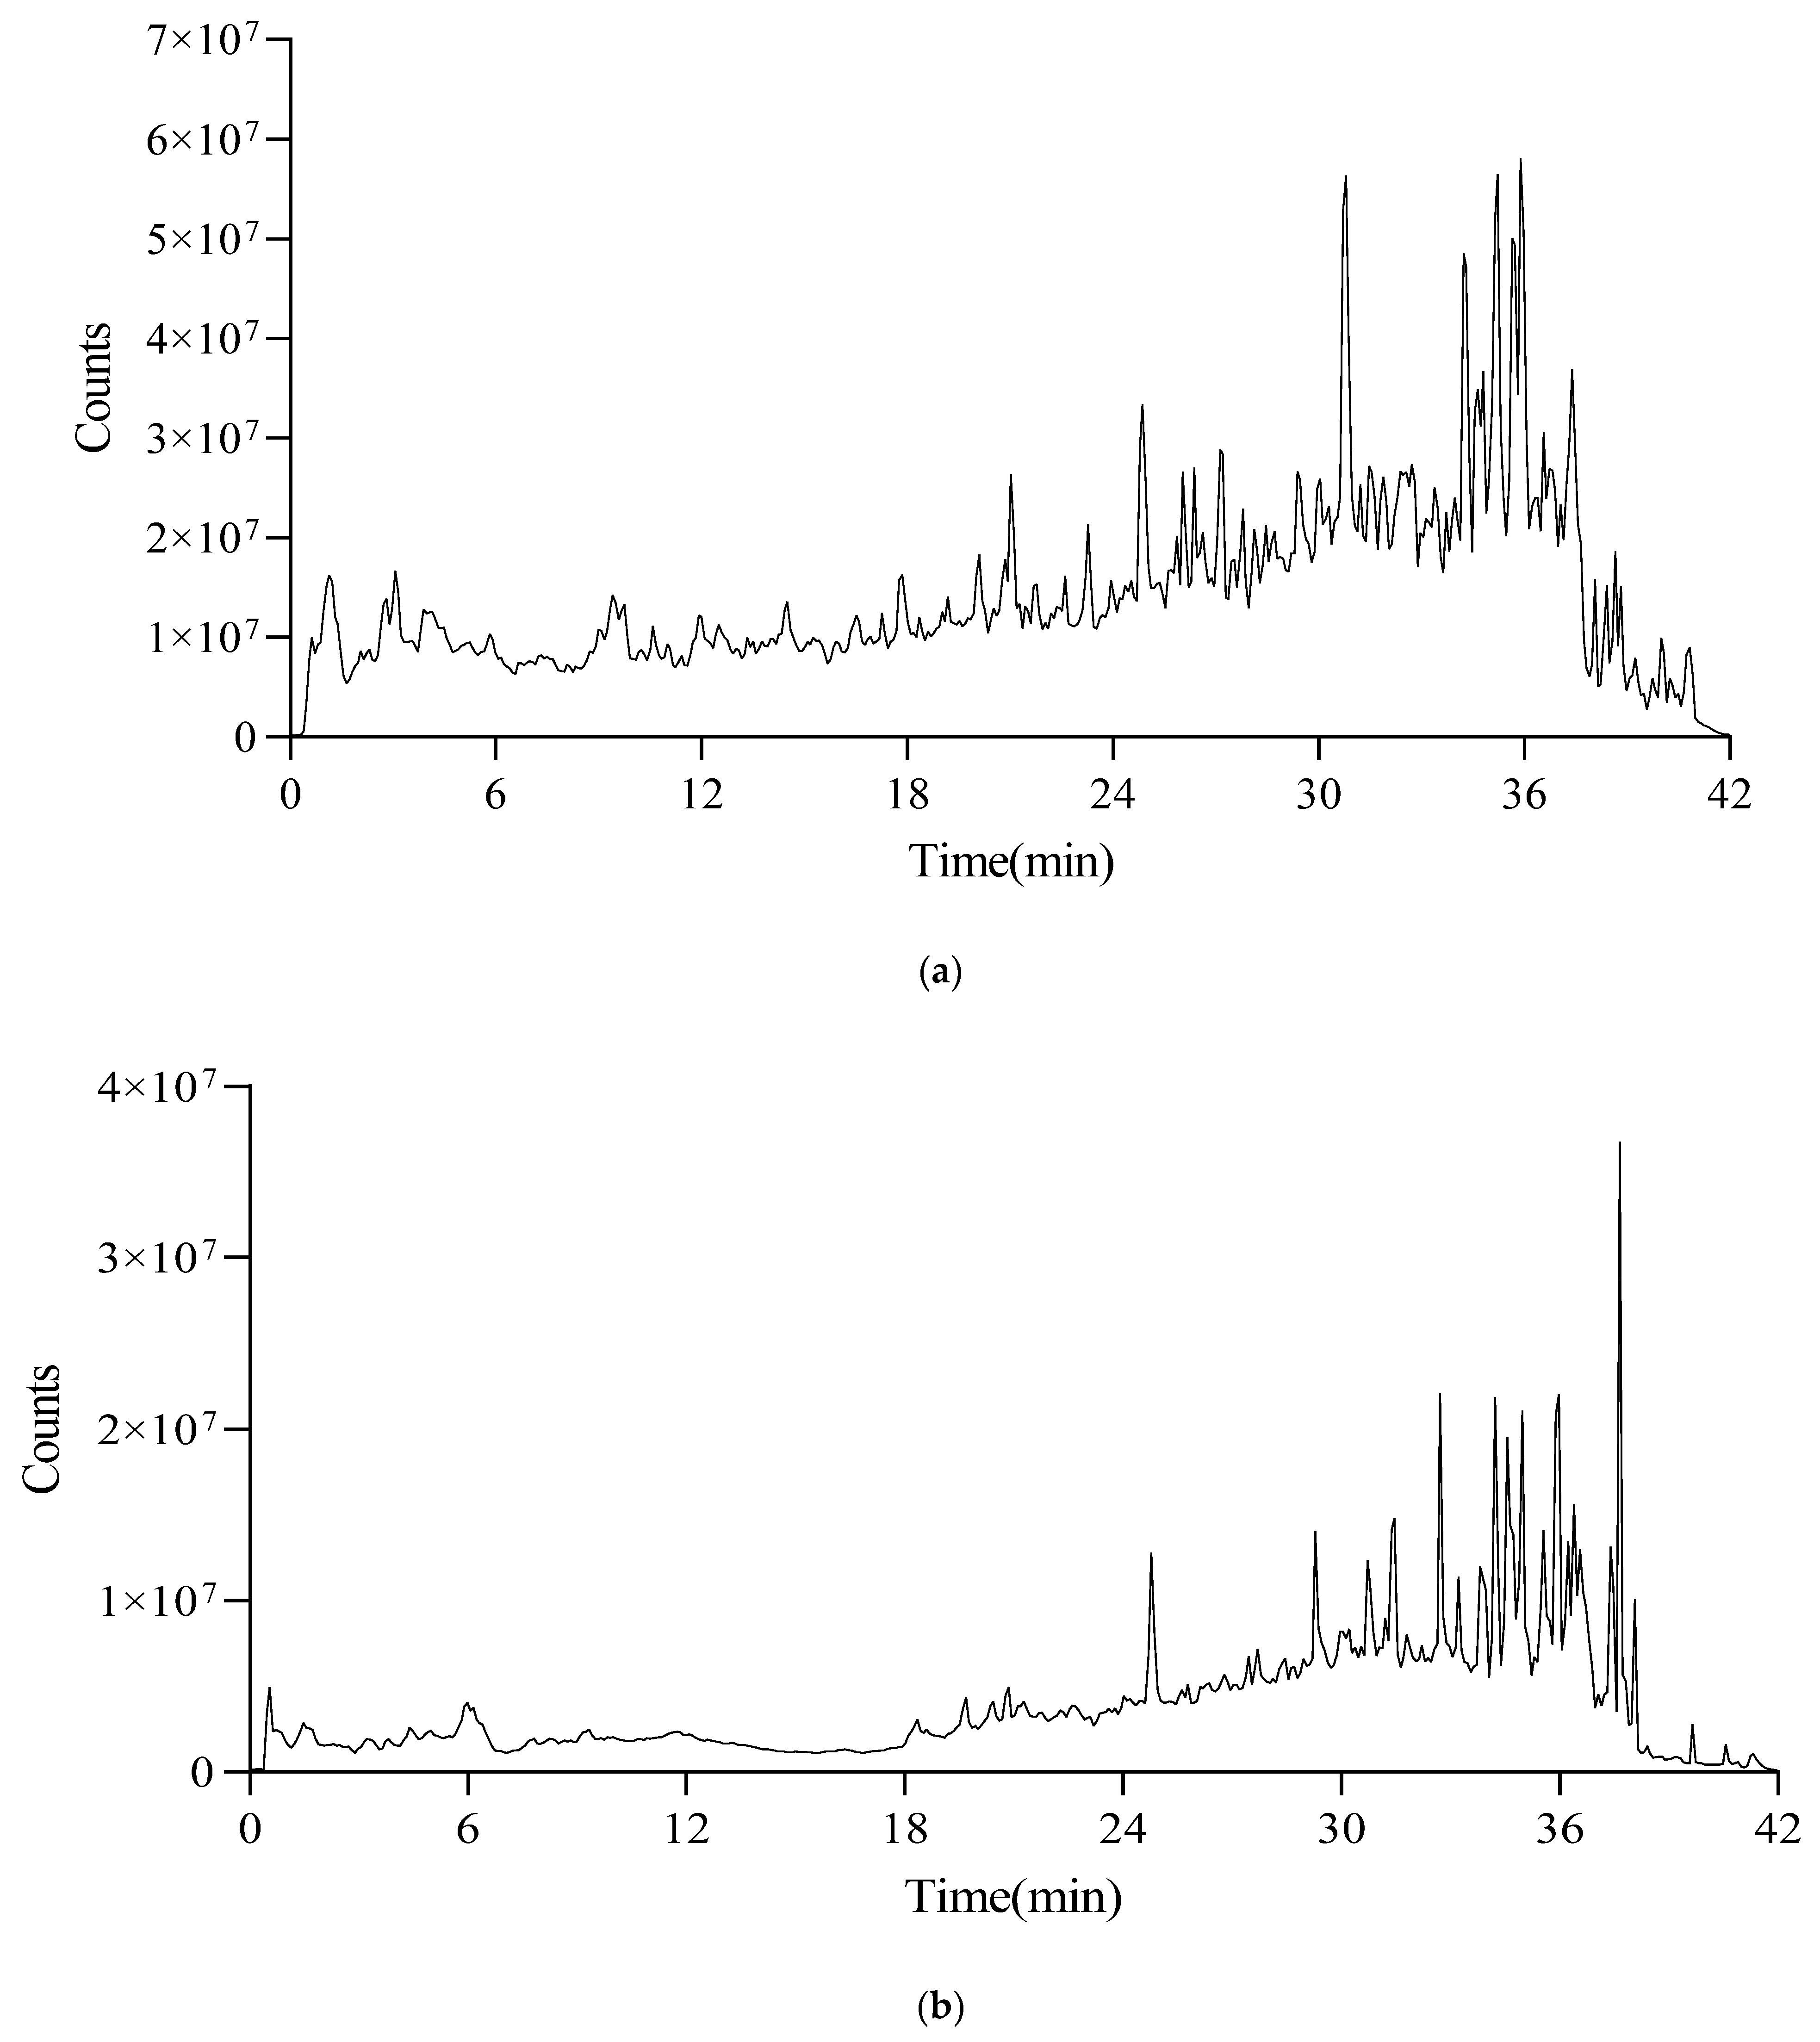
The UPLC-QTOF-MS/MS total ion chromatogram of the flavonoid compounds obtained via UHPE and subsequent separation and enrichment by macroporous resin is shown in Figure 4. By utilizing both positive and negative ionization modes in conjunction with mass-to-charge ratio (m/z), secondary fragment ion information, and Mass Frontier fragmentation rules, a total of 32 flavonoid compounds were identified through spectral library searching and structural elucidation. The detailed information on these compounds is provided in Table 4 and Table 5.

3.5. Antioxidant Activity

3.5.1. DPPH Free Radical Scavenging Activity

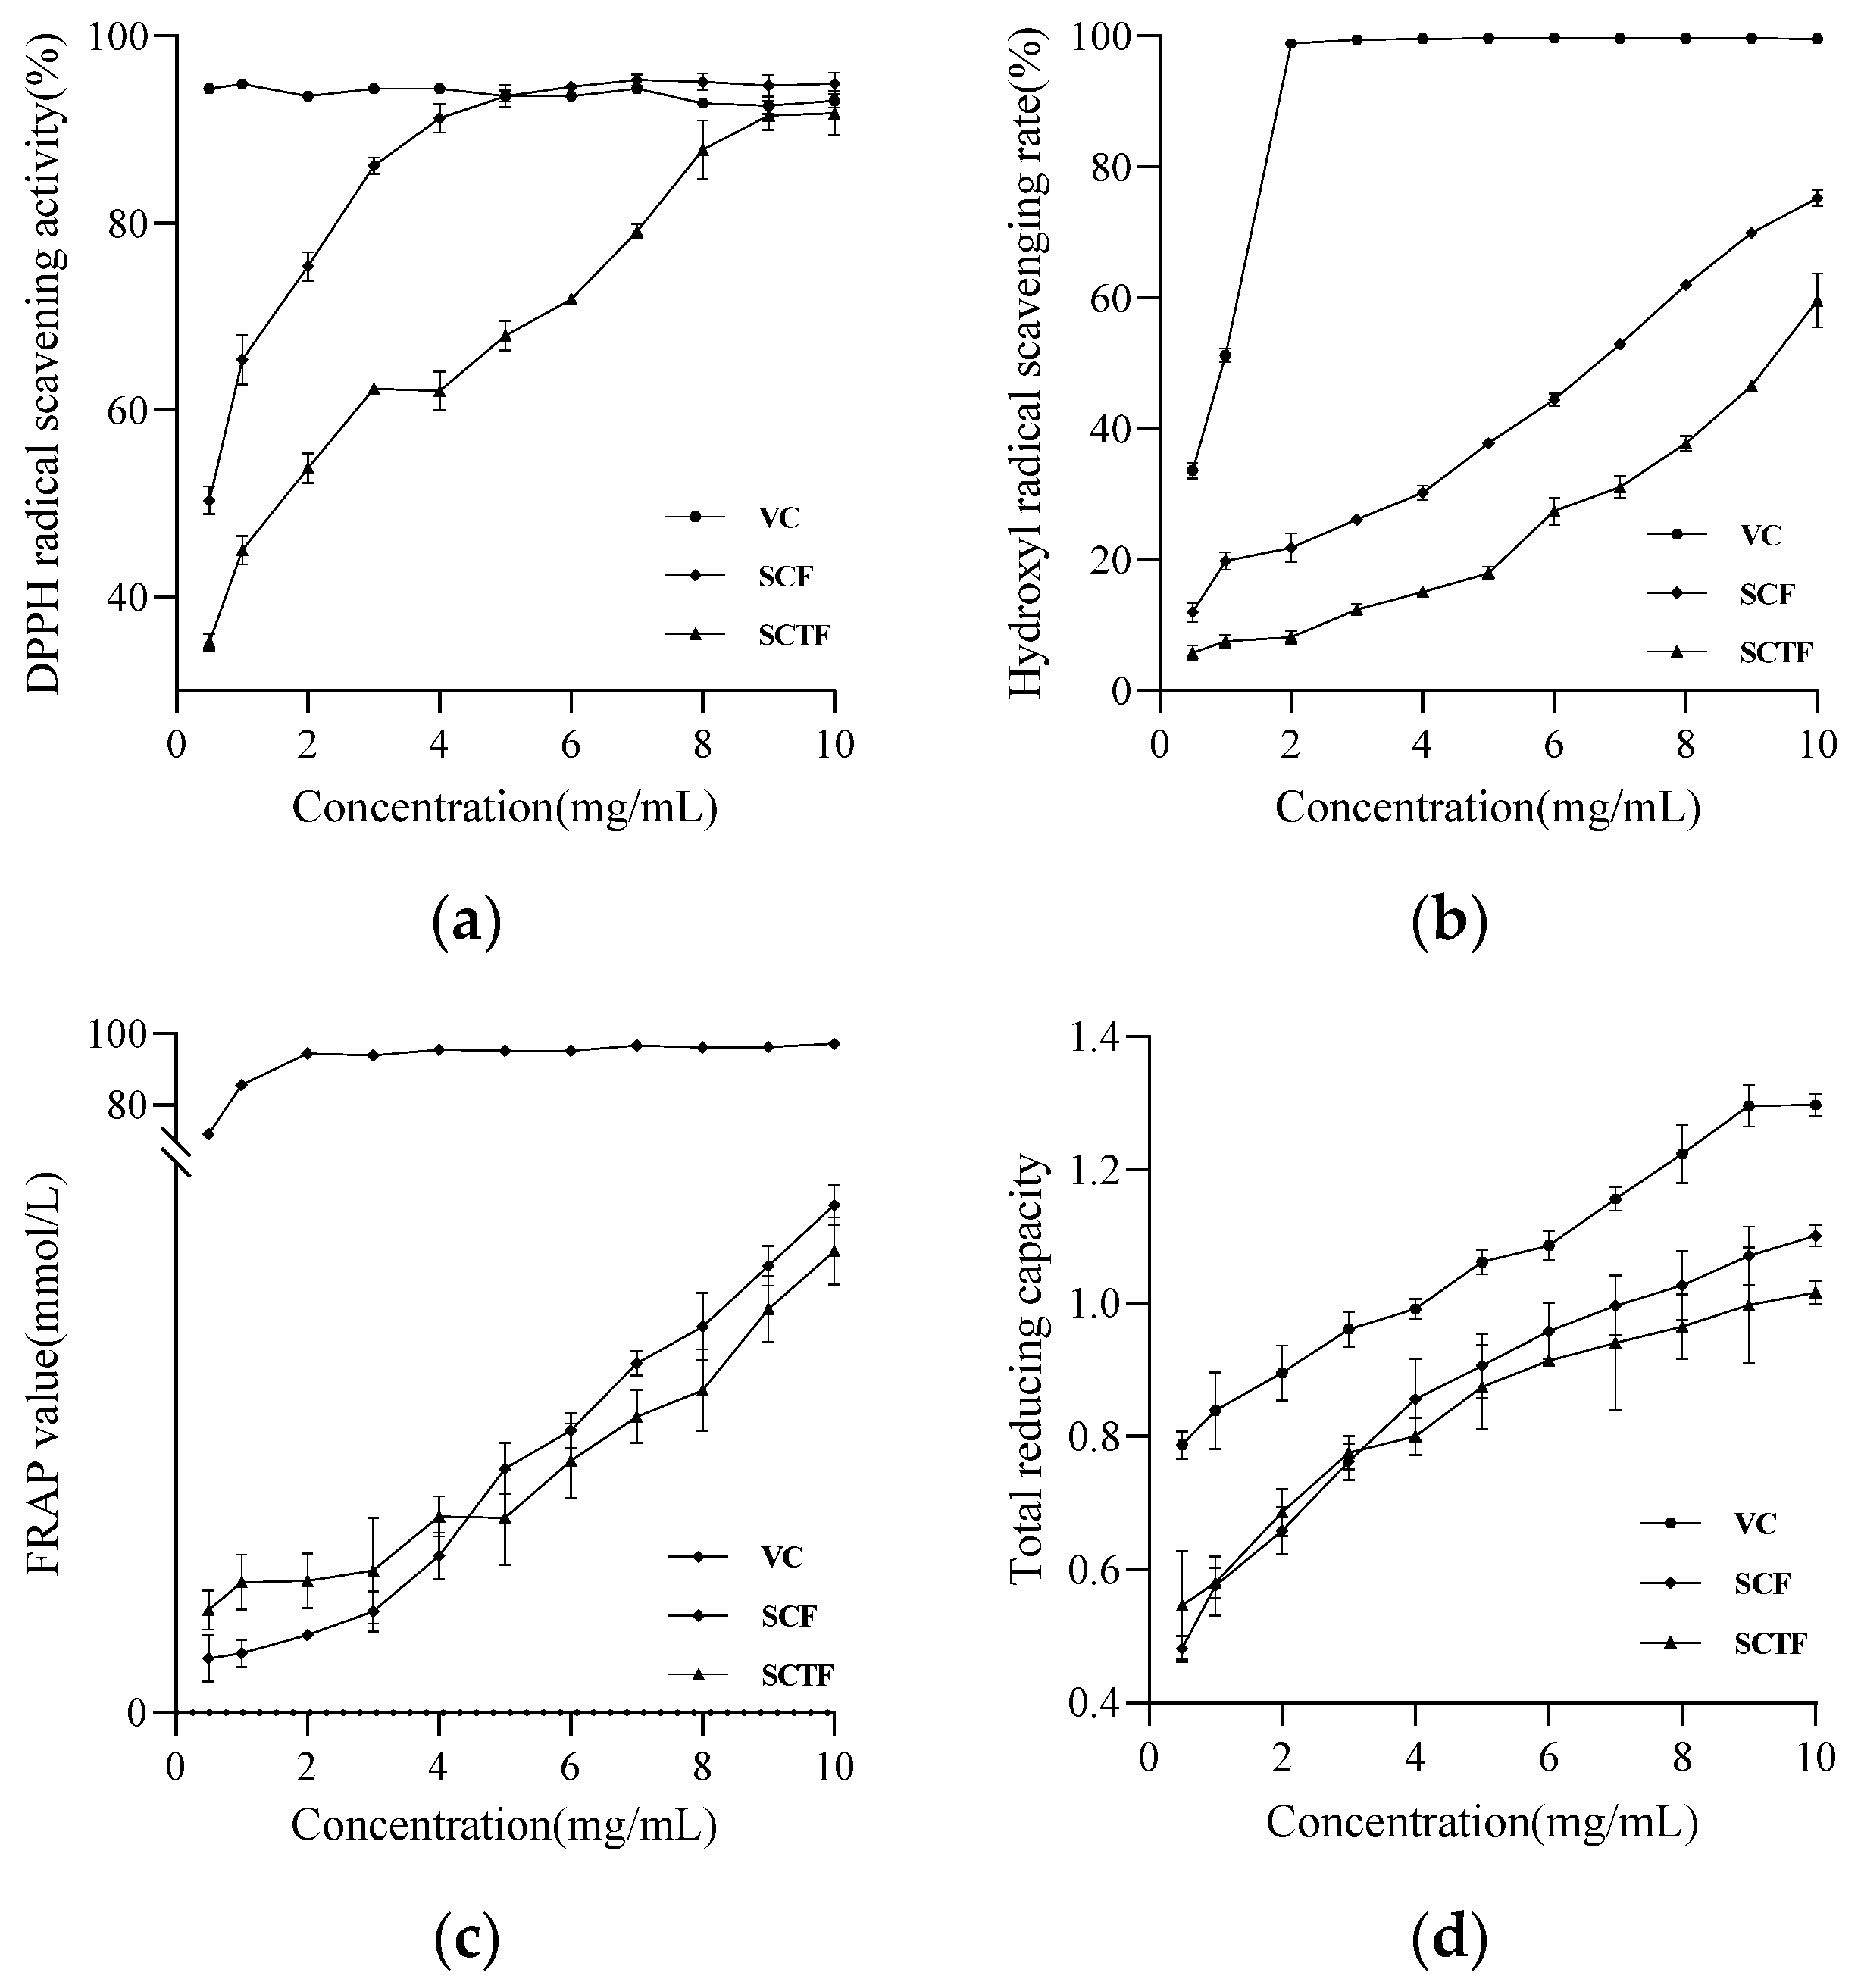
As shown in Figure 5a, the SCF concentration exhibited a significant positive correlation with the DPPH free radical scavenging rate. The scavenging rate showed a “rapid increase followed by a gradual plateau” trend as the concentration increased. When the SCF concentration increased from 0.5 mg/mL to 4 mg/mL, the DPPH radical scavenging rate progressively increased to 90%. At a concentration of 5 mg/mL, the scavenging rate stabilized and was slightly higher than that of the positive control, Vc. The IC50 of SCTF for DPPH radical scavenging was 1.58 ± 0.11 mg/mL, and the scavenging rate reached its maximum and stabilized at a concentration of 8 mg/mL. At the same concentrations, the DPPH radical scavenging ability of SCF was significantly superior to that of SCTF, indicating that the purified and enriched flavonoid components in SCF possess a higher scavenging activity against DPPH radicals.

3.5.2. Hydroxyl Radical Scavenging Activity

As depicted in Figure 5b, the scavenging rate of hydroxyl radicals by SCF was positively correlated with its concentration and continued to increase as the concentration rose. Even at a concentration of 10 mg/mL, no plateau was observed, indicating that the maximum scavenging effect had not yet been reached. In contrast, the positive control Vc achieved a hydroxyl radical scavenging rate of approximately 98% and stabilized at a concentration of 2 mg/mL. At the same concentrations, the hydroxyl radical scavenging capacity of the samples followed the order: SCTF < SCF < Vc. This suggests that although the hydroxyl radical scavenging activity of both SCTF and SCF is weaker than that of Vc, they still demonstrate strong scavenging potential at higher concentrations.

3.5.3. Ferric Ion Reducing Power

As shown in Figure 5c, the ferric ion reducing power of both SCTF and SCF was similar, and both showed a gradual increasing trend with increasing concentration (from 0.5 to 10 mg/mL), without reaching maximum reducing activity even at 10 mg/mL. Compared to Vc at the same concentrations, both SCTF and SCF exhibited a significant difference in ferric ion reducing power, yet they still possessed a certain level of this activity.

3.5.4. Total Reducing Power

As shown in Figure 5d, the total reducing power of SCTF, SCF, and Vc all increased with rising concentration. At the same mass concentrations, the total reducing power of both SCTF and SCF was slightly lower than that of Vc, but the difference was minor. The total reducing activity followed the order: SCF > SCTF. These results indicate that the purified SCF possesses a strong total reducing power, suggesting that it is a potential natural antioxidant substance.

3.6. Analysis of the Inhibitory Effect on XOD

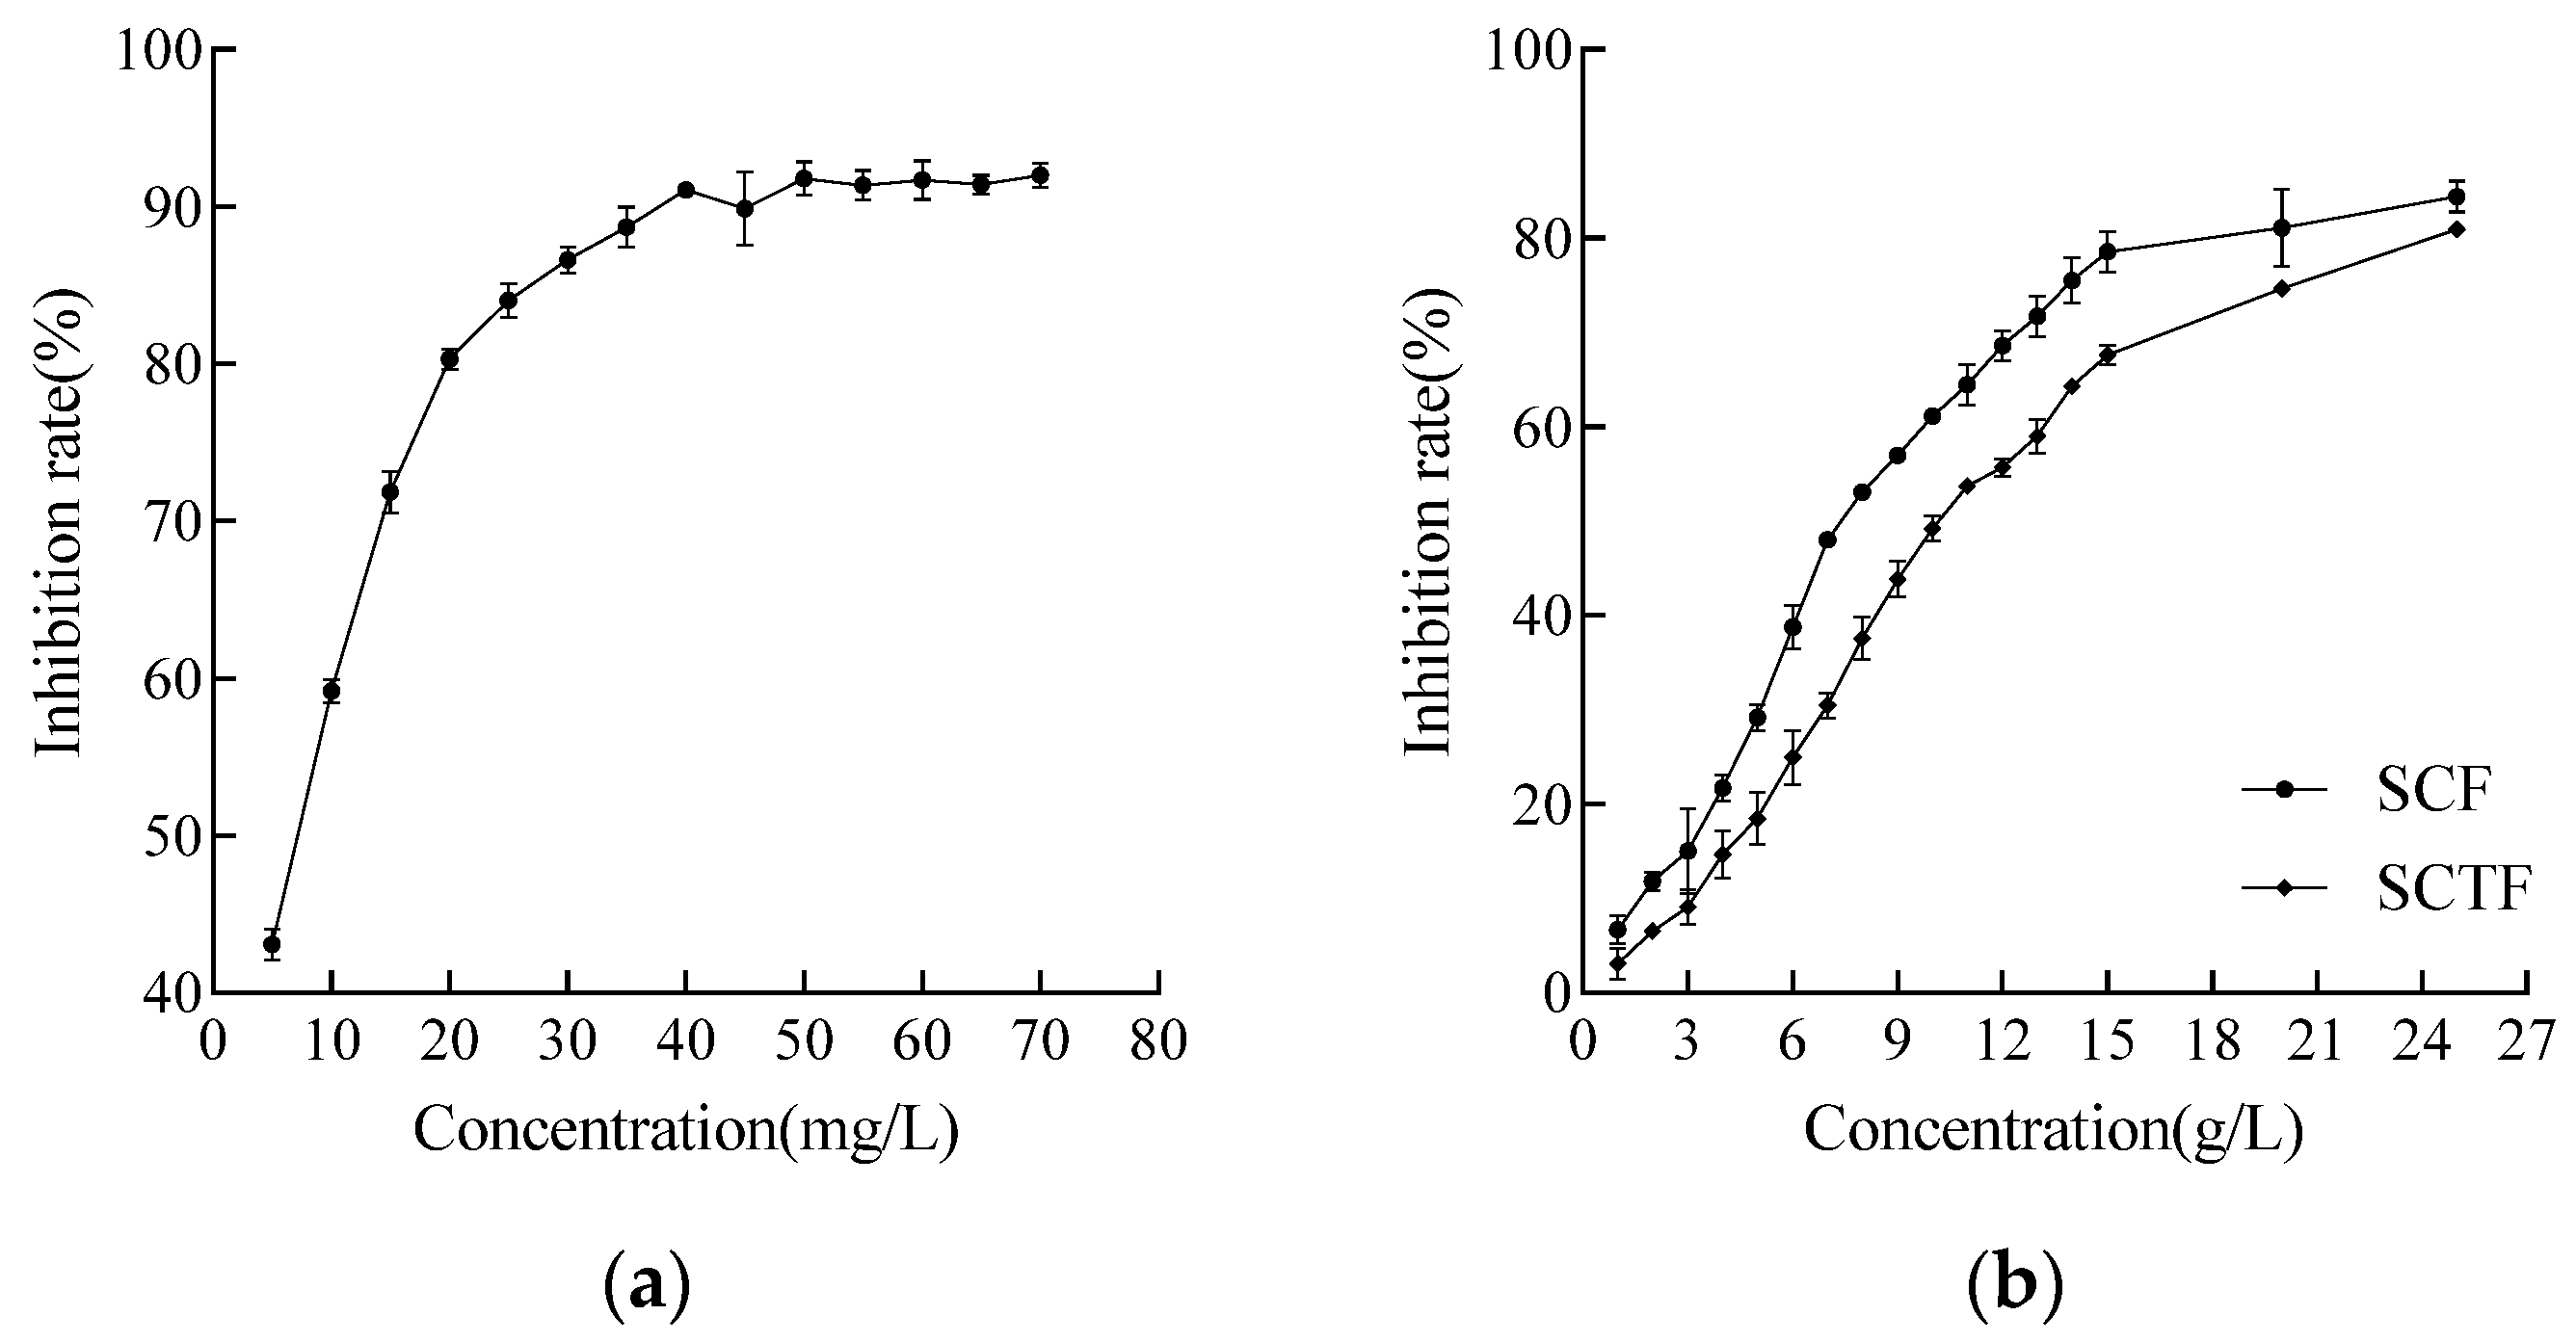
The results of the in vitro enzymatic reaction assay are shown in Figure 6a, and the parameters for in vitro XOD inhibition activity are listed in Table 6. The positive control, allopurinol, exhibited a significant dose-dependent inhibition of XOD activity, with its inhibition rate progressively increasing as the sample concentration rose. Within the concentration range of 0–70 mg/L, the inhibition rate of allopurinol against XOD showed a trend of “rapid increase followed by a plateau.” When the concentration reached 50 mg/L, the inhibition rate peaked at 91.78% and remained stable. The IC50 of allopurinol against XOD was calculated to be 7.21 ± 1.33 mg/L using a nonlinear fitting equation.
According to the calculated fitting curves, the IC50 value of SCTF for XOD was 10.23 mg/mL. After purification and enrichment by macroporous resin, the IC50 value of SCF for the XOD enzymatic reaction decreased to 7.39 mg/mL, representing a 38.38% increase in inhibitory activity compared to the pre-purified sample. This difference was statistically significant (p < 0.05). This result confirms that the macroporous resin purification process can effectively enrich the low-molecular-weight components in SCTF that possess XOD inhibitory activity, reducing interference from inactive impurities and thus significantly enhancing the XOD inhibitory capacity of the extract. As shown in Figure 6b, the inhibition of XOD by SCF was also significantly dose-dependent, with an IC50 value of 7.39 ± 0.53 mg/mL. This suggests that the sunflower calathide ethanol extract may still contain potentially high-activity XOD inhibitory components, indicating its potential for further separation and purification to develop novel XOD inhibitors.
It is hypothesized that the XOD inhibitory activity of SCF is closely related to its excellent in vitro antioxidant capacity. Previous studies have confirmed that flavonoid compounds can inhibit the enzymatic reaction efficiency of XOD by scavenging oxygen free radicals, inhibiting the generation of reactive oxygen species, and subsequently disrupting the catalytic active center of XOD or affecting its spatial conformation [26,27,28]. In this study, the purified and enriched SCF fraction is rich in various flavonoid compounds, and it is possible that a synergistic effect exists among these components, which in turn significantly enhances the inhibitory activity against XOD. The specific targeting sites, molecular regulatory mechanisms, and structural elucidation of the core active components require further investigation through targeted isolation, structural identification, and molecular docking experiments.

4. Discussion

This study introduces a novel, integrated system that combines UHPE with macroporous resin adsorption for the efficient separation of flavonoids. Through the optimization of single-factor experiments and the Box–Behnken response surface methodology, the optimal process for extracting SCTF was determined: a pressure holding time of 8 min, pressure of 290 MPa, ethanol concentration of 67%, and a solid-to-liquid ratio of 1:14 g/mL. This protocol yielded 13.52 mg/g. Subsequent purification via macroporous resin significantly enhanced the yield of SCF, demonstrating that this integrated system is an effective and stable method for enriching flavonoids from sunflower heads, thereby establishing a new paradigm for the green extraction of natural active ingredients. Structural elucidation of the purified product using UPLC-QTOF-MS/MS identified a variety of flavonoid compounds, further enriching the database of active components in sunflower calathides.
A comparative analysis with the literature highlights the advantages of this novel approach. Li Huan [29] reported a yield of only 10.04% using an ultrasonic-assisted method, while Qiao Zian [30] achieved just 1.04% through a traditional heat-assisted process optimized with RSM. These conventional methods are not only time-consuming but also require elevated temperatures. In contrast, our UHPE technology facilitates rapid extraction under mild, low-temperature conditions. Furthermore, scanning electron microscopy characterization provided a microscopic rationale for the high efficiency, revealing that ultra-high-pressure treatment disrupts the dense structure of the sunflower calathides, creating a loose, porous morphology that facilitates mass transfer and flavonoid dissolution.
The superior quality of the extracted flavonoids was validated by in vitro bioactivity assays. Both SCTF and SCF exhibited potent scavenging activity against DPPH and hydroxyl radicals, along with significant total reducing power and FRAP. This excellent antioxidant profile aligns with the findings of previous studies [10,18,29,30], confirming the efficacy of the ultra-high-pressure coupled with macroporous resin method. Notably, the antioxidant activity was concentration-dependent. Given their natural, non-toxic origin, sunflower calathide flavonoids represent promising candidates as industrial antioxidant alternatives. Additionally, both SCTF and SCF demonstrated inhibitory effects on XOD, with the purified SCF showing enhanced inhibition, comparable to values reported in the literature.
In summary, the established extraction–purification integration process is highly efficient and practical. This work provides a novel technical avenue for the high-value utilization of sunflower calathide resources and offers a robust theoretical and technical foundation for the future development of flavonoid-enriched functional foods and novel xanthine oxidase inhibitors.

Author Contributions

Conceptualization, G.Z.; methodology, H.Y.; software, H.Y.; validation, H.Y.; formal analysis, H.Y.; investigation, H.Y.; resources, G.Z.; data curation, H.Y. and L.M.; writing—original draft preparation, H.Y.; writing—review and editing, G.Z. and L.M.; visualization, H.Y.; project administration, G.Z. and L.M.; funding acquisition, G.Z. All authors have read and agreed to the published version of the manuscript.

Funding

This research was funded by the Beijing Natural Science Foundation (L234070) and the Beijing Life Science Academy (No: 2024600CD0320).

Data Availability Statement

The original contributions presented in this study are included in the article. Further inquiries can be directed to the corresponding authors.

Conflicts of Interest

The authors declare no conflicts of interest.

Abbreviations

The following abbreviations are used in this manuscript:
SCFSunflower calathide flavonoids
UHPEUltra-high-pressure extraction
XODXanthine oxidase
UPLC-QTOF-MS/MSUltra-high performance liquid chromatography–quadrupole time-of-flight mass spectrometry/mass spectrometry
SCTFSunflower calathide total flavonoids
DPPH1,1-diphenyl-2-picrylhydrazyl
SEMScanning Electron Microscope
VcAscorbic acid
FRAP2,4,6-TRI(2-PYRIDYL)-1,3,5-TRIAZINE
IC50Half-maximal inhibitory concentration
R2Correlation coefficient
Radj2Adjusted R2
RS/NSignal-to-noise ratio

References

  1. Nanjing University of Traditional Chinese Medicine. Zhongyao Da Cidian; Shanghai Scientific & Technical Publishers: Shanghai, China, 2006; Volume 1, pp. 1285–1287. [Google Scholar]
  2. Zhang, D.W.; Guo, Y.; Zhu, Z.B.; Xiang, Q.; Li, J.Y.; He, Q. Study on quality standard of Helianthi Annui Rhachis. West China J. Pharm. Sci. 2022, 37, 667–670. [Google Scholar]
  3. Xu, Z.C. The Research on Extraction and Purification of Total Flavonoids from Sunflower Plate and The Activities Study. Doctoral Dissertation, Changchun University of Technology, Changchun, China, 2016. [Google Scholar]
  4. Ma, X.M.; Yu, J.Y.; Jing, J.; Zhao, Q.; Ren, L.; Hu, Z. Optimization of sunflower head pectin extraction by ammonium oxalate and the effect of drying conditions on properties. Sci. Rep. 2021, 11, 10616. [Google Scholar] [CrossRef]
  5. Muñoz-Almagro, N.; Prodanov, M.; Wilde, J.P.; Villamiel, M.; Montilla, A. Obtainment and characterisation of pectin from Sunflower calathide purified by membrane separation techniques. Food Chem. 2020, 318, 126476. [Google Scholar] [CrossRef] [PubMed]
  6. Zhang, Y.J.; Zhang, X.J.; Cheng, F.; Shen, X.; Wang, Z. Isolation and structural characterization of a low-molecular-weight pectic polysaccharide SHPPB-1 isolated from Sunflower calathide. J. Carbohydr. Chem. 2016, 35, 273–285. [Google Scholar] [CrossRef]
  7. Qi, H.Y.; Zhang, Q.; Zhang, H.X. Production of microbial proteinfeedfrom Sunflower calathide with aspergillus tamariII by solid statefermentation. Chin. J. Appl. Environ. Biol. 1999, 5, 182–185. [Google Scholar]
  8. Li, L.; Teng, M.; Liu, Y.; Qu, Y.; Zhang, Y.; Lin, F.; Wang, D. Anti-gouty arthritis and antihyperuricemia effects of sunflower (Helianthus annuus) head extract in gouty and hyperuricemia animal models. BioMed Res. Int. 2017, 2017, 5852076. [Google Scholar] [CrossRef] [PubMed]
  9. Zhang, L.L.; Tang, Y.N.; Tang, S.L.; Hang, W.J.; Lin, M.T.; Liu, Y.; Zhang, J.Y. GC-MS Analysis of Volatile Oil from Disc of Helianthus annuus. Mod. Chin. Med. 2017, 19, 188–191. [Google Scholar]
  10. Lai, X.Y.; Duan, B.S.; Wu, D.G.; Liu, W.; Li, H.J. Research Progress on Bioactive Ingredients and Pharmacological Effects of Sunflower Plate. Pharmacol. Clin. Chin. Mater. Medica 2024, 40, 116–122. [Google Scholar]
  11. Zhang, B.Y.; Liu, H.Y.; Deng, J.W. Study on ultrasound assisted enzymatic extraction of total flavonoids from sunflower disk and its antioxidant activity. Cereals Oils 2024, 37, 119–123+128. [Google Scholar]
  12. Wang, K.Y. Anti-Hyperuricemic Potential of Bioactive Small Molecules Extracted from Helianthus annuus L. Doctoral Dissertation, Jilin University, Changchun, China, 2025. [Google Scholar]
  13. Arshad, M.; Muhammad, I.; Zhao, L.; Safdar, B.; Rehman, A.U.; Munir, M.; Raza, A.; Nadeem, M.; Iqbal, W.; Wang, C. Natural compounds with xanthine oxidase inhibitory activity: A review. Chem. Biol. Drug Des. 2019, 93, 387–418. [Google Scholar]
  14. Wei, Z.Y.; Li, Y.H.; Wei, J.H.; Pan, Z.Z.; Cao, Y.P.; Zhao, H.; Su, X.D.; Deng, J.G.; Pa, X.J. Chromenes from the disk of Helianthus annuuss and their content determination in different parts. Chin. Tradit. Pat. Med. 2021, 43, 1221–1225. [Google Scholar]
  15. Wang, X.Z.; Li, F.; Zhang, Z.G. Optimization of ultrahigh pressure extraction process and antioxidant activity of total flavonoids from Aurea helianthus stem. Cereals Oils 2020, 33, 69–72. [Google Scholar]
  16. Zhou, Z.Q.; Qian, Z.W.; Cao, L.M. Extraction of Hawthorn Leaves Flavonoids by Ultra-high Pressure Extraction. North. Hortic. 2020, 7, 116–123. [Google Scholar]
  17. Li, X.J. Optimization of extraction condition of the flavones from sunflow plant with the ultrasound-assisted extraction by uniform design. Sci. Technol. Food Ind. 2010, 31, 233–234. [Google Scholar]
  18. Bao, X.L.; Yuan, X.Y.; Li, H.; Chao, L.B.G.; Han, B. Optimization of extraction of alcohol soluble matters from sunflower disk with pectin removed and its antioxidant activity. China Oils Fats 2019, 44, 149–153+160. [Google Scholar]
  19. Chang, F.; Wu, W.N.; Cao, H. Determination of Total Flavonoids in Salvia scapiformis Hance. Nat. Prod. Res. Dev. 2016, 28, 71–75+82. [Google Scholar]
  20. Ma, X.M.; Xu, X.; Zhou, Y.J.; Shi, H.Y.; Li, L.L. Enzyme-assisted extraction of pectin from Sunflower calathide and optimization by response surface method. China Food Addit. 2015, 10, 117–122. [Google Scholar]
  21. Mo, Y.F.; Yao, L.Y.; Feng, T.; Song, S.Q.; Sun, M. Optimization of Flash Extraction Process of Total Flavonoids from Fig (Ficus carica L.) and Its Antioxidant Activities. Sci. Technol. Food Ind. 2020, 41, 186–191+220. [Google Scholar]
  22. Li, Y.; Zhao, T.M.; Huang, L.R.; Zou, T.; Wu, X. Response Surface Optimized Extraction of Flavonoids from Crotalaria ferruginea and Antioxidant Activities. Food Res. Dev. 2019, 49, 79–84. [Google Scholar]
  23. Marzo, N.S.; Sanchez, J.L.; Gurrea, M.C.; Herranz-López, M.; Micol, V.; Segura-Carretero, A. Rela-tionships between chemical structure and antioxidant activity of isolated phytocompounds from Lemon Verbena. Antioxidants 2019, 8, 324. [Google Scholar]
  24. Chen, Q.X.; Isao, K.B. Kinetics of mushroom tyrosinase inhibition by quercetin. J. Agric. Food Chem. 2002, 50, 4108–4112. [Google Scholar] [CrossRef]
  25. Jin, S.Q.; Ren, Z.Y.; Ma, Z.X.; Zhang, X.M. Optimization of the technology condition for ultra high pressure extraction Coreopsis basalis total flavonoids by response surface method. Food Sci. Technol. 2013, 38, 214–219. [Google Scholar]
  26. Wan, Y.; Wang, F.; Zou, B.; Shen, Y.; Li, Y.; Zhang, A.; Fu, G. Molecular mechanism underlying the ability of caffeic acid to decrease uric acid levels in hyperuricemia rats. J. Funct. Foods 2019, 57, 150–156. [Google Scholar] [CrossRef]
  27. Nile, S.H.; Keum, Y.S.; Nile, A.S.; Kwon, Y.D.; Kim, D.H. Potential cow milk xanthine oxidase inhibitory and antioxidant activity of selected phenolic acid derivatives. J. Biochem. Mol. Toxicol. 2018, 32, e22005. [Google Scholar] [CrossRef] [PubMed]
  28. Zhang, Z.C.; Wang, H.B.; Zhou, Q.; Hu, B.; Wen, J.-H.; Zhang, J.-L. Screening of effective xanthine oxidase inhibitors in dietary anthocyanins from purple sweet potato (Ipomoea batatas L. Cultivar Eshu No.8) and deciphering of the underlying mechanisms in vitro. J. Funct. Foods 2017, 36, 102–111. [Google Scholar] [CrossRef]
  29. Li, H. A Study on the Extraction Process and Antioxidant Activity of Ethanol Extract from Degummed Sunflower Calathide. Doctoral Dissertation, Inner Mongolia Agricultural University, Hohhot, China, 2019. [Google Scholar]
  30. Qiao, Z.A. Study on Identification of Flavonoids and the Preparation Technology of Granules in Sunflower Receptacles (Helianthus annuus L.). Doctoral Dissertation, Jilin University, Changchun, China, 2021. [Google Scholar]
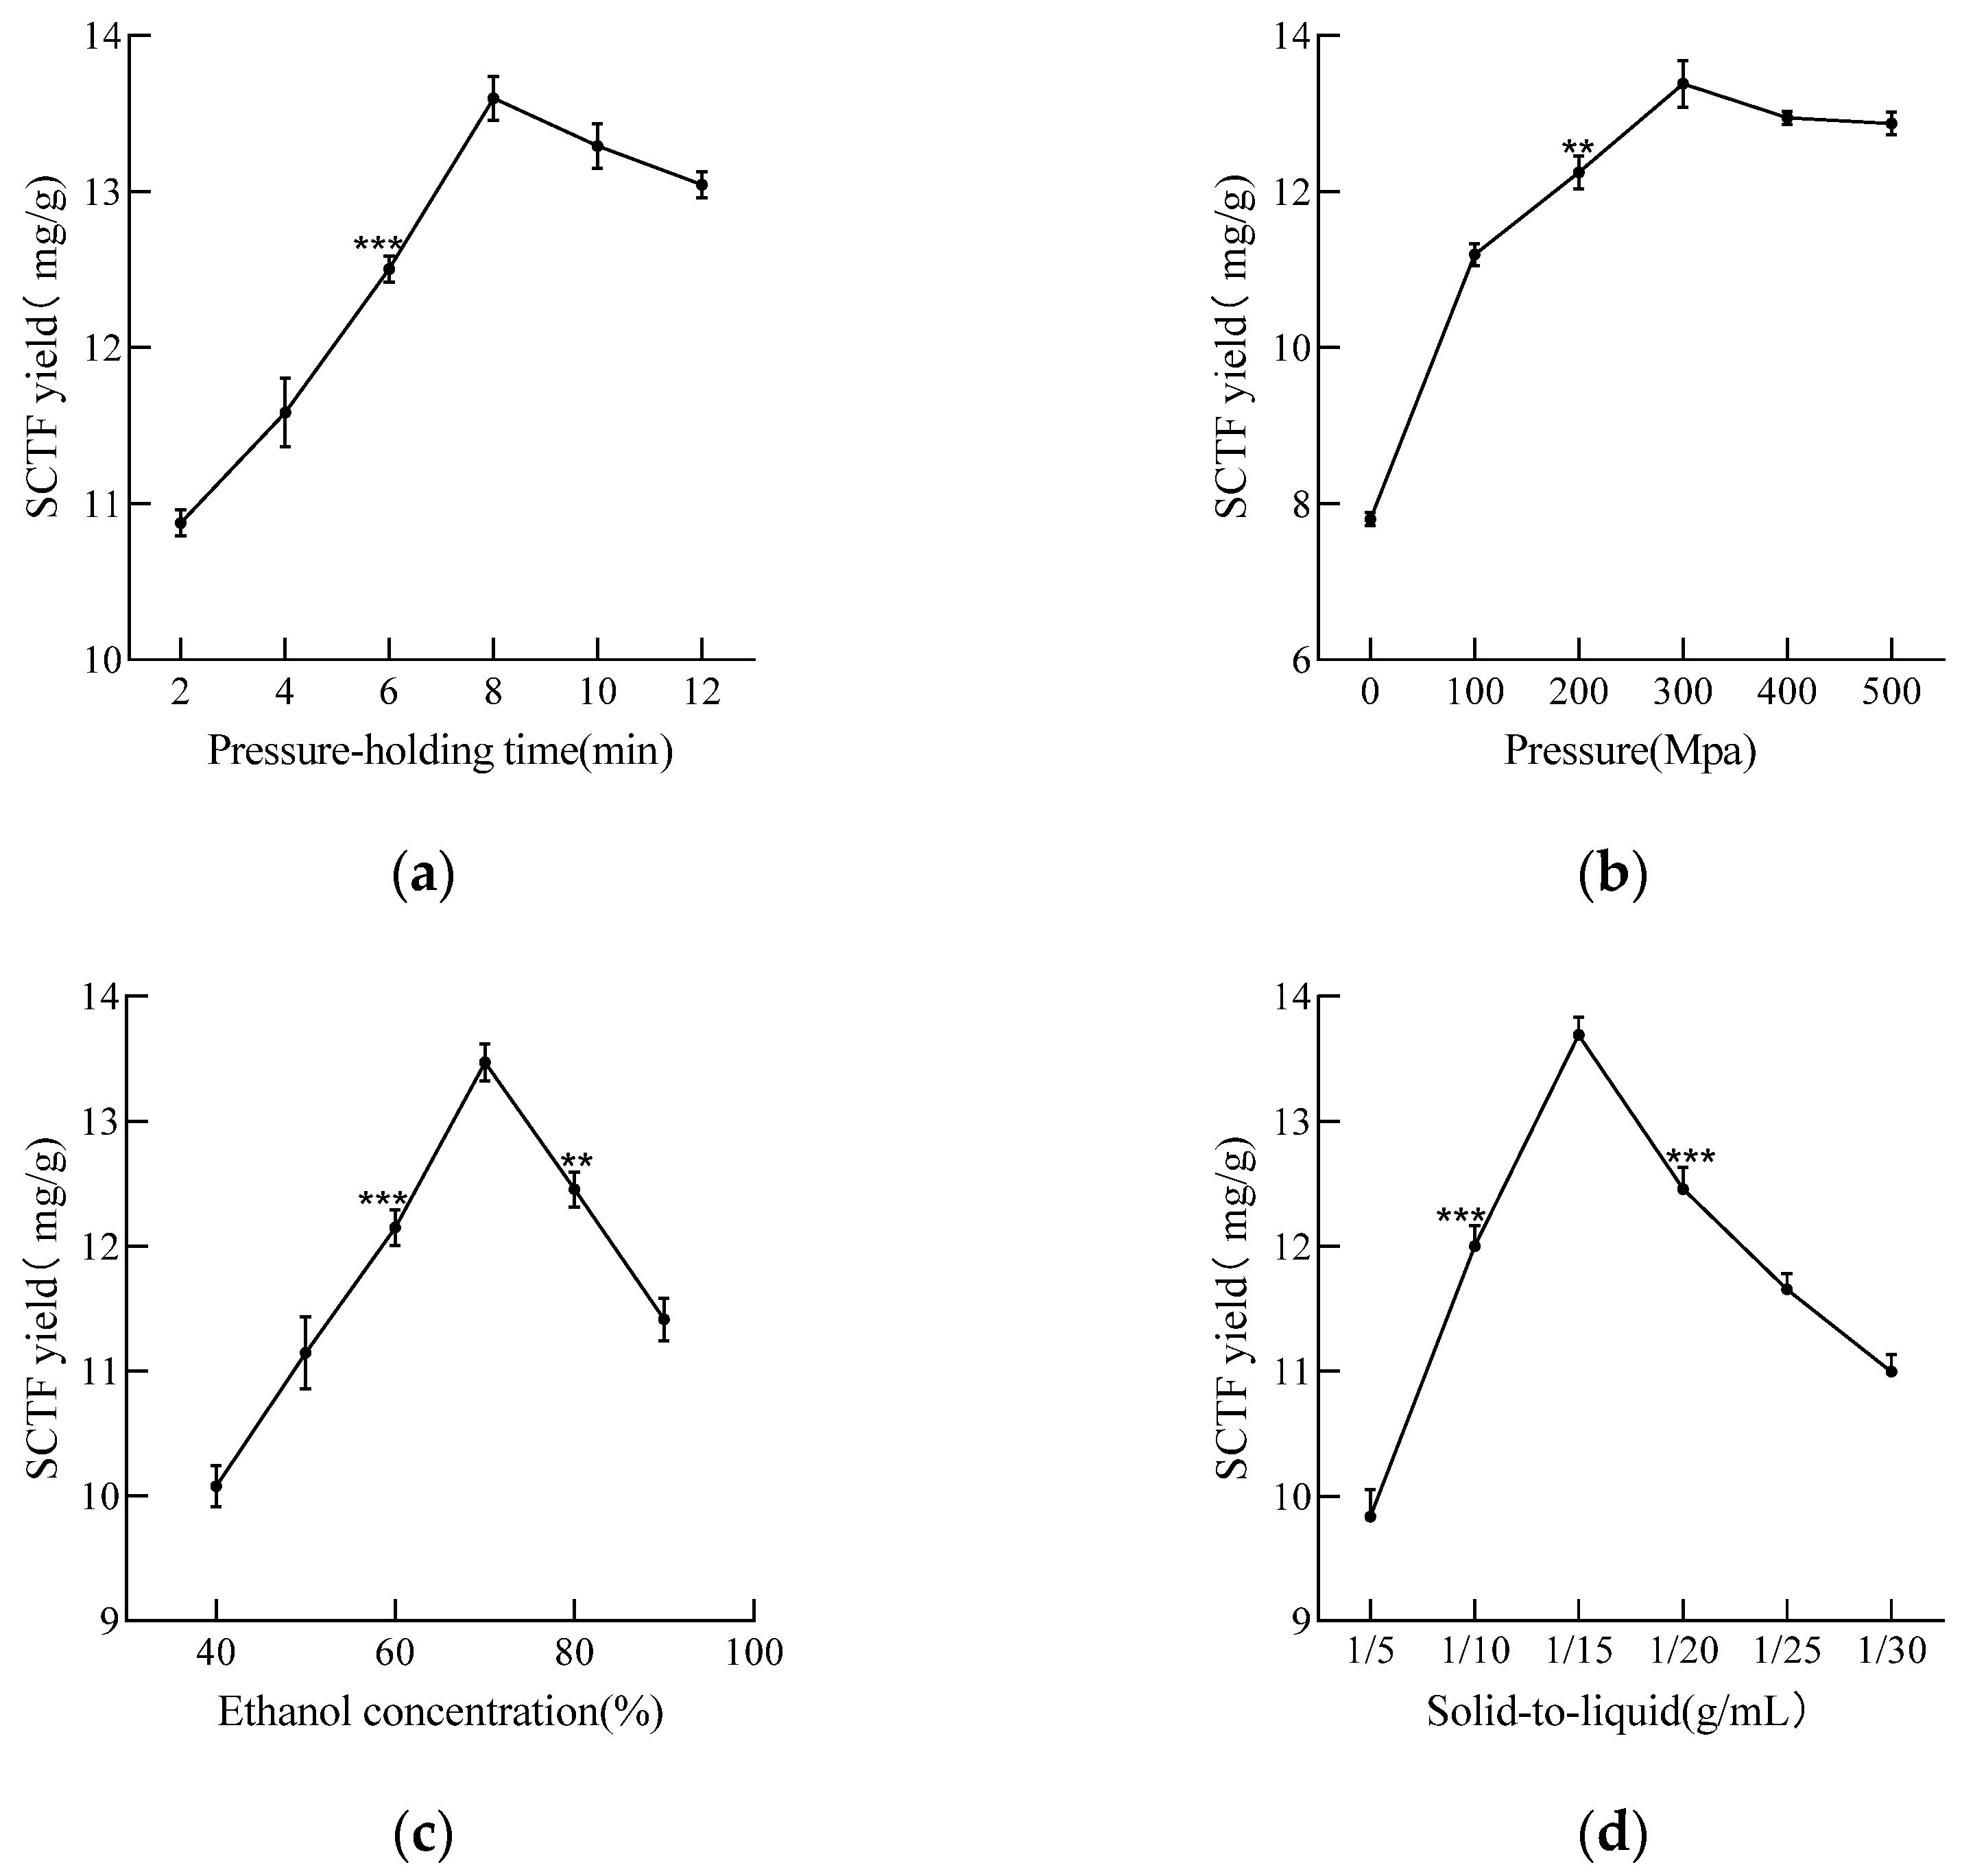
Figure 1. Effects of various single factors on the extraction yield of SCTF. (a) Pressure holding time, (b) Pressure, (c) Ethanol concentration, (d) Solid-to-liquid ratio. *** indicates an extremely significant difference (p < 0.01) between the SCTF extraction yield under this condition and the highest extraction yield; ** indicates a significant difference (p < 0.05) between the SCTF extraction yield under this condition and the highest extraction yield.
Separations 13 00114 g001
Figure 2. Response surface plots for the interactive effects of two factors on the SCTF extraction yield. (a) 3D plot of holding pressure time and pressure; (b) 2D contour plot of holding pressure time and pressure; (c) 3D plot of ethanol concentration and holding pressure time; (d) 2D contour plot of ethanol concentration and holding pressure time; (e) 3D plot of solid-to-liquid ratio and holding pressure time; (f) 2D contour plot of solid-to-liquid ratio and holding pressure time; (g) 3D plot of pressure and ethanol concentration; (h) 2D contour plot of pressure and ethanol concentration; (i) 3D plot of solid-to-liquid ratio and pressure; (j) 2D contour plot of solid-to-liquid ratio and pressure; (k) 3D plot of ethanol concentration and solid-to-liquid ratio; (l) 2D contour plot of ethanol concentration and solid-to-liquid ratio. In each 3D and 2D plot, the height of the surface (z-axis) and its corresponding color represent the predicted flavonoid yield (%). The color gradient ranges from red at the peak (highest yield), through yellow and green on the slopes (medium yield), to blue in the low regions (lowest yield).
Separations 13 00114 g002
Figure 3. SEM images of sunflower disc residues before and after UHPE. (a) Untreated; (b) Treated with UHPE.
Separations 13 00114 g003
Figure 4. UPLC-QTOF-MS/MS mass spectrum of SCF. (a) Positive; (b) Negative.
Separations 13 00114 g004
Figure 5. In vitro antioxidant activity. (a) Trend chart of DPPH radical scavenging activity. (b) Trend chart of hydroxyl radical scavenging activity. (c) Trend chart of ferric ion reducing antioxidant power (FRAP). (d) Trend chart of total reducing power.
Separations 13 00114 g005
Figure 6. Inhibition of XOD activity by different samples. (a) Positive control: Allopurinol. (b) Test samples: SCF, SCTF.
Separations 13 00114 g006
Table 1. Factors and levels of response surface test.
CodeFactor
(A) Pressure-Holding Time(min)(B)
Pressure (MPa)
(C)
Ethanol Concentration (%)
(D) Solid-to-Liquid (g/mL)
−16200601/10
08300701/15
110400801/20
Table 2. Experimental design and results of the Response Surface Analysis.
Number(A)
Pressure-Holding Time (min)
(B)
Pressure
(MPa)
(C)
Ethanol Concentration (%)
(D)
Solid-to-Liquid (g/mL)
SCTF Extraction Yield (mg/g)
1010−17.45
201109.88
3−1−10011.26
400−119.01
5000013.86
6001110.60
700−1−16.86
8−10109.77
9−11009.78
100−1−107.98
110−1109.58
12−10−107.64
130−10110.23
14001−19.71
15−100−19.05
16100−110.99
171−10010.18
18100111.92
1910−109.28
200−10−111.90
21101010.06
22110012.21
23000014.17
24000013.81
2501−108.17
26010112.35
27−100111.38
Table 3. Analysis of Variance for the response surface experiments.
SourceSum of SquaresdfMean SquareF-Valuep-ValueSignificance
Model98.18147.01185.15<0.0001**
A3.3213.3287.54<0.0001**
B2.3112.3161.01<0.0001*
C9.9519.95262.62<0.0001**
D7.5917.59200.42<0.0001**
AB3.0813.0881.33<0.0001*
AC0.454410.454412.000.0047*
AD0.580310.580315.320.0021*
BC0.003910.00390.10410.7525
BD12.08112.08318.92<0.0001**
CD0.567310.567314.980.0022*
A210.74110.74283.62<0.0001**
B216.11116.11425.47<0.0001**
C257.80157.801526.02<0.0001**
D210.34110.34273.07<0.0001**
Residual0.4545120.0379
Lack of Fit0.3759100.03760.95700.6128
Pure Error0.078620.0393
CorTotal98.6326
R2 = 0.9954R2adj = 0.9900R S/N = 30.1695
Note: ** represents significant differences at p < 0.01; * represents significant differences at p < 0.05.
Table 4. Identification of components in SCF by negative ionization.
RTMassAbundNameFormulaTgt MassDiff (ppm)DB Diff (ppm)Score (Tgt)
18.706463.122724,856Malvidin-3-arabinosideC22H23O11463.1240−2.902.9096.45
19.599478.14696097AbrusinC23H26O11478.1475−1.201.2092.64
20.263494.104919,2505,7,3′,4′-Tetrahydroxy-8-
methoxyflavonol-3-O-beta-Dgalactoside
C22H22O13494.1060−2.402.4093.31
20.853432.106012,1693,4′,5,7-Tetrahydroxyflavone-3-LrhamnosideC21H20O10432.10570.70−0.7092.63
22.745330.073818,3163,3′-DimethylquercetinC17H14O7330.0740−0.540.5490.40
23.009272.068265,8002′,3,4,4′-TetrahydrochalconeC15H12O5272.0685−0.990.9996.12
24.092284.0685125,4803′-MethoxydaidzeinC16H12O5284.06850.16−0.1698.87
24.583286.047013,5235,7,2′,3′-TetrahydroxyflavoneC15H10O6286.0477−2.632.6395.89
24.683316.057485583-Methoxy quercetinC16H12O7316.0583−2.812.8191.25
24.938346.068419,5075,6,3′,4′-Tetrahydroxy-3,7-
dimethoxyflavone
C17H14O8346.0689−1.211.2195.40
24.959316.057424,4423-Methoxy quercetinC16H12O7316.0583−2.932.9397.03
26.262452.13193297(+)-Catechin-5-O-glucosideC21H24O11452.13190.16−0.1694.09
26.593330.0739161,2363,3′-DimethylquercetinC17H14O7330.0740−0.300.3099.24
26.861256.0736183,2482,4,4′-TrihydroxychalconeC15H12O4256.07360.07−0.0799.05
26.955360.0843112,1953,5,3′-Trihydroxy-6,7,4′-trimethoxymflavoneC18H16O8360.0845−0.550.5599.33
27.788332.088738,555(2R,3S)-(+)-3′,5-Dihydroxy-4-7-
dimethoxydihydroflavonol
C17H16O7332.0896−2.752.7591.99
28.459344.088621,6863′,4′-DihydroxywogoninC18H16O7344.0896−2.892.8093.12
28.531328.093835,6381,3,5,6-Tetrahydroxy-4-
phenylxanthone
C18H16O6328.0947−2.842.8493.04
28.697268.072997657-Methoxy-4′-hydroxyflavoneC16H12O4268.0736−2.492.4995.04
30.367374.0997390,8773,5-Dihydroxy-6,7,3′,4′-
Tetramethoxyflavone
C19H18O8374.1002−1.271.2797.21
Table 5. Identification of components in SCF by positive ionization.
RTMassAbundNameFormulaTgt MassDiff (ppm)DB Diff (ppm)Score (Tgt)
3.851322.068111,955LeucodelphinidinC15H14O8322.0689−2.412.4197.33
4.553376.079529,4045,2′,5′-Trihydroxy-6,7,8-
trimethoxyflavone
C18H16O9376.07940.31−0.3196.77
6.065464.094739536-Hydroxykaempferol-7-
7-Oglucoside
C21H20O12464.0955−1.711.7191.65
7.549530.17992262Icariside IC27H30O11530.17882.10−2.1092.80
20.001514.1848132,186Baohuoside IC27H30O10514.18391.83−1.8396.69
20.365517.098934,3565-carboxypyranocyanidin 3-O-betaglucopyranosideC24H21O13517.09821.25−1.2596.32
20.471430.125658994′-MethoxypuerarinC22H22O9430.1264−1.901.9092.56
20.488287.054333,051CyanidinC15H11O6287.0556−4.334.3390.25
20.489286.046533,0515,7,2′,3′-TetrahydroxyflavoneC15H10O6286.0477−4.374.3790.25
29.096556.10224536MorelloflavoneC30H20O11556.10062.90−2.9092.04
32.058336.0996247,063GlabroneC20H16O5336.0998−0.550.5096.04
33.624318.073331311,6-Dihydroxy-3,5,7-
trimethoxyxanthone
C16H14O7318.0740−2.042.0493.45
Table 6. Parameters for the in vitro inhibition of XOD activity (p < 0.05).
SampleLinear EquationR2IC50 (mg/mL)
Allopurinoly = 2.88x + 29.270.99027.21 ± 1.33 (μg/mL)
SCTFy = 5.39x − 5.110.994810.23 ± 0.63
SCFy = 4.31x − 18.140.99027.39 ± 0.53
Disclaimer/Publisher’s Note: The statements, opinions and data contained in all publications are solely those of the individual author(s) and contributor(s) and not of MDPI and/or the editor(s). MDPI and/or the editor(s) disclaim responsibility for any injury to people or property resulting from any ideas, methods, instructions or products referred to in the content.