Article

Recovery of Phenolic Compounds and Proteins from Spent Coffee Grounds Using Eutectic Solvents

by
Cristiane Nunes da Silva
,
Camilla Ribeiro Ferreira
,
Bernardo Dias Ribeiro
and
Filipe Smith Buarque
*
School of Chemistry, Federal University of Rio de Janeiro, Rio de Janeiro 21941-853, Brazil
*
Author to whom correspondence should be addressed.
Separations 2026, 13(4), 106; https://doi.org/10.3390/separations13040106
Submission received: 4 March 2026 / Revised: 25 March 2026 / Accepted: 26 March 2026 / Published: 28 March 2026

Abstract

Spent coffee grounds (SCGs) are an abundant agro-industrial residue with high potential as a source of phenolic compounds and proteins. This study evaluated the extraction of these value-added fractions using hydrophilic and hydrophobic eutectic solvents, applied either alone or combined with enzyme-assisted extraction. A total of 31 hydrophobic eutectic solvents (HESs), nine hydrophilic deep eutectic solvents (DESs), and five conventional solvents were screened for phenolic recovery. Extraction performance was strongly formulation-dependent, with hydrophobic systems showing the highest phenolic yields. HES 4 (camphor:oleic acid) was the best-performing solvent, reaching 1279.49 ± 2.31 mg GAE L−1, followed by borneol:oleic acid (1133.92 ± 5.29 mg GAE L−1). Enzyme addition did not enhance phenolic extraction; the highest values under enzymatic conditions were 896.12 ± 4.80 mg GAE L−1 for HES 4 + Cellic® CTec2 and 819.84 ± 2.66 mg GAE L−1 for HES 4 + Viscozyme®. In contrast, protein extraction increased remarkably with enzyme supplementation, particularly with Cellic® CTec2. The highest protein recovery was obtained with HES 4 + Cellic® CTec2 (1608.74 ± 3.32 mg·L−1), compared with 506.37 ± 5.20 mg·L−1 for neat HES 4. In general, neat HESs were more suitable for phenolic recovery, whereas HESs combined with Cellic® CTec2 were more effective for protein extraction.

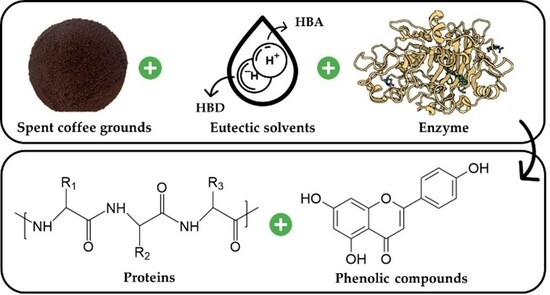
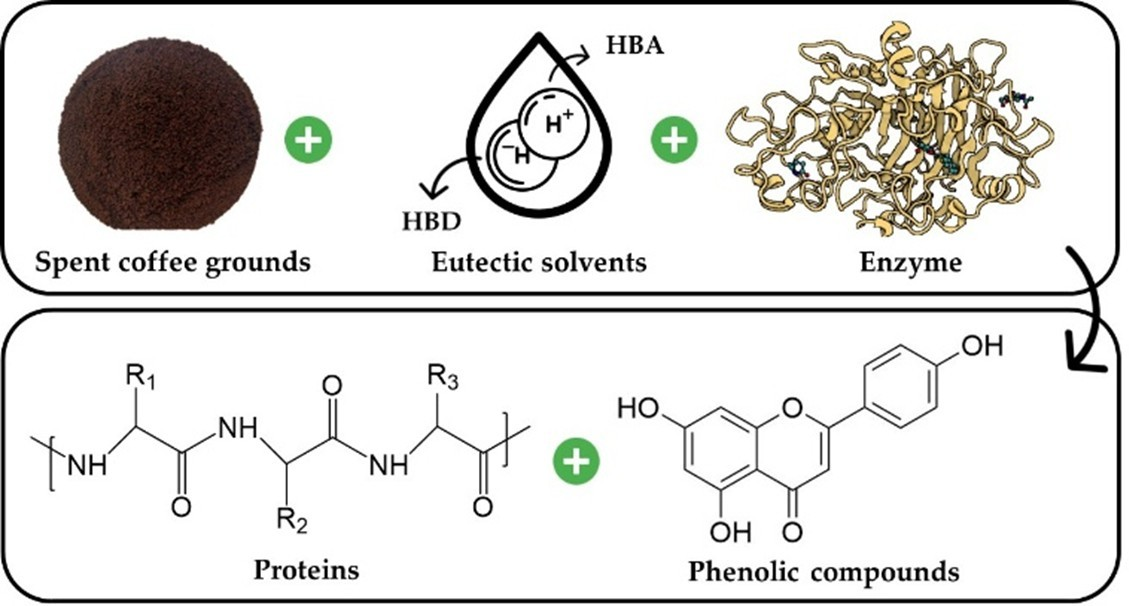
Graphical Abstract

1. Introduction

Coffee is one of the most important agricultural commodities in international trade and plays a strategic role in the economic, social, and environmental dimensions of the global agri-food chain [1]. Global coffee production for the 2025/2026 crop season is estimated at approximately 178.8 million 60 kg bags, emphasizing the continuing worldwide relevance of this commodity [2]. Brazil remains the world’s largest coffee producer and exporter, with an estimated production of 66.2 million 60 kg bags in the 2026 crop season, corresponding to nearly 30% of global production [3]. At the same time, coffee consumption has increased steadily due to product diversification, improvements in beverage quality, and changes in consumer habits, further intensifying the generation of residues throughout the coffee production and consumption chain [4,5].
Among the residues generated by this sector, spent coffee grounds (SCGs) represent one of the most abundant and relevant by-products. SCGs are generated in large quantities during instant coffee production and coffee beverage preparation in industrial, commercial, and domestic settings, with global generation estimated at approximately 7 million tons per year [6]. These residues are often underutilized and improperly disposed of, which may contribute to environmental problems such as soil and water contamination due to the presence of compounds including caffeine and phenolics [7,8]. Therefore, the valorization of SCGs has been attracting increasing scientific and industrial interest, mainly due to the fact that this waste is an abundant and low-cost raw material for the recovery of high value-added compounds.
SCGs are a promising source of both proteins and phenolic compounds. Their protein content typically ranges from 10 to 17% on a dry basis, depending on coffee species, roasting conditions, and the brewing method [9]. These proteins are of considerable technological interest, as they may exhibit functional properties relevant to food applications, such as emulsifying capacity, water-holding ability, and foaming behavior [10]. Furthermore, SCG proteins can be converted into hydrolysates that are capable of generating bioactive peptides with antioxidant, antihypertensive, and angiotensin-converting enzyme inhibitory activities [11]. SCGs also contain significant amounts of phenolic compounds, particularly chlorogenic acids, as well as other phenolic acids and flavonoids, including caffeic, ferulic, gallic, and p-coumaric acids; rutin; quercetin; catechin; and epicatechin [12,13]. These compounds are widely recognized for their biological relevance and have been associated with antioxidant, antimicrobial, anti-inflammatory, anticancer, antiallergic, and antiglycation activities [14,15,16,17]. The simultaneous presence of these two valuable fractions makes SCGs an attractive matrix for integrated extraction and biorefinery-oriented valorization.
In this context, eutectic solvents (ESs) have emerged as promising alternative extraction media due to their tunable physicochemical properties and broad compositional flexibility. However, their environmental suitability depends on the toxicity and biodegradability of their components. These solvents are formed by combining hydrogen bond acceptors (HBAs) and hydrogen bond donors (HBDs), generating liquid systems with tailored polarity, hydrogen-bonding capacity, and solvation behavior [18]. Depending on their composition, eutectic solvents may be classified as hydrophilic or hydrophobic. Hydrophilic deep eutectic solvents (DESs) are generally based on components such as choline chloride, sugars, organic acids, and polyols and are characterized by high polarity and a strong affinity for water [19,20]. In contrast, hydrophobic eutectic solvents (HESs) are typically composed of terpenes, fatty acids, and fatty alcohols, exhibiting lower polarity and limited water affinity [21,22]. Due to their easy preparation, compositional versatility, high stability, and potential for reduced environmental impact, eutectic solvents have become increasingly relevant for the selective extraction of bioactive compounds from plant-derived matrices and agro-industrial residues [23,24].
Previous studies have demonstrated the potential of DESs for the recovery of phenolic compounds from plant materials, including coffee-derived residues, either as standalone extraction media or in combination with complementary extraction strategies [25,26]. However, the integration of eutectic solvents with enzyme-assisted extraction remains insufficiently explored, particularly for the simultaneous recovery of phenolics and proteins from SCGs. This gap is relevant since solvent composition can directly influence enzyme activity, stability, and compatibility with the extraction medium. Depending on the eutectic formulation, the extraction environment may either preserve or impair enzymatic performance, making solvent–enzyme compatibility a critical parameter in integrated extraction systems [27].
Enzyme-assisted extraction is based on the use of hydrolytic enzymes to degrade structural polysaccharides and cleave glycosidic linkages in the cell wall matrix, thereby promoting cell disintegration and increasing the accessibility of intracellular or matrix-associated compounds to the extraction medium [28,29]. This approach can operate under relatively mild conditions while facilitating matrix disruption and potentially improving the release of target compounds. In addition, enzymatic hydrolysis may modify the composition and bioactivity of the extracts by converting high-molecular-weight structures into lower-molecular-weight compounds [30].
Therefore, the aim of this study was to recover phenolic compounds and proteins from spent coffee grounds using eutectic solvents applied either alone or in combination with enzyme-assisted extraction. This study also aimed to evaluate the extraction behavior of different DES- and HES-based systems, as well as the effect of adding enzymes on the recovery of these two high value-added fractions.

2. Materials and Methods

2.1. Materials and Reagents

Spent coffee grounds (SCGs) were collected from commercial establishments in Rio de Janeiro (RJ), Brazil. To reduce the moisture content, the SCGs were subjected to a drying process in a ventilation oven (FTT 150 G, Tedesco, Caxias do Sul, RJ, Brazil) at 50 °C until they reached a water content of 6%. Afterwards, the samples were standardized to ≤0.465 mm in particle size. The samples were packaged in polyethylene and stored in the dark until analysis.
The reagents used in this experiment were choline chloride (ChCl, ≥99%), betaine (Bet, ≥98%), proline (Pro, ≥99%), 1,2 propanediol (PDO, ≥99%), ethylene glycol (EG, ≥99.9%), glycerol (Gly, ≥98%), camphor (C, ≥96%), borneol (B, ≥97%), octanoic acid (C8, ≥99%), decanoic acid (C10, ≥98%), dodecanoic acid (C12, ≥98%), oleic acid (C18, ≥90%), 1-octanol (C8OH, ≥99%), 1-decanol (C10OH, ≥98%), 1-dodecanol (C12OH, ≥98%), oleyl alcohol (C18OH, ≥85%), Trioctylphosphine oxide (TOPO, ≥99%), DL-menthol (Ment, ≥99%), Folin-Ciocalteau (≥99%), gallic acid (≥99%), hexane (≥99%) and limonene (≥99%) and were acquired from Sigma (St. Louis, MO, USA). Sodium carbonate (≥99.5%) and the Coomassie Blue dye (Brilliant Blue G-250) were purchased from Vetec (Barueri, SP, Brazil). Cellic® CTec2 and Viscozyme® were purchased from Novozymes (Copenhagen, Denmark).

2.2. Preparation of Eutectic Solvents

The ESs and their respective molar ratios used in this study were simulated using the BIOVIA COSMOThermX 24 software (Dassault Systèmes, Paris, France, 2024). COSMO-RS simulations were employed as a predictive tool to assess the compatibility between the selected HBA and HBD components and to guide the identification of compositions more likely to form eutectic-like liquids based on favorable intermolecular interactions.
Hydrophilic and hydrophobic eutectic solvents were prepared according to the methodologies reported by Abbott et al. [31] and Ribeiro et al. [32], respectively. The HBA and HBD components were accurately weighed according to the molar ratios presented in Table 1 and Table 2 and mixed in a ThermoMixer (ThermoMixer C, Eppendorf, Sumarezinho, São Paulo, SP, Brazil) at 80 °C under constant stirring (1000 rpm). In general, camphor-based HESs were formed within shorter time intervals, typically between 30 min and 1 h, whereas borneol-based eutectics often required slightly longer times, usually between 2 and 3 h, depending on the structure of the hydrogen bond donor and the molar ratio. Therefore, the preparation time was dependent on the specific HBA/HBD combination and molar ratio of each system. No water was added during solvent formation. Then, the solvents were stored at room temperature (25 °C). A total of 40 eutectic solvents were prepared, including nine hydrophilic and thirty-one hydrophobic systems. The components and their respective molar ratios used to prepare the eutectic solvents are shown in Table 1 and Table 2.

2.3. Extraction of Phenolic Compounds from SCGs

For the extraction of phenolic compounds and proteins, 1000 mg of the ES was added to 100 mg of the sample. The HES or DES used consisted of a mixture of 700 mg of solvent and 300 mg of distilled water. The extraction step was performed in a ThermoMixer (ThermoMixer C, Eppendorf, Sumarezinho, São Paulo, SP, Brazil) with agitation at 800 rpm and a temperature of 50 °C for 120 min. After extraction, the samples were centrifuged (Centrifuge 5804 R, Eppendorf, Sumarezinho, São Paulo, SP, Brazil) at 4 °C and 10,000 rpm for 15 min. The supernatant was placed in an amber glass bottle and stored at −10 °C, protecting it from light. The samples were also extracted using conventional solvents (water, hexane, soybean oil, limonene, and terebinth) by adding 1000 mg of the solvents to 100 mg of the samples. The other extraction process conditions were the same as those used for extraction with the ES.

2.4. Extraction of Phenolic Compounds and Proteins Using ESs and Enzymes

The phenolic compounds and proteins of the SCGs were extracted by combining eutectic solvents and enzymes. The extraction process was carried out by weighing 100 mg of the sample and adding 700 mg of the solvent, followed by the addition of 300 mg of distilled water. Then, 1% (v/v) of the enzyme (Cellic® CTec or Viscozyme®) was added separately to independent extraction systems [32]. Subsequently, the samples were placed in a ThermoMixer (ThermoMixer C, Eppendorf, Sumarezinho, São Paulo, SP, Brazil), and extraction was carried out for 120 min at 50 °C with agitation at 800 rpm. Immediately afterwards, the samples were centrifuged at 10,000 rpm for 15 min (Centrifuge 5804 R, Eppendorf, Sumarezinho, São Paulo, SP, Brazil), and the supernatant was separated and stored in amber glass bottles at −10 °C while being protected from light until subsequent analyses.

2.5. Determination of Total Phenolic Compounds

The total content of phenolic compounds was determined by the Folin–Ciocalteu spectrophotometric method, with some modifications [33]. Briefly, 10 mL of the diluted extract was mixed with 200 μL of the Folin–Ciocalteu solution (10% v/v). After 3 min of reaction, 100 μL of the sodium carbonate solution (20% w/v) was added. The mixture was homogenized and then analyzed on a spectrophotometer (Spectramax M2, San Jose, CA, USA) at 765 nm. The results were expressed in milligrams of gallic acid equivalent per liter (mg GAE L−1). The calibration curve was determined with gallic acid at a concentration range of 0 to 750 mg·L−1.

2.6. Determination of Total Proteins

The total protein content in the SCG extracts was determined according to the Bradford method, with some modifications [34]. Analyses were performed in 96-well microplates using 190 µL of the previously prepared Bradford reagent and 10 µL of the SCG extract. After 5 min, absorbance was measured at 595 nm using a spectrophotometer (Spectramax M2, San Jose, CA, USA). Quantification was performed using a standard curve constructed from a standard solution with 0 to 800 μL of bovine serum albumin (BSA). Results were expressed in milligrams of protein per liter (mg·protein L−1).

2.7. Determination of Enzymatic Activity

The enzymatic activity of Cellitec and Viscozyme was assessed by determining the activity of total cellulase, xylanase, endoglucanase, and cellobiohydrolase. Total cellulase activity was determined by the filter paper assay (FPA) according to the methodology proposed by Adney and Baker [35]. The concentration of released glucose was determined by spectrophotometry at 540 nm (Spectramax M2San Jose, CA, USA). A unit of enzymatic activity was defined as the amount of enzyme capable of releasing 2.0 mg of glucose per min, with the results expressed in filter paper units per liter (FPU·L−1). Xylanase activity was determined according to the method described by Bailey et al. [36], with adaptations. The released xylose was quantified by spectrophotometric reading at 540 nm. A unit of xylanase activity (U·mL−1) was defined as the amount of enzyme required to release 1 µmol of xylose per minute.
Endoglucanase (EG) activity was evaluated using carboxymethylcellulose (CMC) as the substrate, according to the methodology proposed by Ghose [37]. The reaction was stopped by the addition of the DNS reagent, and the released glucose was quantified by spectrophotometry at 540 nm. One unit of endoglucanase activity (U·mL−1) was defined as the amount of enzyme capable of releasing 1 µmol of glucose per minute. Cellobiohydrolase activity was determined using Avicel as the substrate, and the released glucose was quantified by high-performance liquid chromatography (HPLC Shimadzu, model LC 2030, with detector RID, Shimadzu, Kyoto, Japan). One cellobiohydrolase activity unit (U·mL−1) was defined as the amount of enzyme capable of releasing 0.5 mg of glucose per minute.

2.8. Statistical Analysis

All experiments were performed in triplicate, and the results are expressed as means ± standard deviations. Statistical differences among the evaluated conditions were determined by one-way analysis of variance (ANOVA), followed by Tukey’s post hoc test, adopting p ≤ 0.05 as the significance criterion. Different lowercase letters in tables and figures indicate statistically significant differences among means. Statistical analyses were carried out using Statistica software (version 8.0, StatSoft, Tulsa, OK, USA).

3. Results

3.1. ES Characterization

FTIR, TGA, and DSC analyses consistently supported the formation of hydrophobic eutectic systems and highlighted the strong influence of the HBA/HBD structure on their physicochemical behavior. In the FTIR spectra (Figure S1), camphor displayed the characteristic ketone C=O stretching band at 1737 cm−1, whereas borneol showed the broad O–H stretching band around 3300 cm−1; the fatty acids and fatty alcohols also exhibited the expected carbonyl, hydroxyl, and aliphatic C–H bands. After HES formation, the relevant O–H, C=O, and C–O absorption regions became broadened and shifted relative to the pure constituents, indicating changes in the local chemical environment that are consistent with intermolecular association between the components. The FTIR spectra presented in Figure S1 provide a more detailed molecular-level comparison between the pure constituents and the corresponding hydrophobic eutectic systems. Panels a–c show the characteristic absorption bands of the individual HBAs and HBDs, including the ketone C=O stretching of camphor, the broad O–H band of borneol, and the expected hydroxyl, carbonyl, and aliphatic C–H signals of the fatty acids and fatty alcohols. After HES formation, as shown in panels d–g, these bands became broadened and/or shifted, particularly in the O–H, C=O, and C–O regions, indicating changes in the intermolecular environment of the components. Such spectral modifications are consistent with the establishment of hydrogen-bond-mediated association and other non-covalent interactions within the eutectic phase, reinforcing that the obtained liquids are not simple physical mixtures but organized solvent systems with distinct molecular interactions. These spectral modifications are compatible with the establishment of hydrogen-bonding and other non-covalent interactions within the eutectic phase, rather than a simple physical blending of the starting molecules. In this sense, the FTIR data reinforce that the liquid systems obtained from camphor- or borneol-based HBAs combined with fatty acids or fatty alcohols possessed the expected interaction pattern for HES formation.
Thermal analyses further confirmed that these systems exhibited physicochemical properties distinct from those of their isolated constituents. In Figure S2, TGA showed only minor initial mass losses below about 96–110 °C, generally below 2.3%, which were attributed to adsorbed moisture and weakly bound volatiles, whereas the main degradation events occurred at higher temperatures and varied according to the HES composition. Systems containing dodecanoic acid or oleic acid were more thermally stable than those prepared with shorter-chain donors, and borneol:oleic acid was particularly resistant, with its main degradation step occurring above 240 °C, suggesting stronger molecular packing and lower volatility. The thermogravimetric profiles shown in Figure S2 complement the discussion of solvent formation by providing a broader comparison of the thermal stability of the pure constituents and the corresponding HES combination. In general, the HES exhibited only minor initial mass losses at relatively low temperatures, attributed to traces of weakly bound volatile species, followed by the main degradation events at higher temperatures. The curves also reveal that thermal resistance depended strongly on solvent composition, with systems containing longer alkyl chains, particularly dodecanoic acid and oleic acid, tending to display greater stability than those prepared with shorter-chain donors. Among the evaluated systems, borneol:oleic acid stood out as particularly stable, suggesting stronger intermolecular organization and reduced volatility. Therefore, the TGA results further support that HES formation produced liquid systems with physicochemical behavior distinct from that of their isolated components while also showing that the structure of the HBD plays a central role in defining solvent thermal stability.
DSC results complemented this interpretation by revealing a marked depression in melting point for the HES relative to the pure HBA and HBD components, which is a typical signature of eutectic behavior arising from negative deviations from ideality (Figure S3). The increase in alkyl chain length from C8 to C12 progressively raised melting temperatures, whereas oleic acid- and oleyl alcohol-based systems deviated from this trend because double-bond-induced chain curvature hindered crystalline packing and lowered the melting point despite the longer C18 backbone. Altogether, these results show that solvent structure, chain length, and degree of unsaturation directly modulated molecular organization, thermal stability, and phase-transition behavior, all of which are relevant to the subsequent extraction performance of the HES. The DSC profiles shown in Figure S3 provide a more detailed view of the thermal transitions of both the pure constituents and the corresponding HES formulations, reinforcing the eutectic nature of the prepared systems. Panels a–j show the thermograms of the individual HBAs and HBDs, whereas panels k–z correspond to HESs 1–16, thus allowing a direct comparison between the starting materials and the liquids formed after mixing. In general, the HES thermograms showed that thermal events shifted to lower temperatures relative to the pure compounds, consistent with melting-point depression caused by the establishment of intermolecular interactions and the disruption of the original crystalline organization of the isolated components. This behavior was particularly evident for the systems based on camphor or borneol combined with fatty acids and fatty alcohols, whose eutectic formulations showed thermal transitions distinct from those of the parent compounds. In addition, the DSC curves reveal that chain length and unsaturation of the HBD affected the phase-transition behavior of the resulting HES, with longer saturated alkyl chains tending to increase the melting temperature, while unsaturated C18-based systems displayed lower transition temperatures due to less efficient molecular packing. Thus, the DSC analysis corroborates the HES formation and shows that the structural variations among the constituents modulate the thermal organization and physical behavior of the solvents used in the extraction process.

3.2. Screening of HESs for Extraction of Total Phenolic Compounds

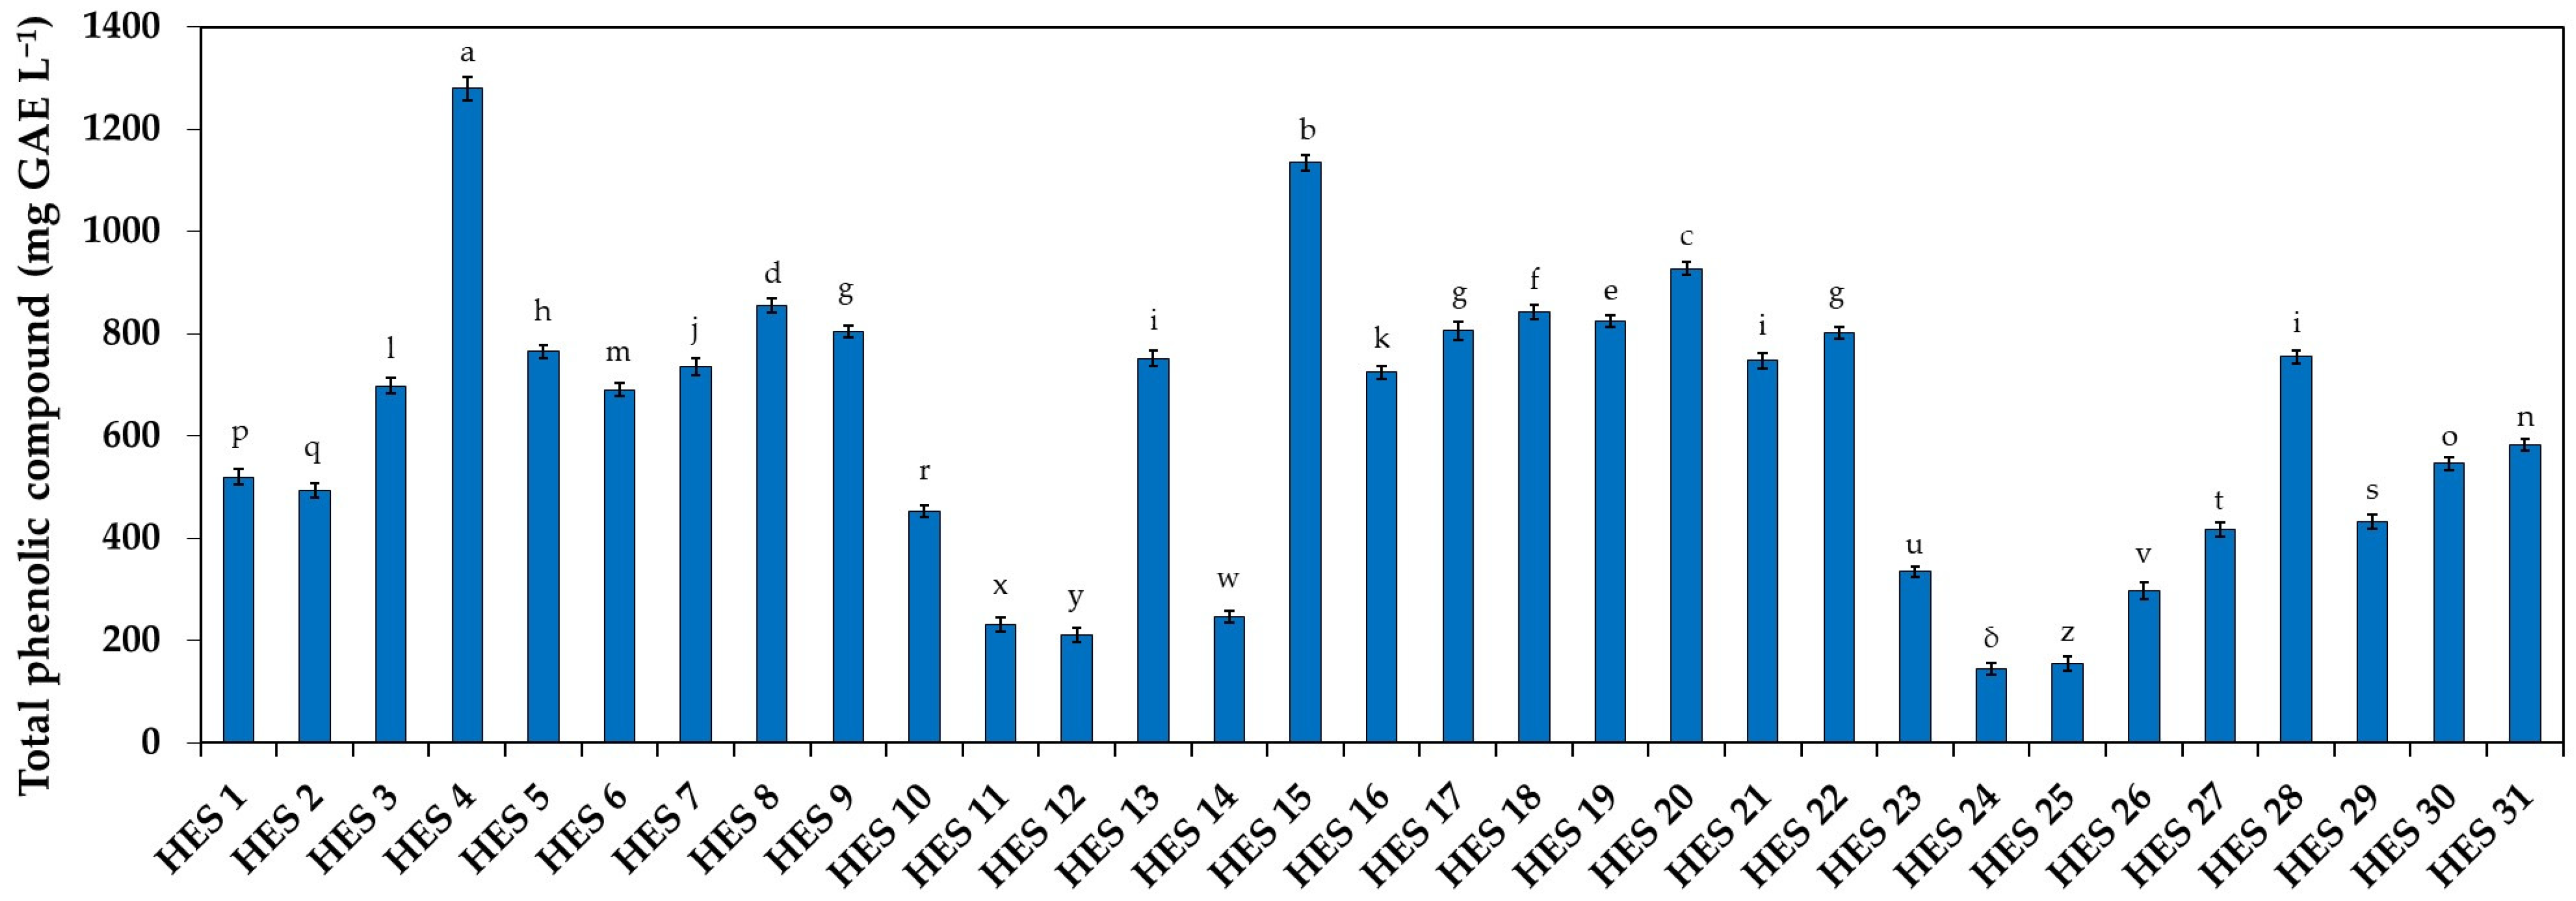
Figure 1 shows the screening of 31 HES formulations (HES 1–HES 31) prepared for the extraction of phenolic compounds from coffee grounds. The set includes camphor-based systems (HESs 1–11), borneol-based systems (HESs 12–22), DL–menthol-based systems (HESs 23–25), fatty acid–fatty acid systems (HESs 26–28), and TOPO-based systems (HESs 29–31), thus providing a chemically diverse and structurally organized matrix for structure and performance analyses. Table 1 defines the compositional structure of the HES screening used and is therefore the necessary basis for interpreting Figure 1. This wide variety of solvent classes allows for a systematic comparison of the effects of each HBA type, HBD functional group, alkyl chain length, unsaturation degree, and HBA:HBD molar ratio in a single screening dataset. It should be noted that the Folin–Ciocalteu assay is not fully specific to phenolic compounds, as it reflects the overall reducing capacity of the sample. Therefore, the corresponding pure HES systems were separately analyzed in order to estimate their intrinsic contribution to the response, thereby allowing a more reliable interpretation of the fraction associated with the extracted phenolic compounds.
Figure 1 shows a broad dispersion in total phenolic compound extracted among the investigated hydrophobic eutectic solvents, indicating that phenolic recovery from spent coffee grounds is highly sensitive to the HES composition. The observed variation is not consistent with a uniform solvent-class effect; instead, it demonstrates that extraction performance depends on the specific combination of hydrogen-bond acceptors and hydrogen-bond donors, as well as on their relative proportion in the eutectic phase [38]. This behavior is expected for multicomponent extraction media, in which solute partitioning is governed by the coupled effects of intermolecular interactions, local solvent organization, and transport properties rather than by bulk hydrophobicity alone [39].
The camphor and borneol series each include both fatty acids (octanoic, decanoic, dodecanoic, and oleic acids) and fatty alcohols (1-octanol, 1-decanol, 1-dodecanol, and oleic alcohol), enabling a direct comparison of acidic versus alcoholic HBDs under related terpene HBAs. The DL–menthol subgroup provides a shorter comparative series with C8, C10, and C12 acids, while the fatty acid–fatty acid systems and TOPO-based systems broaden the chemical space beyond monoterpene-centered formulations. Importantly, the molar ratios span a wide range (for example, 0.15:1 for HES 16, 1.94:1 for HES 4, 2.06:1 for HES 10, and 3:1 for HES 28), indicating that each formulation reflects a composition chosen for eutectic formation and physical stability rather than an arbitrarily fixed HBA:HBD ratio across all families. As a result, the extraction behavior observed in Figure 1 must be interpreted as a consequence of coupled compositional and structural effects.
A feature of Figure 1 is the non-uniform distribution of extraction performance across the evaluated HESs. Rather than a gradual variation among formulations, the data show a restricted subset of HESs with substantially higher total phenolic extraction capability, while most systems remain at intermediate or lower recovery levels. This pattern suggests that the extraction process is controlled by a balance between specific interactions with phenolic hydroxyl groups and sufficient compatibility with the less polar structural domains of the solutes [40]. The highest phenolic recoveries among the selected HESs were obtained with HES 4 (1279.49 ± 2.31 mg GAE L−1), followed by HES 15 (1133.92 ± 5.29 mg GAE L−1), HES 20 (927.07 ± 2.96 mg GAE L−1), HES 8 (854.85 ± 4.00 mg GAE L−1), and HES 18 (842.07 ± 4.62 mg GAE L−1). These values establish that the HES screening shown in Figure 1 generated a subset of formulations with markedly higher extraction capacity than conventional solvents tested later in the study, including water (224.39 ± 1.94 mg GAE L−1), limonene (166.68 ± 2.23 mg GAE L−1), hexane (165.03 ± 1.12 mg GAE L−1), turpentine (160.52 ± 2.52 mg GAE L−1), and oil (55.68 ± 1.12 mg GAE L−1). HES 4 is composed of camphor and oleic acids at a molar ratio of 1.94:1, and its leading performance indicates that this combination generates a highly favorable extraction medium for the phenolic fraction present in spent coffee grounds. HES 15, composed of borneol and oleic acids at a ratio of 0.44:1, also showed high phenolic recovery, which confirms that oleic acid is a highly effective HBD in terpene-based HESs while simultaneously indicating that the identity of the terpene HBA modulates the final extraction efficiency. HES 20 (borneol + octanoic acid, 0.68:1) further demonstrates that excellent phenolic extraction is not restricted to long-chain or unsaturated fatty acids, since a shorter-chain acid can also yield high performance when paired with an appropriate HBA and composition. The presence of HES 8 (camphor + oleic alcohol, 1.08:1) and HES 18 (borneol + 1-dodecanol, 0.29:1) among the top candidates is particularly informative since it shows that high extraction efficiencies can also be achieved with fatty alcohol-based HBDs, indicating that strong extraction performance is not exclusively associated with carboxylic acidity.
The distribution of results in Figure 1 also indicates that increasing hydrophobic character alone is not sufficient to maximize phenolic recovery. If hydrophobicity were the dominant controlling factor, a more monotonic trend across homologous HES series would be expected. Instead, the non-uniform response across formulations supports a physicochemical interpretation in which HES performance emerges from the interplay between hydrogen-bonding capacity, polarity heterogeneity, and diffusional mobility. Consequently, structurally related solvents may exhibit substantially different extraction efficiencies when their component ratio changes, since stoichiometry modifies the density and accessibility of interaction sites and alters the supramolecular organization of the eutectic liquid [41,42].
Another relevant aspect is that high-performing and intermediate-performing systems coexist within the same general chemical families, reinforcing that solvent family classification alone is not predictive of extraction outcomes. This result is technically important as it demonstrates that phenolic extraction in these media is not determined by the identity of a single component but by the cooperative behavior of the full eutectic formulation [43]. Such cooperative effects are consistent with the known physicochemical behavior of eutectic liquids, in which small compositional changes can produce measurable differences in microstructure, rheology, and solvation capacity, all of which directly affect extraction efficiency from a heterogeneous lignocellulosic residue such as spent coffee grounds [44].
Rodríguez-Llorente et al. [45], who studied real olive vegetation water, showed that terpene-based hydrophobic eutectic solvents displayed markedly different phenolic extraction performances depending on the specific solvent composition and that the menthol:camphor eutectic solvent achieved a total phenol extraction yield of 88.73%, outperforming the conventional solvents included in that study. These findings support the same physicochemical interpretation observed in Figure 1, namely that hydrophobic eutectic formulations create composition-specific extraction environments in which intermolecular interactions, phase organization, and transport properties jointly determine phenolic recovery. In addition, da Silva et al. [9] reported that, in coffee by-products, hydrophilic DESs were efficient for the extraction of caffeine and chlorogenic acid, whereas hydrophobic solvents showed distinct selectivity. This demonstrates that the behavior observed in Figure 1 is particularly relevant, as it suggests that the high-performing HES subset identified in the present work extends the current coffee by-product extraction literature toward a less explored hydrophobic eutectic domain.
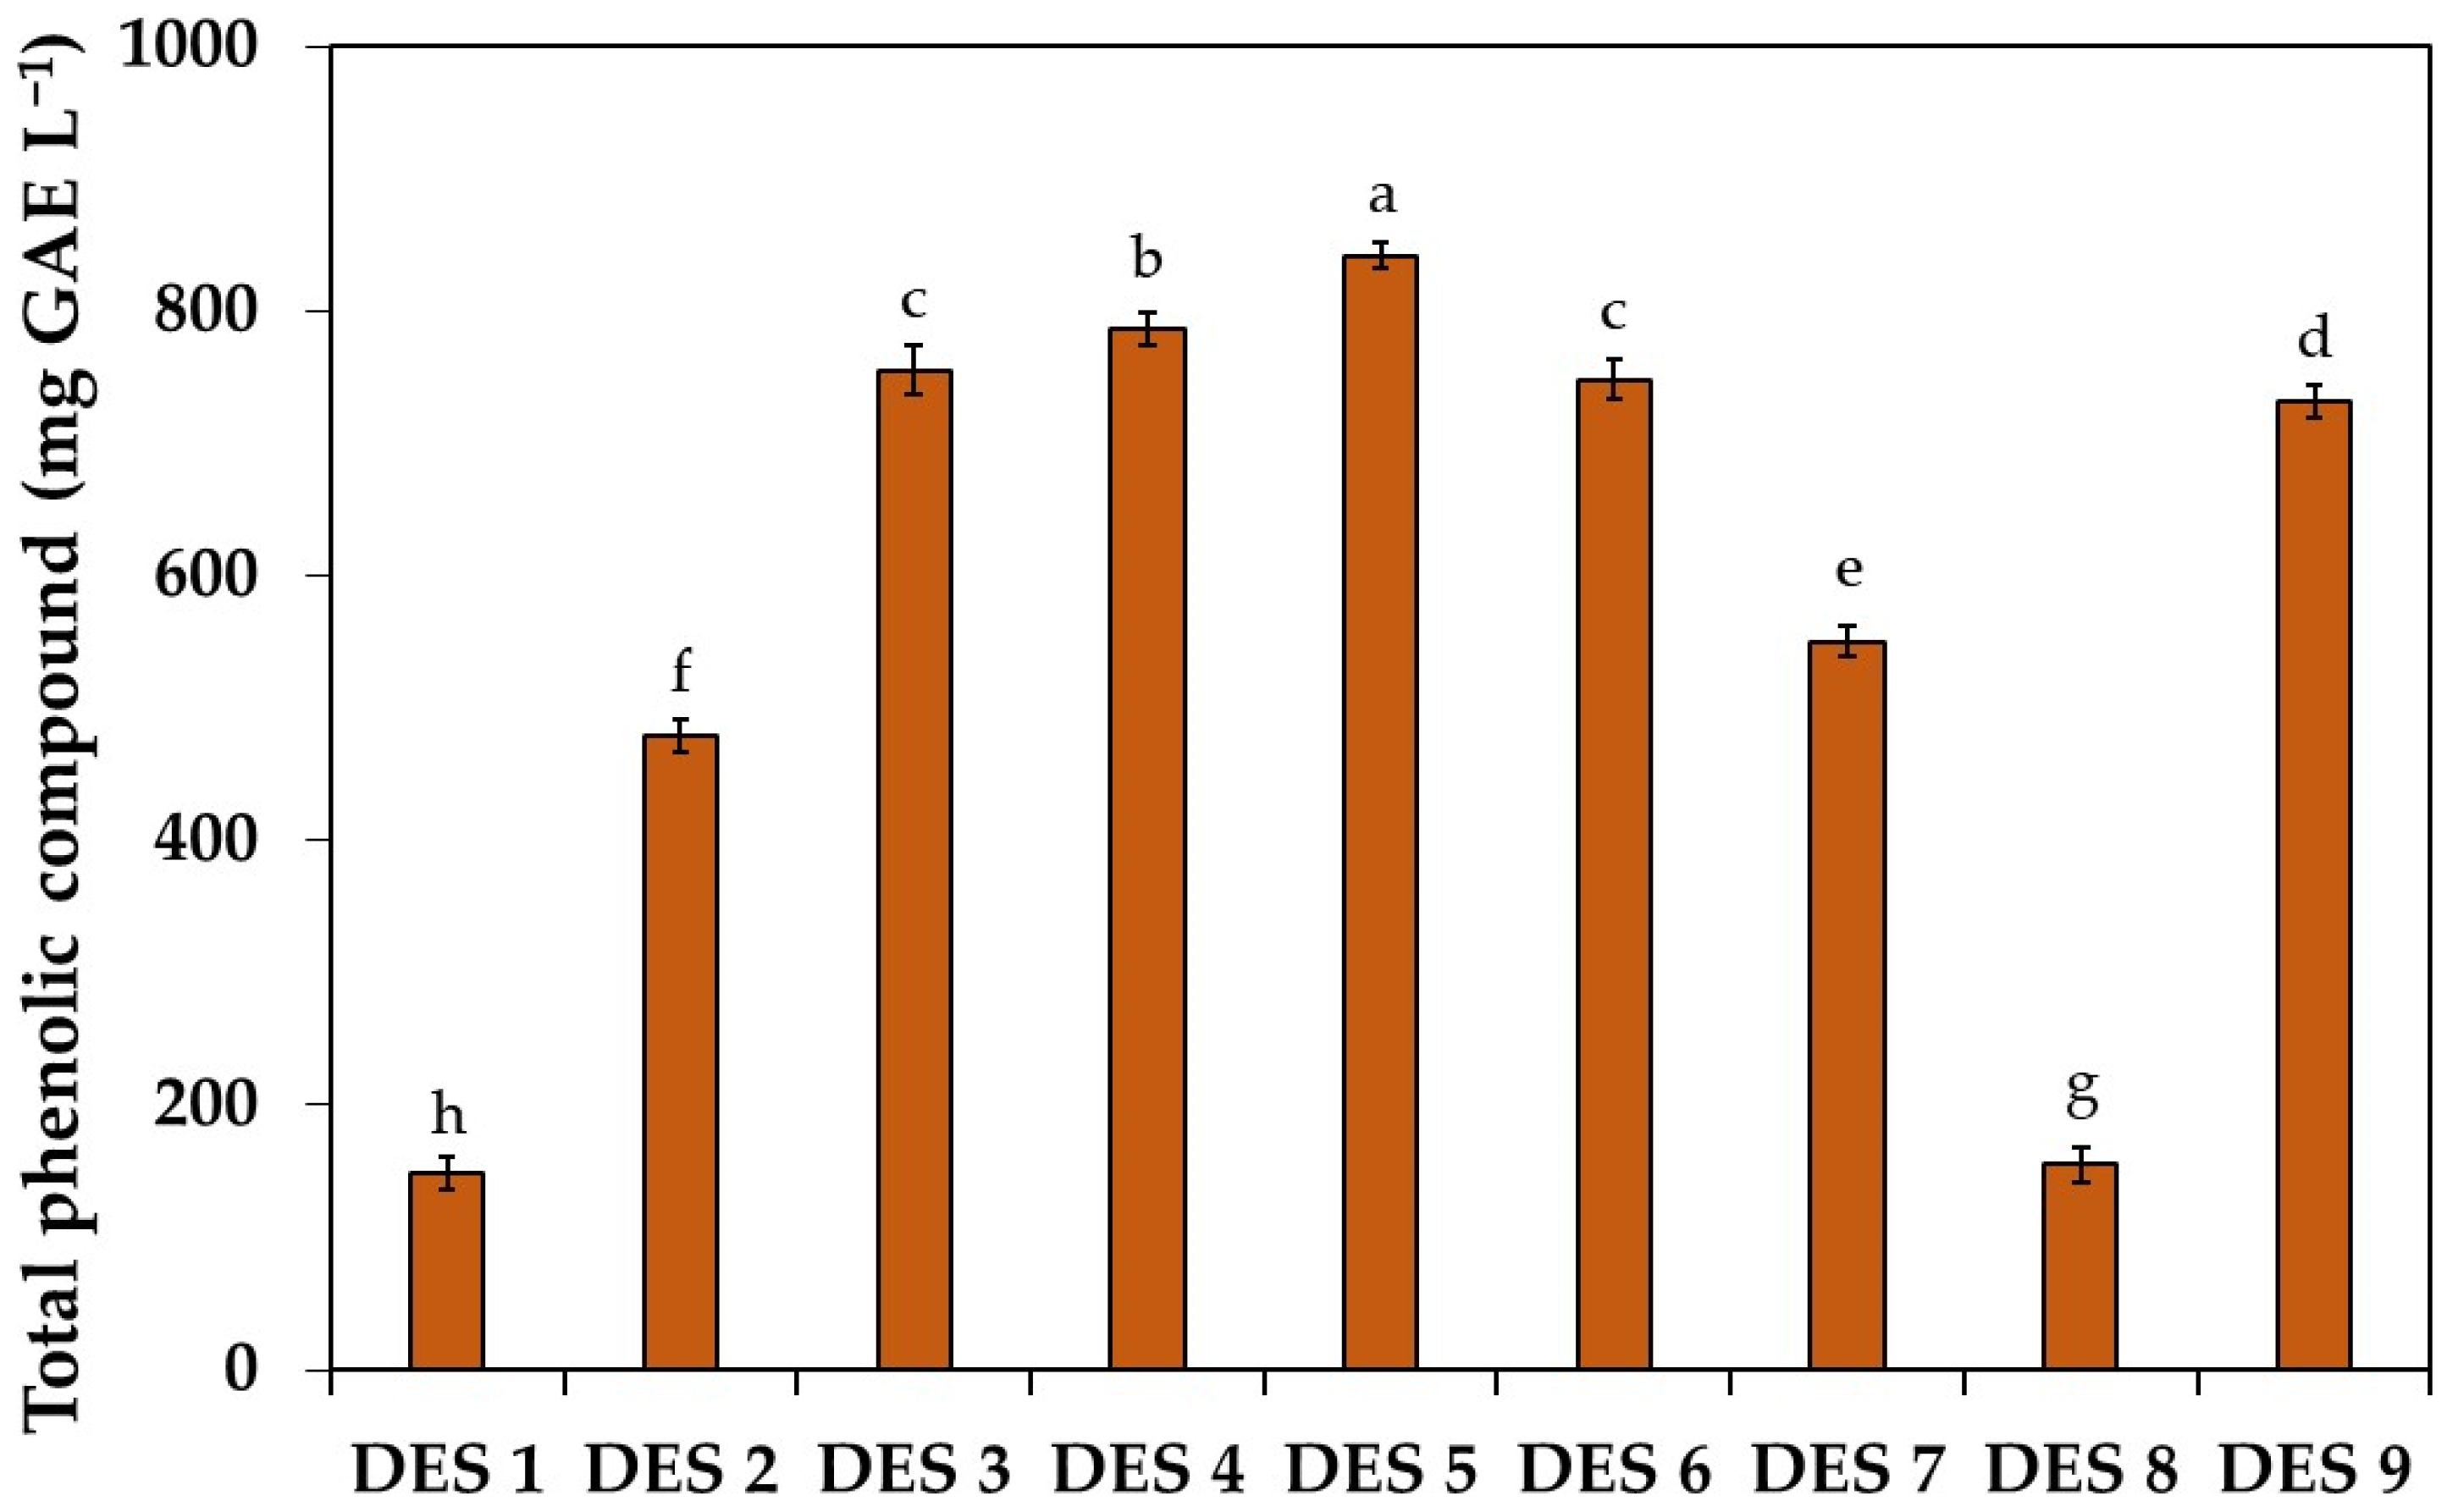
Figure 2 shows a formulation-dependent response in the extraction of phenolic compounds from spent coffee grounds when hydrophilic deep eutectic solvents are employed. Although all evaluated media belong to the same general class of hydrophilic DESs, the extraction values vary substantially across the screened systems, indicating that phenolic recovery is controlled by the specific physicochemical characteristics of each eutectic formulation rather than by hydrophilicity as a class attribute. This behavior is consistent with the multivariate nature of biomass extraction, in which solute transfer simultaneously depends on the solvation thermodynamics, matrix accessibility, and transport phenomena within the extracting liquid [46].
The screened DESs represent distinct combinations of hydrogen-bond acceptors and polyol-type donors, which generate different hydrogen-bonding networks and local polarity profiles. These differences are expected to directly affect the extraction of phenolic compounds, since the process requires not only favorable solute–solvent interactions with phenolic hydroxyl groups but also sufficient penetration of the liquid phase into the biomass structure and stabilization of the extracted species after desorption from the solid matrix [47]. Therefore, DES formulations with comparable bulk polarity may still exhibit markedly different extraction performances if their intermolecular organization and rheological behavior differ. The response profile in Figure 2 does not support a monotonic dependence of phenolic recovery on a single-solvent descriptor. Instead, the dispersion of extraction values across the DES set indicates that performance emerges from the combined influence of HBA/HBD identities and their cooperative organization in the eutectic phase. In hydrophilic DESs, this cooperative behavior is particularly relevant because changes in formulation can simultaneously modify hydrogen-bond donor/acceptor site availability, liquid viscosity, diffusional mobility, and microstructural heterogeneity, all of which contribute to the overall extraction efficiency [48,49].
Among the hydrophilic DESs screened in Figure 2, the extraction values span a wide range, from approximately 145–155 mg GAE L−1 for the lowest-performing systems (DES 1 and DES 8) to about 840 mg GAE L−1 for the highest-performing formulation (DES 5). The best overall performance is observed for DES 5 (approximately 840 mg GAE L−1), followed by DES 4 (approximately 785 mg GAE L−1), while DES 3 and DES 6 form the second high-performance group with extraction values near 750 mg GAE L−1. DES 9 also remains within the upper range (approximately 730 mg GAE L−1), whereas DES 7 shows an intermediate response (approximately 550 mg GAE L−1), and DES 2 displays a lower-intermediate response (approximately 480 mg GAE L−1). This distribution confirms that the screening shown in Figure 2 does not produce a gradual progression of extraction efficiencies, but rather a clear stratification into low-, intermediate-, and high-performance DES formulations. In particular, the concentration of the highest values in a restricted subset of formulations indicates that favorable extraction requires a specific balance between interaction capacity and transport properties in the eutectic phase. Conversely, the markedly lower recoveries obtained for DES 1 and DES 8 indicate that not all HBA/HBD combinations generate a solvent environment capable of efficiently desorbing and stabilizing phenolic compounds from the spent coffee ground matrix. The coexistence of high-performing systems (DES 5, DES 4, DES 3, DES 6, and DES 9) and low-performing systems within the same screened DES set therefore reinforces a formulation-specific physicochemical interpretation, in which relatively small changes in composition lead to substantial differences in the extraction response [50]. Silva et al. [9] reported that, for spent coffee grounds, a citric acid:mannitol DES reached 1620.71 ± 3.72 mg GAE L−1 under optimized conditions, clearly outperforming the lactic acid/glucose system evaluated in the same work and confirming that phenolic extraction in SCGs is highly sensitive to DES composition. Likewise, Tzani et al. [51] screened six NADESs from spent coffee grounds and identified betaine:glycerol as the optimum formulation for further process development, again showing that only a restricted subset of hydrophilic eutectic solvents provides superior extraction performance. These studies are fully consistent with the pattern observed in Figure 2, where the DESs do not exhibit a uniform extraction response. In this context, the dispersion of values in Figure 2 can be interpreted to be in line with the results on formulation-specific differences in hydrogen-bonding network structure, polarity distribution, and viscosity in the literature, all of which directly affect phenolic solvation and mass transfer from the spent coffee ground matrix.
Variation among formulations containing different HBA types further indicates that the acceptor component plays an active role in defining extraction behavior. Systems based on choline chloride, betaine, and proline establish chemically distinct ionic or zwitterionic environments, and these differences can alter charge distribution, hydrogen-bond acceptor strength, and the internal organization of the DES network. As a result, the same donor family may lead to different phenolic recoveries depending on the paired HBA, which reinforces that extraction performance cannot be attributed exclusively to donor identity or bulk solvent polarity [52].
Polyol-type donors differ in hydroxyl group density, molecular flexibility, and intermolecular association strength, and these parameters can affect the balance between solute affinity and mass-transfer resistance. A formulation that enhances hydrogen-bonding interactions with phenolic compounds may increase thermodynamic driving force for extraction, but if the same formulation also increases viscosity or strengthens the eutectic network excessively, diffusional limitations may reduce the overall recovery [53]. The behavior observed in Figure 2 is consistent with this balance-controlled mechanism, in which higher extraction efficiency is obtained only when interaction capacity and transport properties remain simultaneously favorable.
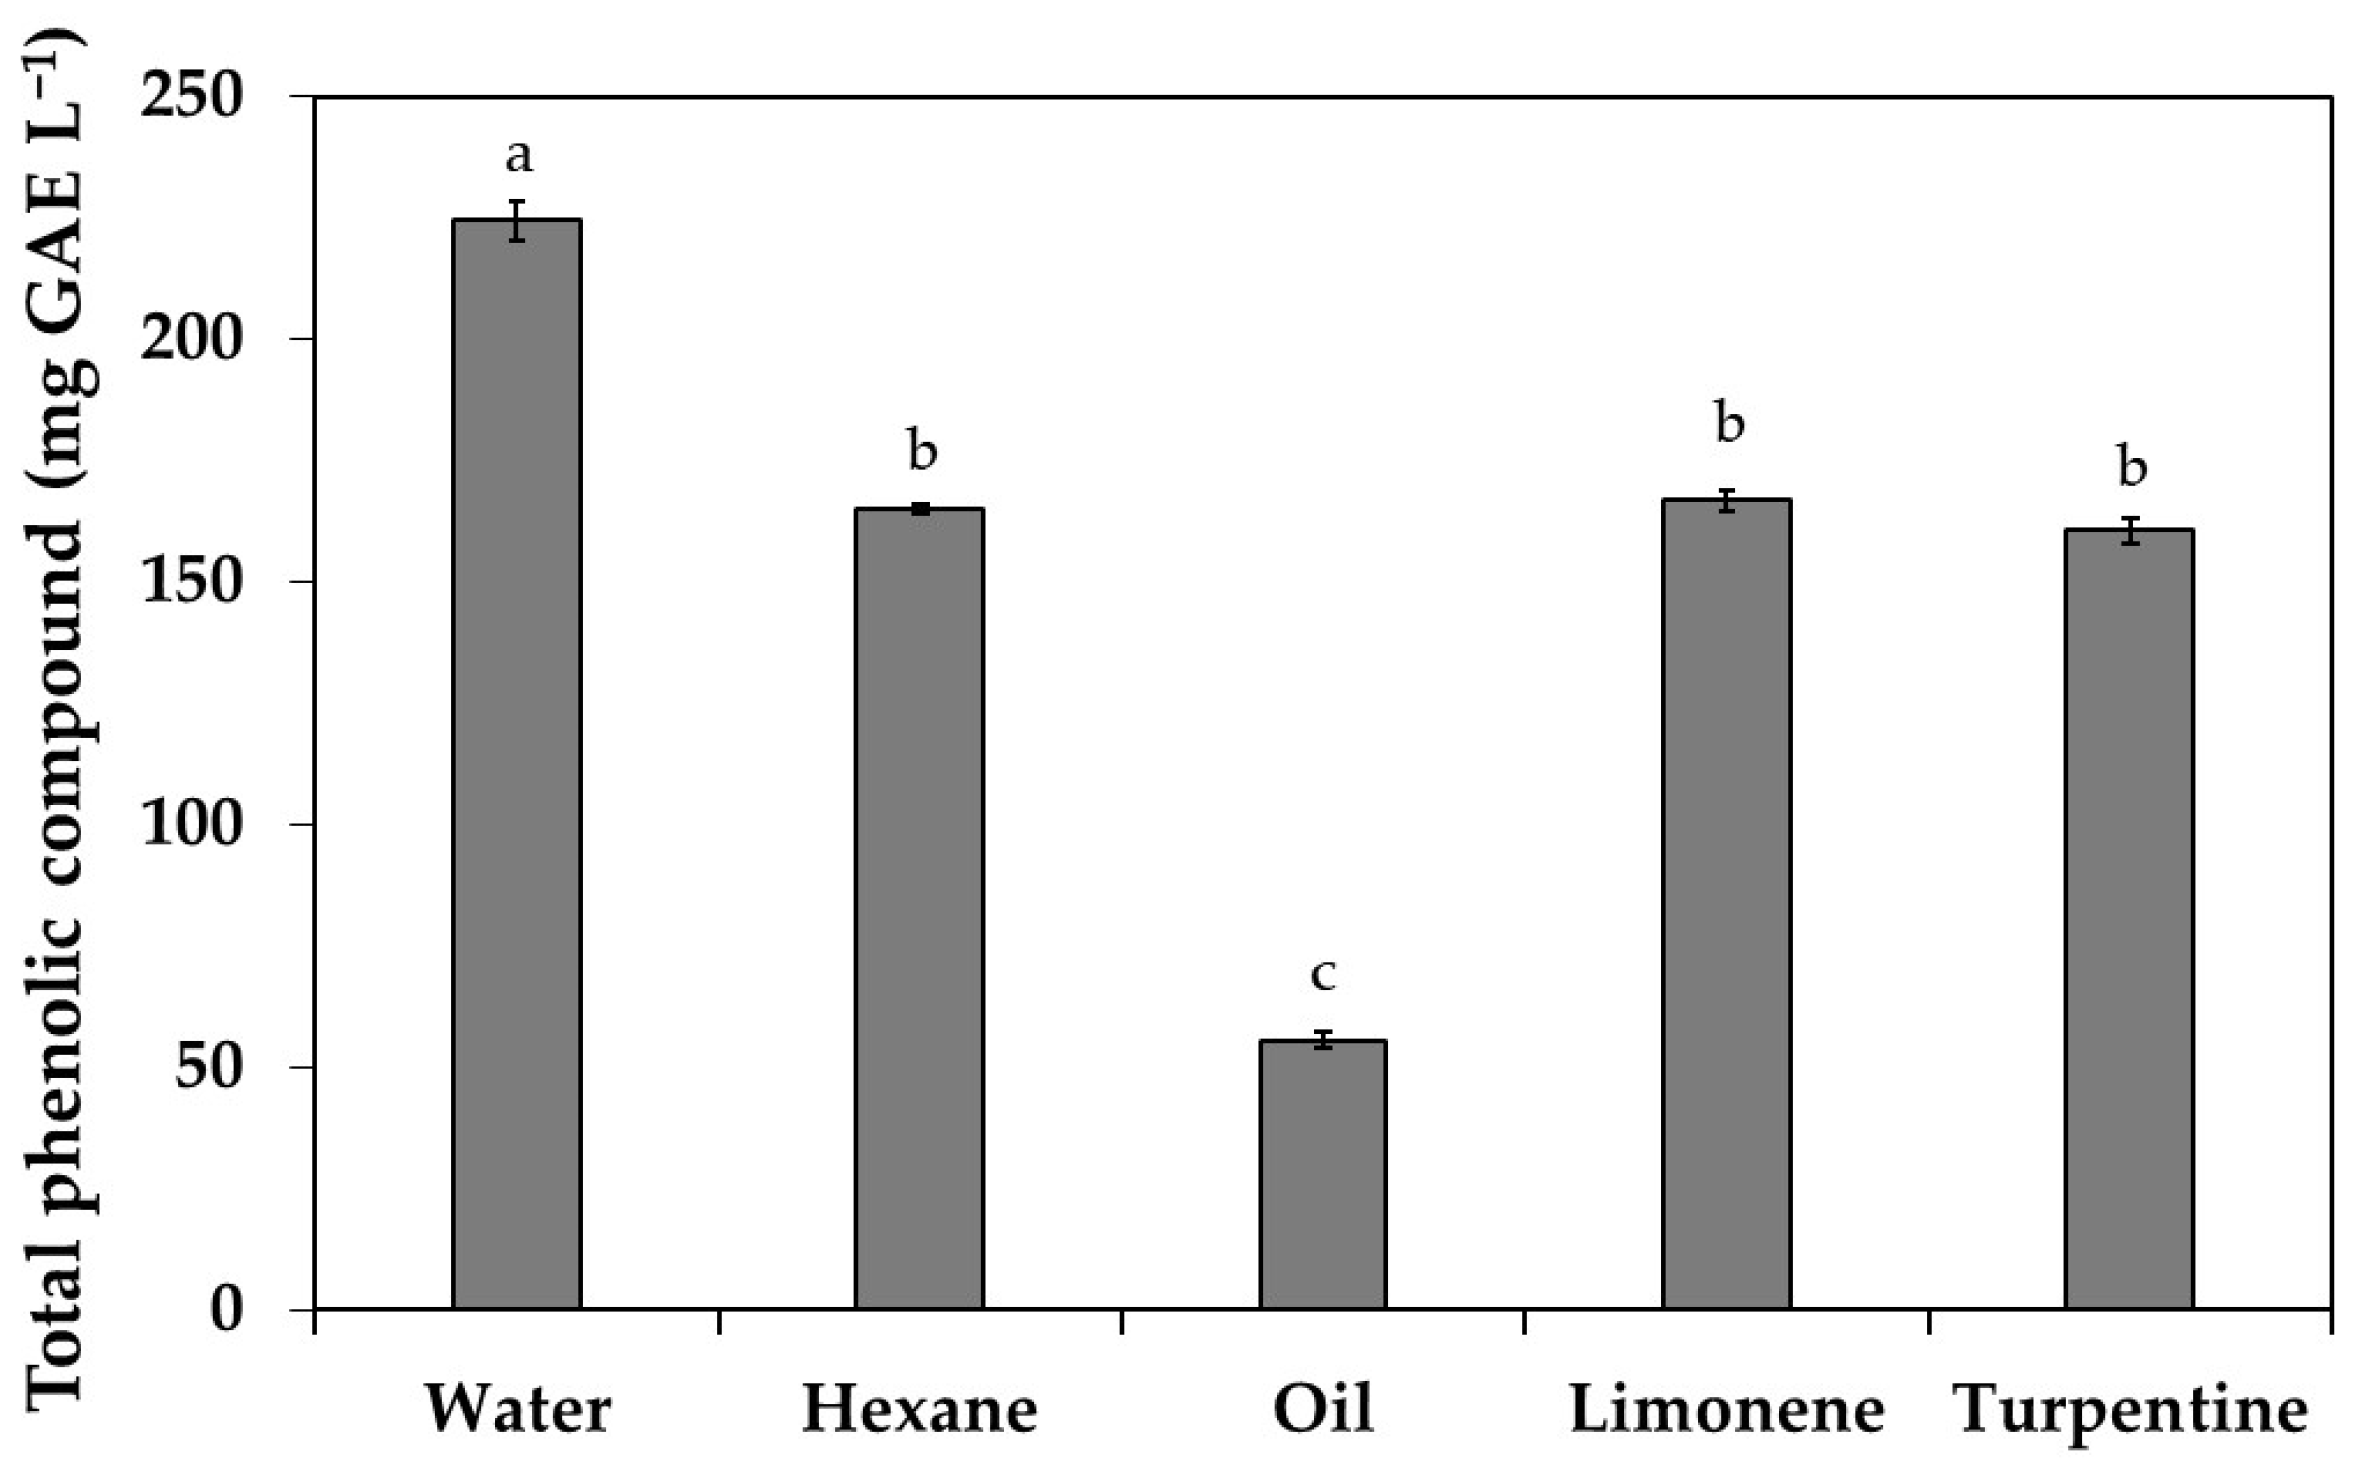
Figure 3 provides a direct benchmark of conventional extraction media for phenolic recovery from spent coffee grounds and reveals a markedly heterogeneous extraction response among the evaluated solvents. The measured values show that water yielded the highest total phenolic extraction (224.39 ± 1.94 mg GAE L−1), followed by limonene (166.68 ± 2.23 mg GAE L−1), hexane (165.03 ± 1.12 mg GAE L−1), and turpentine (160.52 ± 2.52 mg GAE L−1), whereas oil exhibited the lowest extraction capacity (55.68 ± 1.12 mg GAE L−1). This ranking indicates that, within the set of conventional solvents evaluated, phenolic recovery is strongly dependent on solvent physicochemical properties.
The superiority of water is consistent with the predominantly polar character of a substantial fraction of phenolic compounds present in spent coffee grounds, particularly due to the presence of hydroxylated aromatic structures that benefit from hydrogen-bonding interactions within the extracting phase. However, the fact that nonpolar solvents such as limonene, hexane, and turpentine still extracted measurable amounts of phenolics indicates that the extracted fraction is chemically heterogeneous and may include compounds or matrix-associated species with partial hydrophobic compatibility. At the same time, the relatively similar values obtained for limonene, hexane, and turpentine suggest that, in these systems, differences in molecular identity do not translate into major gains in extraction efficiency under the evaluated conditions, likely because the limiting factor is the low capacity of these solvents to stabilize more polar phenolic species once desorbed from the biomass matrix. A relevant feature of the dataset in Figure 3 is the sharp decrease observed for oil relative to the other conventional solvents. This low recovery indicates that solvent hydrophobicity alone is insufficient to promote efficient phenolic extraction and that mass-transfer and solvation constraints become dominant when the extracting phase has limited heterogeneity and reduced ability to establish favorable interactions with phenolic hydroxyl groups [54].

3.3. Influence of Enzyme Addition on the Recovery of Phenolics and Proteins

Table 3 describes the effect of adding enzymes to the HES system on the total recovery of phenolic compounds. The five eutectic solvents included in Table 3 (HES 4, HES 15, HES 20, HES 8, and HES 18) were selected based on their superior performance in extracting phenolic compounds in the previous screening. This approach is technically relevant since it shifts the analysis from broad solvent screening to response modulation within a restricted set of HESs that already exhibit high extraction capacity. The table compares each selected HES under three conditions (HES, HES + Viscozyme, and HES + Cellic CTec2), which allows direct assessment of whether enzymatic treatment enhances, preserves, or suppresses the phenolic extraction efficiency of the eutectic phase.
The clear and consistent trend shown in Table 3 indicates that the non-enzymatic HES condition yields the highest phenolic recovery for all five selected eutectic solvents. Under HES-only conditions, the extraction values follow the order of HES 4 (1279.49 ± 2.31 mg GAE L−1) > HES 15 (1133.92 ± 5.29 mg GAE L−1) > HES 20 (927.07 ± 2.96 mg GAE L−1) > HES 8 (854.85 ± 4.00 mg GAE L−1) > HES 18 (842.07 ± 4.62 mg GAE L−1). This trend confirms the strong extraction capacity of the selected formulations and also preserves the stratification previously observed in the screening stage, with HES 4 and HES 15 remaining as the upper-performance systems. The magnitude of the difference between HES 4 and HES 18 is considerable, indicating that even among the best-performing HESs, phenolic extraction remains highly dependent on the formulation. When Viscozyme is added, a systematic reduction in total phenolic recovery is observed for all five HESs, with values decreasing to 819.84 ± 12.66 mg GAE L−1 (HES 4), 744.75 ± 13.53 mg GAE L−1 (HES 15), 615.15 ± 11.33 mg GAE L−1 (HES 20), 537.58 ± 12.13 mg GAE L−1 (HES 8), and 502.87 ± 12.31 mg GAE L−1 (HES 18). This behavior indicates that, under the analyzed conditions, Viscozyme® does not act synergistically with the selected HESs for phenolic recovery and instead is associated with a marked suppression of the extraction response. Importantly, although absolute values decrease, the relative order among HESs is largely preserved, suggesting that the dominant factor controlling extraction remains the intrinsic formulation of the HES, while enzymatic treatment imposes a reduction in recovery [55,56].
A similar overall reduction is also observed for the HES + Cellic® CTec2 condition relative to the HES alone, but with a response profile that differs from Viscozyme in magnitude and selectivity. The measured values are 896.12 ± 14.80 mg GAE L−1 (HES 4), 619.66 ± 13.52 mg GAE L−1 (HES 15), 561.95 ± 11.33 mg GAE L−1 (HES 20), 515.79 ± 10.07 mg GAE L−1 (HES 8), and 500.57 ± 14.52 mg GAE L−1 (HES 18). For HES 4, Cellic CTec2 results in higher phenolic recovery than Viscozyme®, indicating a less severe loss of extraction capacity in this specific HES–enzyme combination. In contrast, for HES 15 and HES 20, Cellic® CTec2 produces lower values than Viscozyme®, whereas for HES 8 and HES 18, the two enzyme conditions are relatively close. These differences indicate that the impact of enzymatic treatment is not uniform across HES formulations and depends on the specific interaction between the enzyme system and the eutectic medium [57].
The fact that both enzyme-containing conditions generally underperform compared to the corresponding HES-only condition suggests that the high phenolic extraction capacity of these selected eutectic solvents is partially compromised when the extraction medium is modified by enzymatic addition. This may reflect changes in the phase microenvironment, dilution effects, altered mass-transfer behavior, or reduced accessibility of favorable HES–phenolic interactions under enzyme-assisted conditions. Therefore, the data indicate that enzyme addition does not automatically improve phenolic extraction in HES-based systems, even when the selected HESs are intrinsically high-performing solvents [20]. Instead, the response depends on the compatibility between the eutectic formulation and the enzyme preparation, which must be evaluated empirically for each combination. The behavior of the reference solvents in the same table reinforces this interpretation by showing that enzyme addition has strongly solvent-dependent effects outside the HES subset as well [58]. Water’s performance remains essentially unchanged across the three conditions (224.39 ± 11.94, 225.12 ± 10.47, and 221.65 ± 10.20 mg GAE L−1), indicating minimal enzymatic modulation of phenolic recovery under the tested aqueous condition. By contrast, limonene and hexane show severe reductions in phenolic extraction capability after enzyme addition, with values falling from 166.68 ± 12.23 and 165.03 ± 11.12 mg GAE L−1 to single-digit or low values in both enzyme-containing conditions. Turpentine’s performance also decreases relative to the solvent-only condition, although less drastically than limonene and hexane, while oil’s performance remains low in all cases. This solvent-specific behavior supports the conclusion that enzyme-assisted phenolic extraction is controlled by the combined compatibility of the enzyme system, extraction medium, and biomass matrix rather than by enzyme presence alone [59].
Although phenolic compounds are frequently regarded as polar solutes, their extraction behavior depends on more than solvent polarity alone. The main phenolics present in spent coffee grounds, especially chlorogenic acid and related hydroxycinnamic derivatives, exhibit an amphiphilic character, combining polar functional groups with aromatic and less polar regions. Therefore, efficient extraction requires a solvent capable of providing a balanced combination of hydrogen-bonding, polar, and dispersive interactions [9]. In a representative HPLC profile of SCG extracts obtained with an HES based on camphor and oleic acid, chlorogenic acid was the major compound, reaching 46.39 mg·g−1 in the HES, 21.87 mg·g−1 in the HES + Viscozyme®, and 24.98 mg·g−1 in the HES + Cellic® CTec2. Other relevant phenolic compounds included ferulic acid (15.31, 6.01, and 6.93 mg·g−1), caffeic acid (9.14, 6.85, and 7.13 mg·g−1), gallic acid (4.73, 2.27, and 1.64 mg·g−1), rutin (3.14, 0.43, and 0.67 mg·g−1), quercetin (1.11, 0.48, and 0.59 mg·g−1) and p-coumaric acid (0.20, 0.16, and 0.18 mg·g−1), resulting in quantified total phenolic contents of 80.02, 38.07, and 42.12 mg·g−1 for the HES, the HES + Viscozyme®, and the HES + Cellic® CTec2, respectively. This profile supports the interpretation that chlorogenic acid and other low-molecular-weight phenolic acids are among the main contributors to the phenolic fraction recovered from SCGs by hydrophobic eutectic systems. Furthermore, the observed results may be related to the influence of several extraction-medium parameters, including enzyme type, enzyme dosage, temperature, solvent nature, and extraction time, all of which may contribute to partial enzyme inactivation under the tested conditions [56]. In addition, most ESs are characterized by high viscosity, low water activity, and strong intermolecular interactions, which can affect enzyme conformation and, consequently, reduce catalytic performance [27]. It should also be considered that solvents with high intrinsic solvation capacity may directly promote the extraction of phenolic compounds, thereby limiting the additional contribution of enzymatic treatment to the overall extraction process [60].
In a recent study, ref. [60] reported that SCG extracts showed only minimal variations in total phenolic content among the different enzyme treatments, indicating that enzymatic action may have a limited effect on phenolic recovery when the extraction medium already contains a significant fraction of the phenolic pool. This behavior is consistent with the trend observed in our phenolic dataset, where enzyme addition did not improve extraction and, in most cases, reduced total phenolic recovery relative to the neat HES condition. Baiano and Fiore [61], who worked with chicory and fennel by-products, showed that enzymatic extraction could produce markedly different outcomes depending on the biomass. For chicory, enzyme-assisted extraction combined with ultrasound reached total phenolic compound contents comparable to those obtained via conventional hydroalcoholic extraction, whereas for fennel, all enzymatic treatments remained less effective than the solvent benchmark. Their results reinforce the same interpretation supported by our data, namely that the effect of enzymatic addition depends on how the enzyme system interacts with the specific structural barriers of the biomass and with the extraction medium.
The statistical analysis reinforces that the extraction response was strongly HBA/HBD-dependent, since the best-performing HESs formed a significantly superior group in comparison with the remaining eutectic and conventional solvents (p ≤ 0.05). This suggests that the observed variations reflect a consistent effect of solvent composition on the recovery of phenolic compounds.
As in the previous table, the five HESs were selected in the screening process based on their performance in total phenolic extraction. Thus, Table 4 extends the analysis from phenolic recovery to total protein extraction within the same high-performing HES subset. This allows the extraction behavior of the selected HESs to be evaluated in terms of selectivity, thus showing whether the conditions that favor high phenolic recovery also promote protein co-extraction.
The protein extraction profile differs substantially from the phenolic extraction pattern previously observed for the same HESs. Under neat-solvent conditions, the protein contents follow the order of HES 4 (506.37 ± 5.20 mg·L−1) > HES 18 (388.96 ± 6.00 mg·L−1) > HES 15 (223.41 ± 3.46 mg·L−1) > HES 20 (187.81 ± 6.44 mg·L−1) > HES 8 (158.59 ± 3.20 mg·L−1). Although HES 4 remains the highest-performing system, the relative ranking of the other solvents is reorganized when the response shifts from phenolics to proteins, indicating that the physicochemical factors governing protein solubilization are not identical to those controlling phenolic extraction. This divergence is expected since proteins are larger and structurally more complex, where recovery depends on solvent affinity, as well as conformational stability, hydration effects, and the ability of the extraction medium to interact with peptide backbones and side-chain functionalities [48].
The effect of Viscozyme® on protein extraction is remarkable different from its effect on phenolic recovery. Rather than producing a uniform decrease, the enzyme induces a solvent-dependent redistribution of protein extraction values. In HES 4, protein content decreases from 506.37 ± 5.20 to 268.59 ± 7.10 mg·L−1, and in HES 18, it decreases from 388.96 ± 6.00 to 285.63 ± 5.42 mg·L−1, indicating reduced protein recovery relative to the neat HES condition. In contrast, that of HES 15 increases from 223.41 ± 3.46 to 312.67 ± 2.00 mg·L−1, while that for HES 20 increases from 187.81 ± 6.44 to 334.52 ± 2.18 mg·L−1, and for HES 8, it increases from 158.59 ± 3.20 to 386.00 ± 0.76 mg·L−1. These shifts indicate that Viscozyme® does not exert a uniform protein-release effect across all HES formulations. Instead, its action appears to depend on the compatibility between the enzyme system, the biomass matrix, and the eutectic phase. For some solvents, the enzymatic pretreatment may increase matrix disruption sufficiently to improve protein release, whereas in others, the altered extraction environment may reduce protein transfer or stability in the liquid phase [62].
The most pronounced effect in Table 4 is observed with Cellic® CTec2, which causes a high increase in protein extraction for all five selected HESs. Under this condition, the measured values rise to 1608.74 ± 3.32 mg·L−1 for HES 4, 1435.41 ± 6.80 mg·L−1 for HES 18, 1337.63 ± 12.48 mg·L−1 for HES 15, 1091.71 ± 3.78 mg·L−1 for HES 20, and 1203.56 ± 8.22 mg·L−1 for HES 8. This response represents a major upward shift relative to both the neat HES and HES + Viscozyme® conditions, demonstrating that Cellic® CTec2 strongly enhances protein recovery in the selected eutectic media. In contrast to the phenolic results, where enzyme addition generally reduced extraction efficiency, the protein data indicate a clear synergistic effect between Cellic® CTec2 and the HES phase. This suggests that the enzymatic system facilitates disruption of the spent coffee ground matrix in a manner that significantly increases the release or accessibility of proteinaceous materials, while the eutectic medium remains capable of accommodating the released species [62]. Nevertheless, the statistical comparison among neat HESs and enzyme-supplemented systems confirms that enzyme addition did not promote a significant improvement in phenolic extraction under most of the evaluated conditions, whereas for proteins, the increase observed with Cellic® CTec2 represented a statistically supported enhancement rather than a simple numerical variation. Therefore, the interpretation of the extraction behavior is supported by the absolute values as well as by the pattern of significance obtained from the ANOVA/Tukey analysis.
Another important aspect of Table 4 is that the relative differences among the HESs become narrower under Cellic® CTec2 than under the neat-solvent condition, even though HES 4 remains the highest-performing system. This behavior suggests that once matrix disruption becomes more extensive, the intrinsic differences among HES formulations are partially attenuated, and the enzyme-assisted release step becomes a dominant contributor to the final protein concentration in the extract [55]. Nevertheless, the persistence of higher values for HES 4 and HES 18 indicates that solvent formulation still plays an active role in determining the final extraction response, likely by affecting the solubilization and stabilization of the released proteins after enzymatic liberation. The conventional solvents included in the same table reinforce this interpretation by showing that protein extraction remains strongly medium-dependent outside the HES subset. Water content increases from 74.93 ± 1.15 mg·L−1 in the neat condition to 109.80 ± 5.08 mg·L−1 with Viscozyme® and 550.40 ± 3.46 mg·L−1 with Cellic® CTec2, confirming that enzyme addition can enhance protein release even in aqueous media, but to a much lower extent than in the best HES systems. Limonene shows a particularly contrasting behavior, with 259.60 ± 5.15 mg·L−1 in the neat solvent, followed by a sharp decrease to 6.47 ± 0.58 mg·L−1 with Viscozyme® and only partial recovery to 50.77 ± 1.00 mg·L−1 with Cellic® CTec2. Hexane content remains very low under all conditions (29.60 ± 1.48, 1.01 ± 0.58, and 1.12 ± 0.39 mg·L−1), indicating minimal compatibility with protein extraction. Turpentine only shows modest values and limited benefit from Viscozyme®, followed by a reduction with Cellic® CTec2, while oil remains low in all cases. Together, these results show that the large protein gains observed with Cellic® CTec2 are not a general consequence of enzyme addition but depend strongly on the extraction medium and are particularly favored in the selected HES formulations [29].
Table 4 reveals a clear contrast between phenolic and protein extraction behavior. The selected HESs, which were originally chosen for their high phenolic recovery, do not exhibit parallel behavior for proteins under all conditions. Instead, enzyme addition, especially with Cellic® CTec2, redirects the extraction response toward much higher protein co-recovery. The strong increase observed with Cellic® CTec2 is also in agreement with previous reports showing that enzymatic treatments can substantially enhance the release of soluble proteinaceous material from spent coffee grounds when the process is directed toward protein hydrolysis. Hunsub et al. [62], for example, reported that enzyme-assisted extraction of SCGs produced water-soluble protein concentrations in the range of 400 to 800 mg·L−1 and achieved a very high degree of hydrolysis under optimized conditions, confirming that enzymatic hydrolysis can efficiently convert insoluble coffee ground proteins into soluble fractions. This explains the difference in behavior between protein extraction and phenolic extraction using Cellic® CTec2. Bedmutha et al. [63], who investigated protein extraction from de-oiled soybean cakes using choline chloride-based DESs, demonstrated that DES formulation strongly governs protein recovery. In that study, choline chloride:glycerol systems consistently outperformed choline chloride:polyethylene glycol systems, and the best condition (choline chloride:glycerol, 1:3) yielded 280 mg·L−1, highlighting the importance of DES polarity, hydroxyl-group density, and viscosity in determining extraction efficiency. Moldes et al. [64] investigated protein extraction from Saccharina latissima using DESs. Their results showed that protein extraction in eutectic media is strongly formulation-dependent, which is consistent with the present study, where the selected HES also showed significantly different protein recoveries, and the highest values were only obtained for specific solvent–enzyme combinations, particularly in the presence of Cellic® CTec2. This agreement supports the interpretation that protein recovery in eutectic systems is governed by the combined effects of matrix disruption, the solvent microenvironment, and eutectic-phase compatibility, rather than by solvent class alone.
It is important to note from the results that the final extraction values were determined by the addition of the enzyme, as well as by the intrinsic extraction capacity of each HES combination. Under neat conditions, the selected HESs already exhibited high phenolic recoveries, ranging from 842.07 to 1279.49 mg GAE L−1, with HES 4 and HES 15 proving to be the most efficient systems. When Viscozyme® was added, phenolic recovery decreased for all HESs, with reductions of 35.9% for HES 4, 34.3% for HES 15, 33.6% for HES 20, 37.1% for HES 8, and 40.3% for HES 18 relative to the neat-solvent condition. A similar trend was observed with Cellic® CTec2, for which phenolic extraction remained 30.0% lower in HES 4 and declined by 45.4%, 39.4%, 39.7%, and 40.6% in HES 15, HES 20, HES 8, and HES 18, respectively. In contrast, protein extraction showed a distinct pattern. Under neat conditions, protein recovery ranged from 158.59 to 506.37 mg·L−1; however, the effect of Viscozyme® depended strongly on the solvent, causing reductions of 47.0% in HES 4 and 26.6% in HES 18 while increasing protein recovery by 40.0% in HES 15, 78.1% in HES 20, and 143.4% in HES 8. The strongest response was obtained with Cellic® CTec2, which increased protein extraction from 506.37 to 1608.74 mg·L−1 in HES 4 (+217.7%), from 388.96 to 1435.41 mg·L−1 in HES 18 (+269.0%), from 223.41 to 1337.63 mg·L−1 in HES 15 (+498.7%), from 187.81 to 1091.71 mg·L−1 in HES 20 (+481.3%), and from 158.59 to 1203.56 mg·L−1 in HES 8 (+658.9%). These quantitative shifts demonstrate that the HESs were not passive media, since they already defined the baseline selectivity of the process, while enzyme addition acted as a formulation-dependent modulation step that generally suppressed phenolic recovery but strongly intensified protein co-extraction, particularly in the case of Cellic® CTec2.
From a process integration perspective, the downstream recovery of the extracted fractions should be considered separately for phenolic compounds and proteins, since these solute classes differ markedly in molecular size, physicochemical behavior, and expected separation requirements. Protein-rich extracts could, in principle, be recovered by precipitation and/or ultrafiltration, as proteins are macromolecular species whose fractionation can be driven by both solubility changes and size exclusion [64]. In contrast, for the phenolic fraction, more rigorous membrane-based techniques, such as nanofiltration, as well as adsorption/desorption on appropriate resins or liquid–liquid back-extraction, would likely represent more feasible downstream options. This consideration is particularly important for fatty acid-based HESs, whose non-volatile nature makes simple solvent removal by evaporation impractical when compared with terpene-based volatile systems. Therefore, although fatty acid-based HESs showed high extraction performance, their further processing is expected to require integrated and solute-specific downstream strategies [63].

3.4. Enzymatic Activity of the Enzyme Preparations

The enzymatic profiles of Cellic® CTec2 and Viscozyme® were evaluated in terms of total cellulase (filter paper), xylanase, endoglucanase (EG), and cellobiohydrolase (CBH) content in order to characterize their hydrolytic potential toward the polysaccharide fraction of spent coffee grounds. Enzymatic activities were determined from the amount of reducing sugars released during substrate hydrolysis, using the DNS calibration curve, and were expressed as enzymatic activity per milliliter (U·mL−1). Overall, the results revealed a markedly higher hydrolytic capacity for Cellic® CTec2 in all assays, indicating that this preparation presents a broader and more intense catalytic action toward structural carbohydrates than Viscozyme®.
A pronounced difference between the two enzyme preparations was observed in the xylanase assay. Cellic® CTec2 showed an activity of 5.32 U·mL−1, whereas Viscozyme® reached only 0.05 U·mL−1. A similar trend was found for total cellulase activity, as determined by the filter paper assay, in which Cellic® CTec2 exhibited a value of 8.40 U·mL−1 compared with only 0.33 U·mL−1 for Viscozyme®. These results indicate that Cellic® CTec2 has a substantially greater global ability to hydrolyze the polysaccharide matrix, which is consistent with its formulation as a multi-enzymatic cocktail designed for efficient lignocellulosic biomass deconstruction. The same pattern was maintained for endoglucanase. Cellic® CTec2 reached 10.30 U·mL−1, whereas Viscozyme® exhibited only 0.39 U·mL−1. This difference is particularly relevant since endoglucanases catalyze the internal cleavage of amorphous cellulose chains, representing a key step in the initial disruption of the plant cell wall structure. The high EG activity observed for Cellic® CTec2 indicates a higher capacity to promote the opening of the cellulose network and to increase accessibility of matrix-associated compounds [62]. In contrast, the low activity observed for Viscozyme® suggests a more limited contribution to cellulose depolymerization under the conditions evaluated.
In agreement with this result, the CBH values also showed substantially higher activity for Cellic® CTec2, which reached 5.74 U·mL−1, whereas Viscozyme® presented only 0.20 U·mL−1. Since cellobiohydrolases act on the terminal regions of cellulose chains, particularly in more ordered domains, their activity is essential for the progressive conversion of cellulose into soluble saccharides. The higher CBH activity of Cellic® CTec2 therefore confirms its strong cellulolytic character and supports its higher effectiveness for promoting deeper deconstruction of the lignocellulosic matrix [56]. By contrast, the limited CBH activity detected for Viscozyme® is compatible with a less pronounced cellulolytic profile. Faria-Júnior et al. [26] demonstrated that acidic DES formulations, particularly those based on lactic acid, and Cellic® CTec2 enhanced lignin and sugar solubilization, improved biomass porosity, and promoted selective fractionation under moderate processing conditions, with 110 °C identified as the most suitable condition to balance extraction efficiency and product stability.
These results demonstrate that Cellic® CTec2 exhibited superior performance in all enzymatic assays, whereas Viscozyme® showed comparatively low activities that are especially associated with cellulose degradation. This distinction is fully consistent with the extraction results previously discussed. The markedly higher cellulolytic and hemicellulolytic activities of Cellic® CTec2 provide a direct explanation for its stronger effect on protein recovery (Table 4), where the enzyme promoted a substantial increase in protein extraction for all selected HESs. The higher hydrolytic capacity of this enzyme cocktail likely enhanced disruption of the spent coffee ground structure, thereby increasing the release and accessibility of proteinaceous materials to the eutectic phase. At the same time, the enzymatic activity data also explain why Cellic® CTec2 did not improve phenolic extraction (Table 3), despite its high catalytic potential. Although it was highly active toward the structural polysaccharide fraction, the modification of the extraction medium by enzyme addition may have altered the solvent microenvironment in a way that reduced the favorable interactions previously established between the neat HESs and phenolic compounds [56].

4. Conclusions

The present study demonstrated that spent coffee grounds are a relevant source of phenolic compounds and proteins and that eutectic solvents are effective and tunable media for their recovery. Among the systems evaluated, hydrophobic eutectic solvents showed the highest phenolic extraction, with camphor:oleic acid (HES 4) as the best-performing formulation, reaching 1279.49 ± 2.31 mg GAE L−1. Enzyme addition did not improve phenolic recovery; instead, the highest values under enzymatic conditions remained lower than those obtained with the neat HESs, with HES 4 + Cellic® CTec2 reaching 896.12 ± 4.80 mg GAE L−1 and HES 4 + Viscozyme® reaching 819.84 ± 2.66 mg GAE L−1; the other formulations reduced these values by about 30–45%. In contrast, protein extraction showed a remarkable different response. Under enzyme-free conditions, the highest protein recovery was also obtained with camphor:oleic acid (506.37 ± 5.20 mg·L−1); however, the addition of Cellic® CTec2 significantly increased protein extraction for all selected HESs, with the maximum value again observed for camphor:oleic acid, reaching 1608.74 ± 3.32 mg·L−1. Viscozyme® produced a more limited effect, with the highest protein value observed for camphor:oleic alcohol (386.00 ± 0.76 mg·L−1). These results show that extraction performance in eutectic systems is strongly dependent on solvent formulation, enzyme compatibility, and the target compound, with neat HESs being more suitable for phenolic recovery and HESs combined with Cellic® CTec2 being the most favorable strategy for protein extraction.

Supplementary Materials

The following supporting information can be downloaded at: https://www.mdpi.com/article/10.3390/separations13040106/s1, Figure S1. FTIR spectra of the individual components and HES: (a) camphor and borneol, (b) fatty acids, (c) fatty alcohols, (d) HES formed by camphor and fatty acids, (e) HES formed by camphor and fatty alcohols, (f) HES formed by borneol and fatty acids, and (g) HES formed by borneol and fatty alcohols; Figure S2. TGA curves for (a) pure constituents, (b) HES formed by mixing camphor with fatty acids and alcohols, and (c) borneol with fatty acids and alcohols; Figure S3. DSC curves for HES formed by camphor and borneol with fatty acids or alcohols, as well as their individual components.

Author Contributions

Conceptualization, F.S.B. and B.D.R.; methodology, C.N.d.S. and C.R.F.; validation, C.N.d.S. and F.S.B.; formal analysis, C.R.F.; investigation, C.N.d.S. and C.R.F.; resources, F.S.B.; data curation, B.D.R.; writing—original draft preparation, C.N.d.S.; writing—review and editing, F.S.B.; visualization, B.D.R.; supervision, F.S.B. and B.D.R.; project administration, B.D.R.; funding acquisition, B.D.R. All authors have read and agreed to the published version of the manuscript.

Funding

This research received no external funding.

Data Availability Statement

The original contributions presented in this study are included in the article/Supplementary Material. Further inquiries can be directed to the corresponding author.

Acknowledgments

This work was financed by national funds through the National Council for Scientific and Technological Development (CNPq), Coordination for the Improvement of Higher-Level Personnel (CAPES), and the Foundation for Research Support and Technological Innovation of the State of Rio de Janeiro (FAPERJ).

Conflicts of Interest

The authors declare no conflicts of interest.

References

  1. de Moura, M.M.; Martins, L.C.; Alcantara, G.M.R.N.; Rocha, F.R.P.; Melchert, W.R. Microwave-Assisted Extraction of Total Phenolic Compounds from Coffee. Appl. Food Res. 2026, 6, 101821. [Google Scholar] [CrossRef] [Scilit]
  2. United States Department of Agriculture. Coffee Production. Available online: https://www.fas.usda.gov/data/production/0711100 (accessed on 12 February 2026).
  3. CONAB—Compania Nacional de Abastecimento. Primeira Estimativa da Conab Aponta para uma Produção de Café de 66,2 Milhões de Sacas de Café em 2026. Available online: https://www.gov.br/conab/pt-br/assuntos/noticias/primeira-estimativa-da-conab-aponta-para-uma-producao-de-cafe-de-66-2-milhoes-de-sacas-de-cafe-em-2026 (accessed on 12 February 2026).
  4. Silva, C.N.; Lemes, A.C.; Ribeiro, B.D. Deep Eutectic Solvents in the Valorization of Spent Coffee Grounds: A Review of High-Value Compound Extraction. Waste Biomass Valorization 2025, 21, 1–30. [Google Scholar] [CrossRef] [Scilit]
  5. Barreto Peixoto, J.A.; Silva, J.F.; Oliveira, M.B.P.P.; Alves, R.C. Sustainability Issues along the Coffee Chain: From the Field to the Cup. Compr. Rev. Food Sci. Food Saf. 2023, 22, 287–332. [Google Scholar] [CrossRef] [Scilit]
  6. Beaudor, M.; Vauchel, P.; Pradal, D.; Aljawish, A.; Phalip, V. Comparing the Efficiency of Extracting Antioxidant Polyphenols from Spent Coffee Grounds Using an Innovative Ultrasound-Assisted Extraction Equipment versus Conventional Method. Chem. Eng. Process.-Process Intensif. 2023, 188, 109358. [Google Scholar] [CrossRef] [Scilit]
  7. Basílio, A.A.G.; Gratão, M.S.; Macedo, G.C.; Xavier, S.J.L.; Silva, M.E.B.R.; Soares, L.A.F.; Macedo, P.H.L.; dos Santos, T.E.B.; Matos, F.S. Effect of Coffee Grounds as a Bio-Input in Lettuce Cultivation. Sustainability 2026, 18, 649. [Google Scholar] [CrossRef] [Scilit]
  8. Kumar, A.; Thakur, M.K.; Hart, P.; Thakur, V.K. Sustainable Valorization of Spent Coffee Grounds: A Green Chemistry Approach to Soil Amendment and Environmental Monitoring. ACS Sustain. Resour. Manag. 2025, 2, 1630–1642. [Google Scholar] [CrossRef] [Scilit] [PubMed]
  9. da Silva, C.N.; da Silva, R.M.; Lemes, A.C.; Ribeiro, B.D. Recovery of Phenolic Compounds by Deep Eutectic Solvents in Orange By-Products and Spent Coffee Grounds. Sustainability 2024, 16, 7403. [Google Scholar] [CrossRef] [Scilit]
  10. Martinez-Saez, N.; García, A.T.; Pérez, I.D.; Rebollo-Hernanz, M.; Mesías, M.; Morales, F.J.; Martín-Cabrejas, M.A.; del Castillo, M.D. Use of Spent Coffee Grounds as Food Ingredient in Bakery Products. Food Chem. 2017, 216, 114–122. [Google Scholar] [CrossRef] [Scilit]
  11. Valdés, A.; Castro-Puyana, M.; Marina, M.L. Isolation of Proteins from Spent Coffee Grounds. Polyphenol Removal and Peptide Identification in the Protein Hydrolysates by RP-HPLC-ESI-Q-TOF. Food Res. Int. 2020, 137, 109368. [Google Scholar] [CrossRef] [Scilit]
  12. Maiyah, N.; Kerdpiboon, S.; Kerr, W.L.; Klaypradit, W.; Smithisukul, C.; Supapvanich, S. Impact of Roasting Levels and Brewing Cycles on Bioactive Compounds in Spent Coffee Grounds. Food Chem. X 2026, 34, 103661. [Google Scholar] [CrossRef] [Scilit] [PubMed]
  13. Christoforidis, A.; Mantiniotou, M.; Athanasiadis, V.; Lalas, S.I. Caffeine and Polyphenolic Compound Recovery Optimization from Spent Coffee Grounds Utilizing Pressurized Liquid Extraction. Beverages 2025, 11, 74. [Google Scholar] [CrossRef] [Scilit]
  14. Chongsrimsirisakhol, O.; Jangchud, K.; Wilde, P.J.; Pirak, T. The Impact of Thermal Treatment and In Vitro Digestion on Antioxidant Activity and Anti-Glycation Properties of Antioxidant Crude Extract From Hot and Cold Brew Spent Coffee Ground. Food Sci. Nutr. 2025, 13, e70131. [Google Scholar] [CrossRef] [Scilit]
  15. Badr, A.N.; El-attar, M.M.; Ali, H.S.; Elkhadragy, M.F.; Yehia, H.M.; Farouk, A. Spent Coffee Grounds Valorization as Bioactive Phenolic Source Acquired Antifungal, Anti-Mycotoxigenic, and Anti-Cytotoxic Activities. Toxins 2022, 14, 109. [Google Scholar] [CrossRef] [Scilit]
  16. Kim, G.; Jeong Jeong, H.; Kim, S.Y.; Han, G.D. Anti-Adipogenic and Antioxidant Activities of Spent Coffee Grounds Extracts: Impacts of Chlorogenic Acid and Caffeic Acid. Food Sci. Biotechnol. 2025, 34, 2635–2642. [Google Scholar] [CrossRef] [Scilit]
  17. Balzano, M.; Loizzo, M.R.; Tundis, R.; Lucci, P.; Nunez, O.; Fiorini, D.; Giardinieri, A.; Frega, N.G.; Pacetti, D. Spent Espresso Coffee Grounds as a Source of Anti-Proliferative and Antioxidant Compounds. Innov. Food Sci. Emerg. Technol. 2020, 59, 102254. [Google Scholar] [CrossRef] [Scilit]
  18. Buarque, F.S.; Soares, M.A.; Ribeiro, B.D.; Marrucho, I.M. Development of Hydrophobic Eutectic Solvents Composed of DL-Menthol and Fatty Acids/Alcohols: Application in the Extraction of Capsaicinoids and Carotenoids from Capsicum Frutescens. J. Mol. Liq. 2025, 417, 126591. [Google Scholar] [CrossRef] [Scilit]
  19. Mushtaq, H.H.; Akhtar, A.; Nasim, I.; Khalid, N. Ultrasound-Enhanced Deep Eutectic Solvent Extraction and Encapsulation of Eggplant Peel Polyphenols for Low-Fat Mozzarella Spread Formulation. Ultrason. Sonochem. 2026, 127, 107769. [Google Scholar] [CrossRef] [Scilit]
  20. Deng, G.; Li, P.; Liang, H.; Chen, T.; Zhou, L.; Yang, H.; Jiang, X.; Ding, C.; Feng, S. Extraction of Polysaccharides from Camellia Oleifera Leaves by Dual Enzymes Combined with Deep Eutectic Solvents Screened by ANN and COSMO-RS. Int. J. Biol. Macromol. 2025, 305, 141131. [Google Scholar] [CrossRef] [Scilit]
  21. Devi, M.; Moral, R.; Thakuria, S.; Mitra, A.; Paul, S. Hydrophobic Deep Eutectic Solvents as Greener Substitutes for Conventional Extraction Media: Examples and Techniques. ACS Omega 2023, 8, 9702–9728. [Google Scholar] [CrossRef] [Scilit] [PubMed]
  22. Buarque, F.S.; Ribeiro, B.D.; Freire, M.G.; Coelho, M.A.Z.; Pereira, M.M. Assessing the Role of Deep Eutectic Solvents in Yarrowia Lipolytica Inhibition. J. Biotechnol. 2025, 398, 1–10. [Google Scholar] [CrossRef] [Scilit] [PubMed]
  23. Zheng, X.; Yin, F.; Gong, G.; Zhang, X.; He, S.; Tang, W.; Wei, X.H. An Overview of Hydrophobic Deep Eutectic Solvents Driven Liquid-Phase Extraction: Applications and Prospects. J. Chromatogr. A 2025, 1748, 465824. [Google Scholar] [CrossRef] [Scilit]
  24. Huang, M.M.; Yiin, C.L.; Mun Lock, S.S.; Fui Chin, B.L.; Othman, I.; binti Ahmad Zauzi, N.S.; Chan, Y.H. Natural Deep Eutectic Solvents (NADES) for Sustainable Extraction of Bioactive Compounds from Medicinal Plants: Recent Advances, Challenges, and Future Directions. J. Mol. Liq. 2025, 425, 127202. [Google Scholar] [CrossRef] [Scilit]
  25. Costa, C.; Marques, M.; Martins, A.M.; Gonçalves, L.; Pinto, P.; Ribeiro, H.M.; Marto, J.; Paiva, A. Upcycling Spent Coffee Grounds into Bioactive Extracts Using New Natural Deep Eutectic Systems for Sustainable Topical Formulations. ACS Sustain. Chem. Eng. 2025, 13, 1906–1915. [Google Scholar] [CrossRef] [Scilit]
  26. Faria-Júnior, C.S.; Silva, L.D.S.; Cunha, A.L.; Buarque, F.S.; Ribeiro, B.D. Deep Eutectic Solvents as a Sustainable Approach for Silica Recovery from Rice Husk. Molecules 2025, 30, 4697–4715. [Google Scholar] [CrossRef] [Scilit]
  27. Gunny, A.A.N.; Arbain, D.; Nashef, E.M.; Jamal, P. Applicability Evaluation of Deep Eutectic Solvents-Cellulase System for Lignocellulose Hydrolysis. Bioresour. Technol. 2015, 181, 297–302. [Google Scholar] [CrossRef] [Scilit] [PubMed]
  28. Stanek-Wandzel, N.; Zarębska, M.; Wasilewski, T.; Hordyjewicz-Baran, Z.; Krzyszowska, A.; Gębura, K.; Tomaka, M. Enhancing Phenolic Compound Recovery from Grape Pomace Residue: Synergistic Approach of Ultrasound- and Enzyme-Assisted Extraction. ACS Omega 2025, 10, 23129–23138. [Google Scholar] [CrossRef] [Scilit]
  29. Gligor, O.; Mocan, A.; Moldovan, C.; Locatelli, M.; Crișan, G.; Ferreira, I.C.F.R. Enzyme-Assisted Extractions of Polyphenols—A Comprehensive Review. Trends Food Sci. Technol. 2019, 88, 302–315. [Google Scholar] [CrossRef] [Scilit]
  30. Garavand, F.; Rahaee, S.; Vahedikia, N.; Jafari, S.M. Different Techniques for Extraction and Micro/Nanoencapsulation of Saffron Bioactive Ingredients. Trends Food Sci. Technol. 2019, 89, 26–44. [Google Scholar] [CrossRef] [Scilit]
  31. Abbott, A.P.; Boothby, D.; Capper, G.; Davies, D.L.; Rasheed, R.K. Deep Eutectic Solvents Formed between Choline Chloride and Carboxylic Acids: Versatile Alternatives to Ionic Liquids. J. Am. Chem. Soc. 2004, 126, 9142–9147. [Google Scholar] [CrossRef] [Scilit]
  32. Ribeiro, B.D.; Florindo, C.; Iff, L.C.; Coelho, M.A.Z.; Marrucho, I.M. Menthol-Based Eutectic Mixtures: Hydrophobic Low Viscosity Solvents. ACS Sustain. Chem. Eng. 2015, 3, 2469–2477. [Google Scholar] [CrossRef] [Scilit]
  33. Almeida, F.D.L.; Cavalcante, R.S.; Cullen, P.J.; Frias, J.M.; Bourke, P.; Fernandes, F.A.N.; Rodrigues, S. Effects of Atmospheric Cold Plasma and Ozone on Prebiotic Orange Juice. Innov. Food Sci. Emerg. Technol. 2015, 32, 127–135. [Google Scholar] [CrossRef] [Scilit]
  34. Bradford, M.M. A rapid and sensitive method for the quantitation of microgram quantities of protein utilizing the principle of protein-dye binding. Anal. Biochem. 1976, 72, 248–254. [Google Scholar] [CrossRef]
  35. Adney, B.; Baker, J. Measurement of Cellulase Activities: Laboratory Analytical Procedure (LAP); National Renewable Energy Laboratory: Golden, CO, USA, 2008. [Google Scholar]
  36. Bailey, M.; Biely, P.; Poutanen, K. Interlaboratory testing of methods for assay of xylanase activity. J. Biotechnol. 1992, 23, 257–270. [Google Scholar] [CrossRef] [Scilit]
  37. Ghose, T.K. Measurement of cellulase activities. Pure Appl. Chem. 1987, 59, 257–268. [Google Scholar] [CrossRef] [Scilit]
  38. Zeng, C.; Liu, Y.; Ding, Z.; Xia, H.; Guo, S. Physicochemical Properties and Antibacterial Activity of Hydrophobic Deep Eutectic Solvent-in-Water Nanoemulsion. J. Mol. Liq. 2021, 338, 116950. [Google Scholar] [CrossRef] [Scilit]
  39. Lo, C.; Semerel, J.; van den Berg, C.; Wijffels, R.H.; Eppink, M.H.M. Eutectic Solvents with Tuneable Hydrophobicity: Lipid Dissolution and Recovery. RSC Adv. 2021, 11, 8142–8149. [Google Scholar] [CrossRef] [Scilit] [PubMed]
  40. Boateng, I.D. A Critical Review of Emerging Hydrophobic Deep Eutectic Solvents’ Applications in Food Chemistry: Trends and Opportunities. J. Agric. Food Chem. 2022, 70, 11860–11879. [Google Scholar] [CrossRef] [Scilit] [PubMed]
  41. Zainal-Abidin, M.H.; Hayyan, M.; Wong, W.F. Hydrophobic Deep Eutectic Solvents: Current Progress and Future Directions. J. Ind. Eng. Chem. 2021, 97, 142–162. [Google Scholar] [CrossRef] [Scilit]
  42. Cao, J.; Su, E. Hydrophobic Deep Eutectic Solvents: The New Generation of Green Solvents for Diversified and Colorful Applications in Green Chemistry. J. Clean. Prod. 2021, 314, 127965. [Google Scholar] [CrossRef] [Scilit]
  43. Jesus, B.C.; Pires, J.M.; Marques, H.; Marrucho, I.M. Exploring Hydrophobic Eutectic Solvents Based on Raspberry Ketone. Fluid Phase Equilibria 2025, 590, 114287. [Google Scholar] [CrossRef] [Scilit]
  44. Paul, N.; Harish, G.; Banerjee, T. Stability Mechanism of Menthol and Fatty Acid Based Hydrophobic Eutectic Solvents: Insights from Nonbonded Interactions. ACS Sustain. Chem. Eng. 2023, 11, 3539–3556. [Google Scholar] [CrossRef] [Scilit]
  45. Rodríguez-Llorente, D.; Martín-Gutiérrez, D.; Suárez-Rodríguez, P.; Navarro, P.; Álvarez-Torrellas, S.; García, J.; Larriba, M. Sustainable Recovery of Phenolic Antioxidants from Real Olive Vegetation Water with Natural Hydrophobic Eutectic Solvents and Terpenoids. Environ. Res. 2023, 220, 115207. [Google Scholar] [CrossRef] [Scilit]
  46. Omar, K.A.; Sadeghi, R. Physicochemical Properties of Deep Eutectic Solvents: A Review. J. Mol. Liq. 2022, 360, 119524. [Google Scholar] [CrossRef] [Scilit]
  47. Mercadal, P.A.; Picchio, M.L.; González, A. Food-Protecting Films Based on Soy Protein Isolate and Natural Deep Eutectic Solvents: Antimicrobial and Antioxidant Properties. Food Hydrocoll. 2024, 147, 109414. [Google Scholar] [CrossRef] [Scilit]
  48. Zhou, Y.; Wu, W.; Zhang, N.; Soladoye, O.P.; Zhang, Y.; Fu, Y. Deep Eutectic Solvents as New Media for Green Extraction of Food Proteins: Opportunity and Challenges. Food Res. Int. 2022, 161, 111842. [Google Scholar] [CrossRef] [Scilit]
  49. Kyriakoudi, A.; Tsiouras, A.; Mourtzinos, I. Extraction of Lycopene from Tomato Using Hydrophobic Natural Deep Eutectic Solvents Based on Terpenes and Fatty Acids. Foods 2022, 11, 2645. [Google Scholar] [CrossRef] [Scilit] [PubMed]
  50. Muhammad, G.; Li, Z.; Ma, C.Y.; Wang, Q.; Zhang, X. Deep Eutectic Solvents as an Emerging Platform for Microbial Carotenoids Extraction: State of the Art, Prospects, and Challenges. Food Chem. 2026, 33, 103368. [Google Scholar] [CrossRef] [Scilit]
  51. Tzani, A.; Lymperopoulou, T.; Pitterou, I.; Karetta, I.; Belfquih, F.; Detsi, A. Development and Optimization of Green Extraction Process of Spent Coffee Grounds Using Natural Deep Eutectic Solvents. Sustain. Chem. Pharm. 2023, 34, 101144. [Google Scholar] [CrossRef] [Scilit]
  52. Ruesgas-Ramón, M.; Figueroa-Espinoza, M.C.; Durand, E. Application of Deep Eutectic Solvents (DES) for Phenolic Compounds Extraction: Overview, Challenges, and Opportunities. J. Agric. Food Chem. 2017, 65, 3591–3601. [Google Scholar] [CrossRef] [Scilit]
  53. Jiao, P.; Yu, F.; Zhang, C.; Zhou, Z.; Wang, P.; Zhang, X.; Wei, Y.; Yang, P.; Niu, Q. Extracting Citrus Peel-Derived Polyphenols Using Hydrophobic Deep Eutectic Solvents: Mechanism, Optimization, and Bioactivity Evaluation. Innov. Food Sci. Emerg. Technol. 2026, 108, 104392. [Google Scholar] [CrossRef] [Scilit]
  54. Osorio-Tobón, J.F. Recent Advances and Comparisons of Conventional and Alternative Extraction Techniques of Phenolic Compounds. J. Food Sci. Technol. 2020, 57, 4299–4315. [Google Scholar] [CrossRef] [Scilit] [PubMed]
  55. Ma, G.; Zhang, Z.; Lu, Z.; Qi, Y.; Nian, B.; Hu, Y. Hydrophobic Deep Eutectic Solvents-Lipase Synergistically Catalyze the Synthesis of Vitamin E Succinate via Hydrogen Bonds. J. Mol. Liq. 2024, 394, 123711. [Google Scholar] [CrossRef] [Scilit]
  56. Buarque, F.S.; de Souza, C.E.C.; Ferreira, R.M.; Sabino, T.O.; Teixeira, O.M.J.; Bandeira, L.F.M.; Fraga, A.C.; Coelho, M.A.Z.; Ribeiro, B.D. Dissolution and Enzymatic Hydrolysis of Sugarcane Bagasse Using Ionic Liquids and Deep Eutectic Solvents. Process Biochem. 2024, 147, 257–267. [Google Scholar] [CrossRef] [Scilit]
  57. Yadav, N.; Venkatesu, P. Current Understanding and Insights towards Protein Stabilization and Activation in Deep Eutectic Solvents as Sustainable Solvent Media. Phys. Chem. Chem. Phys. 2022, 24, 13474–13509. [Google Scholar] [CrossRef] [Scilit]
  58. Yadav, N.; Chahar, D.; Bisht, M.; Venkatesu, P. Assessing the Compatibility of Choline-Based Deep Eutectic Solvents for the Structural Stability and Activity of Cellulase: Enzyme Sustain at High Temperature. Int. J. Biol. Macromol. 2023, 249, 125988. [Google Scholar] [CrossRef] [Scilit]
  59. Boncan, D.A.T.; Tsang, S.S.K.; Li, C.; Lee, I.H.T.; Lam, H.M.; Chan, T.F.; Hui, J.H.L. Terpenes and Terpenoids in Plants: Interactions with Environment and Insects. Int. J. Mol. Sci. 2020, 21, 7382. [Google Scholar] [CrossRef] [Scilit]
  60. Salzano, F.; Aulitto, M.; Maione, A.; Galdiero, E.; Di Gaetano, S.; Capasso, D.; Contursi, P.; Fiorentino, G.; Pedone, E.; Limauro, D. High-Value Products from Ground Spent Coffee, Sunflower, and Citrus Waste Using Enzyme Technology. Discov. Sustain. 2025, 6, 450. [Google Scholar] [CrossRef] [Scilit]
  61. Baiano, A.; Fiore, A. Enzymatic-Assisted Recovery of Antioxidants from Chicory and Fennel by-Products. Waste Biomass Valorization 2025, 16, 957–969. [Google Scholar] [CrossRef] [Scilit]
  62. Hunsub, P.; Ngamprasertsith, S.; Prichapan, N.; Sakdasri, W.; Karnchanatat, A.; Sawangkeaw, R. Production of Protein Hydrolysates from Spent Coffee Grounds via Microwave, Enzymatic, and Subcritical Water Extractions and Their Combination. Biol. Life Sci. Forum 2023, 22, 43. [Google Scholar] [CrossRef] [Scilit]
  63. Bedmutha, A.S.; Singh, S.K.; Shewale, S.R.; Kundu, D. Sustainable Extraction of Protein from De-Oiled Soybean Cake Using Choline Chloride- Glycerol Based Deep Eutectic Solvent. Discov. Food 2025, 5, 361. [Google Scholar] [CrossRef] [Scilit]
  64. Moldes, D.; Requejo, P.F.; Vega, M.; Bolado, S.; Wijffels, R.H.; Kazbar, A. Protein Extraction from Seaweed Saccharina Latissima with Deep Eutectic Solvents. Microchem. J. 2024, 205, 111275. [Google Scholar] [CrossRef] [Scilit]
Figure 1. Total phenolic compound content extracted from spent coffee grounds by the hydrophobic eutectic solvents studied. Distinct lowercase letters indicate significant differences (t-test, p ≤ 0.05) between different solvents.
Separations 13 00106 g001
Figure 2. Total phenolic compound content extracted from spent coffee grounds by the hydrophilic deep eutectic solvents studied. Distinct lowercase letters indicate significant differences (t-test, p ≤ 0.05) between different solvents.
Separations 13 00106 g002
Figure 3. Total phenolic compound content extracted from spent coffee grounds by the conventional solvents studied. Distinct lowercase letters indicate significant differences (t-test, p ≤ 0.05) between different solvents.
Separations 13 00106 g003
Table 1. Composition and abbreviations of the prepared HESs.
HESHBAHBDMolar Ratio
HES 1CamphorOctanoic acid1.59:1
HES 2CamphorDecanoic acid1.75:1
HES 3CamphorDodecanoic acid1.99:1
HES 4CamphorOleic acid1.94:1
HES 5Camphor1-octanol0.62:1
HES 6Camphor1-decanol0.86:1
HES 7Camphor1-dodecanol1.10:1
HES 8CamphorOleic alcohol1.08:1
HES 9CamphorOctanoic acid1.90:1
HES 10CamphorDecanoic acid2.06:1
HES 11CamphorDodecanoic acid2:1
HES 12BorneolOctanoic acid0.40:1
HES 13BorneolDecanoic acid0.47:1
HES 14BorneolDodecanoic acid0.56:1
HES 15BorneolOleic acid0.44:1
HES 16Borneol1-octanol0.15:1
HES 17Borneol1-decanol0.22:1
HES 18Borneol1-dodecanol0.29:1
HES 19BorneolOleic alcohol0.21:1
HES 20BorneolOctanoic acid0.68:1
HES 21BorneolDecanoic acid1.01:1
HES 22BorneolDodecanoic acid1:1
HES 23DL-MentholOctanoic acid0.96:1
HES 24DL-MentholDecanoic acid0.98:1
HES 25DL-MentholDodecanoic acid1.92:1
HES 26Octanoic acidDecanoic acid2:1
HES 27Octanoic acidDodecanoic acid2:1
HES 28Decanoic acidDodecanoic acid3:1
HES 29TOPOOctanoic acid0.70:1
HES 30TOPODecanoic acid1.41:1
HES 31TOPODodecanoic acid1.40:1
HBA: Hydrogen Bond Acceptor, HBD: Hydrogen Bond Donor, HESs: Hydrophobic Eutectic Solvents, TOPO: Trioctylphosphine oxide.
Table 2. Composition and abbreviations of the prepared DESs.
DESHBAHBDMolar Ratio
DES 1Choline chloridePDO0.27:1
DES 2Choline chlorideEthylene Glycol0.22:1
DES 3Choline chlorideGlycerol0.33:1
DES 4BetainePDO0.33:1
DES 5BetaineEthylene Glycol0.27:1
DES 6BetaineGlycerol0.39:1
DES 7ProlinePDO0.33:1
DES 8ProlineEthylene Glycol0.27:1
DES 9ProlineGlycerol0.40:1
HBA: Hydrogen Bond Acceptor, HBD: Hydrogen Bond Donor, DES: Deep eutectic solvent, PDO: 1,2 propanediol.
Table 3. Total phenolic compound content (mg GAE L−1) extracted from spent coffee grounds using hydrophobic eutectic solvents and conventional solvents.
SolventsTotal Phenolic Compound Content (mg GAE L−1)
HESHES + Viscozyme®HES + Cellic® CTec2
HES 41279.49 ± 22.31819.84 ± 12.66896.12 ± 14.80
HES 151133.92 ± 25.29744.75 ± 13.53619.66 ± 13.52
HES 20927.07 ± 12.96615.15 ± 11.33561.95 ± 11.33
HES 8854.85 ± 14.00537.58 ± 12.13515.79 ± 10.07
HES 18842.07 ± 14.62502.87 ± 12.31500.57 ± 14.52
Water224.39 ± 11.94225.12 ± 10.47221.65 ± 10.20
Limonene166.68 ± 12.238.88 ± 2.237.99 ± 0.22
Hexane165.03 ± 11.1211.45 ± 0.909.91 ± 0.27
Turpentine160.52 ± 12.5287.81 ± 2.52130.50 ± 12.00
Oil55.68 ± 1.1212.35 ± 1.128.122 ± 0.38
HES: Hydrophobic eutectic solvent.
Table 4. Total protein content (mg·L−1) extracted from spent coffee grounds using hydrophobic eutectic solvents and conventional solvents.
SolventsTotal Protein Content (mg·L−1)
HESHES + Viscozyme®HES + Cellic® CTec2
HES 4506.37 ± 5.20268.59 ± 7.101608.74 ± 3.32
HES 18388.96 ± 6.00285.63 ± 5.421435.41 ± 6.80
HES 15223.41 ± 3.46312.67 ± 2.001337.63 ± 12.48
HES 20187.81 ± 6.44334.52 ± 2.181091.71 ± 3.78
HES 8158.59 ± 3.20386.00 ± 0.761203.56 ± 8.22
Water74.93 ± 1.15109.80 ± 5.08550.40 ± 3.46
Limonene259.60 ± 5.156.47 ± 0.5850.77 ± 1.00
Hexane29.60 ± 1.481.01 ± 0.581.12 ± 0.39
Turpentine87.70 ± 4.3495.47 ± 1.5347.47 ± 0.58
Oil17.60 ± 1.6321.13 ± 5.822.13 ± 0.18
HES: Hydrophobic eutectic solvent.
Disclaimer/Publisher’s Note: The statements, opinions and data contained in all publications are solely those of the individual author(s) and contributor(s) and not of MDPI and/or the editor(s). MDPI and/or the editor(s) disclaim responsibility for any injury to people or property resulting from any ideas, methods, instructions or products referred to in the content.