Article

Parametric Study of Flow Uniformity for Mitigating Ammonium Bisulfate Fouling in Air Preheaters Based on CFD Simulations


1
College of Xuhai, China University of Mining and Technology, Xuzhou 221116, China
2
School of Mechanics and Civil Engineering, China University of Mining and Technology, Xuzhou 221116, China
3
School of Environment and Spatial Informatics, China University of Mining and Technology, Xuzhou 221116, China
4
College of Urban and Environmental Sciences, Hubei Normal University, Huangshi 435002, China
*
Author to whom correspondence should be addressed.
Separations 2026, 13(3), 97; https://doi.org/10.3390/separations13030097
Submission received: 2 February 2026 / Revised: 17 March 2026 / Accepted: 17 March 2026 / Published: 19 March 2026
(This article belongs to the Special Issue Numerical Modeling and Computation in Separation and Adsorption)

Abstract

Ammonium bisulfate (ABS) fouling in air preheaters has become a critical challenge restricting the safe and efficient operation of coal-fired units. Optimizing the flow field of the outlet of the upstream SCR system is a potentially effective path to mitigate ABS fouling. In this work, CFD simulations were conducted on the SCR De-NOx system and its succeeding flue ducts connected to the air preheater. The simulation results of the original design show that a significant velocity deviation exists at the inlet of the air preheater (with the CV1 up to 53.2%), with a portion of the flue gas adhering to the walls, which could induce ABS fouling in the low-temperature region. By adding flow guide plates into the flue duct, the flow uniformity before the air preheater was expected to be effectively improved. Notably, considering the deposition characteristics of ABS and the operating characteristics of the rotary air preheater, this study proposed a novel evaluation indicator, radial variance coefficient (CV2), which focuses on the velocity uniformity based on the annular sector unit, to indicate the risk of ABS deposition. The influence on velocity uniformity of different flow guide plate layouts was analyzed. Based on the multiple evaluation metrics including pressure drop and flow uniformity, the optimal layout scheme was then selected. After optimization, the radial variance coefficient decreased from 30.7% to 11.7%, with the pressure drop slightly increased from 50 Pa to 80 Pa. This study could help to reduce unit failure frequency and support efficient operation of coal-fired power plants.

1. Introduction

Nitrogen oxides (NOx) emissions produced by coal-fired power plants have attracted wide attention due to their close association with photochemical smog, acid rain, and other environmental issues [1]. Selective catalytic reduction (SCR) systems, which utilize V-W-Ti catalysts to enhance the removal of NOx by ammonia (NH3), have become the main de-NOx technology in the coal-fired power plants [2,3]. To ensure sufficient de-NOx efficiency, an excessive amount of ammonia should be injected into the flue gas, which inevitably leads to the escape of ammonia [4,5,6]. Meanwhile, the SCR catalyst installed exhibits a catalytic oxidation effect on a portion (~2%) of sulfur dioxide (SO2) in the flue gas, thus helping produce sulfur trioxide (SO3) [7]. Subsequently, the SO3 would react with the escaped ammonia and ultimately form ammonium bisulfate (NH4HSO4, ABS). ABS is sticky and prone to depositing on the surfaces of downstream devices like the rotary air preheater [8], thereby inducing blockage and the deterioration of the heat transfer efficiency. This poses a serious impact on the safety and economic operation of the coal-fired power plants.
To alleviate the adverse effects, extensive studies have been conducted on the formation and transformation characteristics of ABS. At present, two primary approaches are employed to regulate ABS. The first involves the source control of the precursor substance of ABS (i.e., NH3 and SO3). By fine-tuning the composition and structure of the denitrification catalyst, the oxidation of SO2 could be significantly inhibited. Zhang et al. [7] analyzed the influence of operation parameters and additives on the SO2/SO3 conversion by the SCR catalysts. They found that decreasing V2O5 and WO3 content, as well as increasing MoO3 and area velocity, are beneficial to SO3 reduction. Li et al. [9] developed a novel V2O5-WS2/TiO2 catalyst, which decreases the SO3 generation up to 64% compared with a traditional catalyst by the introduction of low-valence sulfur elements. Alkaline absorbent (sodium-based and calcium-based) injection [10,11,12,13] is also advisable to reduce the emission of SO3. Apart from SO3, precise ammonia injection by advanced control strategies [14,15] to minimize NH3 escape also plays a key role in suppressing the production of ABS. The second approach focuses on the decomposition of the ABS that has already been generated. Efforts have been devoted to optimizing the surface material and structure of air preheaters in order to facilitate the peeling of ABS. Moreover, it is desirable to arrange some reheaters to heat the deposited ABS directly, making it easy to decompose. According to previous research [16,17], the formation temperature of ABS varies from 210 °C to 250 °C. Above 310 °C [18], ABS can be completely decomposed into the gas products, thus preventing fouling. For instance, a hot air circulation system can be installed to increase the air temperature, thereby indirectly raising the temperature of the exhaust gas and avoiding ABS deposition [19]. Considering the majority of ABS deposition was found in the area between the cold sections of the rotary air preheater with low velocity and low temperature, it can be expected that reducing the velocity deviation of the air preheater by regulating the inlet gas flow can greatly contribute to the reduction of ABS deposition, which is consistent with the study of Bu [20]. However, this method has rarely been explored to alleviate ABS deposition, and relevant research is expected in the context of flow-field optimization.
Although significant efforts have been devoted to controlling ABS formation through catalyst modification, SO3 reduction, and ammonia injection optimization, relatively limited attention has been paid to the influence of flow-field distribution upstream of the rotary air preheater. In practical power plant systems, strong velocity maldistribution may lead to the formation of persistent low-velocity regions at the air-preheater inlet, which are often associated with the accumulation of ABS deposits. In this work, CFD simulations on the SCR and its downstream flue duct connected to the air preheater of a 600 MW unit were conducted. Different arrangements of flow guide plates into the flue duct were compared to improve the flow uniformity of the inlet flue gas of the air preheater. Furthermore, a new evaluation indicator, radial variance coefficient (CV2), was proposed in this study, which focuses on velocity uniformity based on annular sector units, considering the motion characteristics of rotary air preheaters. The optimization objective in this study is to minimize the radial velocity deviation (CV2) at the air-preheater inlet while maintaining acceptable pressure drop and overall velocity distribution. This study provides new insights into reducing ABS deposition through flow field optimization and offers a theoretical basis for subsequent engineering applications.

2. Method

2.1. Physical Model

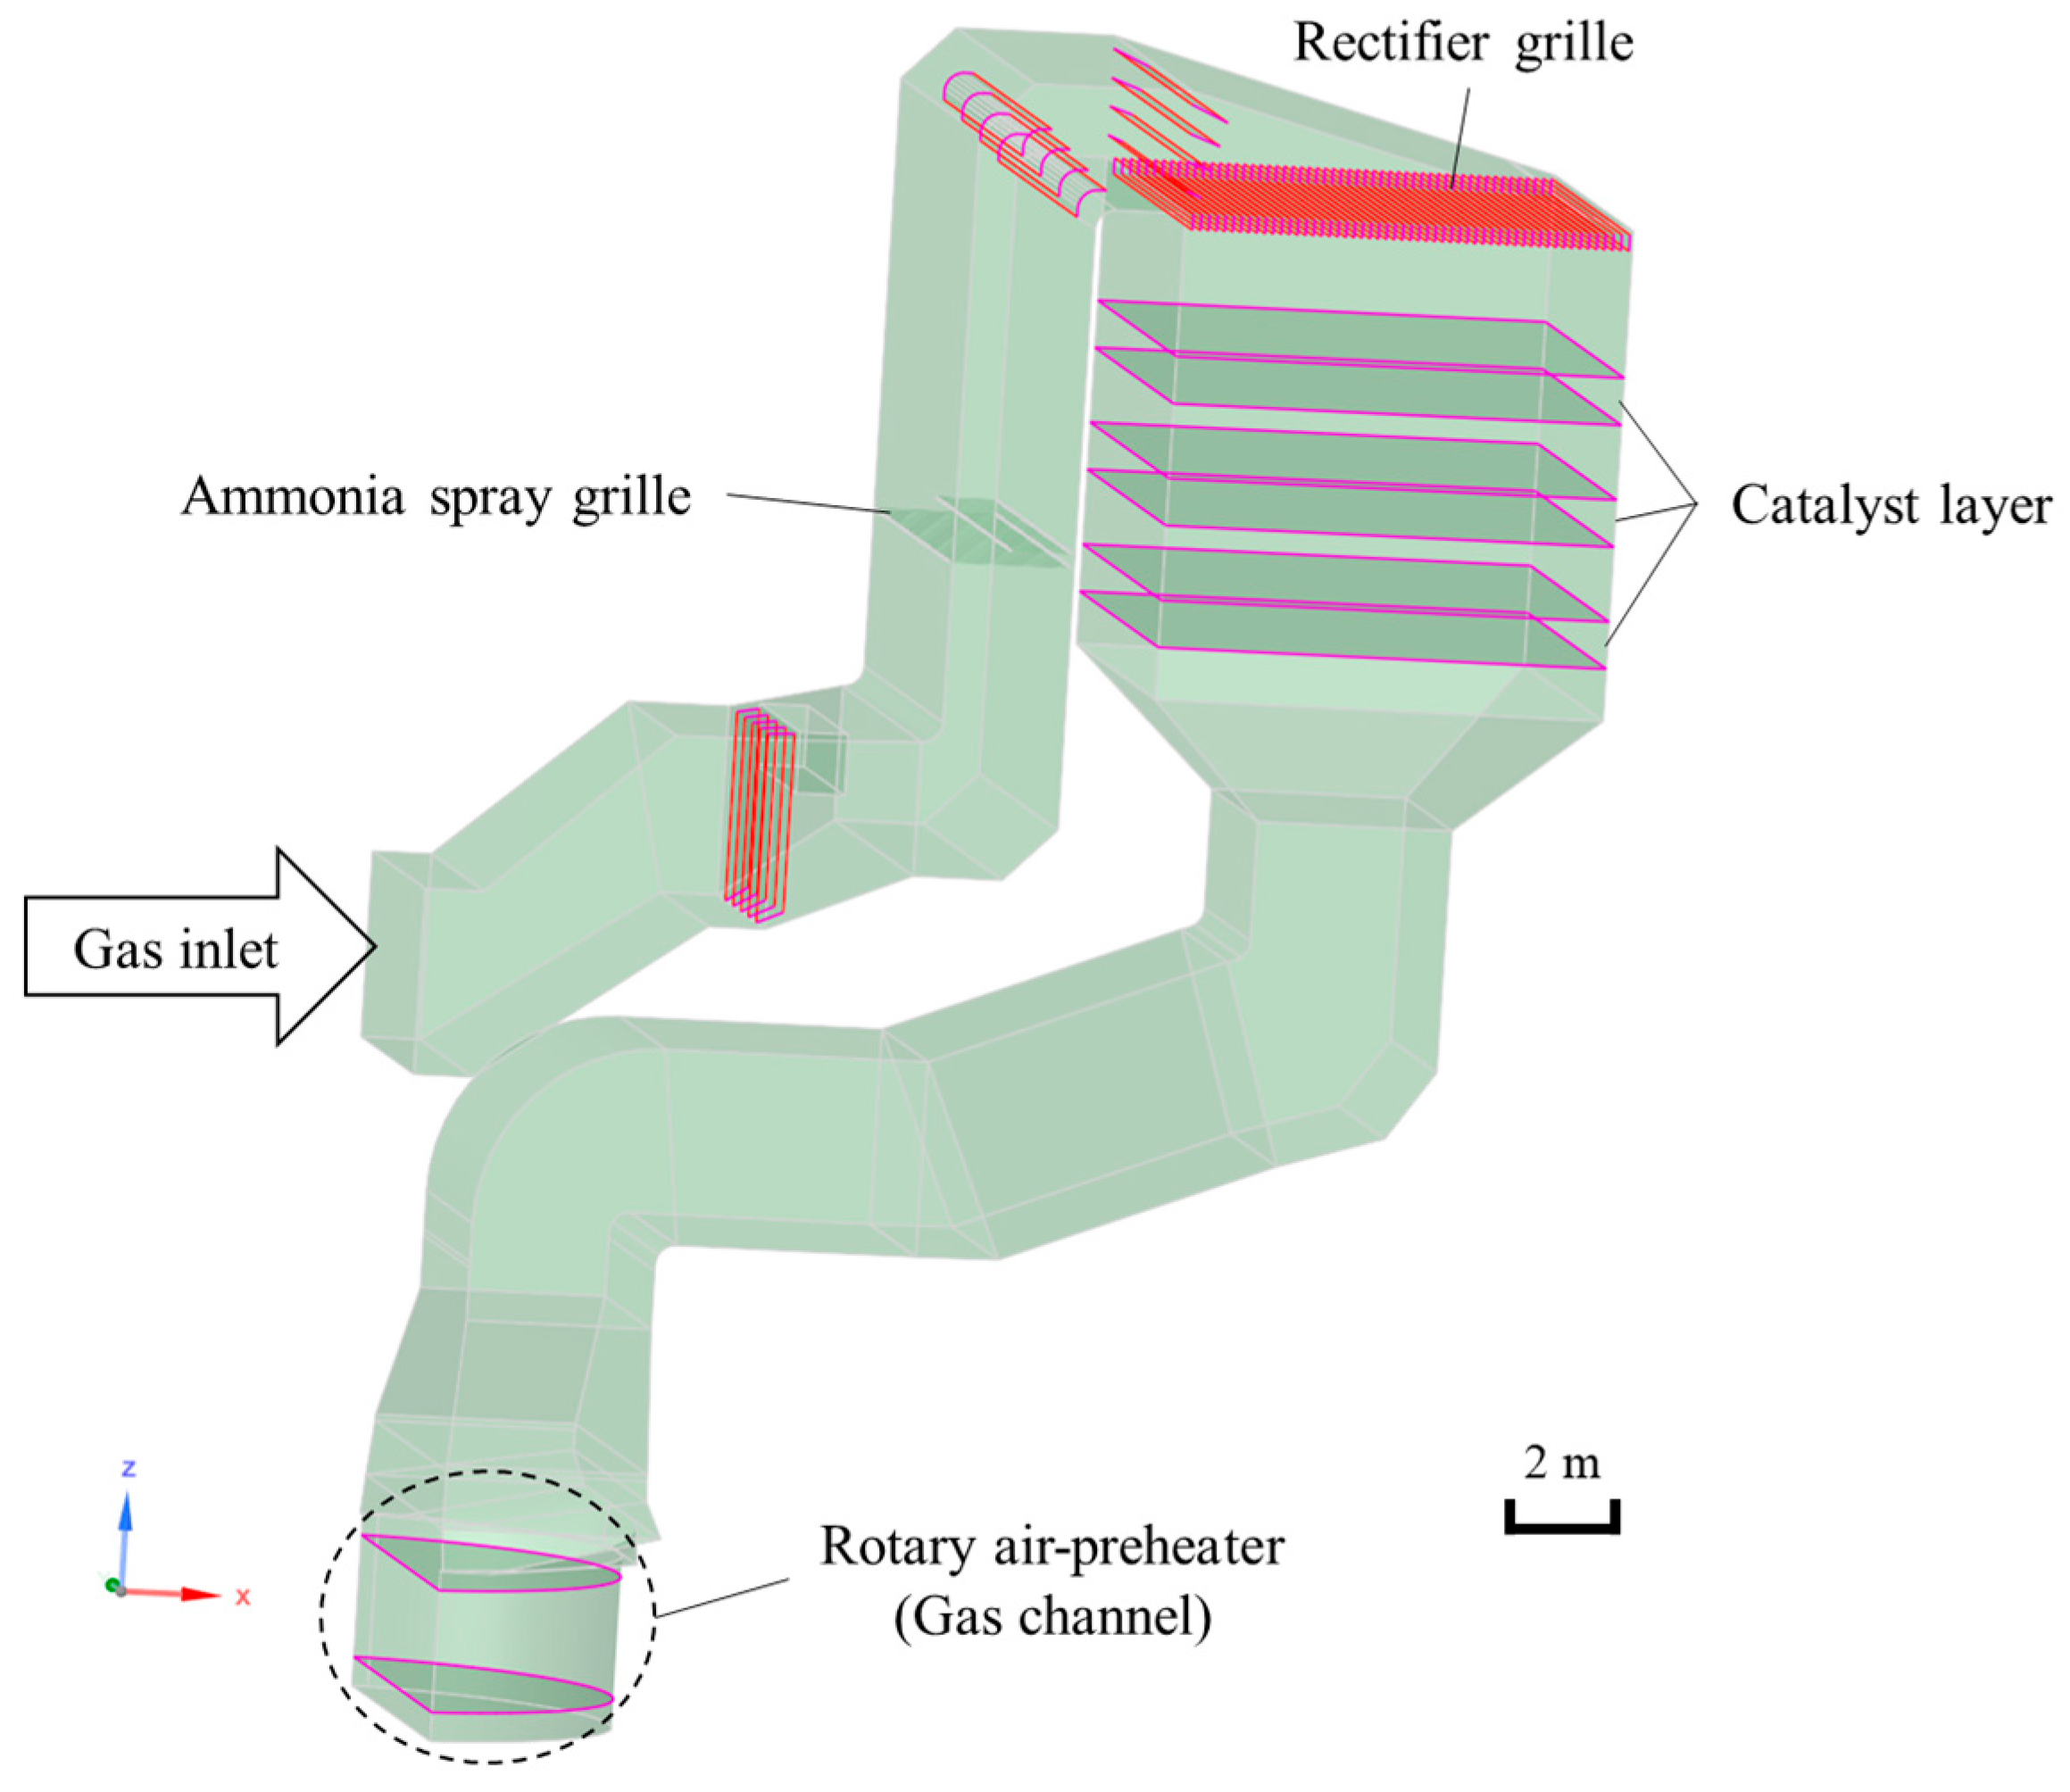
The SCR reactor section at a coal-fired power plant, along with its upstream and downstream flue gas ducts up to the air preheater, was selected as the computational domain, as shown in Figure 1. A set of ammonia spray grilles is installed to inject ammonia, the reducing agent crucial for the NOx removal. Upstream of the catalytic section, some flow guide plates and the rectifier grille are already integrated to promote uniform gas-flow distribution of the SCR inlet. The system features three catalyst layers, which are considered the porous region in the following simulation process. The flue gas flows through the gas channel of the rotary air preheater and enables heat recovery. The rotary air preheater has a rotor diameter of approximately 13.6 m and an effective height of about 3 m. The flue gas duct upstream of the air preheater has a characteristic semicircular cross-section, while the upstream rectangular duct connected to the SCR reactor has a typical cross-sectional size of approximately 8.5 m × 4.5 m. The flue gas path includes a 90° elbow section that connects the horizontal duct to the vertical duct before the air-preheater inlet.

2.2. Calculation Method and Boundary Conditions

Numerical calculations were conducted using Fluent 2020 R2, in which the Realizable k-epsilon turbulence model coupled with the standard wall function was adopted. The Realizable k–ε model was selected due to its good balance between accuracy and computational cost for large-scale industrial duct flows with curvature and moderate flow separation. Flue gas was considered incompressible during the simulation. The governing equations include the conservation of mass equations, the conservation of momentum equations, and the conservation of energy equations. It should be noted that to reduce the computational cost, this study focused on the velocity uniformity due to the strong correlation between the temperature distribution and the velocity distribution [21,22,23]. The conservation equations are shown below:
ρ t + x i ( ρ u i ) = 0
t ( ρ u i ) + x j ( ρ u i u j ) = p x i + τ i j x j + ρ g i + F i
where ρ represents the density of flue gas, ui is the component velocity of flue gas in the i direction, p is the static pressure of flue gas, τ is the stress tensor, gi is the gravitational acceleration, and Fi is other forces. Moreover, in the equations above, the subscripts i and j denote the three-dimensional Cartesian coordinate directions (where 1, 2, and 3 correspond to the x, y, and z axes, respectively). In order to reduce computational cost, the present study focuses primarily on the flow-field characteristics, and the energy equation was not explicitly solved. The flue gas entering the SCR system was assumed to be a homogeneous gas mixture with constant thermophysical properties. The density and dynamic viscosity of the flue gas were taken. At the velocity inlet, the turbulence intensity was specified as 5%, and the hydraulic diameter was determined according to the characteristic size of the inlet duct. All solid surfaces were treated as no-slip walls. The walls were assumed to be adiabatic since the present study mainly focuses on the flow-field characteristics rather than detailed heat transfer processes.
The three catalyst layers were considered as porous medium regions by activating the ‘porous zone’ and ‘laminar flow’ settings. The porous medium regions were simulated by adding a momentum source term to the momentum equation, which required the specification of two key parameters, the viscous resistance coefficient (1/α) and the inertial resistance coefficient (C2) [24]. These two parameters can be expressed as follows:
1 α = 287.32 d 2 1 ε 2 ε 3
C 2 = 0.06592 d 1 ε ε
where d refers to the inner diameter of openings, and ε is the porosity of the catalyst. In the preliminary work, based on the catalyst parameters (inner diameter of openings: 7.1 mm; wall thickness: 1.1 mm; porosity: 73%), the equivalent actual resistance coefficients of the SCR reactors could be obtained. Specifically, the viscous resistance coefficient was 1,068,095 m−2, and the inertial resistance coefficient was 6.44 m−1. A velocity inlet (10 m/s) and a pressure outlet (−1400 Pa) were employed. The SIMPLE algorithm was selected for equation solving, and the second-order upwind scheme was adopted for discretization. The numerical solution was considered converged when the normalized residuals of all governing equations decreased below 10−4, and the monitored quantities, including the area-averaged velocity at the air-preheater inlet and the overall pressure drop of the system, showed negligible variation with further iterations.

2.3. Grid Independence and Evaluation Index

Fluent Meshing software was employed to generate the mesh. To ensure the grid independence of the computational results, the grid sensitivity analysis was conducted. Four grids with different resolutions were constructed, containing approximately 1.0, 1.8, 2.3, and 3.8 million elements, respectively. All grids incorporated curvature tracking and slit tracking to accurately capture geometric features. The coefficient of variance (CV) of the outlet velocity was evaluated. CV is the ratio of standard deviation to the average property of the flow field at the cross-section [25], which is defined as follows:
CV = σ v ¯ × 100 %
σ = 1 n 1 i = 1 n v i v ¯ 2
where σ is the standard deviation, vi is the local velocity at the i th sample point, and v ¯ is the area-averaged velocity.
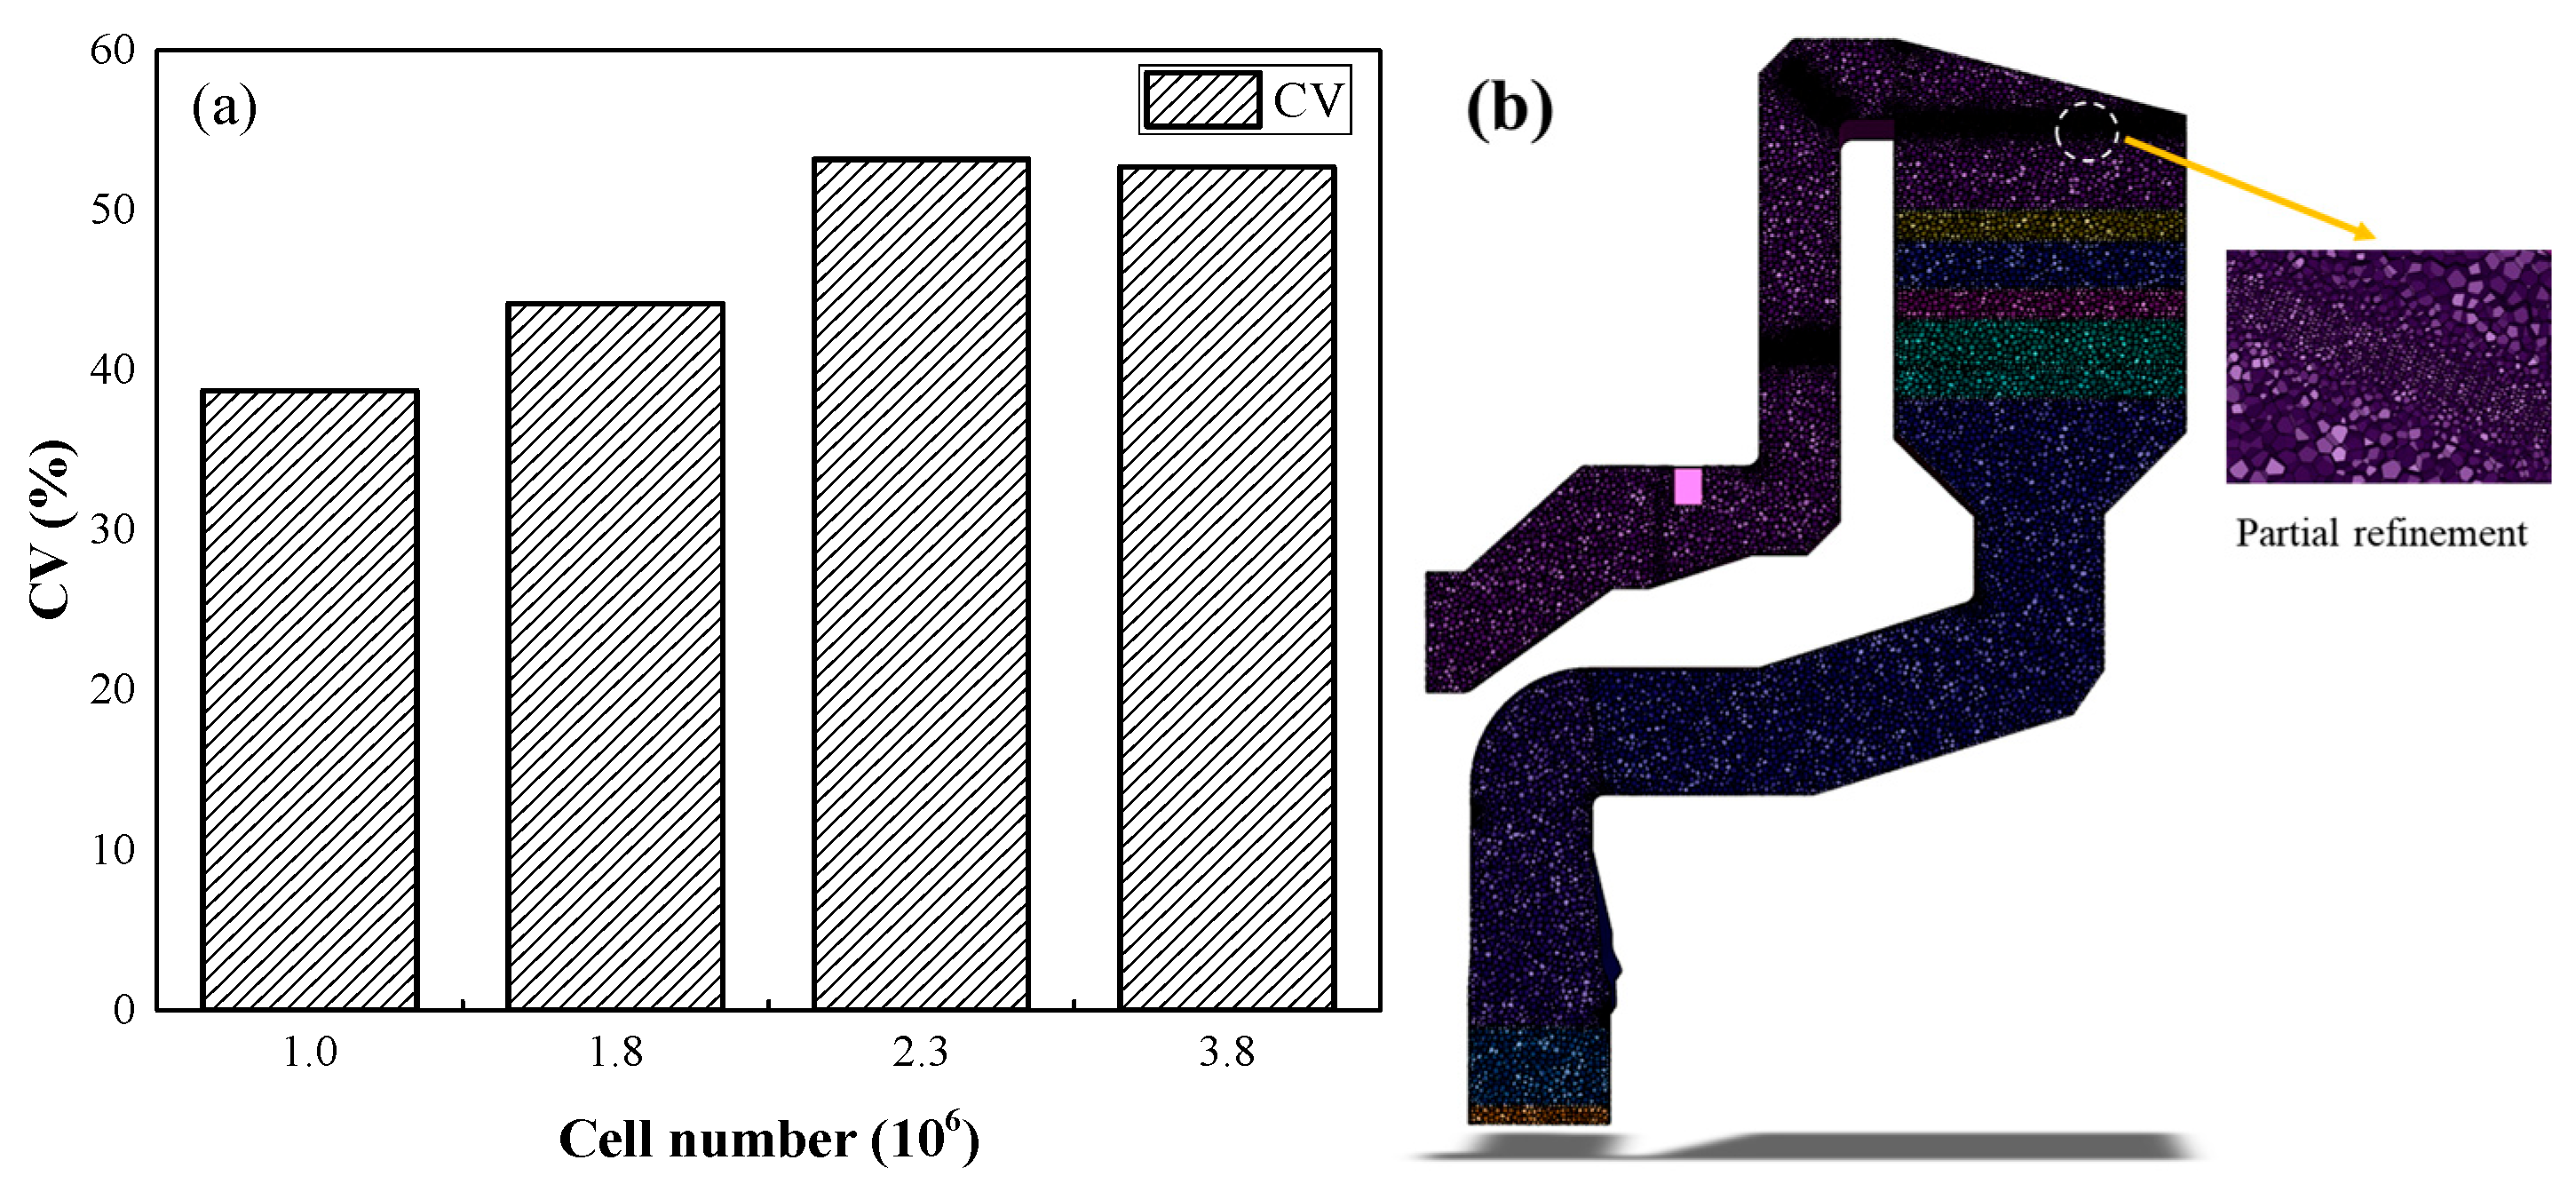
The simulation result in Figure 2a indicated that as grid resolution increased, the variation in key physical quantities progressively diminished, with the difference between the 2.3-million grid and the 3.8-million grid being less than 1%, demonstrating that the 2.3-million grid sufficiently balances computational accuracy and efficiency. Consequently, the medium grid with approximately 2.3 million cells was selected for subsequent calculations, where the minimum surface mesh size was set to 20 mm, and the maximum size was set to 250 mm. The generated mesh is shown in Figure 2b.

2.4. Novel Evaluation Index

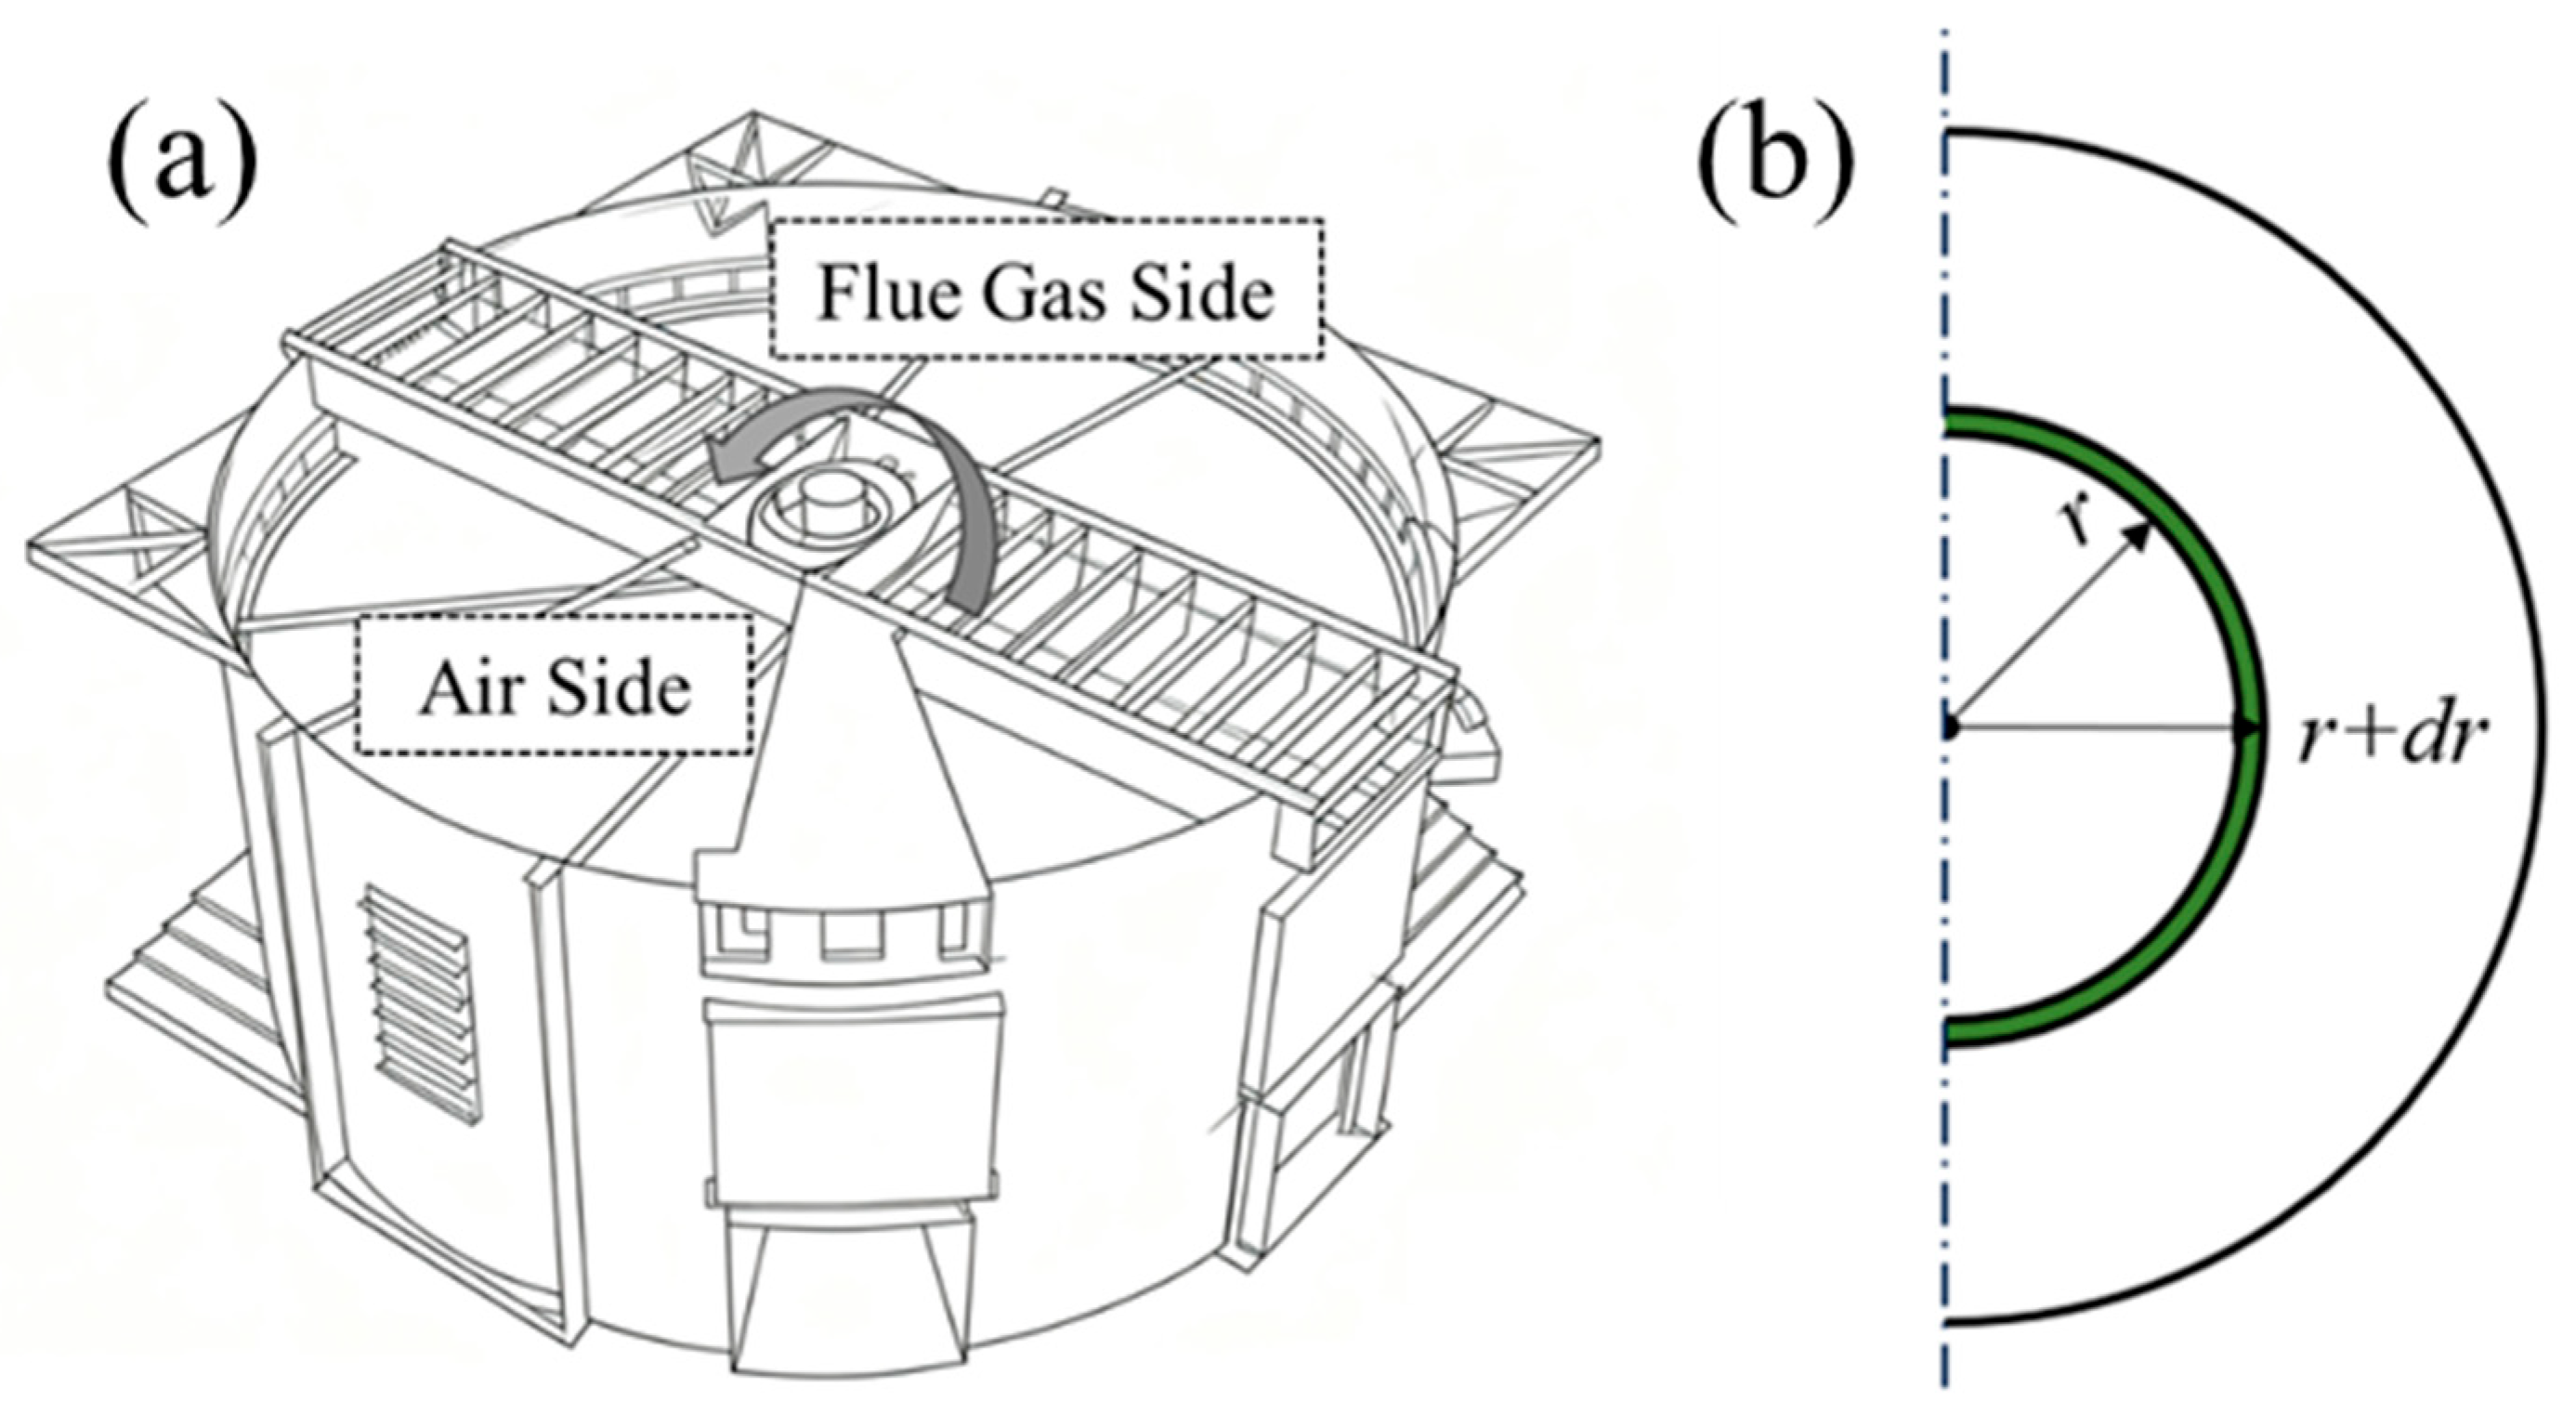
Previous studies evaluating flow distribution in SCR systems and flue gas ducts mainly adopted cross-sectional indicators, such as the coefficient of variation. These indicators describe the overall non-uniformity of the velocity field but do not explicitly reflect the radial distribution characteristics at the inlet of rotary air preheaters. Moreover, considering the fact that ABS deposited in low-velocity zones decomposes again when rotating into high-velocity regions, we proposed a new index, the radial coefficient of variation (CV2), which uses an annular discrete sampling method to evaluate the flow uniformity of the inlet flue gas of the air preheater. The schematic figure is shown in Figure 3. Specifically, the semi-circular flue gas side of the air preheater is radially divided into n annular regions with equal width (dr = 0.25 m). For each region, the average velocity ( v i ¯ ) is calculated by averaging all velocity measurement points within it. CV2 is then defined as the ratio of the standard deviation of these regional average velocities to the area-weighted overall average velocity of the air preheater, i.e., the same as Equation (6).
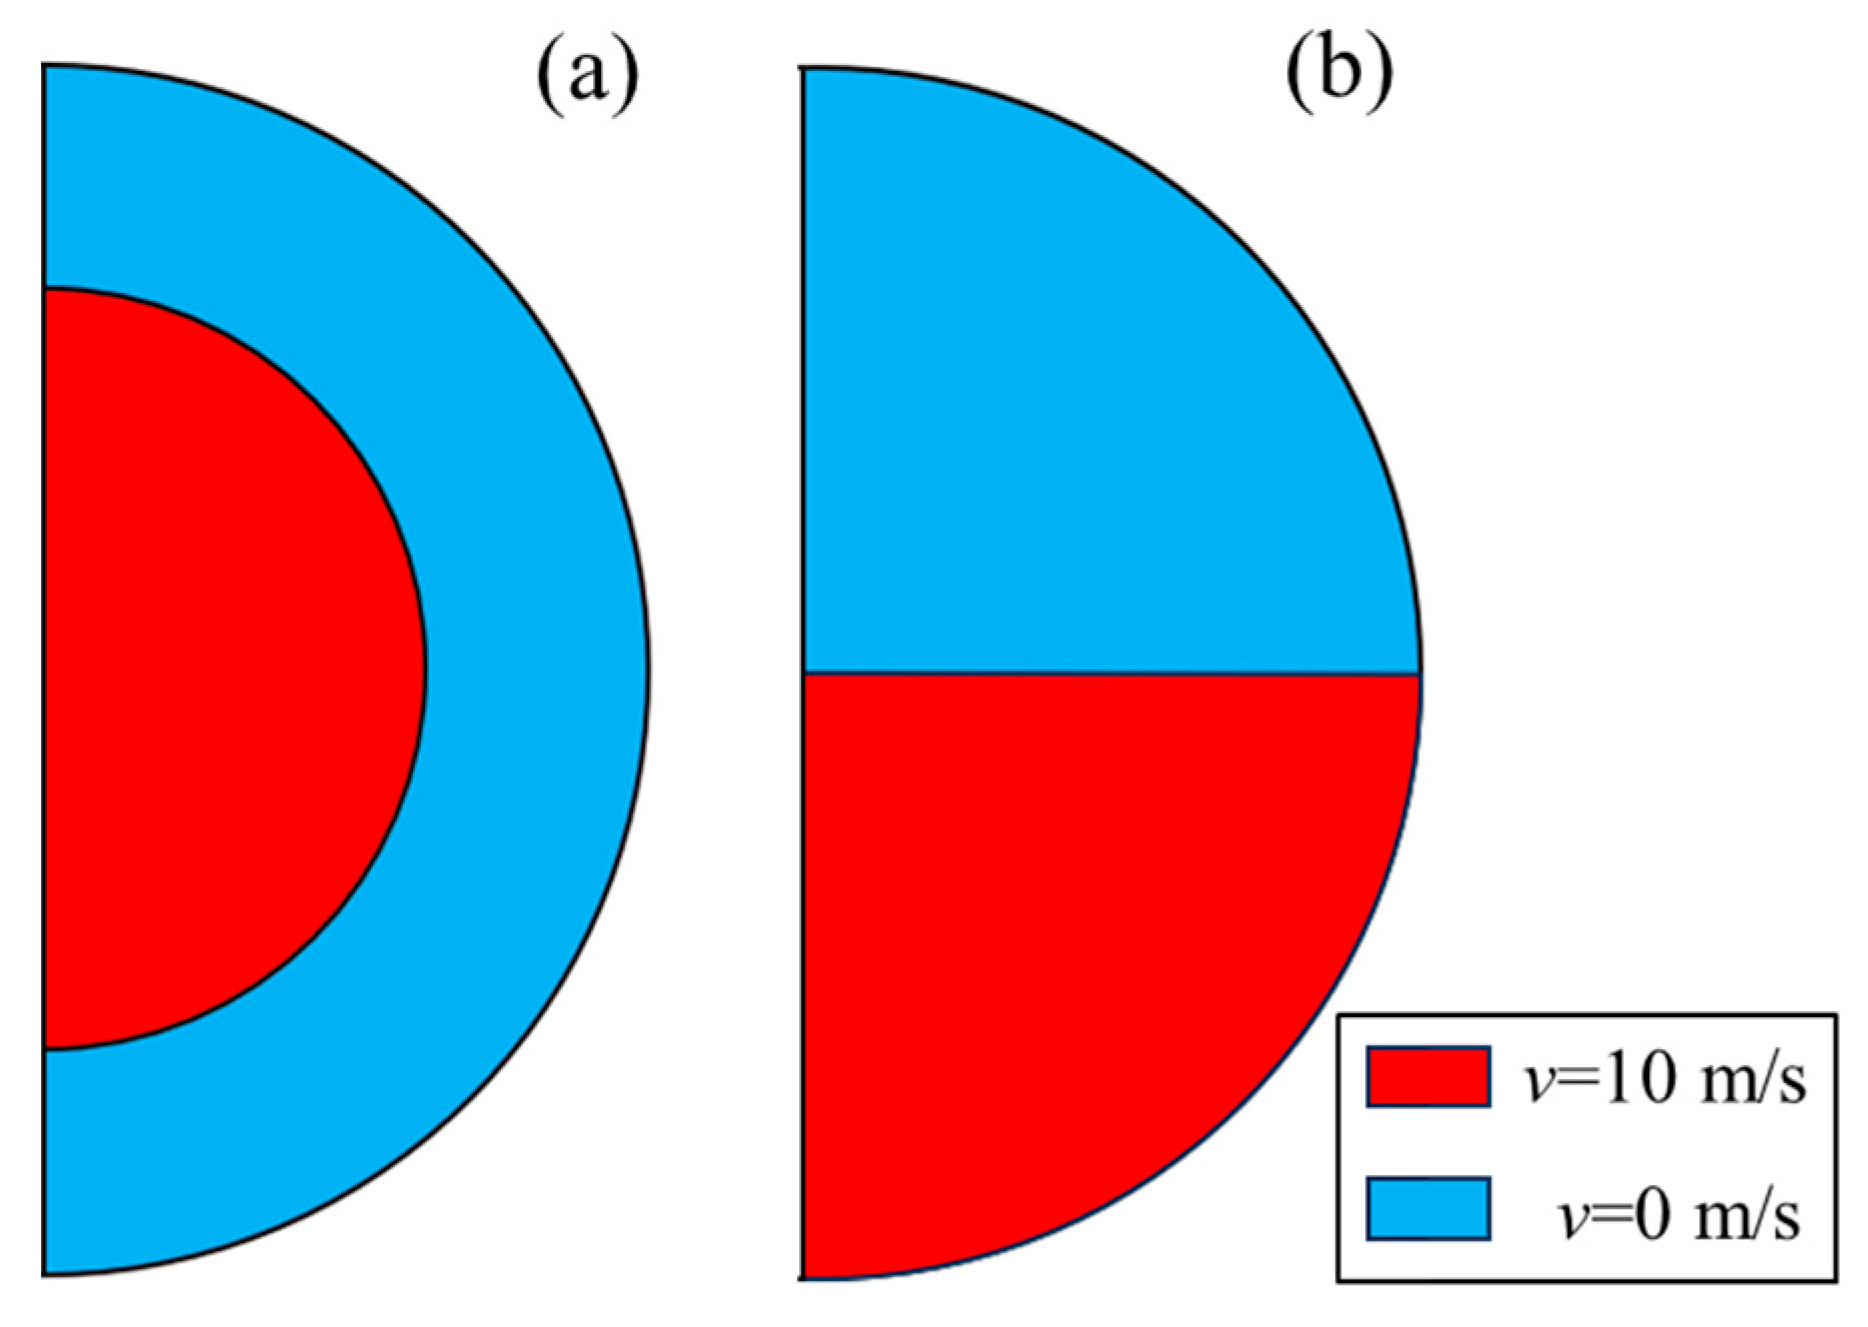
To further clarify the above two evaluation indices, the traditional CV is named as CV1 in the following discussion. For illustration, two artificial velocity distributions of the air-preheater inlet in Figure 4 are presented to clarify the differences between the two indicators. The red part represents the high-velocity region (i.e., the high-temperature region), and the blue part represents the low-velocity region (i.e., the low-temperature region). As to the two distributions in Figure 4a,b, the area of the red part is equivalent to the area of the blue part. It is evident that the two cases share the same high value of CV1, which indicates an undesirable flow uniformity from the traditional perspective. However, although the CV2 of Case 1 is still high, the CV2 of Case 2 is approximately 0. It indicates that for Case 2, the ABS that may deposit in the low-velocity region will gradually enter the high-velocity region as the air-preheater rotates, thereby decomposing. In contrast, for Case 1, the rotation fails to realize the exchange between high-velocity and low-velocity regions. Consequently, ABS deposition in the low-velocity region could be intensified, while the high-velocity regions are at high risk of wear, which is detrimental to safe operation. Overall, CV2 can be regarded as a less stringent version of CV1, i.e., the cross-sectional velocity uniformity that incorporates the motion characteristics of the air-preheater. The threshold of CV < 15% is defined in accordance with the industrial technical specification JB/T 12131-2015 [26] (technical specification for flow field simulation test of SCR flue gas denitrification). By adopting this criterion for the air-preheater inlet, the optimization goal aligns with the stringent safety requirements of coal-fired power plants for mitigating ammonium bisulfate (ABS) deposition.

3. Results

3.1. Original Design

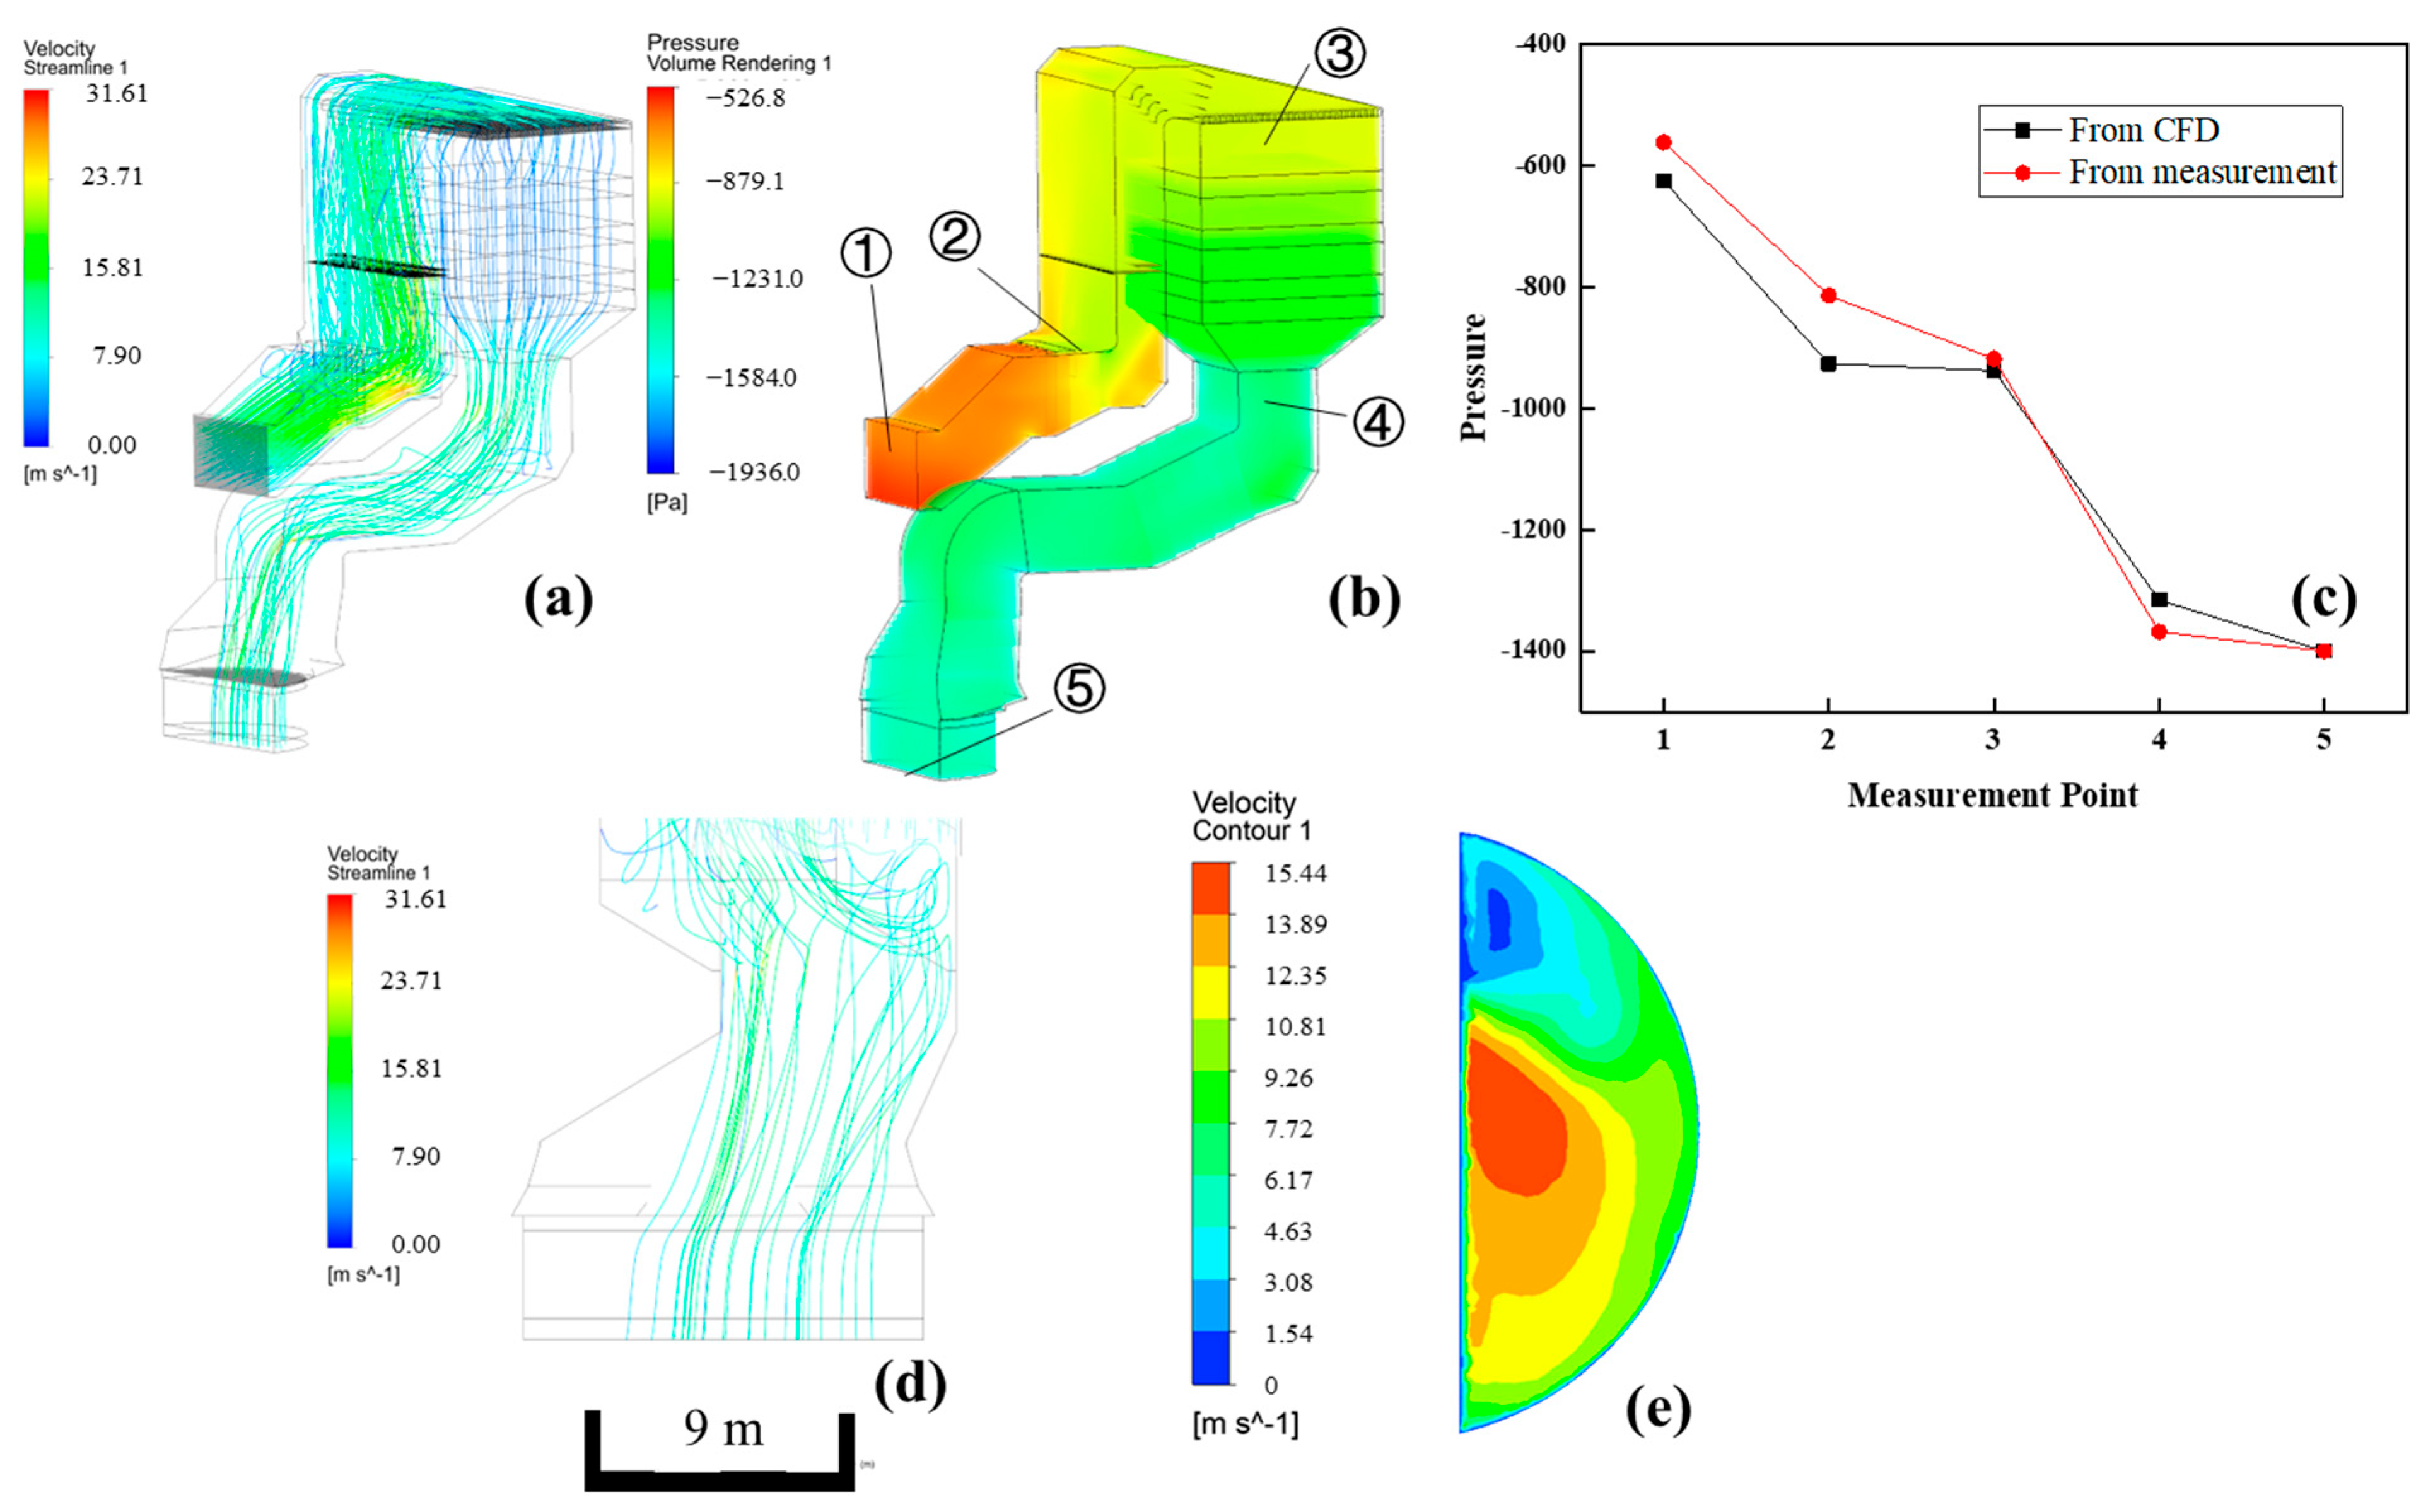
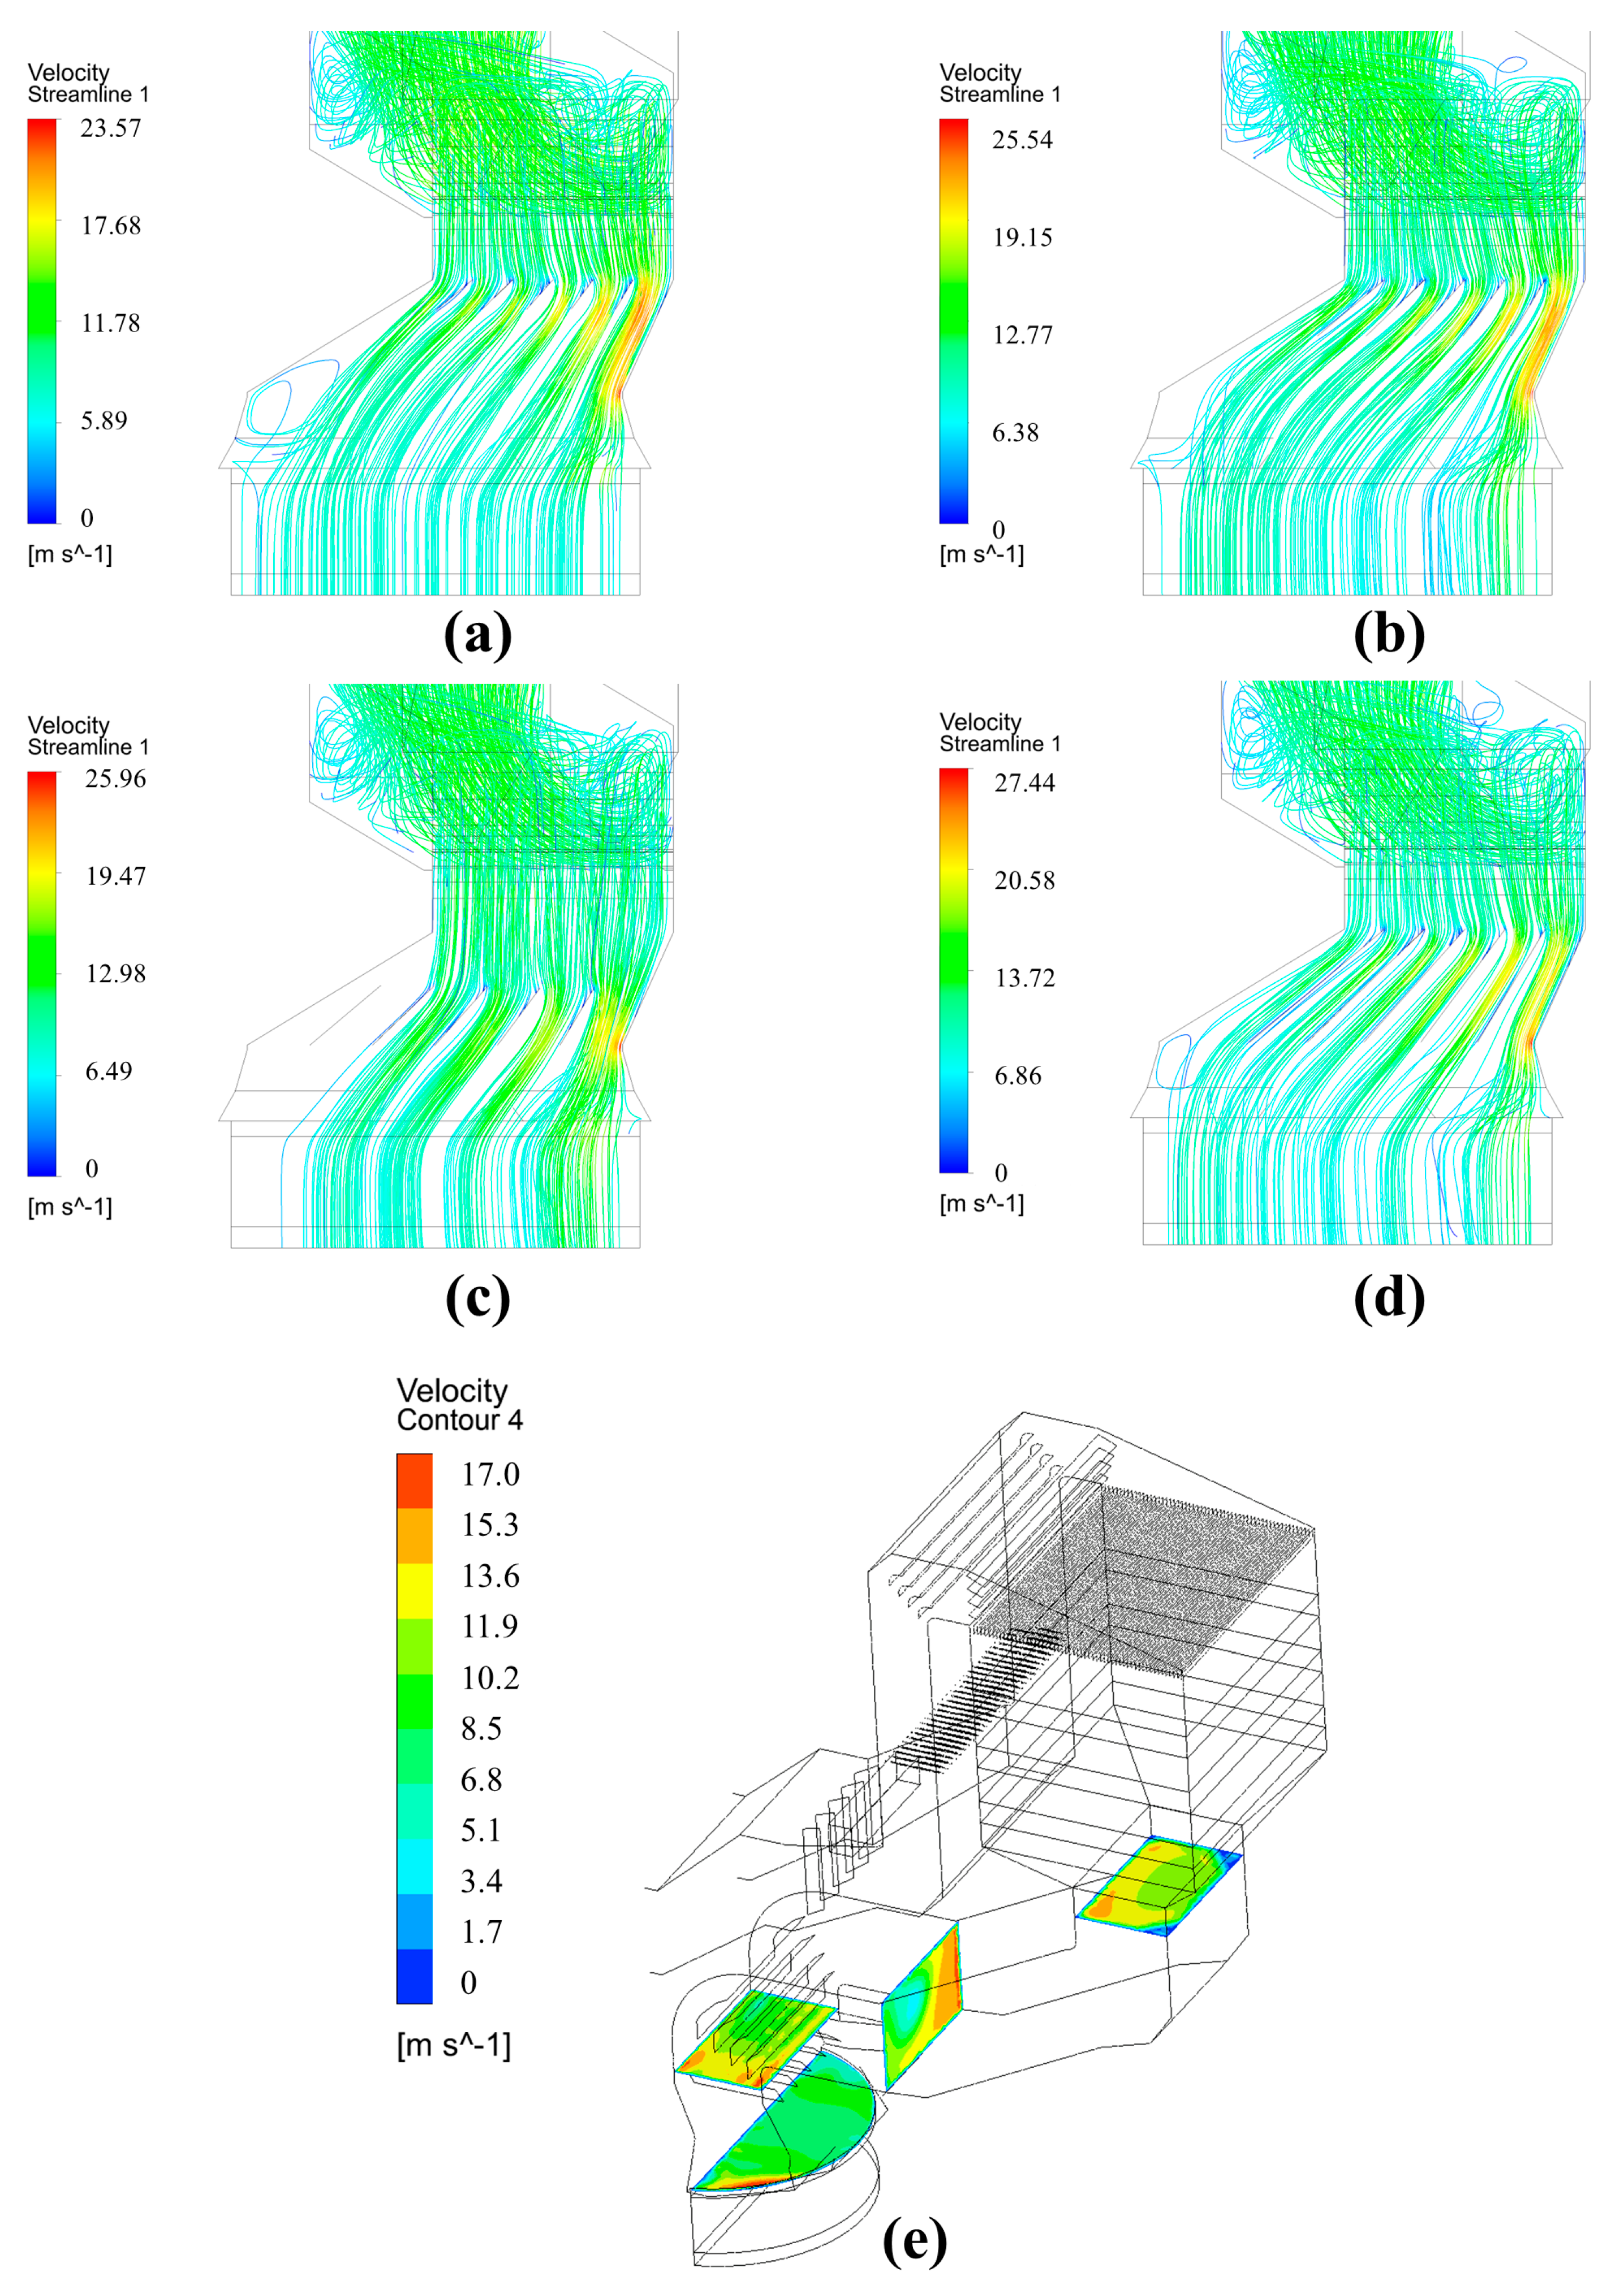
Figure 5 presents the flow field of the original SCR De-NOx system and its connected flue duct. From Figure 5a, although the overall flow field exhibits reasonable general behavior, separation-induced eddies are observed at some elbow sections. For pressure characteristics in Figure 5b, the primary pressure drop (approximately 1294 Pa) originates from the inlet expansion section and the three catalyst layers, where the streamlines are almost vertical with the catalyst layer and the flow exhibits the typical laminar characteristics. To verify the reliability of CFD simulations, five key measurement points in Figure 5b were strategically arranged along the flue gas path, as illustrated in Figure 5b. Figure 5c presents a comparison between the numerically predicted static pressures and the field-measured data at these locations. It can be observed that the simulation results show high consistency with experimental measurements. The maximum deviation remains within an acceptable engineering range, primarily occurring at the expansion section and catalyst layers. This close agreement demonstrates that the current numerical framework and boundary conditions can accurately characterize the internal flow field and pressure characteristics of the De-NOx system.
Notably, as shown in Figure 5d, flow maldistribution (i.e., bias flow) occurs at the air-preheater inlet. From the velocity contour in Figure 5e, it can be observed that the velocity flow at the air-preheater inlet is uneven (which is highly consistent with Case 1 shown in Figure 5a), with partial wall-attached flow present. Specifically, the flow velocity is maximized at the center of the semicircular section, and the overall velocity decreases as the radial distance increases. Based on the analysis of the CV values, CV1 is 53.2%, and CV2 is 30.7%, indicating that the velocity distribution uniformity is unsatisfactory, particularly with uneven velocity distribution in the radial direction.
These pre-optimization flow features, including eddies at elbows, bias flow, and high pressure drop, pose non-negligible risks. The biased flow at the air-preheater inlet may exacerbate ABS deposition in the region near the center of the semicircle and cause wear in the region far from the center of the semicircle and close to its edge, while the concentrated pressure drop could reduce the system’s energy efficiency, collectively highlighting the necessity of subsequent flow field optimization.

3.2. Single-Side Arrangement

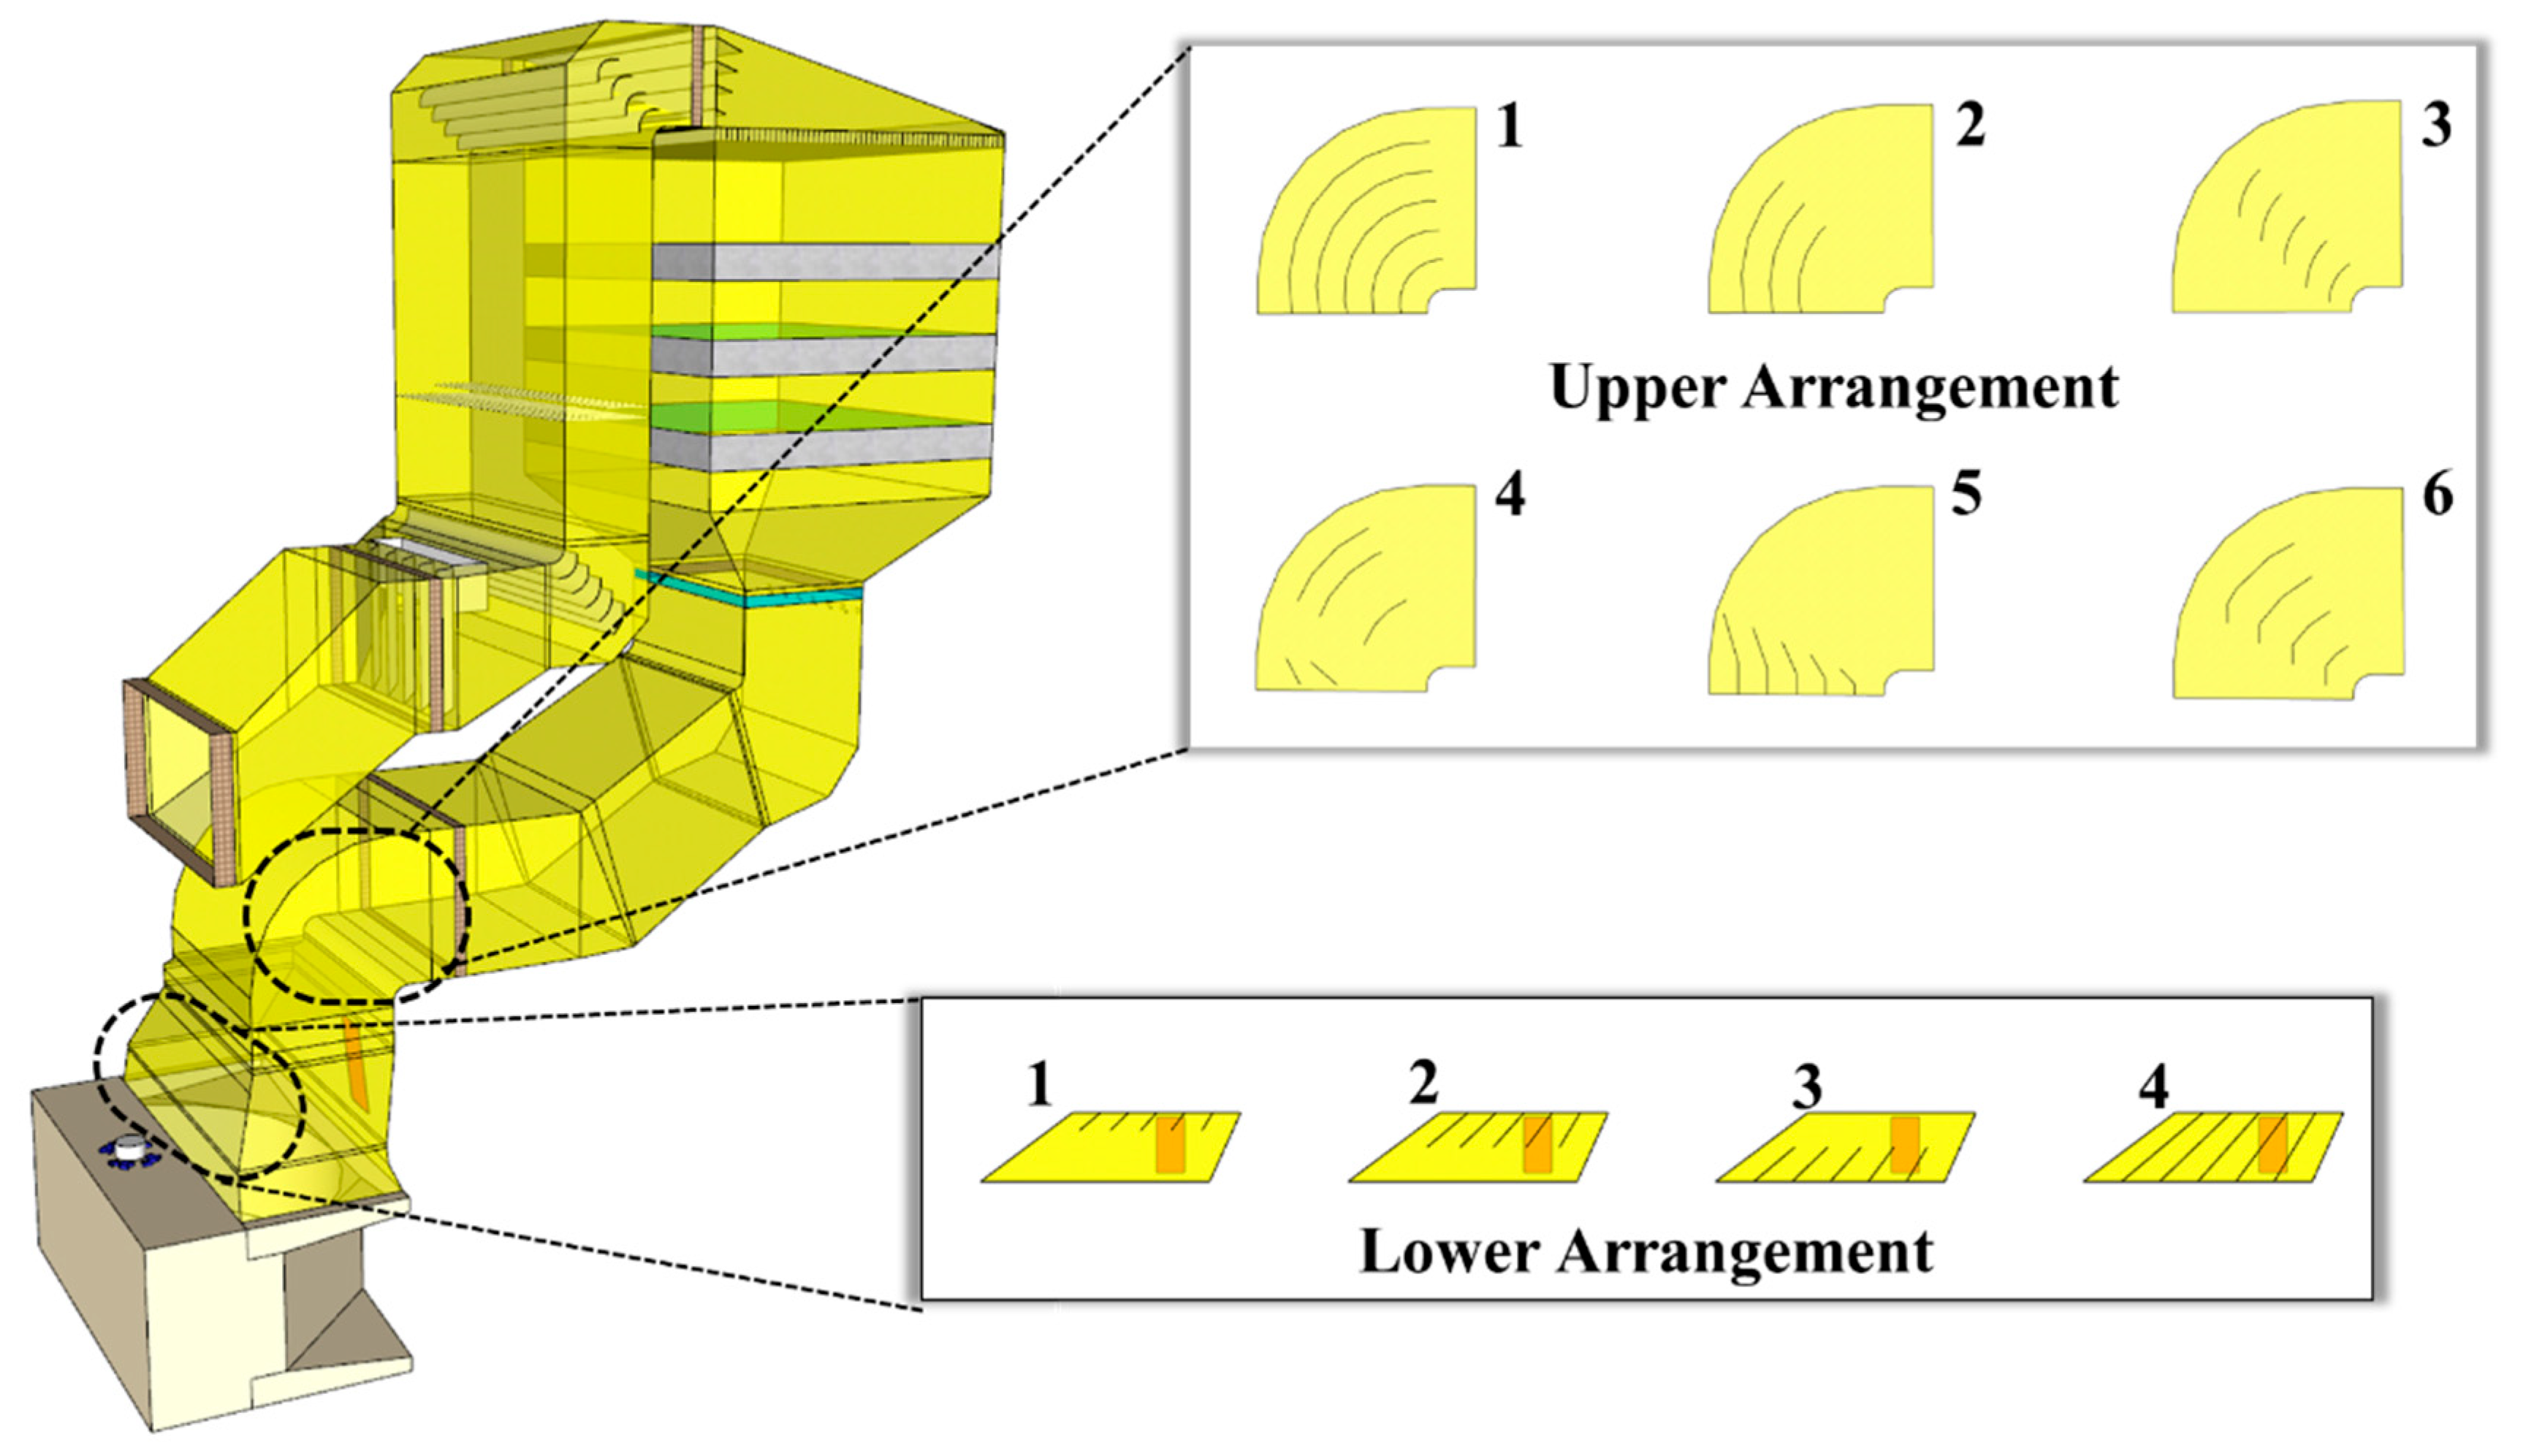
The arrangement of the flow guide plates is illustrated in Figure 6. The flow guide plates are installed in the two regions most prone to flow separation. One at the elbow (the six Upper configurations) and the other at the bell mouth above the air preheater (the 4 lower configurations). To facilitate comparative analysis, all boundary conditions and simulation methods remain identical across the different design cases. Considering practical constraints such as construction difficulty and operation cost, the numerical simulation will first be conducted for the six options at the elbow section (i.e., Upper 1 to Upper 6). The configuration that demonstrates relatively superior performance in both flow uniformity and pressure drop will be selected. Subsequently, based on this optimal elbow configuration, further simulations will be performed to evaluate the guide plates at the lower bell mouth section (i.e., Lower 1 to Lower 4). Detailed description is shown in Table 1.
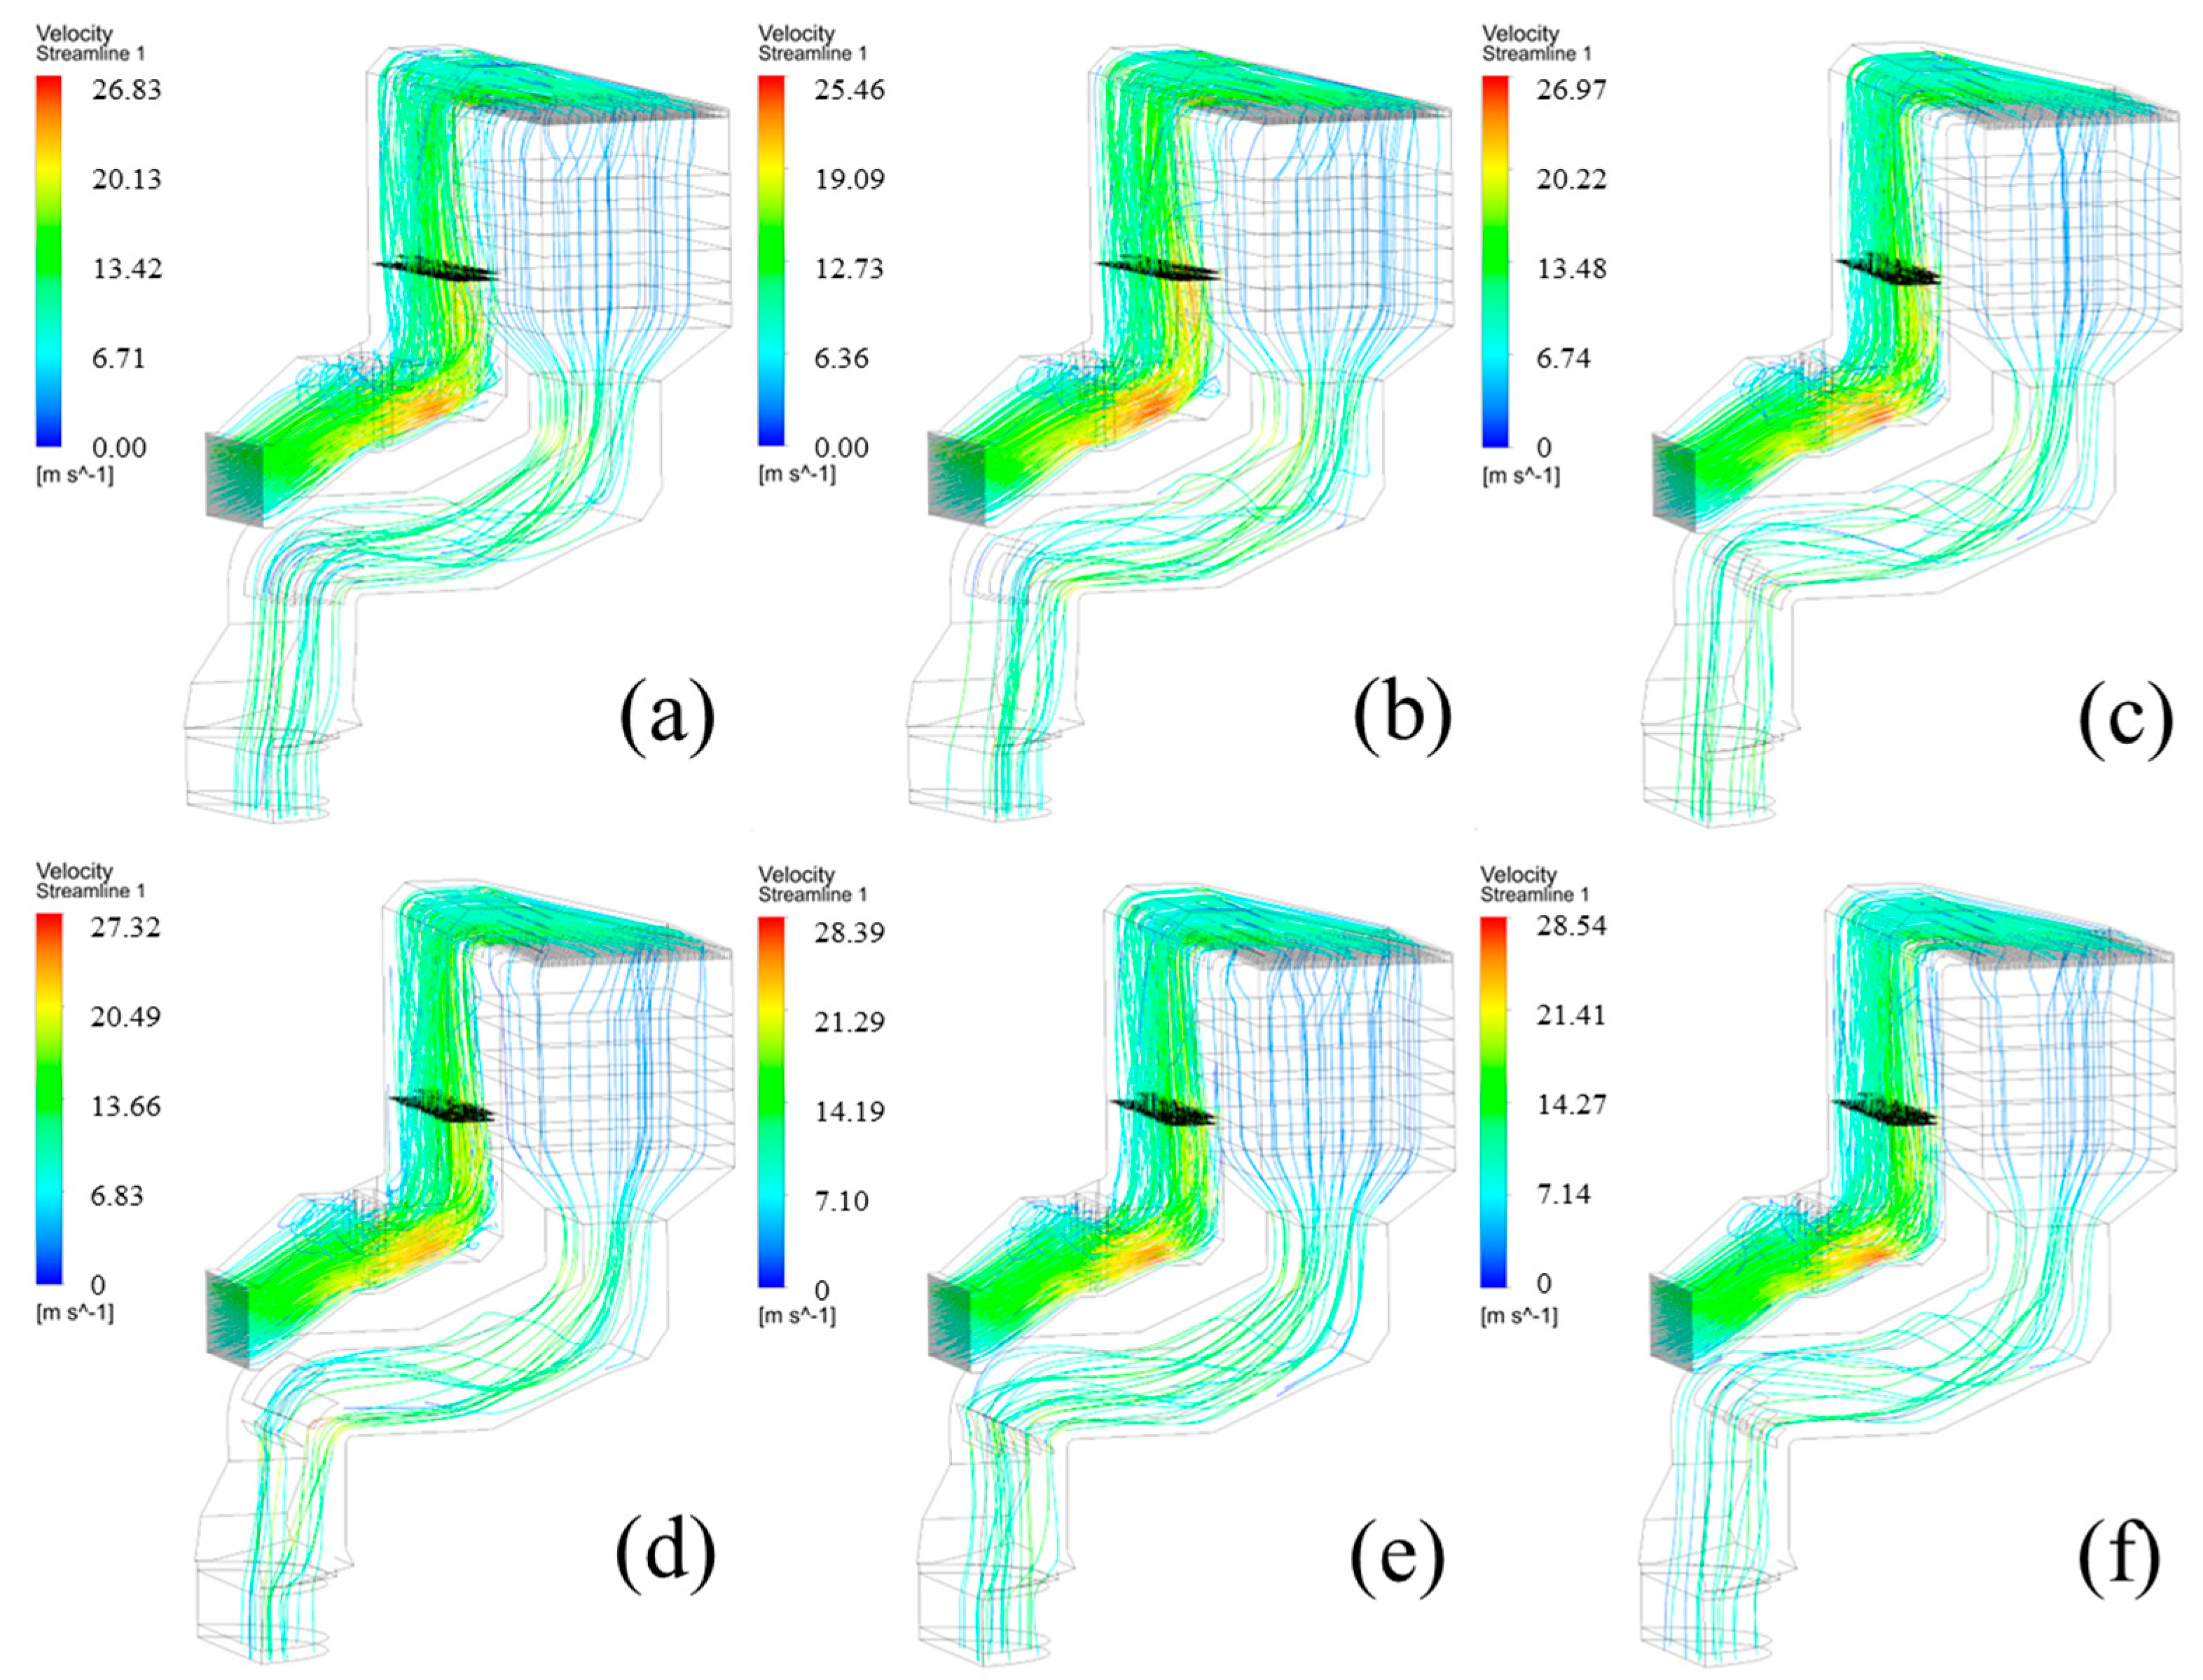
To reduce the high-velocity region near the center of the air-preheater inlet, multiple flow-guide configurations (Upper 1 to Upper 6) were implemented at the elbow. These structures are designed to divert a portion of the flue gas earlier, prompting its transition and redirection, while simultaneously guiding wall-adjacent flue gas back. Figure 7 presents the flow field visualization for configurations Upper 1 to Upper 6. It is observed that the overall flow patterns are similar across the different guide plate arrangements. Compared with Figure 7a, the uniformity of the streamline distribution has been improved to some extent. Noticeable changes in the pressure field are evident with some of the configurations, which will be addressed in the subsequent discussion.
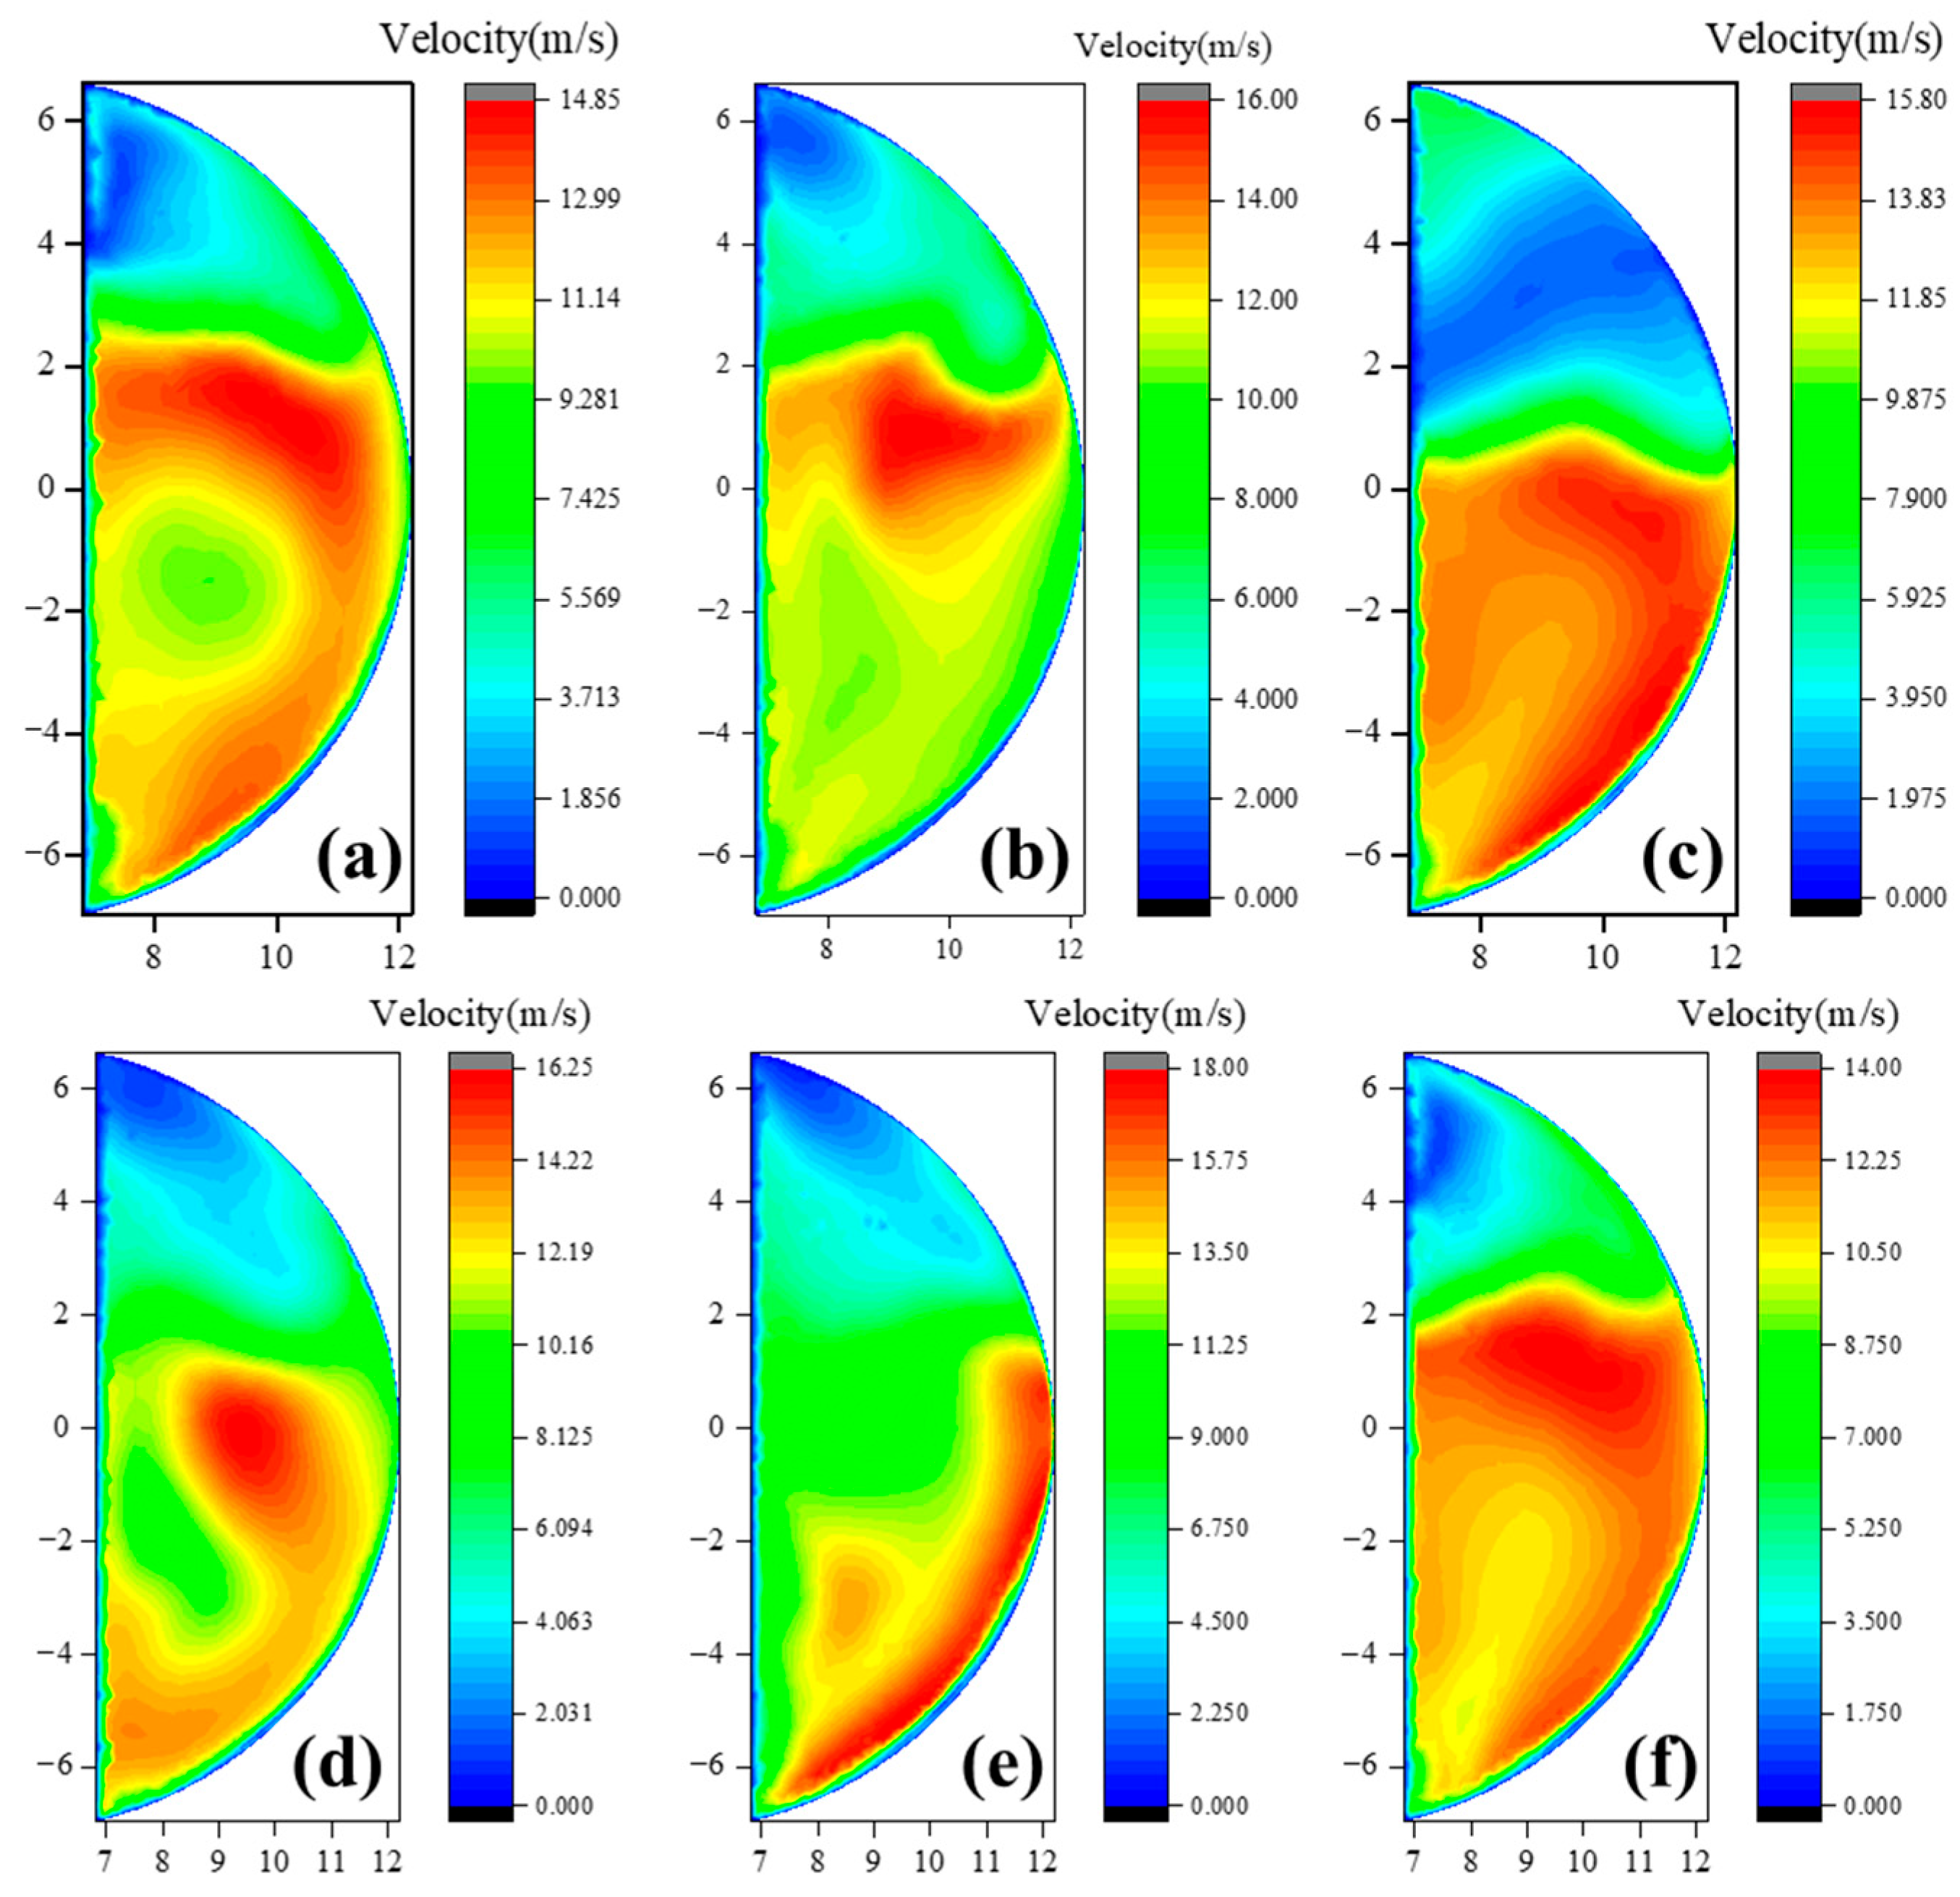
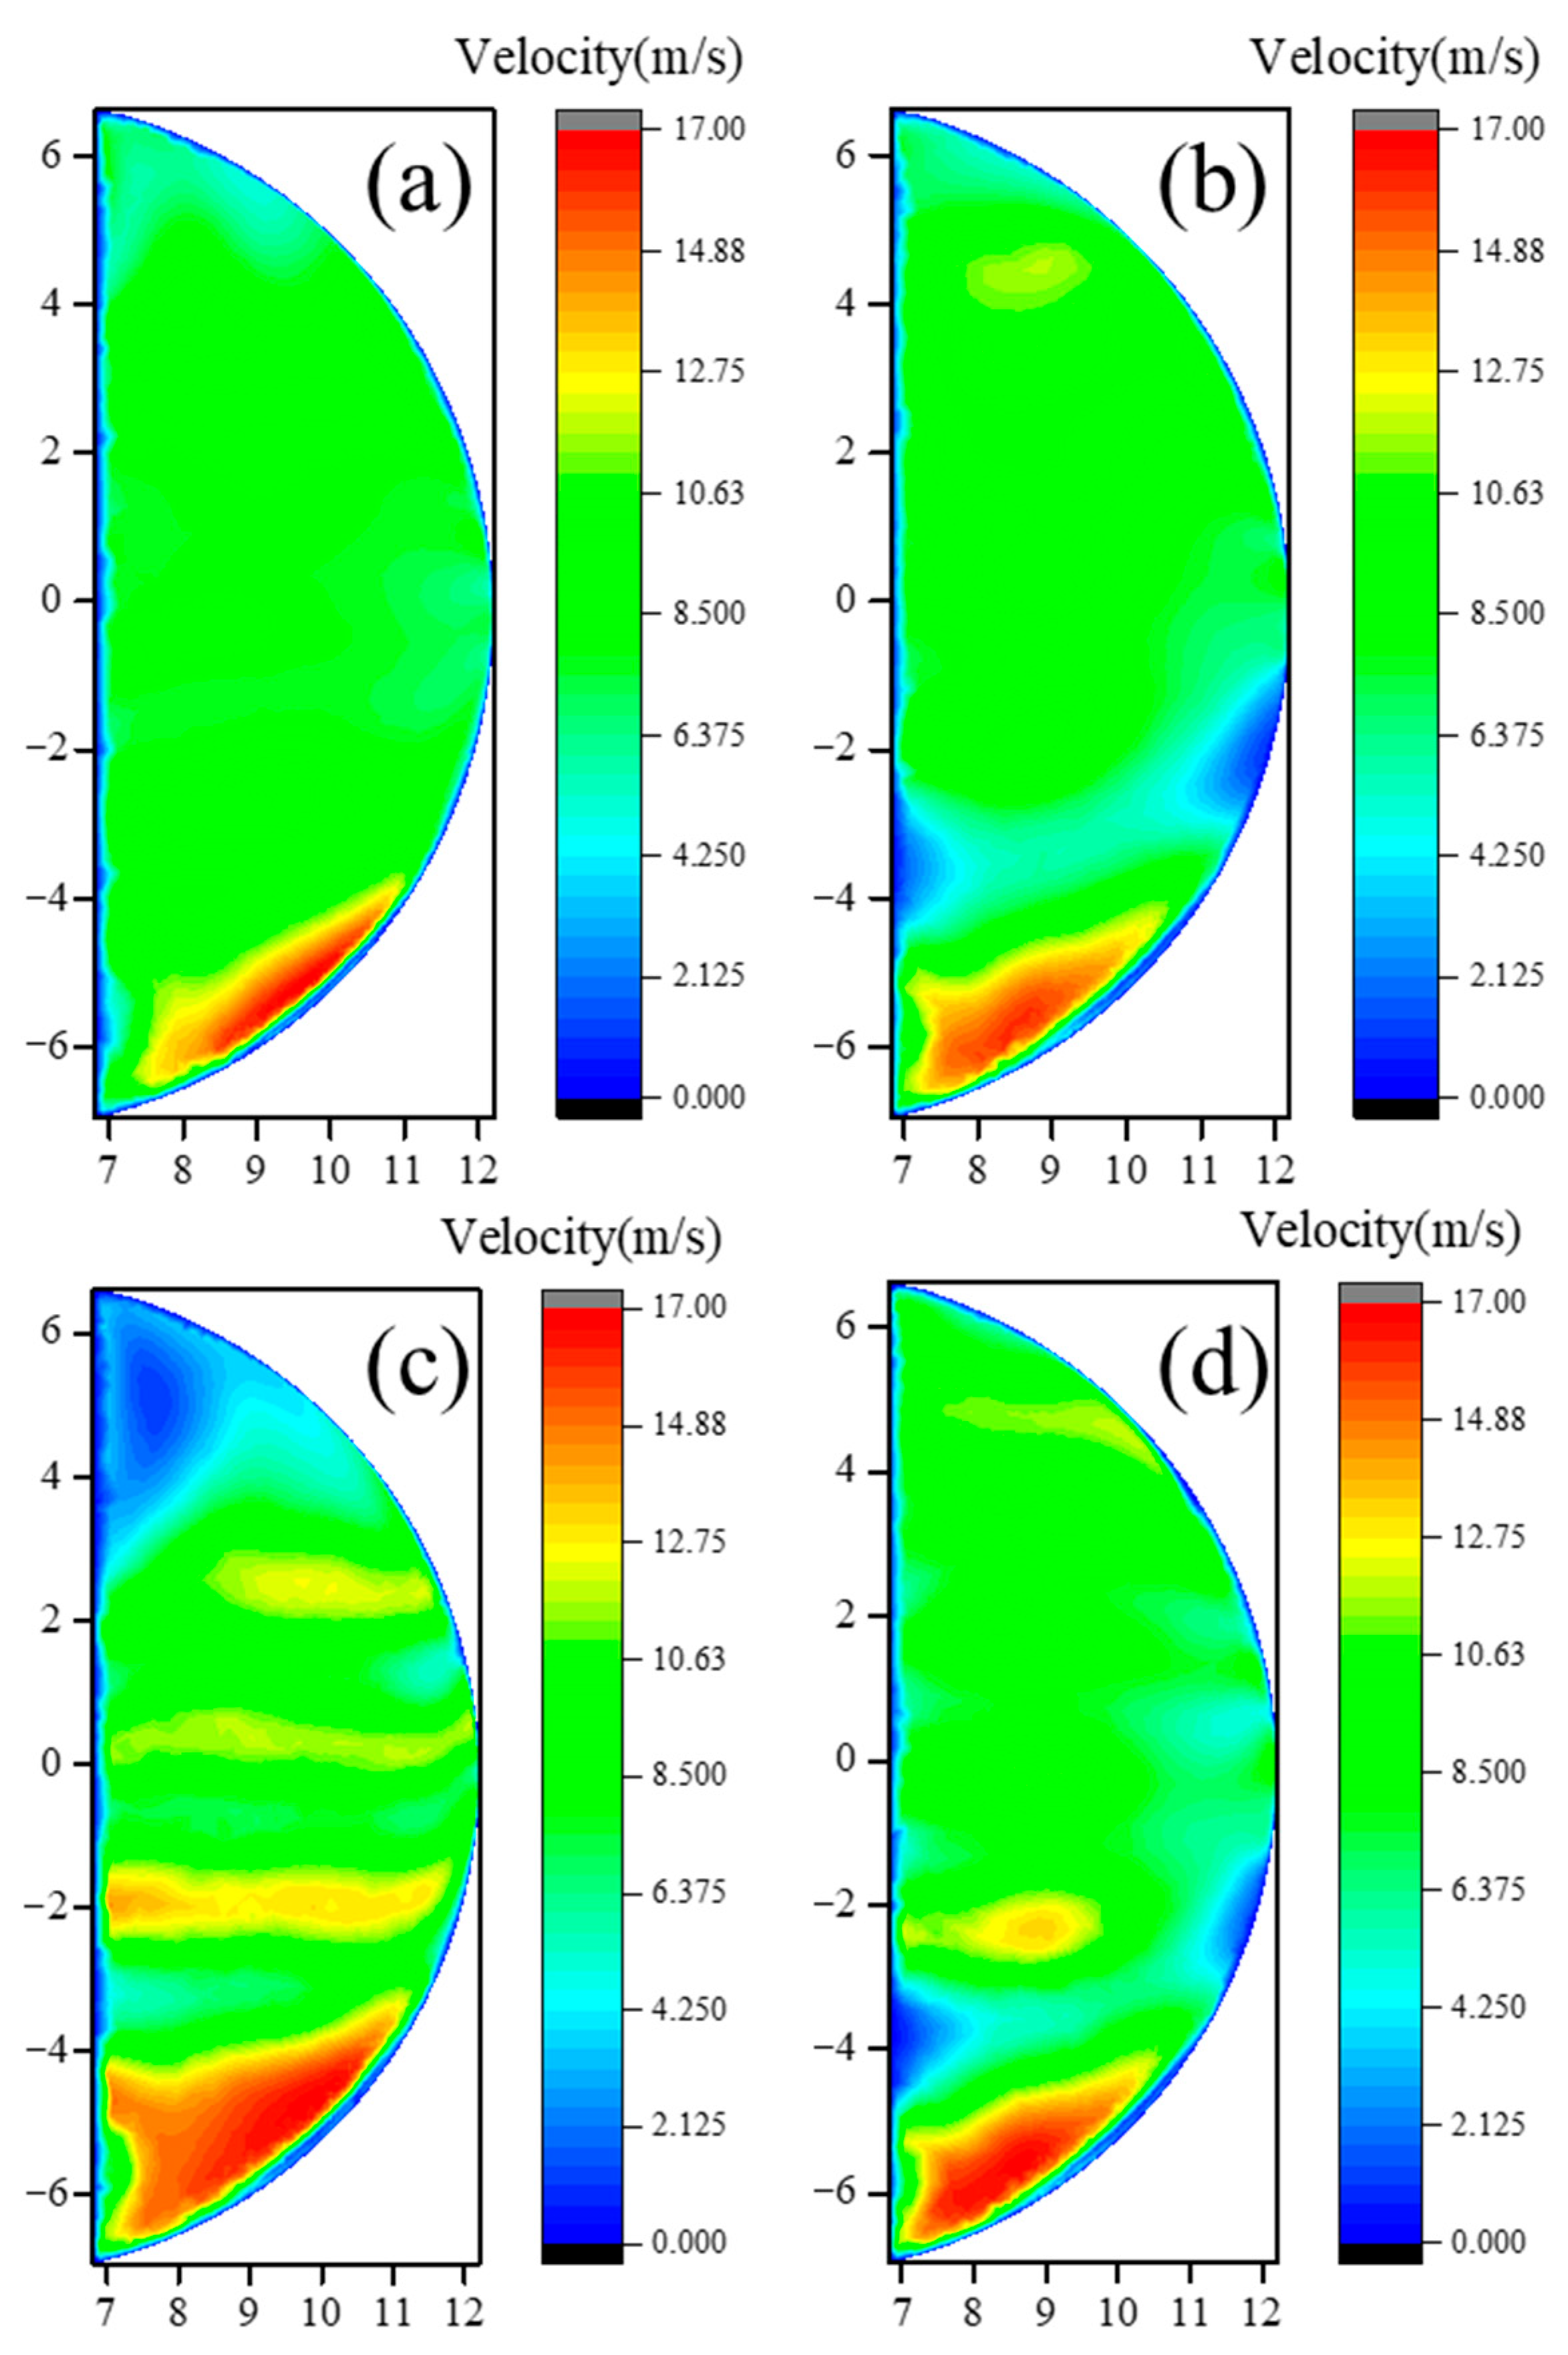
From the velocity distribution at the air preheater inlet shown in Figure 8, a more intuitive analysis can be conducted. Overall, the installation of guide plates at the elbow is beneficial for reducing the velocity in the high-velocity zone near the center of the semicircle on the flue gas side, as well as reducing the area of the low-velocity zone (compared to Figure 8d). The velocity legend indicates that Upper 1 and Upper 6 achieve a reduction in the maximum flow velocity, which is advantageous for mitigating equipment wear and corrosion. Notably, Upper 3 and Upper 6 exhibit a flow pattern similar to that in Figure 8b, suggesting that under these specific configurations, some of the deposited ABS in the low-velocity zones may be transported into high-velocity zones and undergo re-decomposition.
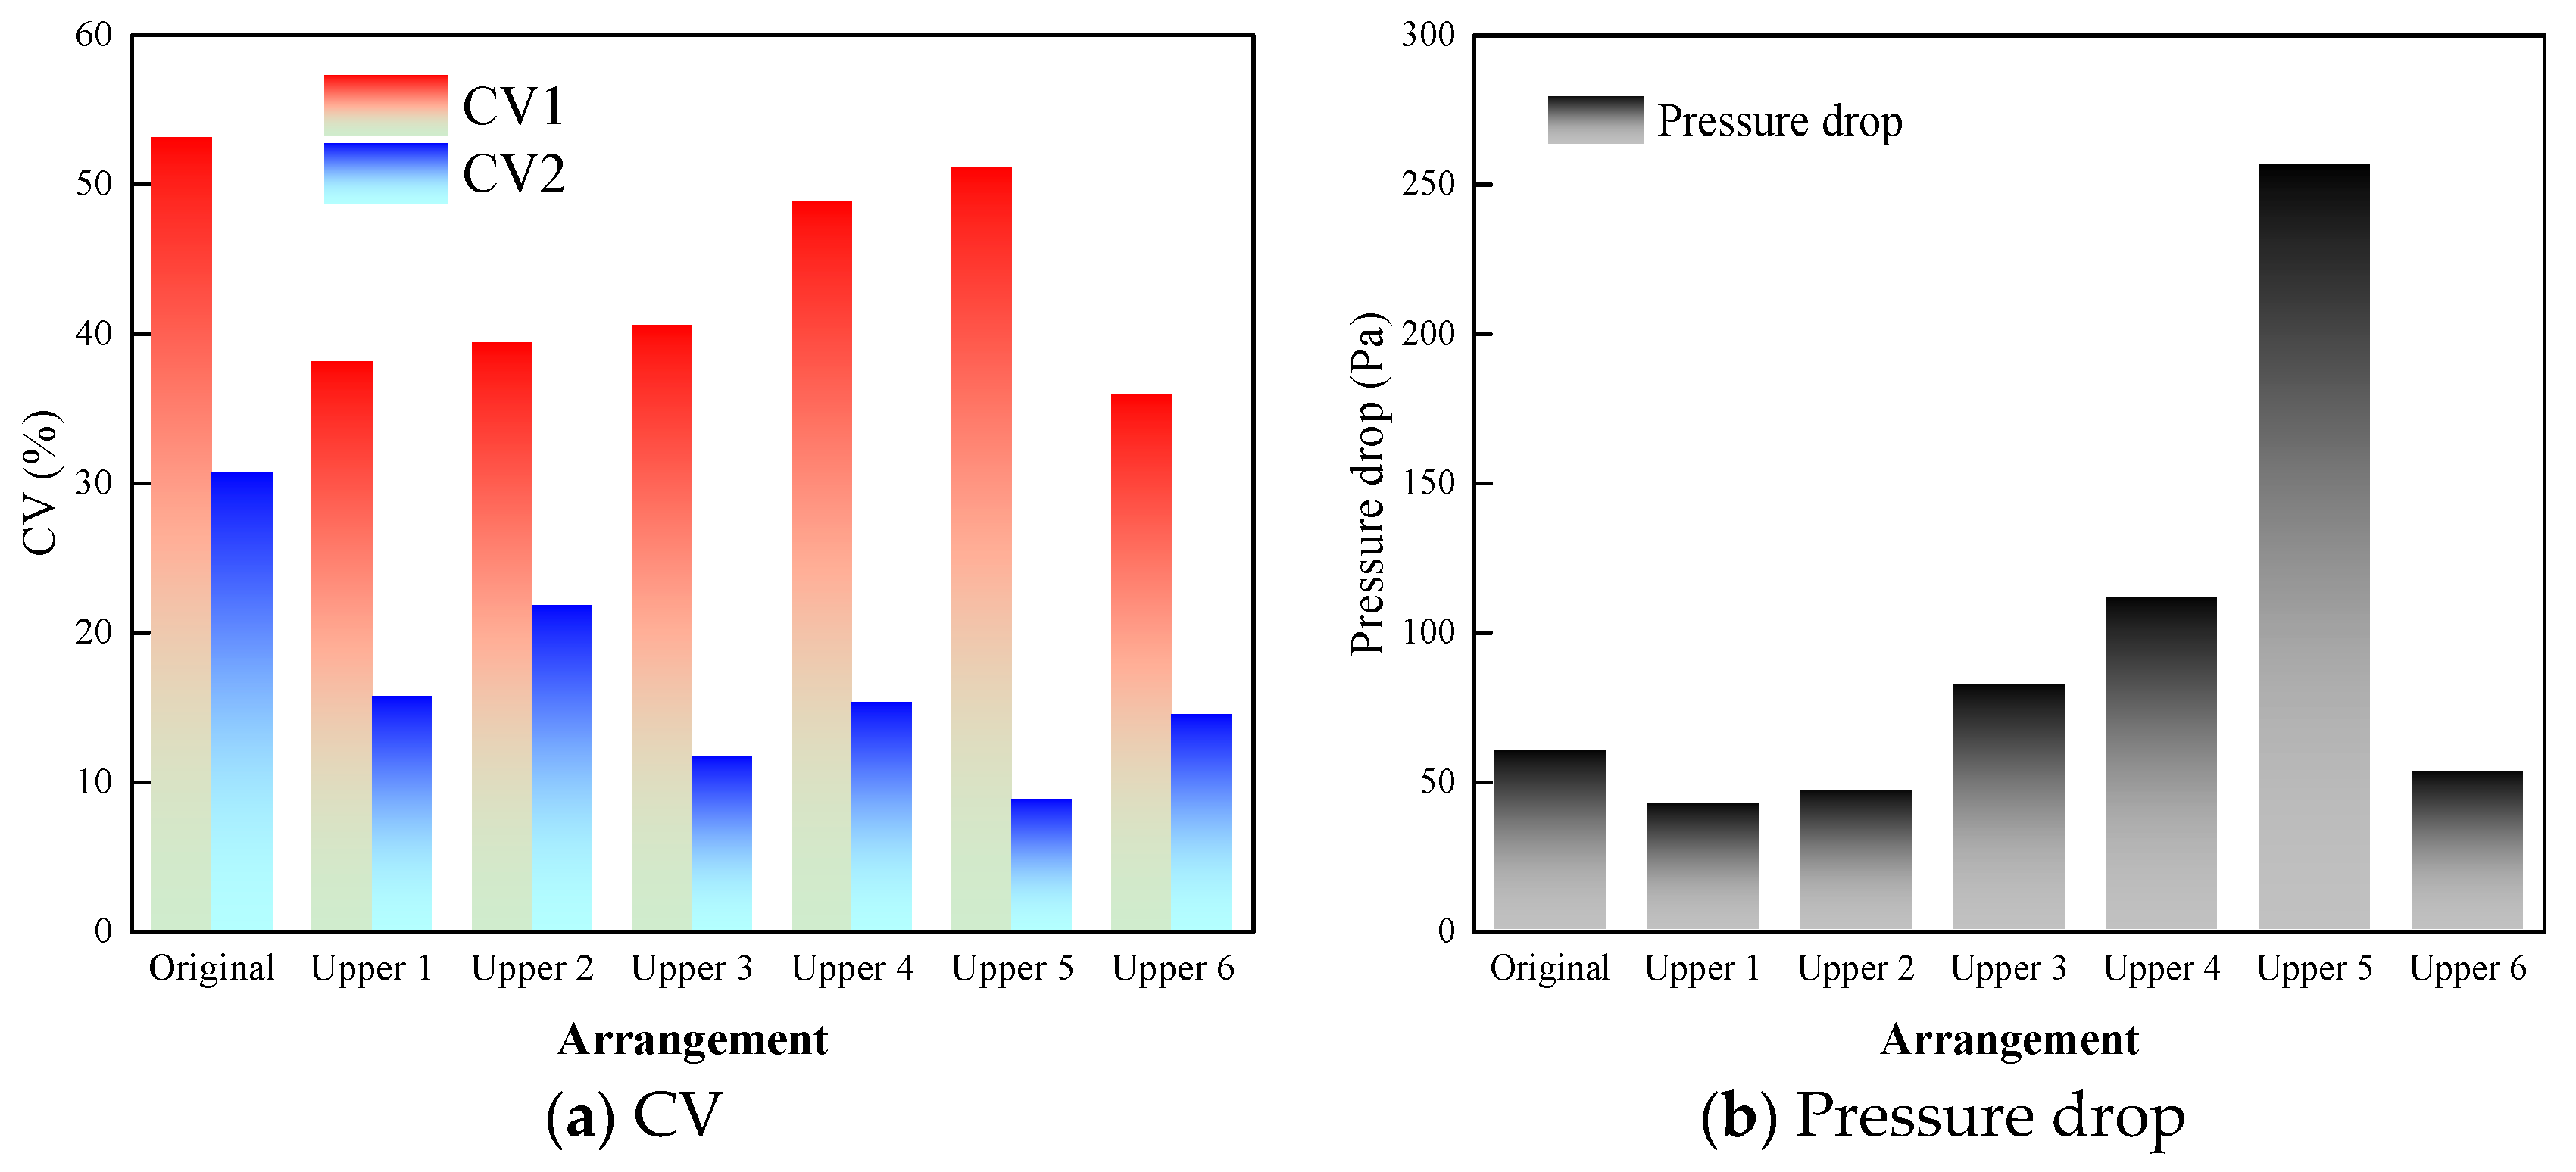
Furthermore, a characteristic cross-section was selected at the midpoint of the horizontal duct before the elbow. The static pressure difference from this section to the outlet was calculated to characterize the change in system resistance resulting from the installation of the guide plates. The performance of the six different guide plate configurations at the elbow was quantitatively evaluated using the uniformity indices CV1 and CV2, along with the pressure drop. The corresponding results are presented in Figure 9. All configurations lead to an improvement in the CV2 value, indicating that installing guide plates at the elbow effectively enhances the uniformity of the velocity distribution in the radial direction. Among them, the top three configurations based on the CV2 metric were Upper 5, Upper 3, and Upper 6. However, Upper 5 incurred a significantly high-pressure drop of approximately 260 Pa. This is primarily because some guide plates in Upper 5 are oriented perpendicular to the inlet streamlines, which effectively reduces the cross-sectional flow area and generates turbulence, thereby increasing the kinetic energy loss of the flue gas and resulting in a greater pressure drop. Based on the CV2 and pressure drop, Upper 3 (CV2: 12%) and Upper 6 (CV2: 14.5%) emerge as two potentially viable configurations, with their velocity distributions presented in Figure 8 being quite similar. A further comparison of the velocity contour reveals that Upper 6 exhibits a lower maximum flow velocity, which corresponds to a lower overall CV1 value. Consequently, given that Upper 3 and Upper 6 perform similarly in terms of CV2, yet Upper 6 demonstrates advantages in both flow resistance (Upper 6: 54 Pa; Upper 3: 83 Pa) and overall velocity distribution, it is identified as the optimal design among the unilateral configuration schemes evaluated.

3.3. Combined Flow Guide Plate Arrangement

Building upon the optimization results of the guide plate arrangement at the elbow, Upper 6 has been selected as the primary configuration for subsequent simulations. Simulations were conducted by combining Upper 6 with the lower bell mouth configurations (i.e., Lower 1 to Lower 4). The local streamline patterns near the outlet section for these combined cases are presented in Figure 10. The results indicate that the addition of guide structures at the bell mouth more effectively mitigates local velocity concentrations, promoting a more uniform distribution of flue gas across the entire inlet cross-section of the air-preheater duct. However, in the case of Upper 6 + Lower 3, corresponding to Figure 10c, the streamlines still exhibit significant aggregation, indicating that the guide structure failed to perform as intended. As shown in Figure 6, the guide plates in Lower 3 are positioned relatively further downstream. Consequently, a portion of the developed flow remains unaffected by the guide plates. This suggests that guide structures should preferably be installed earlier in the upstream region of the flow, in order to effectively influence flow development.
The velocity contour plots of the air-preheater inlet are presented in Figure 11. It can be observed that the combined configurations significantly improve the uniformity of the cross-sectional velocity distribution, particularly in the case of Upper 6 + Lower 1, corresponding to Figure 10e and Figure 11a. This improvement is even more evident in Figure 12, which compares the CV and pressure drop for the different combined schemes.
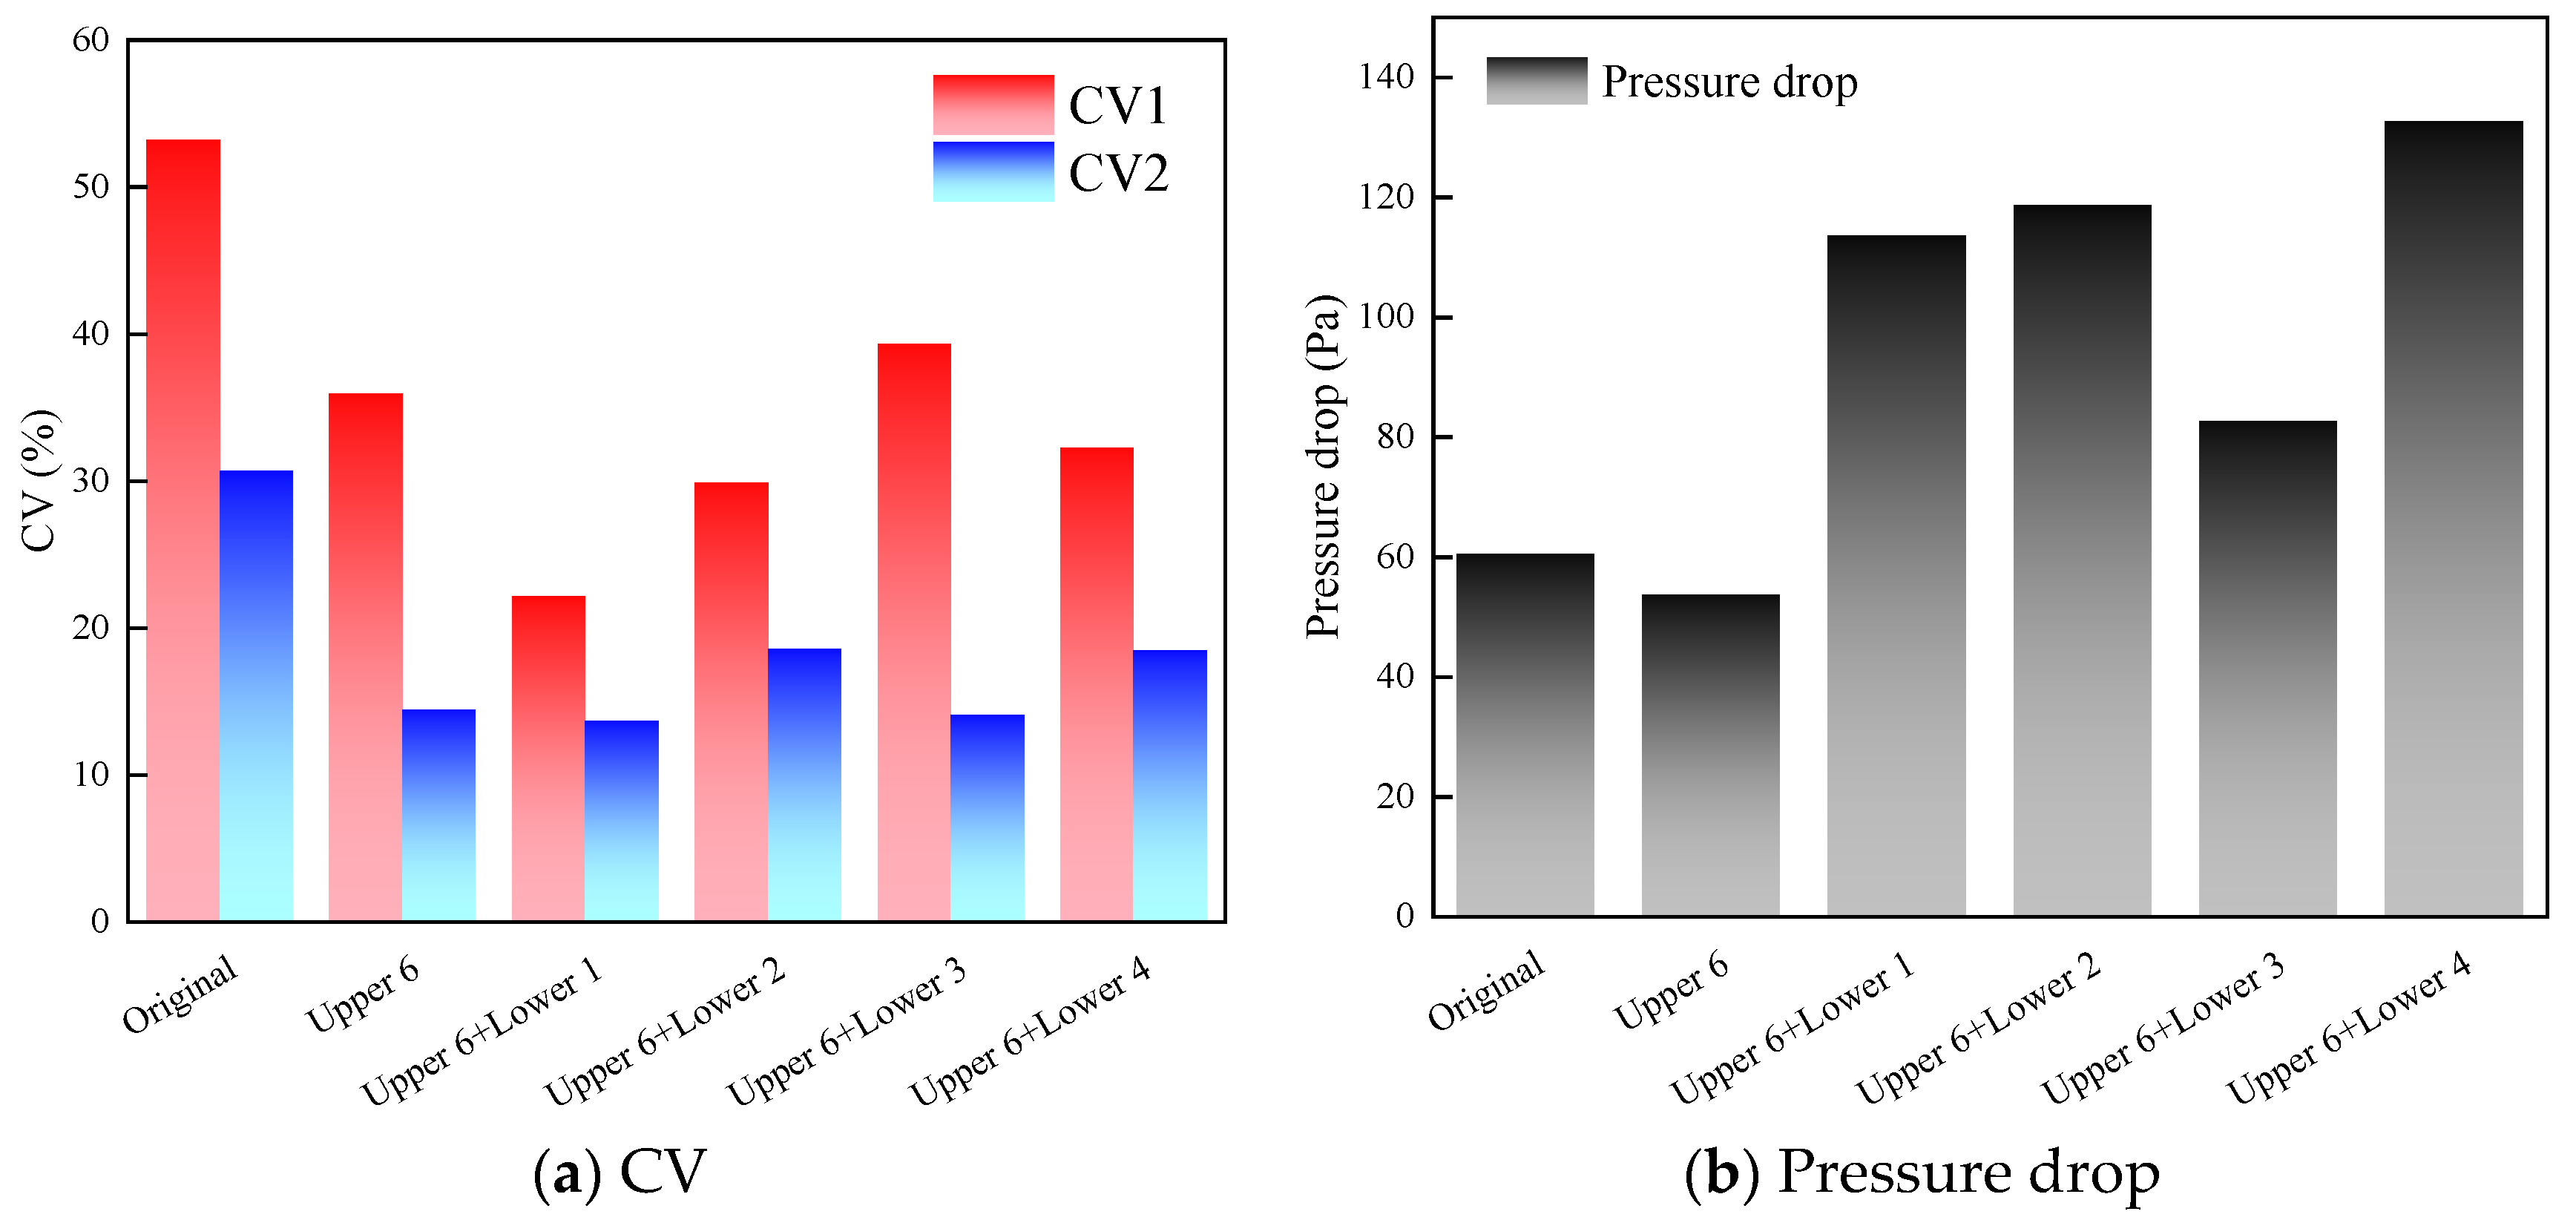
From Figure 12, in terms of the CV1, all combined configurations show a remarkable improvement in velocity distribution uniformity. Notably, Upper 6 + Lower 1 achieves a CV1 as low as 22% (compared to 53.2% for the original design). Regarding CV2, the addition of a second layer of guide plates at the bell mouth offers limited benefit, with both only marginal optimization (<1%). As for pressure drop, Upper 6 + Lower 1 exhibits a significant increase to 114 Pa, while Upper 6 + Lower 3 shows a slight increase up to 83 Pa. The local pressure drop at this location in the original design is 50 Pa, which is much lower. This occurs because while the addition of guide plates improves the flow pattern and reduces recirculation zones and pressure drops initially, when the number of plates reaches beyond a certain value, the marginal benefit for flow uniformity diminishes. Conversely, the flow resistance increases, imposing a greater load on the system [27,28,29,30]. In summary, installing guide plates at the elbow (Upper 6) alone meets the fundamental requirement for optimizing flow uniformity and mitigating ABS deposition. Moreover, the overall pressure drop is lower compared to the scenario with no guide plates. Therefore, Upper 6 is recommended as the optimal construction scheme. If flow uniformity issues persist or the wear risk is high due to the localized high-velocity flue gas, the addition of Lower 1 or Lower 3 at the bell mouth can be considered as a secondary optimization measure.
It should be noted that the present study focuses primarily on the flow-field characteristics upstream of the rotary air preheater. The energy equation and chemical reactions related to ABS formation were not explicitly solved. Therefore, the proposed CV2 index is intended as a flow-field-based indicator reflecting potential fouling risk associated with velocity maldistribution, rather than a direct prediction of ABS formation or deposition. A more comprehensive modeling framework incorporating heat transfer, mass transfer, and chemical kinetics will be considered in future work.

4. Conclusions

This study conducted CFD simulations of the flue gas flow field within the SCR de-NOx system and its adjacent flue ducts in a power plant. The causes of ammonium bisulfate (ABS) fouling in the air preheater located downstream of the SCR system were analyzed. A novel evaluation metric (CV2) was proposed to assess the risk of ABS deposition. Targeted optimization of the velocity distribution was achieved by implementing various flow guide plate configurations. Finally, the performance of different layout schemes was evaluated. The main conclusions are as follows:
(1) Considering the motion characteristics of the rotary air-preheater, the velocity standard deviation obtained from the annular sampling method used for CV2 could better reflect the uniformity of the velocity distribution across its cross-section compared to planar sampling (CV1). The traditional CV1 metric is more suitable for identifying the presence of high-velocity zones that may lead to localized wear.
(2) Without any flow guiding devices installed, the internal pressure drop within the computational domain is found to be primarily concentrated across the installed guide plates, the catalyst layers, and the air preheater itself. At the air-preheater inlet cross-section, the calculated CV1 and CV2 values reach 53.2% and 30.7%, respectively. The non-uniform radial velocity distribution is identified as a potential cause for ammonium bisulfate (ABS) fouling in the periphery of the air preheater.
(3) Installing flow guide plates at both the elbow and the bell mouth sections improves the flow uniformity at the air-preheater inlet. Among the six upper configurations, while Upper 5 achieves the best flow uniformity, it also incurs the highest flow resistance of 260 Pa. In contrast, Upper 3 and Upper 6 offer a balanced performance with relatively low pressure drop and decent flow uniformity. Their corresponding CV2 values can be reduced to below 15%, while the overall pressure drop remains under 80 Pa.
(4) Under the premise of implementing Upper 6 at the elbow, the addition of guide plates at the bell mouth provides limited further improvement to flow uniformity in the context of CV2 and a higher-pressure loss compared with the original design. After comprehensive consideration of factors including CV1, CV2, pressure drop, and retrofit cost, Upper 6 demonstrates superior overall performance, and both the combination schemes Upper 6 + Lower 1 and Upper 6 + Lower 3 are also considered viable options.
Future research will focus on developing a comprehensive model incorporating heat transfer and chemical kinetics to explicitly simulate the NH3-SO3 reaction. Additionally, considering the frequent load fluctuations in actual power plant operations, the stability under varying load conditions will be investigated. The effectiveness of the flow guide plate optimization schemes in reducing fouling and pressure drop will be evaluated across the full operating range, thus providing a more robust theoretical basis and data support for complex engineering applications.

Author Contributions

Conceptualization, X.W.; Methodology, X.W.; Software, K.X. and X.W.; Validation, L.Z.; Investigation, K.X. and L.Z.; Resources, L.Y. and L.Z.; Data curation, L.Y.; Writing—original draft, L.Y.; Visualization, L.Z.; Supervision, L.Y.; Project administration, K.X. All authors have read and agreed to the published version of the manuscript.

Funding

This research received no external funding.

Data Availability Statement

The original contributions presented in this study are included in the article. Further inquiries can be directed to the corresponding author.

Conflicts of Interest

The authors declare no conflict of interest.

References

  1. Abebe, M.; Seo, J.; Kang, Y.J.; Choi, H.; Noh, Y. NOx emission reduction of coal-fired power plants through data-driven model and particle swarm optimization. Environ. Prog. Sustain. Energy 2024, 43, e14358. [Google Scholar] [CrossRef] [Scilit]
  2. Forzatti, P. Present status and perspectives in de-NOx SCR catalysis. Appl. Catal. A Gen. 2001, 222, 221–236. [Google Scholar] [CrossRef] [Scilit]
  3. Damma, D.; Ettireddy, P.R.; Reddy, B.M.; Smirniotis, P.G. A review of low temperature NH3-SCR for removal of NOx. Catalysts 2019, 9, 349. [Google Scholar] [CrossRef] [Scilit]
  4. Liu, W.; Long, Y.; Liu, S.; Zhou, Y.; Tong, X.; Yin, Y.; Li, X.; Hu, K.; Hu, J. Commercial SCR catalyst modified with different noble metals (Ag, Pt, Pd) to efficiently remove slip ammonia and NOx in the flue gas. J. Taiwan Inst. Chem. Eng. 2022, 138, 104472. [Google Scholar] [CrossRef] [Scilit]
  5. Chen, X.; Ji, X.; Feng, J.; Heng, L.; Zhao, L. Laboratory study on adhesive ash deposition characteristics of ammonium bisulfate in conditions simulating an air preheater for hard coal combustion. Energies 2023, 16, 6513. [Google Scholar] [CrossRef] [Scilit]
  6. Yao, X.; Zhang, M.; Kong, H.; Lyu, J.; Yang, H. Investigation and control technology on excessive ammonia-slipping in coal-fired plants. Energies 2020, 13, 4249. [Google Scholar] [CrossRef] [Scilit]
  7. Zhang, Y.; Jiang, Z.; Zhou, Z.; Yang, Y.; Feng, Q.; Jiang, J.; Du, Z.; Guo, D.; Yan, X. An Investigation of Selective Catalytic Reduction Catalyst SO2/SO3 Conversion in Coal-fired Power Plants. Aerosol Air Qual. Res. 2024, 24, 240034. [Google Scholar] [CrossRef] [Scilit]
  8. Qing, M.; Su, Y.; Chen, J.; Li, X.; Wang, L.; Zhu, Z.; Liu, L.; Xiang, J. Mechanism study on the effect of ammonium bisulfate on the adhesion characteristics of fly ash. Fuel 2025, 402, 135789. [Google Scholar] [CrossRef] [Scilit]
  9. Li, B.; Zhang, Z.; Shan, T.; Zhang, Q.; He, Y.; Wang, X.; Yang, H. Two-dimensional transition metal-sulfide-modified V2O5-WS2/TiO2 catalysts for SCR: Comprehensive mechanistic insights into the in situ inhibition of SO3 generation. Sep. Purif. Technol. 2025, 354, 128968. [Google Scholar] [CrossRef] [Scilit]
  10. Li, Y.; Liu, X.; Zhang, A.; Zou, Y.; Zhou, Z.; Xu, M. Study on the competitive absorption between complex components in flue gas and SO3 by alkaline absorbent. Fuel 2023, 353, 129222. [Google Scholar] [CrossRef] [Scilit]
  11. Guo, J.; Xiong, J.; Li, Y.; Qinggele, J.; Zhu, T. Absorption mechanism of SO3 on various alkaline absorbents in the presence of SO2. J. Environ. Sci. 2025, 149, 268–277. [Google Scholar] [CrossRef] [Scilit]
  12. Yu, H.; Wang, C.; Chen, H.; Shan, C.; Sun, J.; Hang, W.; Yang, L. SO3 removal by submicron absorbents synthesized via inhibition method: The product layer grows like parallel peaks. J. Hazard. Mater. 2024, 479, 135593. [Google Scholar] [CrossRef] [Scilit] [PubMed]
  13. Yu, H.; Shan, C.; Li, J.; Hou, X.; Yang, L. Alkaline absorbents for SO2 and SO3 removal: A comprehensive review. J. Environ. Manag. 2024, 366, 121532. [Google Scholar] [CrossRef] [Scilit]
  14. Cao, L.; Zhang, J. Applications and analyses of ammonia slip control based on precise ammonia injection technologies guided by big data. Clean Energy 2024, 8, 37–49. [Google Scholar] [CrossRef] [Scilit]
  15. Gao, W.; Liu, M.; Yin, J.; Zhao, Y.; Chen, W.; Yan, J. An improved control strategy for a denitrification system using cooperative control of NH3 injection and flue gas temperature for coal-fired power plants. Energy 2023, 282, 128759. [Google Scholar] [CrossRef] [Scilit]
  16. Lian, L.; Kong, D.; Wang, Y.; Liu, Y. A review on sulfur trioxide (SO3) removal from coal combustion process: Research progress challenges and suggestions. Sep. Purif. Technol. 2025, 358, 130190. [Google Scholar] [CrossRef] [Scilit]
  17. Zhang, K.; Xue, F.; Wang, Z.; Cheng, X. Research on prediction model of formation temperature of ammonium bisulfate in air preheater of coal-fired power plant. Chin. J. Chem. Eng. 2022, 48, 202–210. [Google Scholar] [CrossRef] [Scilit]
  18. Jiao, K.; Chen, X.; Bie, X.; Liu, D.; Qiu, M.; Ma, S. Status and development for detection and control of ammonium bisulfate as a by-product of SCR denitrification. Sci. Rep. 2021, 11, 10457. [Google Scholar] [CrossRef] [Scilit]
  19. Wang, L.; Bu, Y.; He, Y.; Tang, C.; Deng, L.; Che, D. Influence of operating conditions on ammonium bisulfate deposition in the rotary air preheater of coal-fired power plants. Therm. Sci. 2019, 23, 1251–1262. [Google Scholar] [CrossRef] [Scilit]
  20. Bu, Y.; Wang, L.; Chen, X.; Wei, X.; Deng, L.; Che, D. Numerical analysis of ABS deposition and corrosion on a rotary air preheater. Appl. Therm. Eng. 2018, 131, 669–677. [Google Scholar] [CrossRef] [Scilit]
  21. Mehdi, G.; Zhou, S.; Zhu, Y.; Shah, A.H.; Chand, K. Numerical investigation of SCR mixer design optimization for improved performance. Processes 2019, 7, 168. [Google Scholar] [CrossRef] [Scilit]
  22. Liu, X.; Yan, F.; Zheng, S.; Liao, J.; Cai, Z.; Hu, J. Influence of operating conditions on urea deposit formation in the urea-SCR system on a diesel engine exhaust-like test bench. Ind. Eng. Chem. Res. 2021, 60, 11334–11345. [Google Scholar] [CrossRef] [Scilit]
  23. Millo, F.; Sapio, F.; Paradisi, B.P.; Bianco, A.; Postrioti, L.; Buitoni, G.; Tabarrini, M.; Robino, C. Experimental and numerical analysis of an innovative mixer geometry for urea injection in SCR applications. Emiss. Control. Sci. Technol. 2022, 8, 78–95. [Google Scholar] [CrossRef] [Scilit]
  24. Qian, F.; Wang, L.; Zhu, J.; Huang, N.; Wu, H. A Resistance Calculation Method for SCR de-NOx Catalyst: CN201910484081.X. CN110210137A, 2 December 2025. [Google Scholar]
  25. Wang, Y.; Ma, Z.; Zhou, Y.; Zhu, H.; Huang, Y.; Yang, Y. Experimental investigation on the airflow characteristics of an attachment-based personalized ventilation method. Build. Serv. Eng. Res. Technol. 2016, 37, 710–729. [Google Scholar] [CrossRef] [Scilit]
  26. JB/T 12131-2015; Numerical and Physical Model Technical Specification for Coal-Fired Flue Gas SCR System. Ministry of Industry and Information Technology of the People’s Republic of China: Beijing, China, 2015.
  27. Zhang, W.; Wu, Y.; Li, J. Study on the thermo-hydraulic performance and temperature uniformity for flow-guide liquid-cooled plates: Numerical simulation and experiment. Int. J. Therm. Sci. 2026, 221, 110481. [Google Scholar] [CrossRef] [Scilit]
  28. Hu, J.; Zhang, X. Performance Optimization of a U-Shaped Liquid Cooling Plate: A Synergistic Study of Flow Guide Plate and Spoiler Columns. Front. Heat Mass Transf. 2025, 23, 957–974. [Google Scholar] [CrossRef] [Scilit]
  29. Wang, Y.; Zhu, C.; Zhang, G.; Wang, D.; Jiang, M.; Zhu, Z.; Lin, Z. Numerical analysis to the effect of guiding plate on flow characteristics in a ball valve. Processes 2020, 8, 69. [Google Scholar] [CrossRef] [Scilit]
  30. Ejeh, C.J.; Alawwa, F.H.; Kofi, A.; Ingrid, A. Improving flow efficiency in curved pipes during multi-phase, immiscible fluid flow using edge-tailored guide vanes. Exp. Comput. Multiph. Flow 2023, 5, 122–131. [Google Scholar] [CrossRef] [Scilit]
Figure 1. Physical model of the SCR system and its following flue-gas duct.
Separations 13 00097 g001
Figure 2. (a) Grid independence check by the CV of outlet velocity, (b) Mesh, where different colors stands for different computing region.
Separations 13 00097 g002
Figure 3. (a) Schematic diagram of the rotary air preheater and (b) the sampling method of CV2.
Separations 13 00097 g003
Figure 4. Two velocity distributions of the air-preheater inlet: (a) Case 1, (b) Case 2.
Separations 13 00097 g004
Figure 5. Flow field of the original design: (a) overall streamline, (b) pressure drop, (c) validation against measured pressure, (d) partial enlarged view of the air-preheater inlet, (e) velocity distribution of the air-preheater inlet.
Separations 13 00097 g005
Figure 6. Schematic diagram of different flow guide plate arrangements.
Separations 13 00097 g006
Figure 7. Streamline diagrams of different arrangements. (af) stands for Upper 1 to Upper 6.
Separations 13 00097 g007
Figure 8. Contour of flue gas velocity distribution at the air preheater inlet for different configurations, where (af) correspond to Upper 1 to Upper 6, respectively.
Separations 13 00097 g008
Figure 9. CV and pressure drop for different flow guide plate configurations at the elbow, where (a) refers to the CV and (b) refers to the pressure drop of different arrangements.
Separations 13 00097 g009
Figure 10. Local streamline patterns for different combined configurations, where (ad) correspond to the combination of Upper 6 with Lower 1 to Lower 4, respectively. (e) Velocity contour plot of Upper 6 + Lower 1.
Separations 13 00097 g010
Figure 11. Contour of flue-gas velocity distribution at the air-preheater inlet for different combined configurations, where (ad) correspond to the combination of Upper 6 with Lower 1 to Lower 4, respectively.
Separations 13 00097 g011
Figure 12. CV and pressure drop for different combined configurations.
Separations 13 00097 g012
Table 1. Parameters of guide plates.
ConfigurationPlacement
Upper 1A five-segment concentric arc arrangement with consistent spacing.
Upper 2Three outermost plates in Upper 1 were selected, with an arc of 1/8 of the radius.
Upper 3Five guide vanes are arranged in the middle, with an entry angle of 45° to the vertical direction and an exit angle that is vertically downward.
Upper 4The number of inner leaves was reduced, and baffles of 1 m with an angle of 30° and 45° to the vertical direction were installed.
Upper 5The plates of approximately the lower 1/4 of Upper 1 were retained, and the inlet angle was adjusted from 15° to 45° to the vertical direction.
Upper 6The plates of approximately the middle 1/3 of Upper 1 were retained, and the outlet angle was adjusted to the vertical direction.
Lower 1Upper 1/4 of Lower 4.
Lower 2Upper 1/2 of Lower 4.
Lower 3Lower 1/2 of Lower 4.
Lower 4The plates are evenly arranged at the six equal division points of the upper and lower parts of the trapezoidal section, spanning the entire circular cross-section of the flue gas inlet.
Disclaimer/Publisher’s Note: The statements, opinions and data contained in all publications are solely those of the individual author(s) and contributor(s) and not of MDPI and/or the editor(s). MDPI and/or the editor(s) disclaim responsibility for any injury to people or property resulting from any ideas, methods, instructions or products referred to in the content.