Article

Fault Detection of Diesel Engine Air and after-Treatment Systems with High-Dimensional Data: A Novel Fault-Relevant Feature Selection Method

1
Key Laboratory of Advanced Control and Optimization for Chemical Processes, Ministry of Education, East China University of Science and Technology, Shanghai 200237, China
2
Weichai Power Co., Ltd., Weifang 261061, China
*
Author to whom correspondence should be addressed.
Processes 2021, 9(2), 259; https://doi.org/10.3390/pr9020259
Submission received: 17 December 2020 / Revised: 19 January 2021 / Accepted: 26 January 2021 / Published: 29 January 2021
(This article belongs to the Special Issue Learning for Process Optimization and Control)

Abstract

:
In order to reduce pollutants of the emission from diesel vehicles, complex after-treatment technologies have been proposed, which make the fault detection of diesel engines become increasingly difficult. Thus, this paper proposes a canonical correlation analysis detection method based on fault-relevant variables selected by an elitist genetic algorithm to realize high-dimensional data-driven faults detection of diesel engines. The method proposed establishes a fault detection model by the actual operation data to overcome the limitations of the traditional methods, merely based on benchmark. Moreover, the canonical correlation analysis is used to extract the strong correlation between variables, which constructs the residual vector to realize the fault detection of the diesel engine air and after-treatment system. In particular, the elitist genetic algorithm is used to optimize the fault-relevant variables to reduce detection redundancy, eliminate additional noise interference, and improve the detection rate of the specific fault. The experiments are carried out by implementing the practical state data of a diesel engine, which show the feasibility and efficiency of the proposed approach.

1. Introduction

In recent decades, diesel engines have been widely used in automobiles with cumulatively high fuel efficiency, thermal efficiency, and power. Diesel engines with large application scales emit various pollutants, especially nitrogen oxides (NOx) and particulate matter (PM), causing increasingly serious urban air pollution problems [1]. Therefore, the China VI emission standards have been promulgated and implemented to prevent environmental pollution caused by vehicle exhaust [2]. Facing these challenges, researchers in the automotive industry have been continuously working on reducing vehicle emission through innovative solutions in the areas of advanced engine combustion and exhaust after-treatment technologies [3,4]. The integrated application of basic emission reduction technologies, such as diesel oxidation catalyst (DOC), diesel particulate filter (DPF), selective catalytic reduction (SCR), and ammonia slip catalyst (ASC), can constitute effective emission reduction solutions. [5]. At present, the main technical route of heavy diesel vehicles is the efficient SCR scheme (DOC + DPF + SCR + ASC) [2,6]. However, the complexity caused by the integration of various technologies will inevitably lead to frequent abnormalities and difficulties in terms of detection, which may make the vehicle fail to meet the aforementioned emission standards in practical applications [7]. Therefore, it is necessary to conduct research regarding operating status monitoring and fault detection on diesel engine after-treatment systems, to timely deal with emission faults, and ensure the latest emission regulations are met.
With increasingly strict emission standards, many scholars have improved fault identification methods of emission technologies [8,9,10]. Liu et al. [9] established a simulation model of the diesel engine with wall flow ceramic DPF and diagnosis of the blocking DPF, with an instantaneous exhaust pressure spectrum analysis. Wang et al. [10] proposed an on-board fault diagnosis and fault-tolerant integrated control method to maintain the NOx conversion performance of the SCR. However, these studies often focus on a single after-treatment technology and use benchmark test data for verification, which has limitations in practical applications. In addition, remote monitoring technologies have been studied to realize diesel vehicle emission monitoring and warnings of exceeding standards. Jhou et al. [11] used the vehicle monitoring system, which integrated with a wireless network, an on-board self-diagnosis system, and cloud computing technology, to monitor the dynamic vehicle data in real time and transmit it to the cloud server for fault diagnosis and analysis. Wang et al. [12] designed a remote monitoring system for heavy-load diesel vehicles based on big data and a wireless sensor network to monitor the actual driving cycle. However, the above research simply used the fault code of an on-board diagnostic system for diagnosis. To the best knowledge of the authors, little research for diesel engine fault detection, based on the actual operation data accumulated by an on-board diagnosis system technology and remote emission monitoring technology have been implemented. Therefore, motivated by the above problems, this paper uses massive engine status data to extract typical features, and establishes a data-driven fault detection model, which can, in turn, support the monitoring of diesel engines.
In fact, fault detection methods based on actual data have been widely applied in the process industry, especially multivariate statistical analysis, mainly including principal component analysis (PCA), partial least squares (PLS), canonical correlation analysis (CCA), etc. [13,14,15]. PCA models focus on extracting the main variance information of process data and are generally used to remove collinearity [15,16,17]. PLS is commonly used for quality-related or key performance indicator-oriented process monitoring [18,19]. Specifically, as an extension of the PLS method, CCA implements fault detection by describing the correlation between two sets of process variables, which are suitable for processes with strong coupling [20,21,22,23]. Chen et al. [20] used CCA to extract the correlation of the state data to establish the residual signal and constructed static and dynamic fault detection methods for alumina evaporation processes. Jiang et al. [21] proposed a CCA method based on the representation of positive correlation features, which not only reduced the redundancy in the feature space, but also verified the effectiveness in terms of the step and slow drift type faults. Similarly, in the SCR scheme of heavy diesel vehicles, the components of the scheme are installed closely and interact with each other during operation. The measurement data have strong correlation and the variables near the fault equipment have abundant fault information [6]. Based on the above discussion, this work extracts the correlation changes from the actual operation data via CCA for diesel engine fault detection.
However, the measurement variables that are far from the fault equipment may not contain valid information for detecting the fault. In addition, due to the atrocious working environment of diesel engines, the actual measurement signals are usually polluted by strong noise. Accordingly, a proper selection of variables would be beneficial to improve the performance during the modeling phase, which will reduce the modeling variables, reduce the degree of freedom, and eliminate additional noise interference [24,25]. The elitist genetic algorithm (EGA) is widely used to solve complex optimization problems because it is not limited to the type of the model. Elitism or elitist selection keeps the best individuals in each generation, which greatly benefits the convergence of the algorithm. Therefore, the current study uses EGA to achieve optimal/near-optimal variable selection based on some frequent fault data. That is, before the CCA detection model is established, the EGA will be used to optimize the modeling variable subset of a particular diesel engine fault. The variables of the optimal subset are defined as fault-relevant variables in the article.
Accordingly, this paper proposes a data-driven fault detection method with fault-relevant canonical correlation analysis (EGA–CCA) for diesel engines. To the best of our knowledge, the EGA–CCA scheme has not been applied in the field of diesel engine fault detection and other fault detection problems. Thus, the main contributions of this work are highlighted as follows:
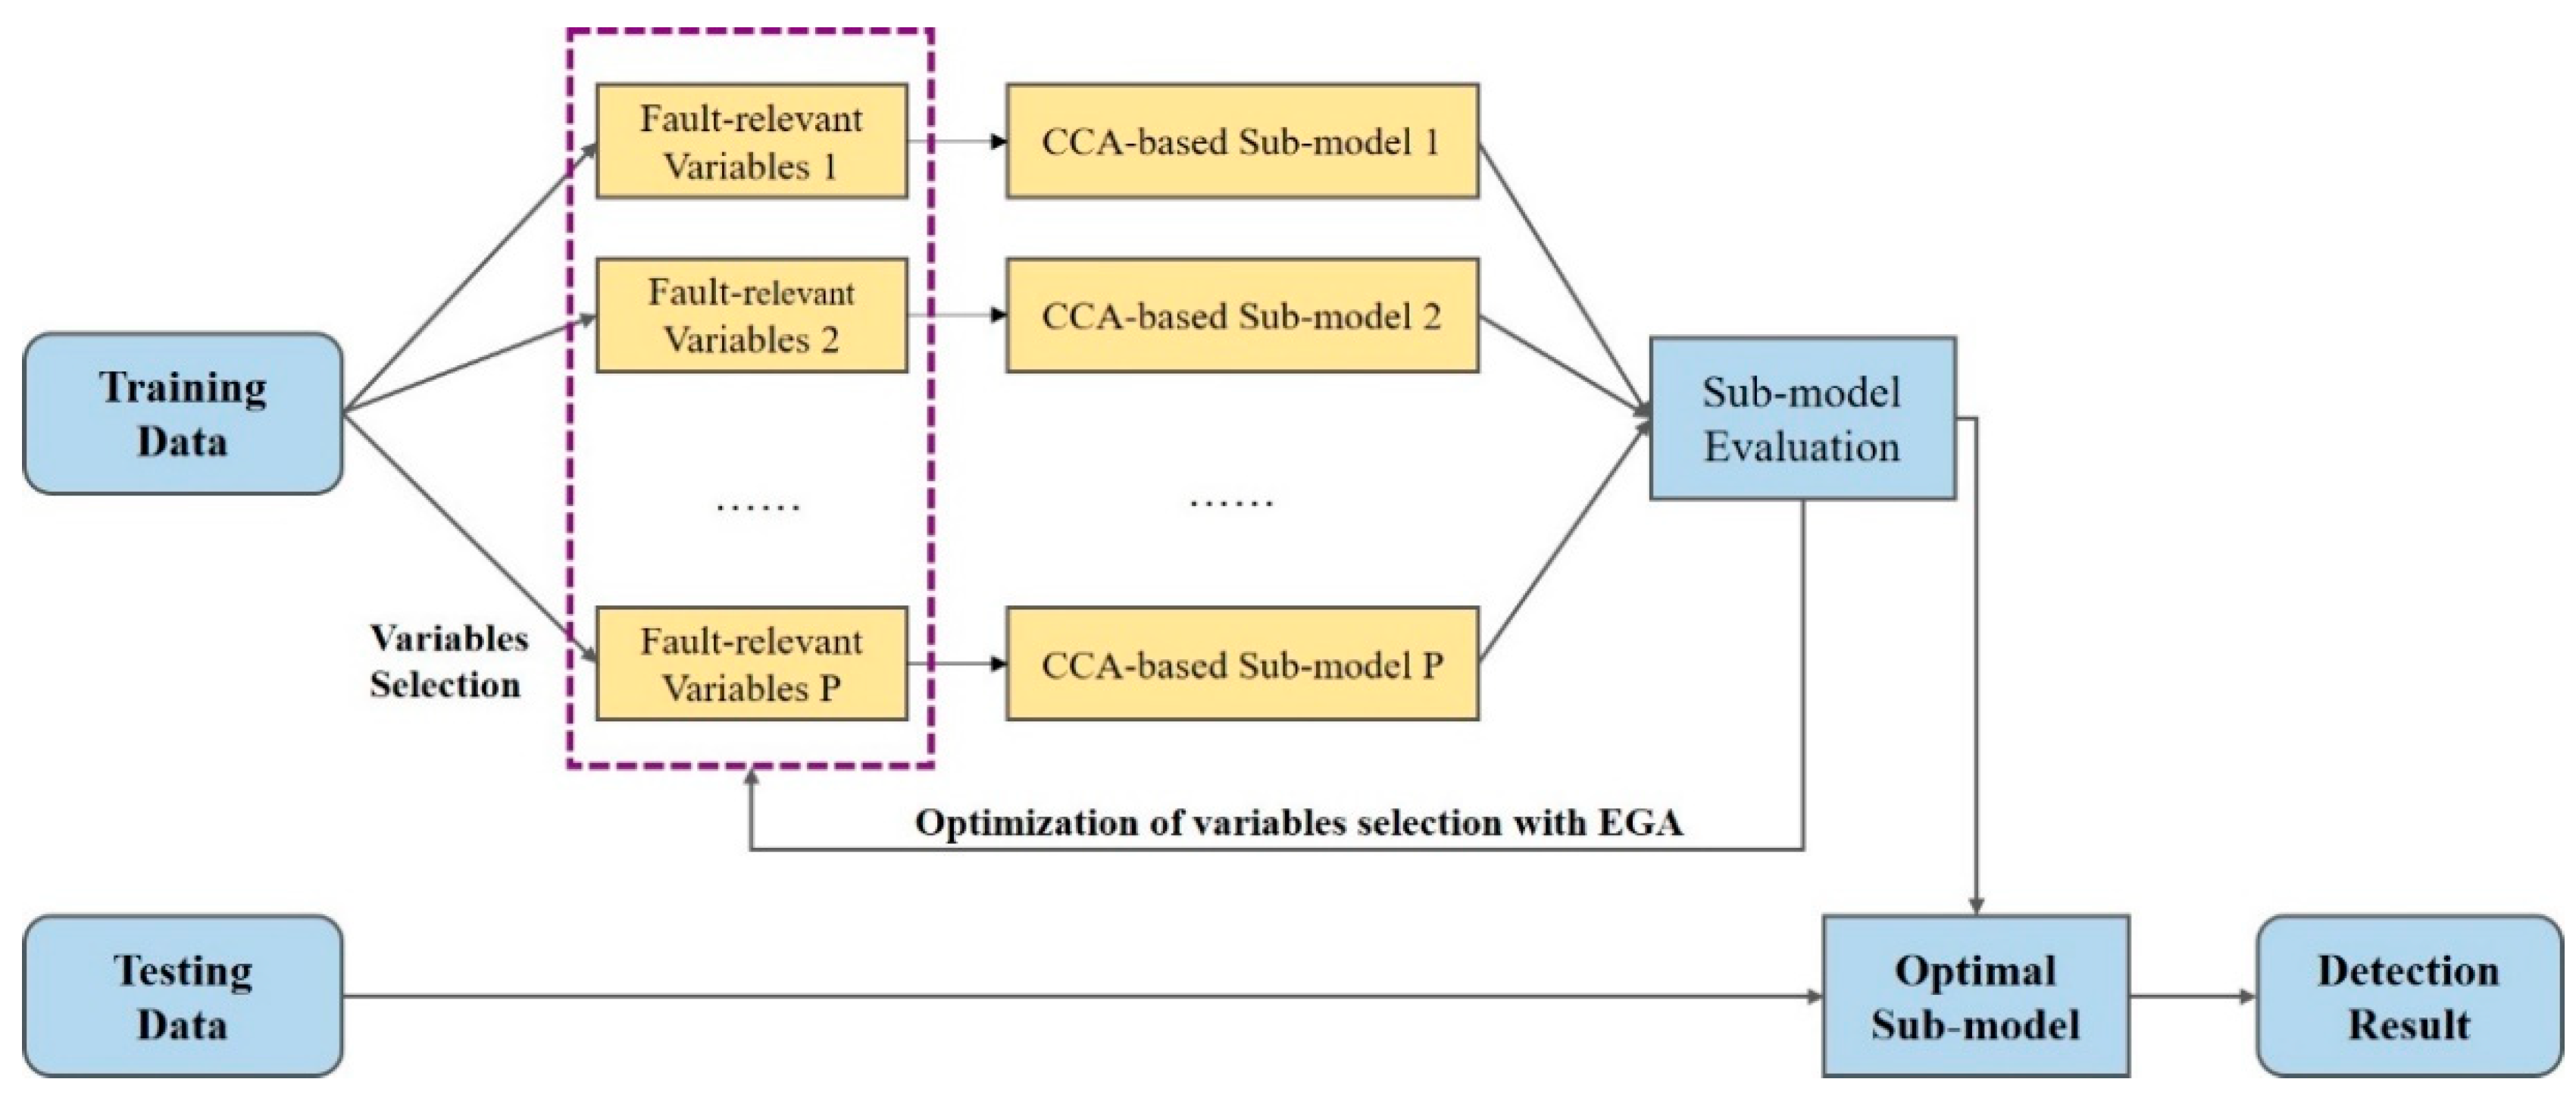
  • This paper proposes a novel EGA–CCA scheme for fault detection, in which the EGA is used to optimize variables for the specific fault conditions for improving detection performance, while the CCA is used to extract the correlations between variables to establish a detection model.
  • The EGA–CCA scheme is applied to establish fault detection models with operating data of the heavy diesel vehicle in practice, which successfully detects three faults in the air and after-treatment systems of the diesel engine.

2. Process and Problem Description

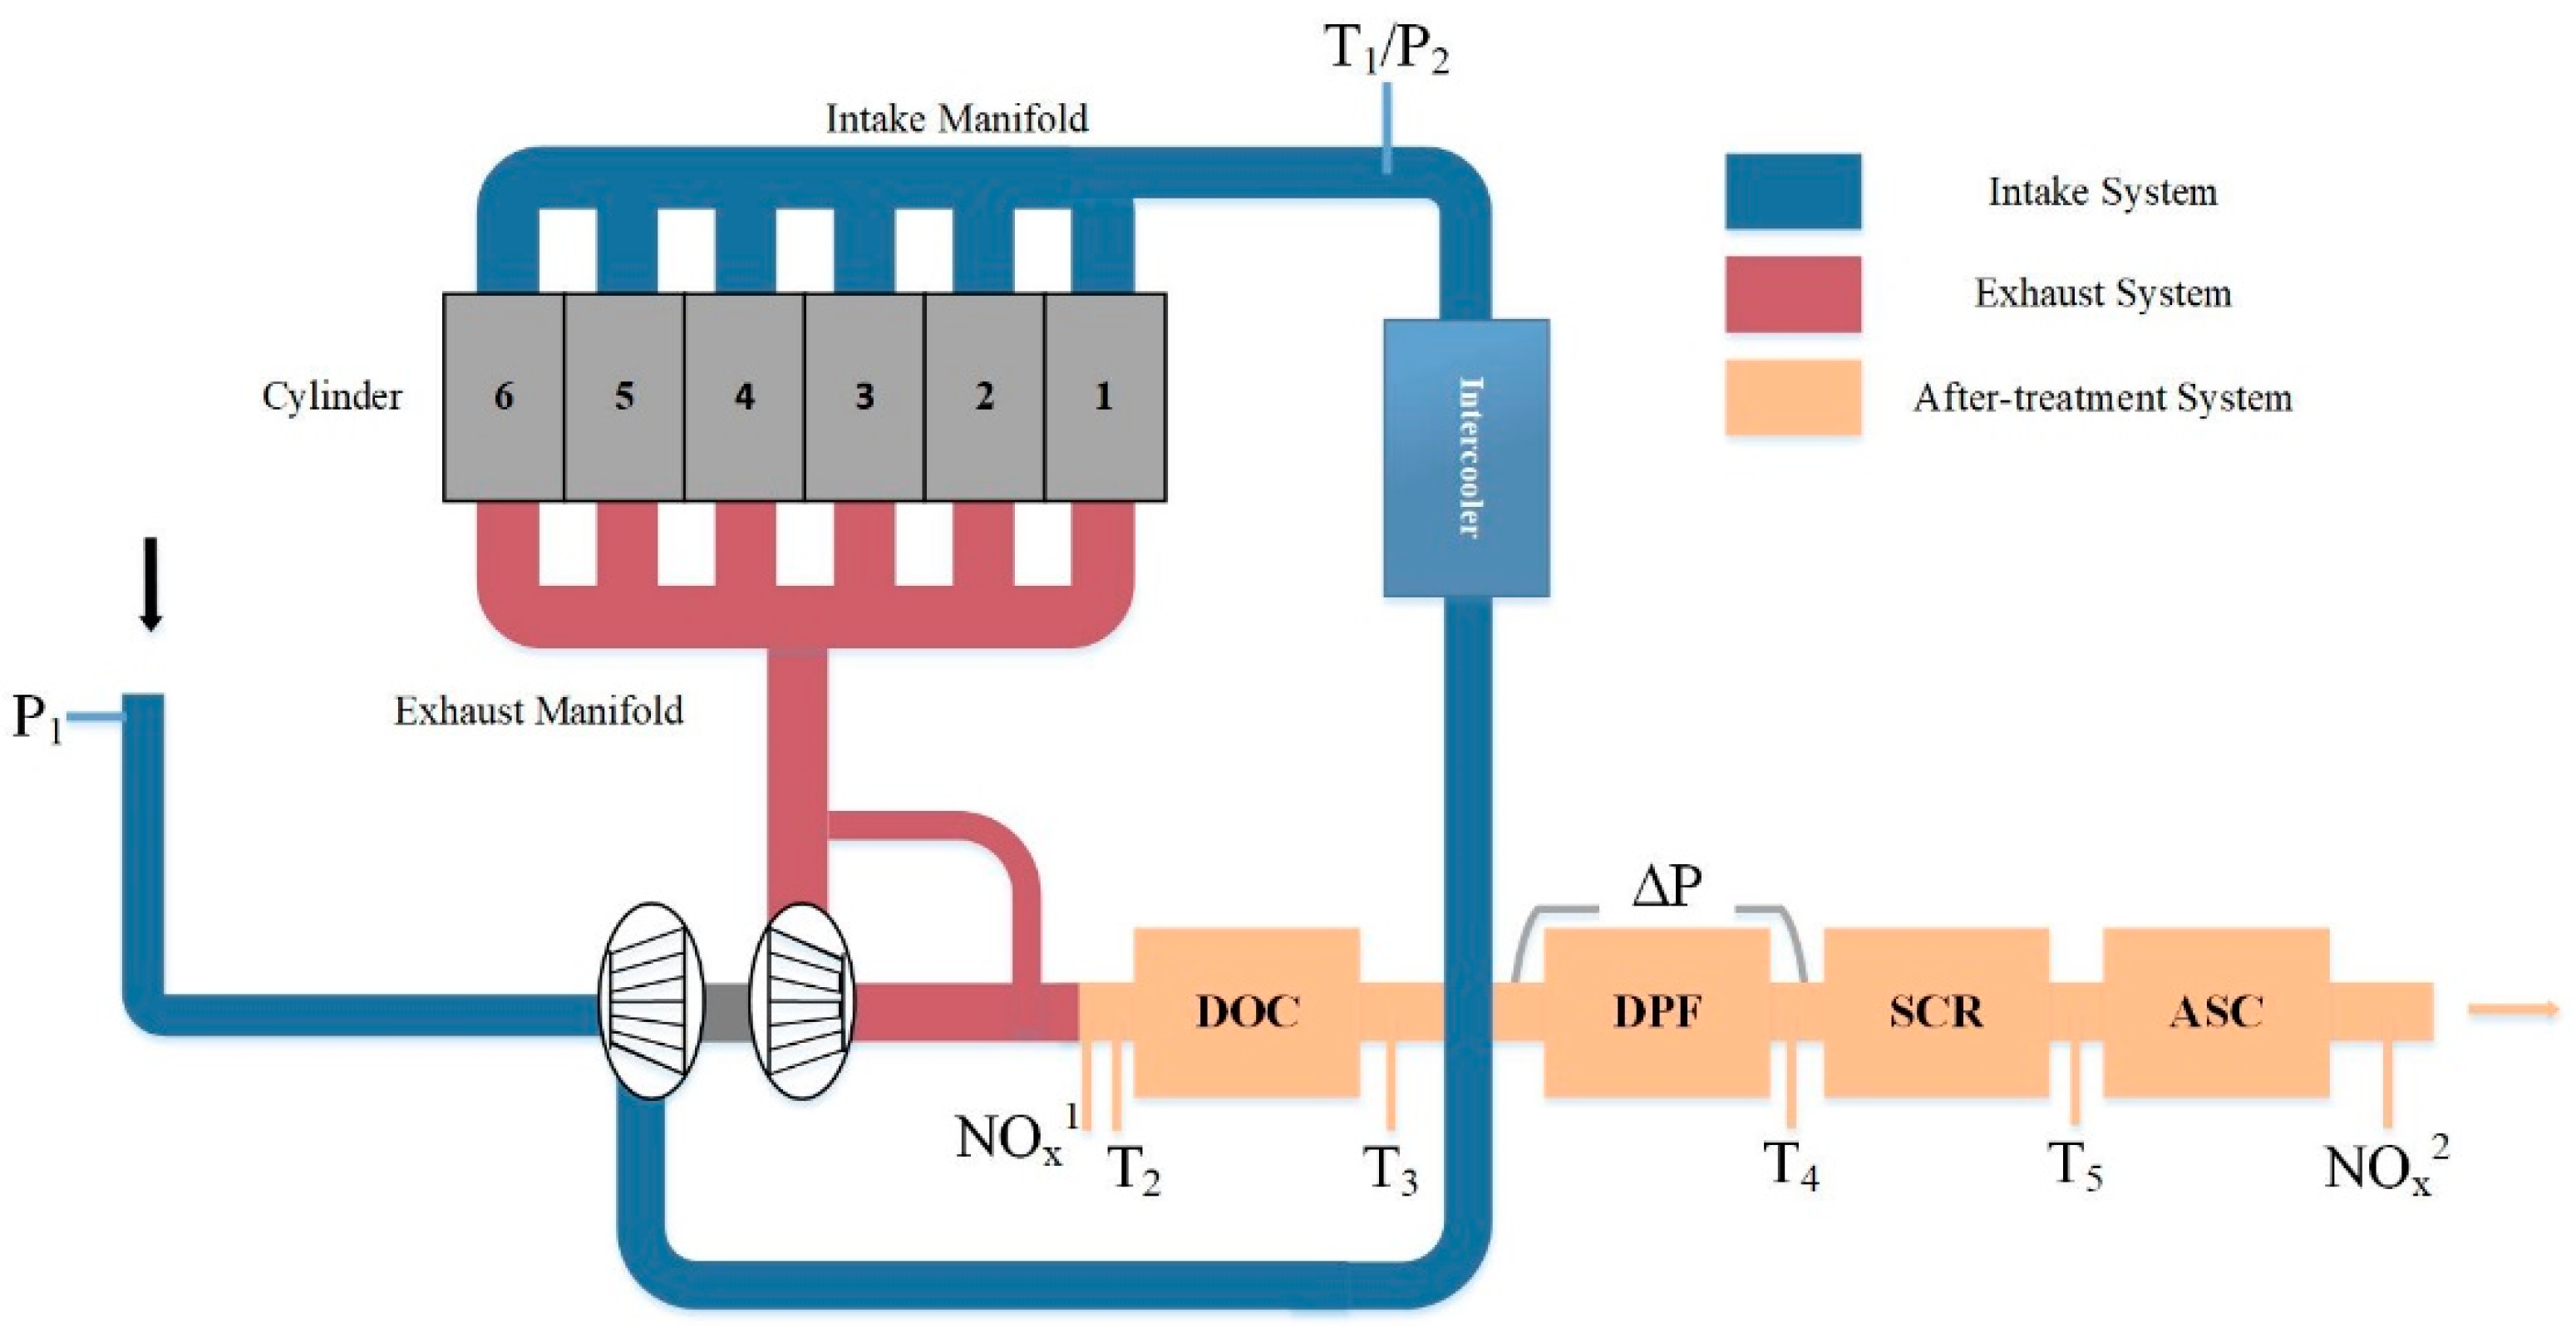
2.1. Process Description

In this paper, the object of study is a heavy-load diesel engine that integrates turbocharging technology and the SCR scheme to meet the China VI emission standard. Its air intake system, exhaust system, and after-treatment system are shown in Figure 1. In the intake system, air enters the engine cylinders through the turbocharger, intercooler, and intake manifold. In the exhaust system, exhaust gas enters the after-treatment system through the exhaust manifold and turbocharger. The turbocharger drives the turbine to rotate and compresses the air by the energy of the exhaust gas to increase the intake air volume. The air system consists of an intake system and an exhaust system. Additionally, in the after-treatment system, the DOC converts pollutants of emission to harmless products by oxidation reactions. The DPF captures PM in the exhaust gas and oxidizes the trapped particulates to regenerate the particulate trap. The SCR converts NO and NO2 to N2 and H2O in a lean diesel exhaust environment with the aid of a catalyst and reductant, in which the reductant is ammonia (NH3) carried in AdBlue [26]. The ASC reduces the unreacted ammonia in the exhaust gas by catalytic oxidation [2]. The fault detection of the air system and the after-treatment system is essential, because each link has its own function, and the failure of each link may cause excessive emission of pollutants.
In addition, the operational data of diesel engines is acquired and stored by sensors, electronic control units (ECU), controller area networks, and on-board diagnostic systems. As shown in Figure 1, the measurements include inlet pressure ( P 1 ), inlet pressure, and temperature after the intercooler ( P 2 and T 1 ), upstream NOx content ( N O x 1 ), upstream temperature of DOC ( T 2 ), upstream temperature of DPF ( T 3 ), differential pressure of DPF ( Δ P ), upstream and downstream temperature of SCR ( T 4 and T 5 ), downstream NOx content ( N O x 2 ), etc. For instance, the actual measurements of P 1 , P 2 , T 4 , T 5 are shown in Figure 2. The abscissa intervals represent 300 samples, which sampled every second. It can be seen that the actual operating data of diesel engines have strong correlation and are interfered by noise, which will lead to unsatisfactory detection performance if monitored by conventional methods.

2.2. Faults in the Air and after-Treatment Systems

In this paper, three kinds of high frequency faults of air systems and after-treatment systems are discussed, which include excessively low AdBlue consumption of SCR (i.e., Fault 1), excessive carbon load of DPF (i.e., Fault 2), and excessive pressure deviation of turbocharger (i.e., Fault 3).
Fault 1 means insufficient injection of ammonia, which would result in low conversion efficiency of NO and NO2, and further makes NOx emission substandard [10]. The fault may be caused by the blockage and leakage of the pipeline in the after-treatment system and the blockage or damage of the urea pump or nozzle. There are limitations in the traditional methods of fault determination, which depend on the percentage of urea consumption and fuel consumption. Fault 2 is easy to cause the occurrence of the plugging fault. When the engine is running at a high speed and the exhaust volume is large, the fault causes the displacement of the DPF carrier and liner, and even the phenomenon of the liner rupture and DPF carrier perforation. Currently, DPF pressure drop is used to estimate carbon load [9]. However, exhaust gas flow and the temperature of DPF also carry efficient fault information in actual vehicle operation. Fault 3 will lead to insufficient oxygen content in the intake system and inadequate fuel combustion, which causes the emission of pollutants and economic loss. It is usually detected when pressure deviation goes beyond limits. Based on the above discussion, the current detection methods for the three kinds of faults do not make full use of the information of the actual measurement variables. Therefore, this paper will introduce the canonical correlation analysis method to carry out data-driven fault detection research on the three faults.

3. Fault Detection Scheme Based on Optimal Selection of Fault-Relevant Variables

In this section, we propose a novel fault-relevant feature selection method based on the high-dimensional operational data of the diesel engine. In this method, the optimal variables are selected and the correlation among them is analyzed for fault detection. The general framework and the details of the proposed method will be discussed in the following.

3.1. The Framework for Optimal Selection of Fault-Relevant Variables

The framework of the proposed data-driven fault detection method is shown in Figure 3, which includes the selection of process variables, construction of the sub-model, optimization of variable selection, and test of the optimal sub-model. The selection of process variables forms the fault-relevant variable subsets by randomly selecting the training variables. The fault-relevant variable is defined as the variable that can provide useful information for detection modeling and the number of sub-models, defined as P . The construction of the sub-model establishes CCA fault detection sub-models based on the fault-relevant variable subsets, and uses the fault data in the training set to evaluate the performance of sub-models. The optimization of variable selection uses the EGA method to optimize the subset of fault-relevant variables until obtaining a suitable optimal sub-model. Finally, the optimal sub-model is tested with the corresponding data in the testing set, according to the fault-relevant variables of the optimal sub-model, which can obtain the final fault detection results.

3.2. CCA-Based Fault Detection Method

As a standard multivariate analysis method, canonical correlation analysis is widely used in data-driven multivariate statistical monitoring. To be specific, for the N dimensional normalized input and output data vectors, or two measurement vectors U = ( u 1 , u 2 , , u N ) R l × N and Y = ( y 1 , y 2 , , y N ) R m × N , where l and m are the number of variables dimension in u and y , the CCA generate residual signals by analyzing the correlation between them [22]. It seeks to acquire two canonical vector sets J R l × k and L R m × k such that correlation coefficients between J T U and L T Y can be maximized. The objective function with arguments J and L is formulated as Equation (1)
( J , L ) = arg max J T Σ U Y L ( J T Σ U J ) 1 2 ( L T Σ Y L ) 1 2
A standard way to solve the optimization problem Equation (1) is given below. Performing a singular value decomposition on matrix K gives
K = Σ U 1 2 Σ U Y Σ U 1 2 = R Σ V T
with
R = [ r 1 , r 2 , , r l ] R l × l V = [ v 1 , v 2 , , v m ] R m × m Σ = [ Σ k 0 0 0 ]
where Σ k = diag ( λ 1 , λ k ) , k min ( m , l ) with λ 1 λ 2 λ k arranged in descending order. The λ i ( i = 1 , 2 , , k ) represent the canonical correlation relation between U and Y . The corresponding canonical correlation vectors are derived according to
J = Σ U 1 2 [ r 1 , r 2 , , r k ] R l × k L = Σ Y 1 2 [ v 1 , v 2 , , v k ] R m × k
Based on these properties, the residual signal for fault detection is generated in the following form:
r = J T u Σ L T y
Thus, the T 2 statistic can be developed based on CCA as
T r 2 = r T Σ r 1 r
where Σ r = I l Σ Σ T .
Note that the statistical framework of hypothesis testing is used for determining whether a fault exists in a process. A measurement model is formulated as Equation (6)
r = f + ε R n
where ε N ( 0 , Σ ) and Σ is the actual covariance matrix; f implies the fault. The χ 2 is a basic statistic constructed as follows:
χ 2 = r T Σ 1 r ~ χ 2 ( n )
In the data-driven framework, the covariance matrix Σ is the estimated value in the case of sufficient data volume, which replaces the actual value. So χ 2 statistic becomes T 2 statistic for multivariate statistical fault detection.
Therefore, the control limits T t h 2 can be determined by the upper bound of T 2 statistics at level of significance α , that can be formulated as Equation (8)
T t h 2 = χ α 2 ( n )
where χ α 2 ( n ) is the value of the Chi-square distribution at α level of significance with n degrees of freedom.
Then the fault detection logic can be formulated as
{ T 2 < T t h 2 | faulty - free T 2 > T t h 2 | faulty
which means the fault would be detected by the statistics model when the value of T 2 exceeds T t h 2 .
Besides, the threshold T t h 2 of T 2 test statistic is a constant that only depends on significance α and freedom degrees n . The measurements model with different noise levels as
r a = f + ε a r b = f + ε b
where ε a N ( 0 , Σ a ) and ε b N ( 0 , Σ b ) .
Under the condition that Σ a < Σ b and T t h 2 a = T t h 2 b = χ α 2 ( n ) , it becomes evident that
f T Σ a 1 f > f T Σ b 1 f
Hence, compared to T t h 2 b = r b T Σ b 1 r b , T t h 2 a = r a T Σ a 1 r a can provide better fault detectability.
T r 2 test statistic of this paper realizes optimal fault detection with a given significance level.
In addition, fault detection rate (FDR) and false alarm rate (FAR) are two important indicators for evaluating the performance of fault detection methods. For the T 2 statistics of CCA model, the statistical definitions of FDR and FAR are expressed by Equation (12). Among them, p r o b { · } refers to the probability.
F D R = p r o b { T 2 > T t h 2 | faulty } F A R = p r o b { T 2 > T t h 2 | faulty - free } = α
The CCA can be used to extract the correlation between the actual state data of diesel engines and realize the fault detection. However, the fault of the air system and after-treatment system usually only affect the parameters of the front and rear components and the final emission index in practice. When all of the variables are involved in the detection, the Chi-square distribution will have a large degree of freedom, and the control threshold will be relaxed, thereby limiting the fault detection effect. Therefore, it is the key to reduce the degree of freedom by selecting the fault-relevant variables and eliminate unfavorable information to increase the accuracy of specific fault detection.

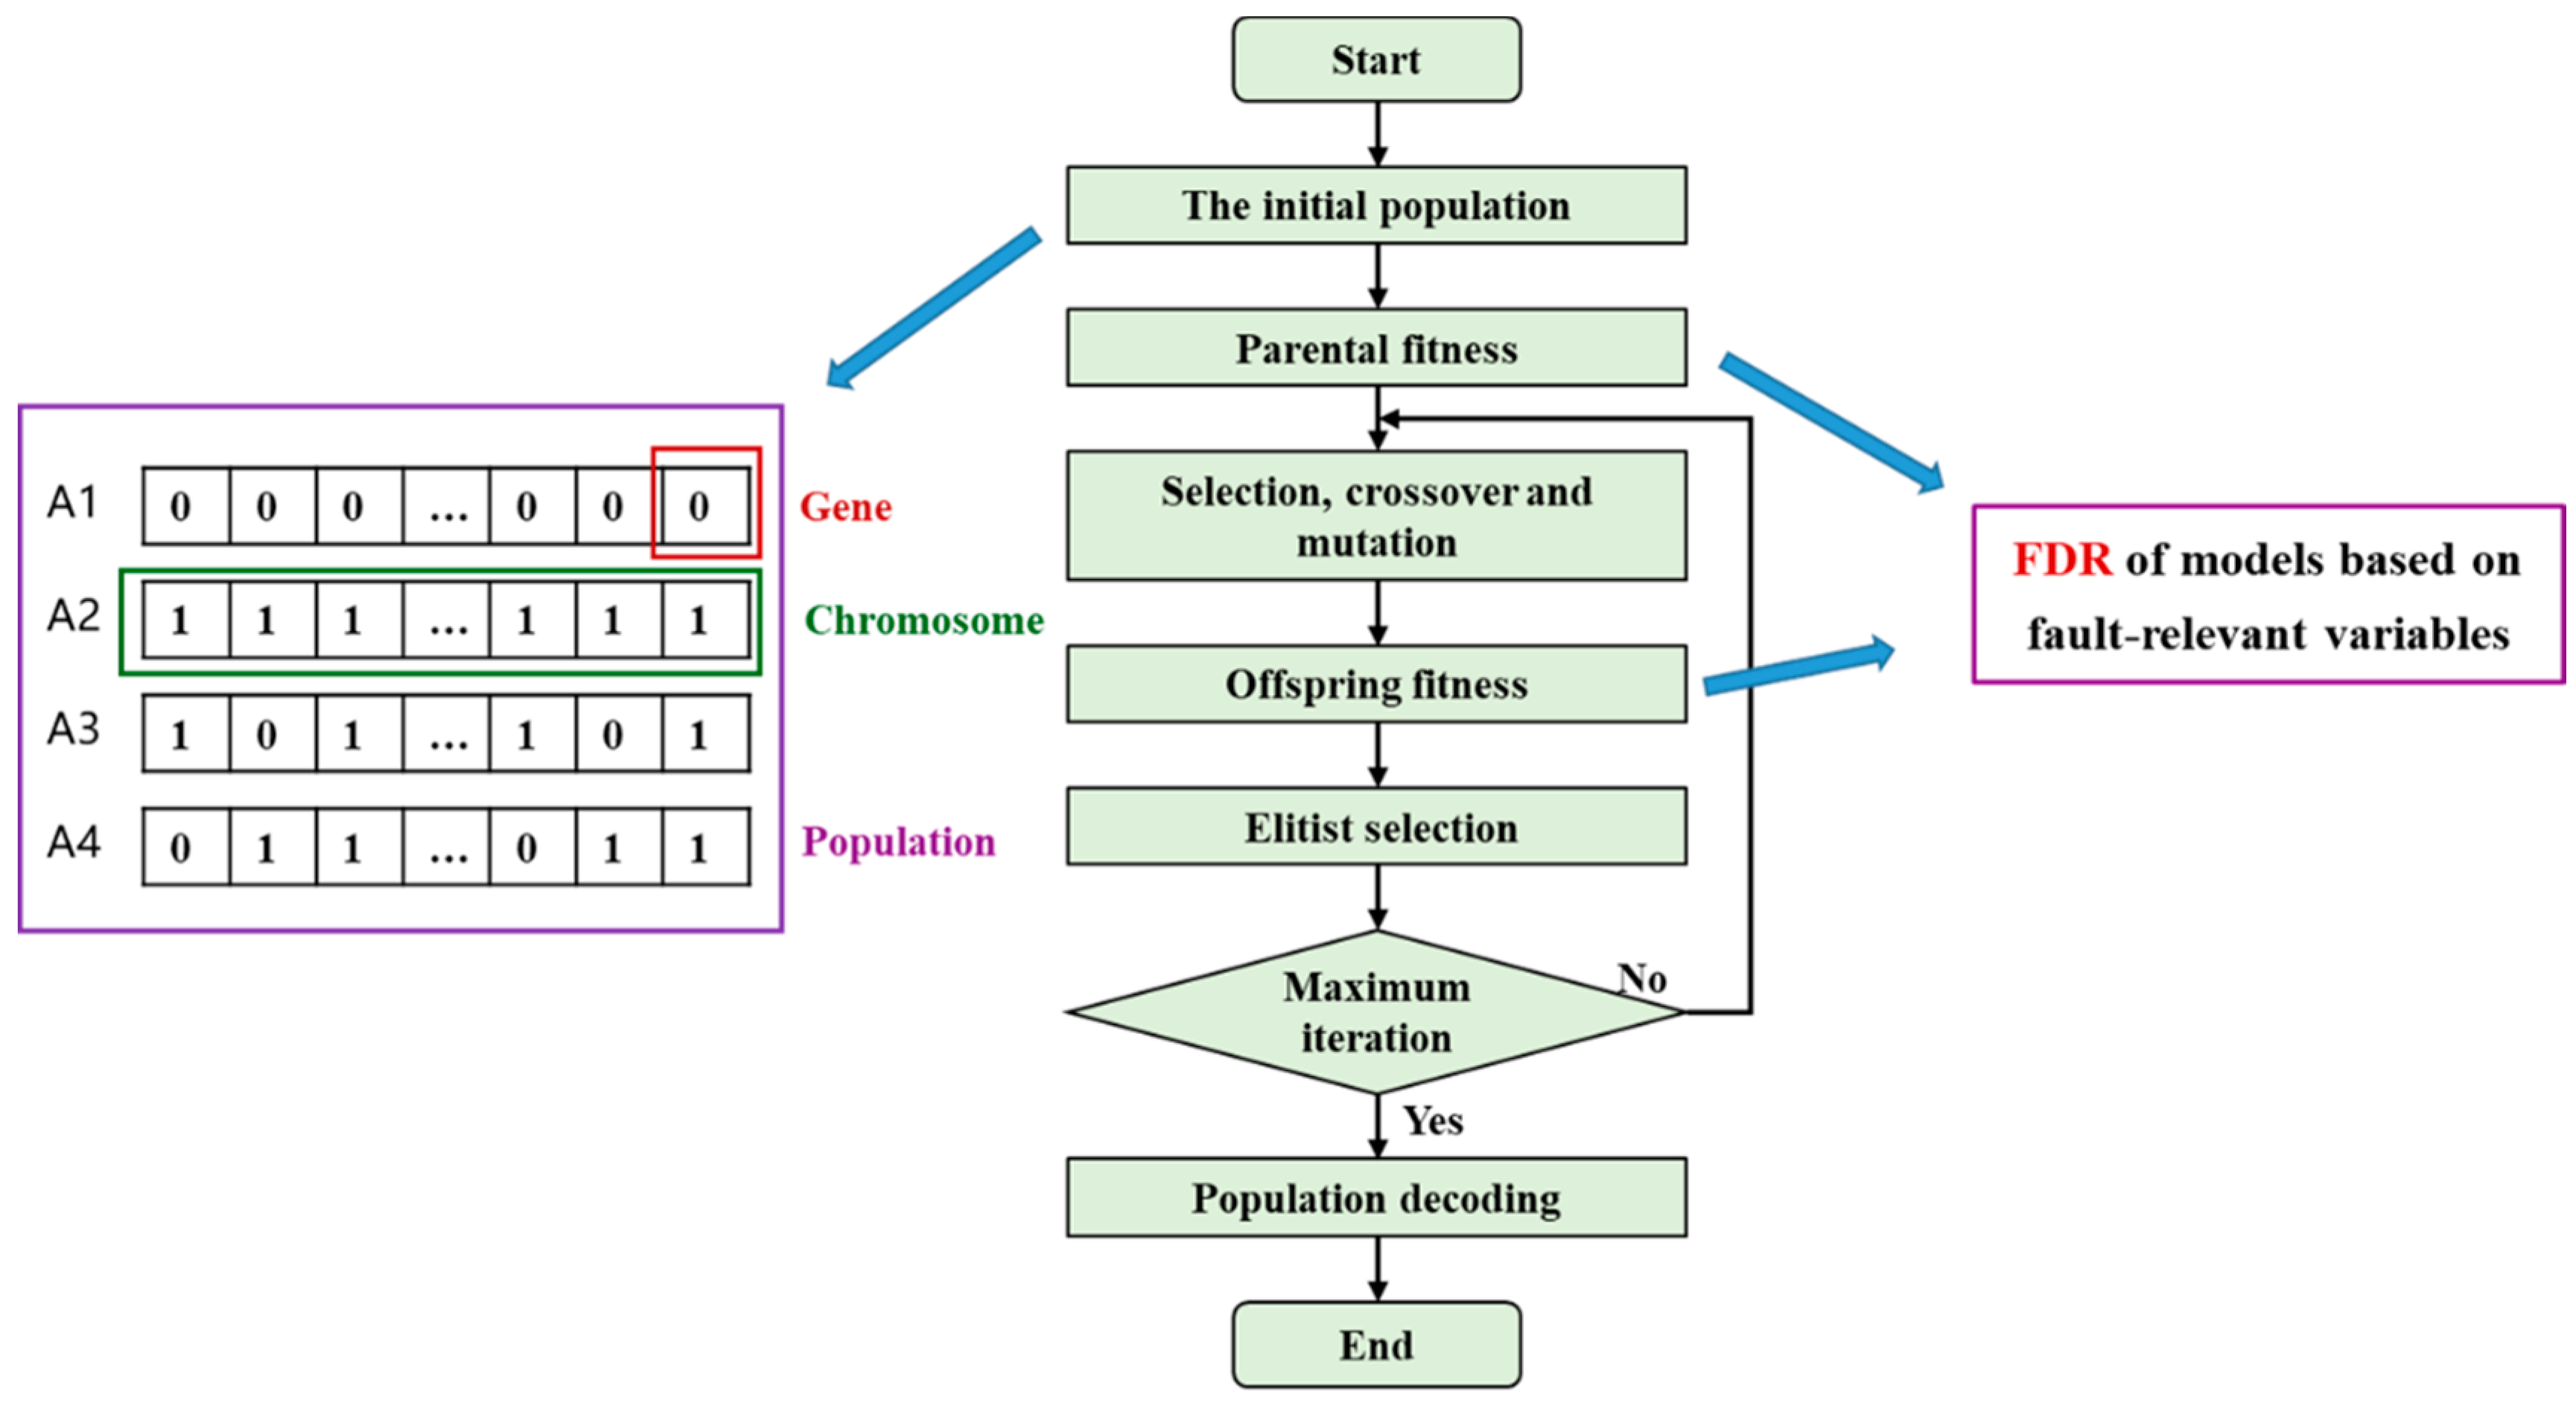
3.3. The Optimal Selection of Fault-Relevant Variables with EGA

To solve the problem formulated above, EGA–CCA is proposed, which uses EGA to select the fault-relevant variables and realize the variable optimization of CCA models. Specifically, EGA needs to construct a fitness function as the optimization objective. As shown in Equation (13), FDR is defined as the fitness function for EGA optimization, which is a major performance indicator of fault detection. Notably, variables that are affected by faults and contain useful information for fault detection are defined as fault-relevant variables (FRVs). Variables that are not affected by faults and cannot provide effective information for fault detection are defined as fault-irrelevant variables in this paper.
max F D R F R V s = N F , F , F R V s N F s . t .   F A R = N N , F N N α
where F D R F R V s is the detection rate of FRVs sub-model; N F , F , F R V s is the number of fault samples detected in the FRVs sub-model; N F is the number of fault samples; N N , F is the number of normal samples considered to be faulty; N N is the number of normal samples; α is the significance level. The FDR of the fault can be maximized by searching FRVs subset for optimizing the fitness function.
For a given training data set, the EGA method divides the variables into a subset of the fault-relevant variables and a subset of the fault-irrelevant variables through the following steps. The corresponding optimization process is shown in Figure 4.
Step 1: Define chromosomes. Generally, the variables are encoded by genes in the chromosome, and the value of a gene indicates the corresponding variable is selected or not. A chromosome can be designed as A = [ 1 0 1 1 ] R 1 × ( l + m ) , where ‘1’ represents selecting the corresponding variable and ‘0’ represents not. As an example, “01010000” indicates that only the second and fourth variables are selected and included in the detection model while the remaining 6 variables are not.
Step 2: Calculate fitness values. The subset of fault-relevant variables can be expressed based on the initial population. Then, the CCA method is performed with subset data of FRVs, respectively. Finally, the training fault data set is used to calculate the F D R F R V s of each model as the fitness value of each chromosome.
Step 3: The parental generations produce offspring through selection, crossover, and mutation, and then calculate offspring fitness values, like in Step 2.
Step 4: The elitist selection is achieved by retaining the chromosomes with larger fitness values through comparing the fitness values of the parents and progeny species in the population.
Step 5: Repeat steps 2, 3, and 4 until the maximum fitness value is obtained or the termination condition is met. In the end, the “1” gene of the best individual in the chromosome represents the fault-relevant variables.
The above steps are the concrete implementation of the EGA–CCA scheme proposed in this paper. The proposed method can eliminate the non-beneficial information variables and only select the fault-relevant variables to establish the optimal CCA analysis model for specific faults via EGA.

4. Experiment and Analysis

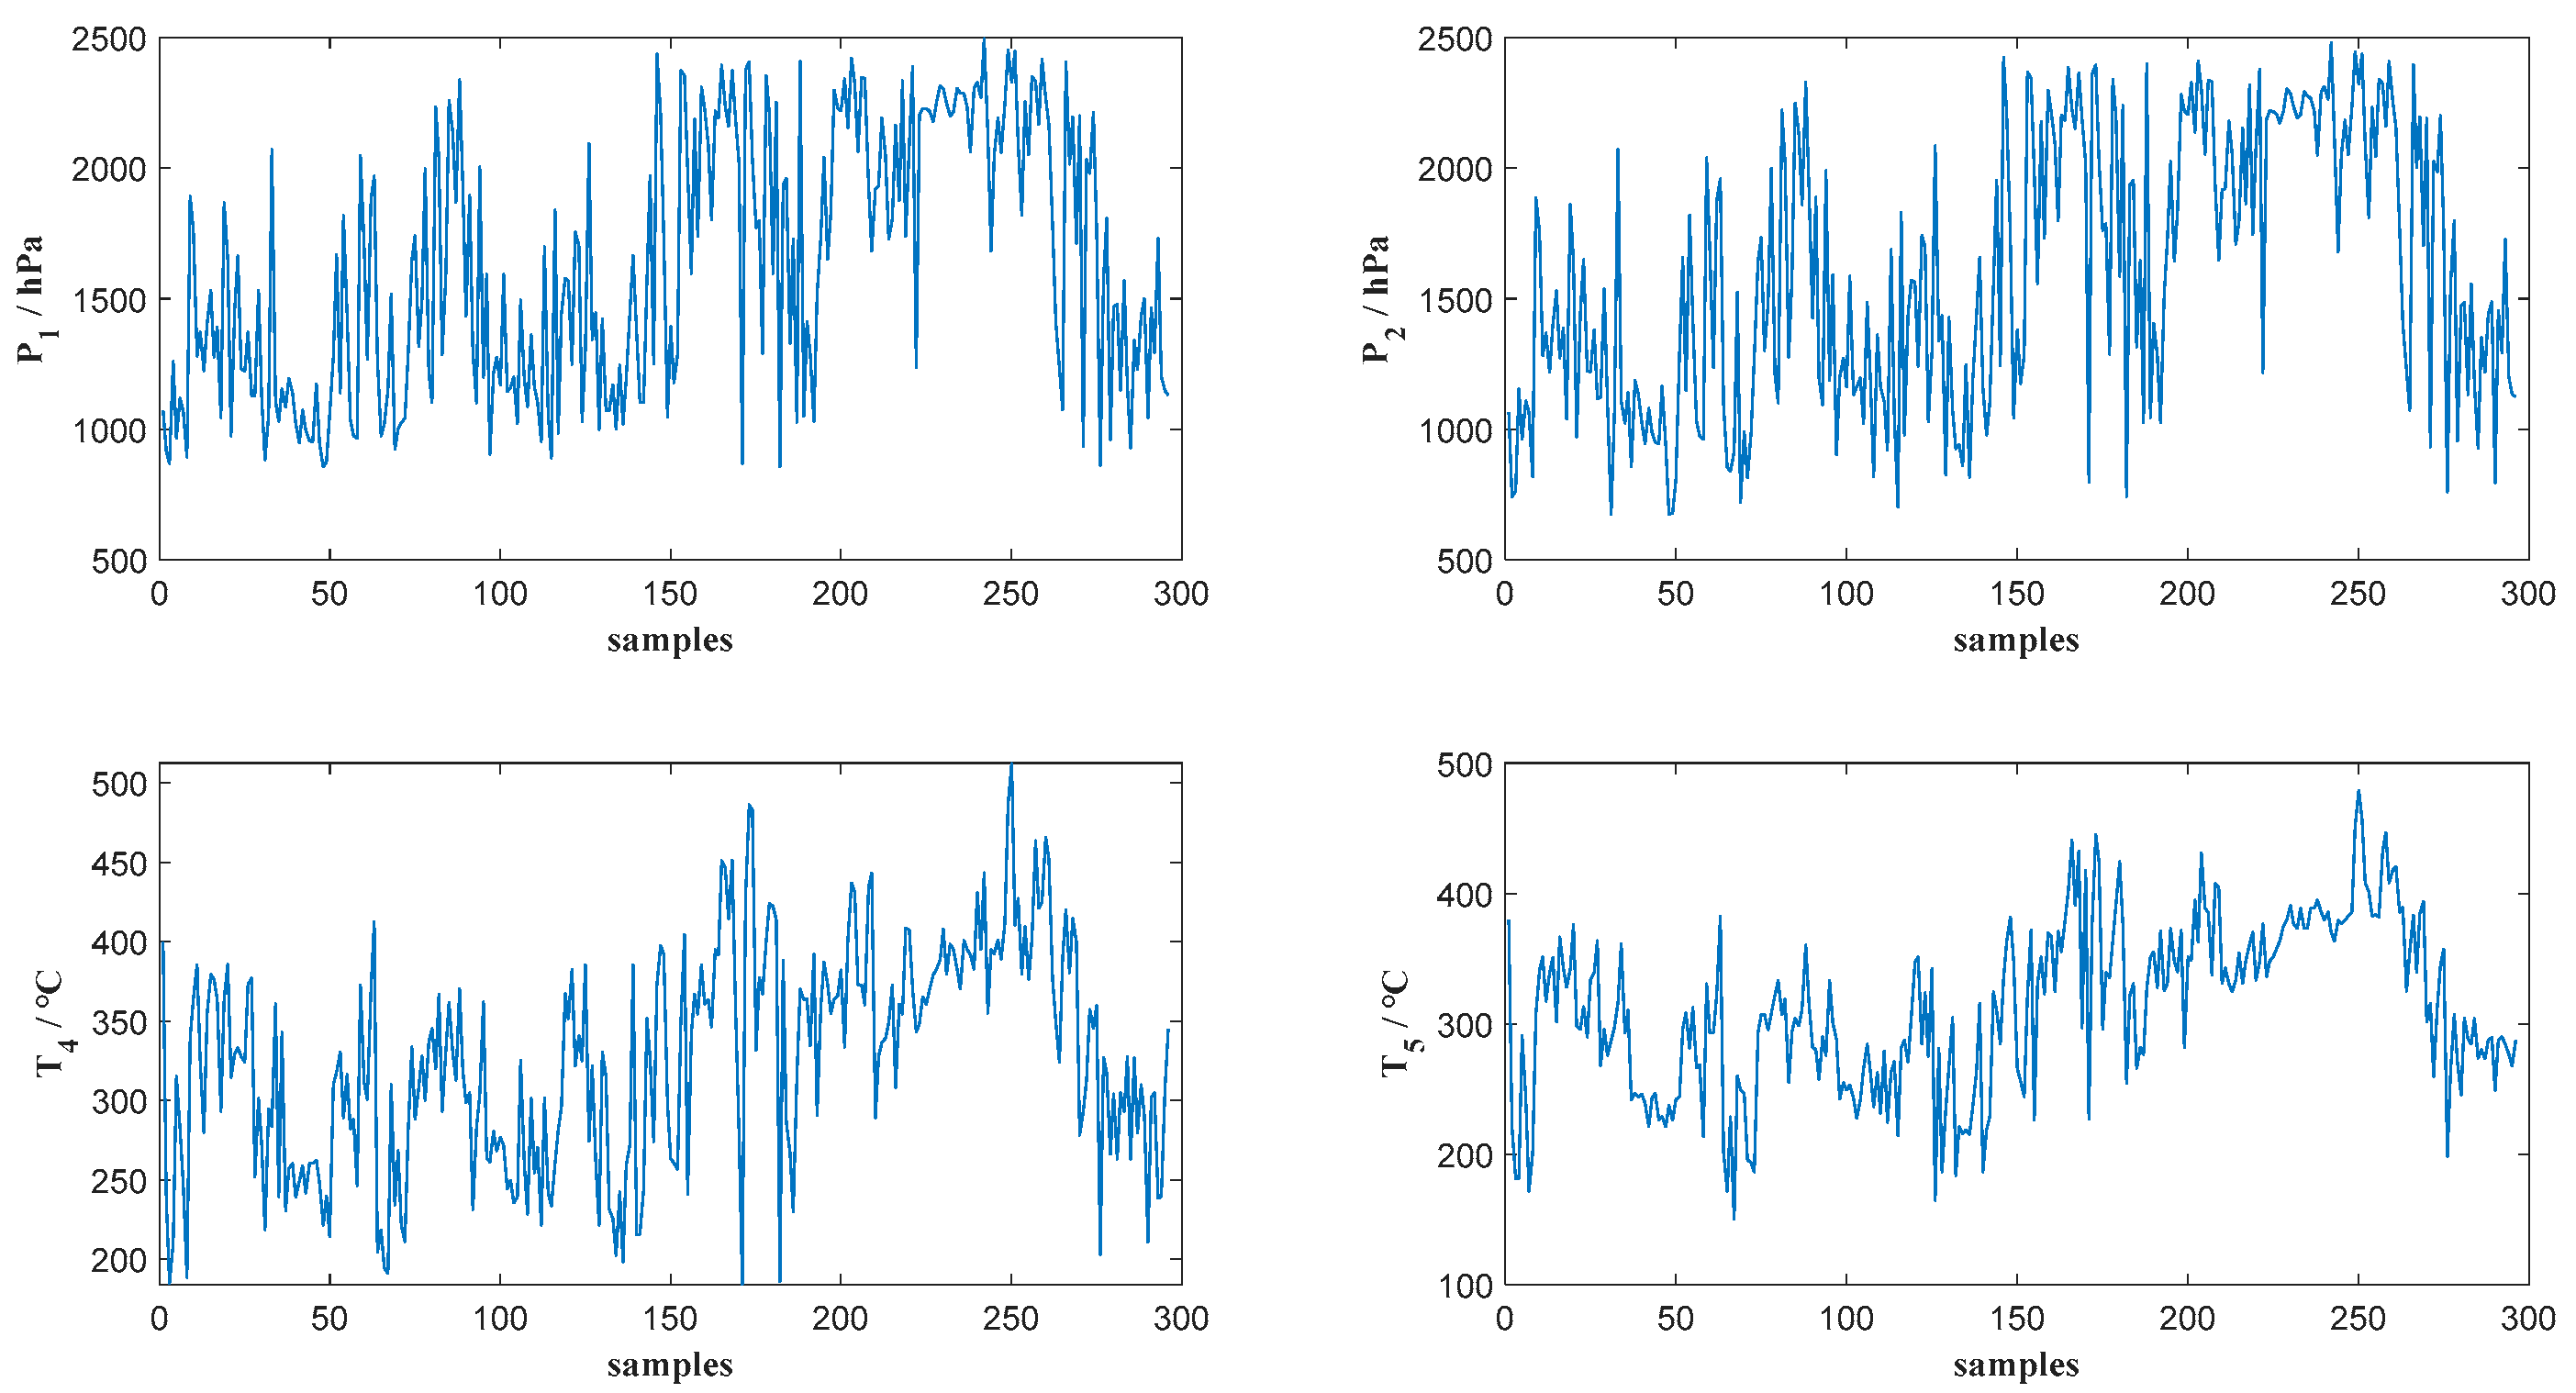
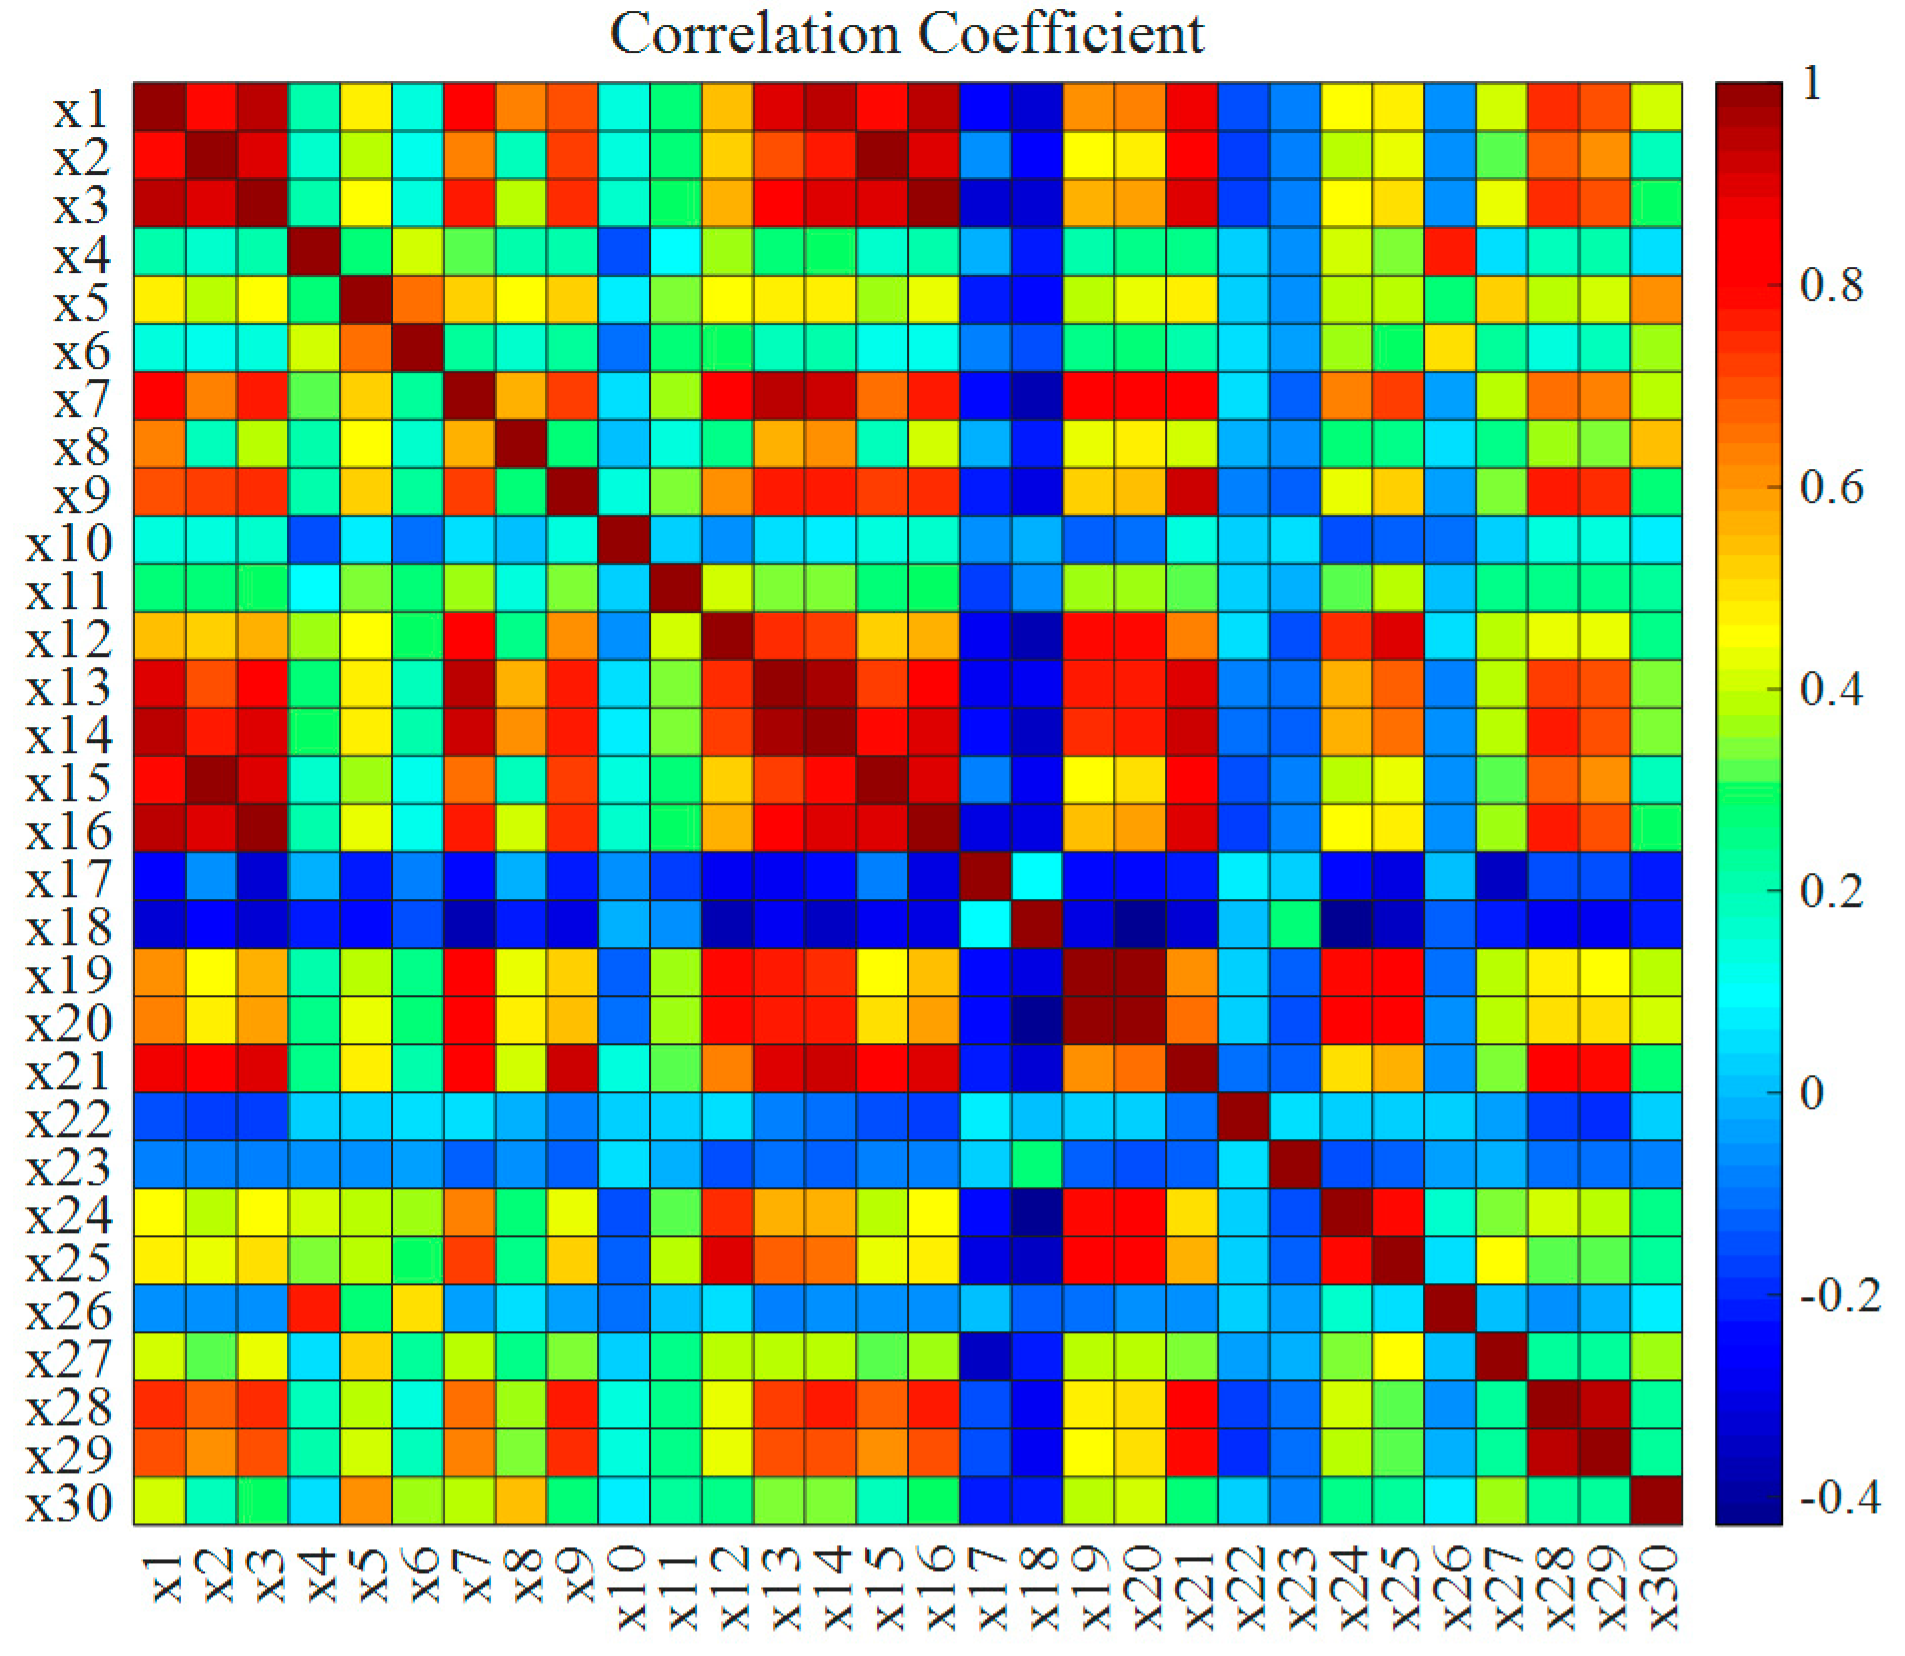
4.1. Data Description and Analysis
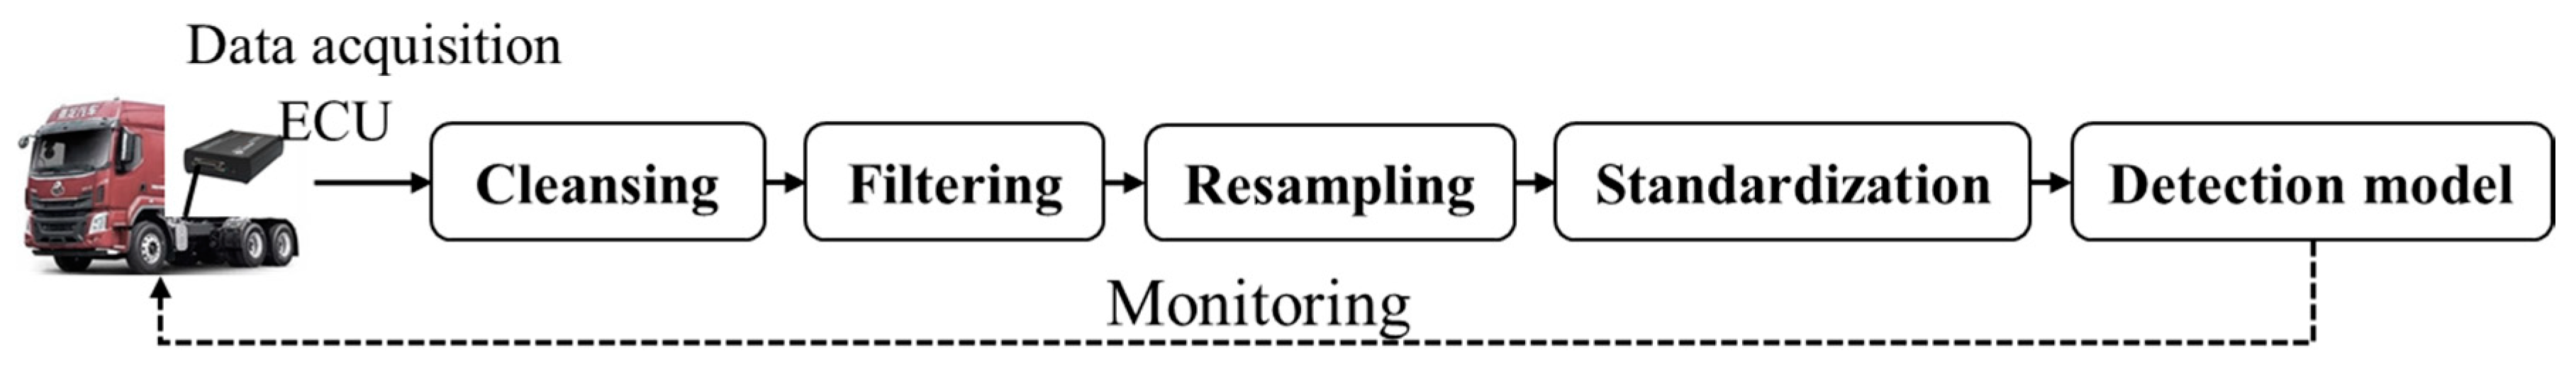
The fault detection performance of the above method (implemented with MATLAB R2019a) was verified in 1-year practical running data of a vehicle diesel engine. The dataset has 86-dimensional measurements, including engine air system relevant variables, after-treatment system relevant variables, and fault codes; the key measurements can be found in Figure 1. In order to obtain the appropriate training data set for better modeling performance, it is necessary to preprocess the raw data. The pipeline with the pre-treatment operations of the data is shown in Figure 5, which includes the main four parts as follows:
(1)
Cleansing: the Boolean variables, fault codes, and unsatisfactory variables for which the ratio of null exceed over 50%, would be filtered out. Moreover, the null and outliers in the remaining variables would be deleted as well.
(2)
Filtering: the significant noise will be filtered by the moving the average method.
(3)
Resampling: the uniform sampling is selected to obtain appropriate modeling and test data sets.
(4)
Standardization: the original data subtract the mean and divide by the standard deviation to obtain normally distributed data, with a mean of 0 and standard deviation of 1, which makes different variables have the same weighted influence on the model.
Through the above pre-treatment operations of the data, a 30-dimensional candidate variables X = ( x 1 , x 2 , , x 30 ) T for diesel engine fault detection is obtained and shown in Table 1. It includes speed, torque, exhaust gas flow, exhaust gas pressure, temperature, pressure, differential pressure of DPF, and other key signals, which consist of the latent operating condition information of the diesel engine.
In addition, the correlation analysis is performed on the 30-dimensional candidate variables of the diesel engine to obtain the heat map of the correlation coefficient, as shown in Figure 6. The darker the color of the small squares, the stronger the correlation between the horizontal and vertical variables. From Figure 6, it can be seen that there are plenty of red and dark blue squares, which implies the actual data of the diesel engine has strong correlation.

4.2. Experimental Settings

For every fault studied in this paper, the fault detection model is established with 3000 samples of non-fault training data. The fault training data with 1000 samples is used to calculate the fitness value of the sub-model, and the final model detection performance is verified with another 1000 samples of fault testing data. Each dataset contains 30-dimensional candidate variables, as shown in Table 1. CCA-based fault detection of diesel engines establishes a fault detector for a specific fault using variables with greater influence of fault included in Y and the remaining candidate variables included in U . The details of U and Y about the three faults are shown in Table 2, and the T r 2 is T 2 test statistic.
In addition, the significant level α is 0.05 in the CCA fault detection model. Moreover, the parameter values of the elitist genetic algorithm in this study are shown in Table 3. Specifically, the crossover operator in the EGA method chosen in this paper is the classic single-point crossover operator, in which the crossover rate is set as 1. Mutation operation produces a random number at each gene site in the crossover offspring. If the number is less than the mutation rate 0.01, the bit is reversed; otherwise the bit remains the same.

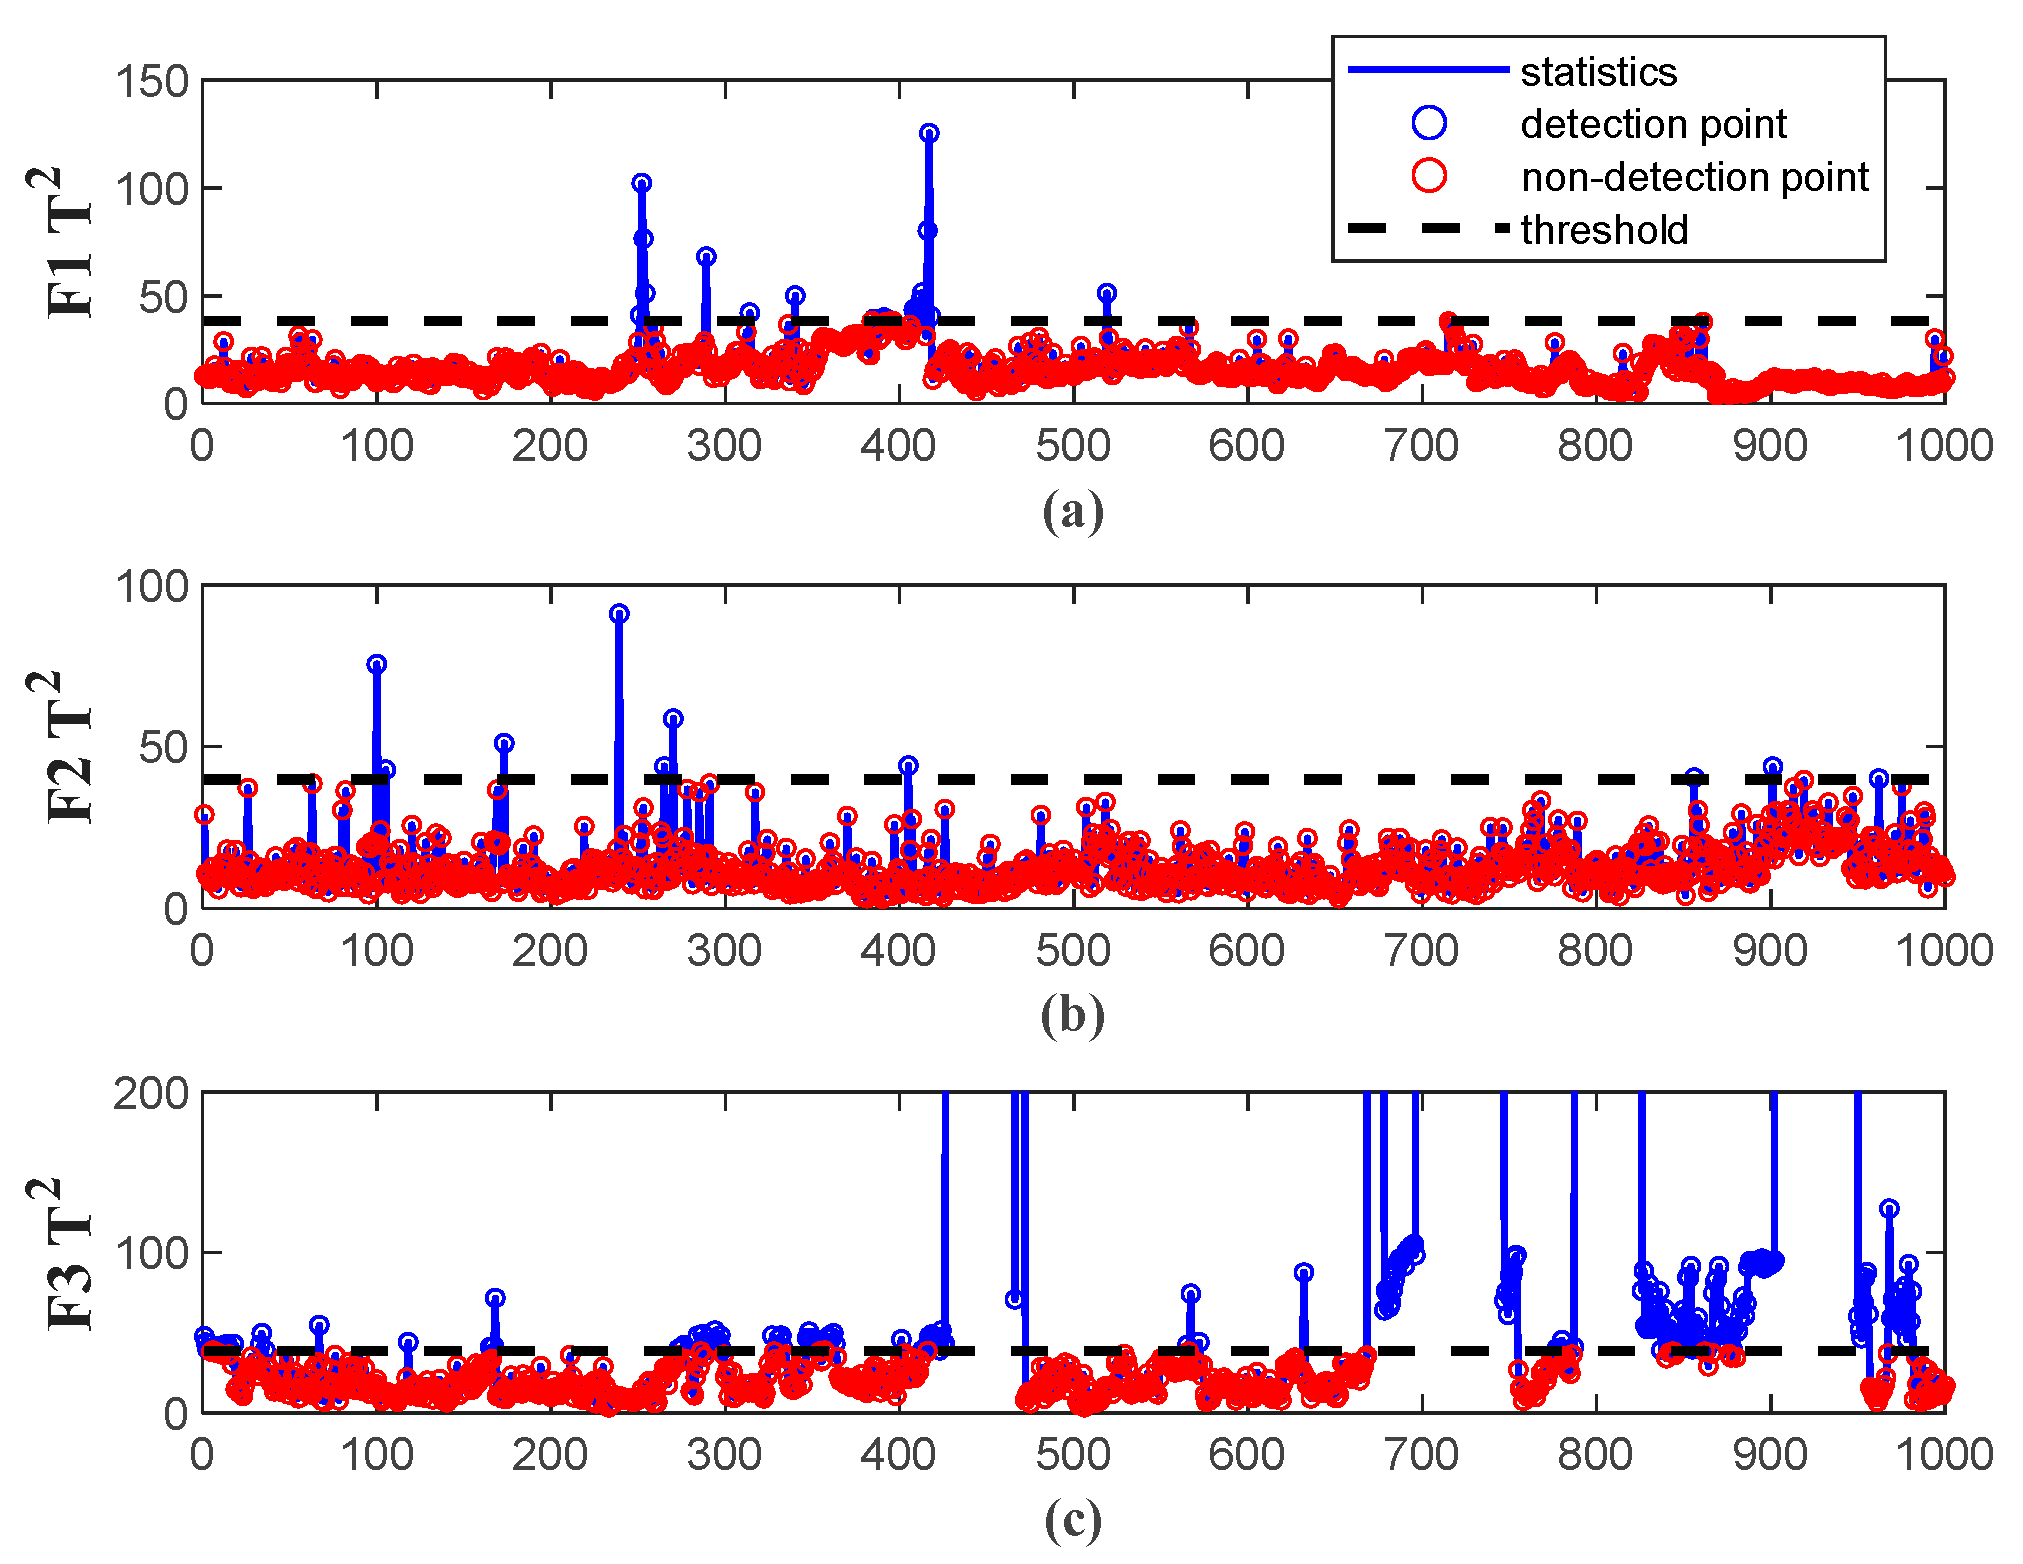
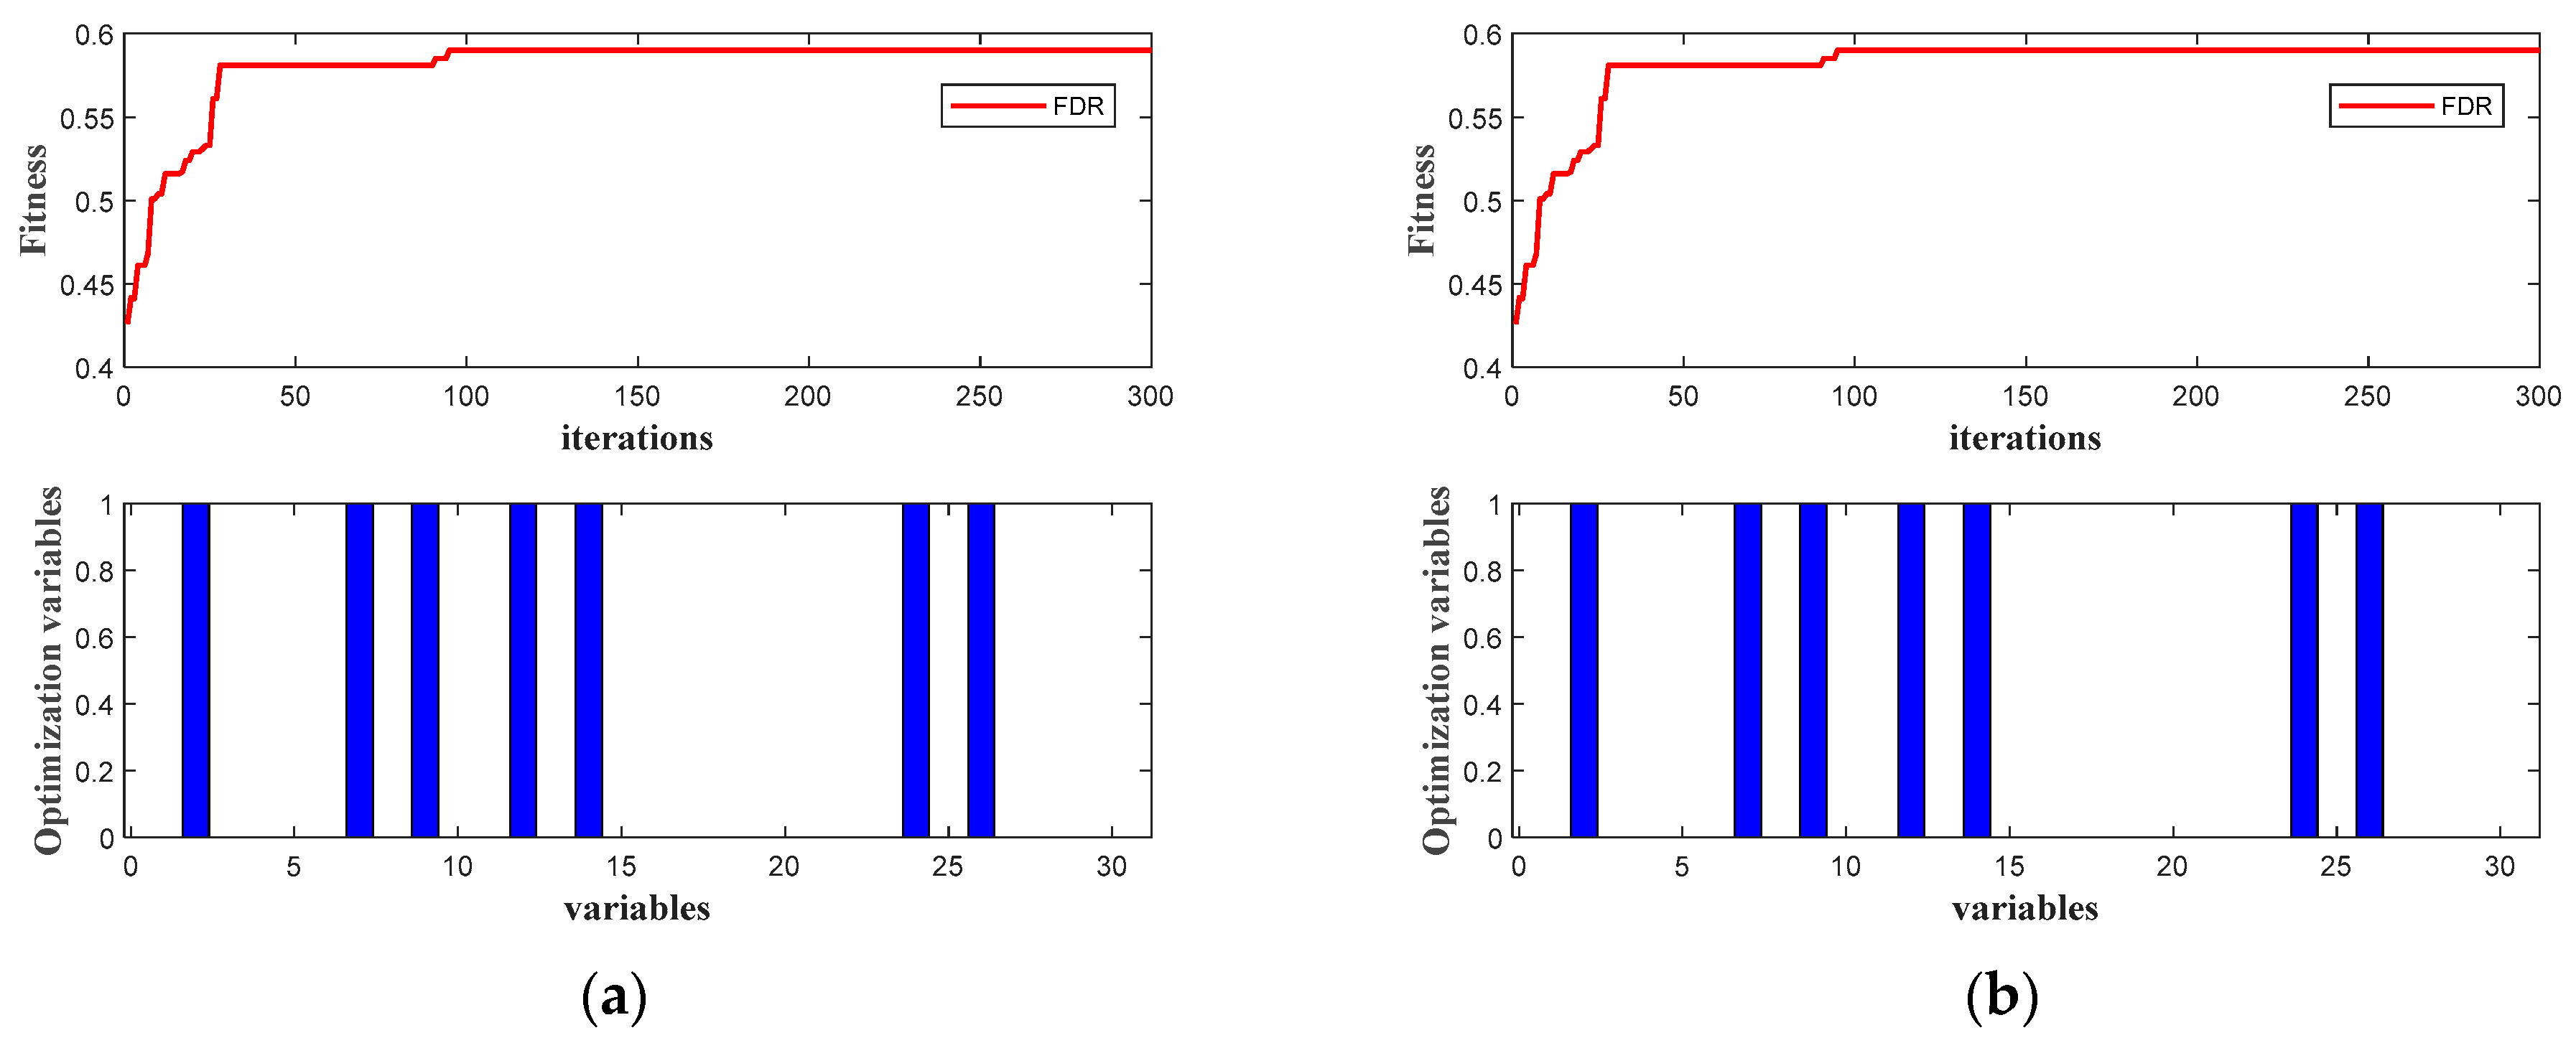
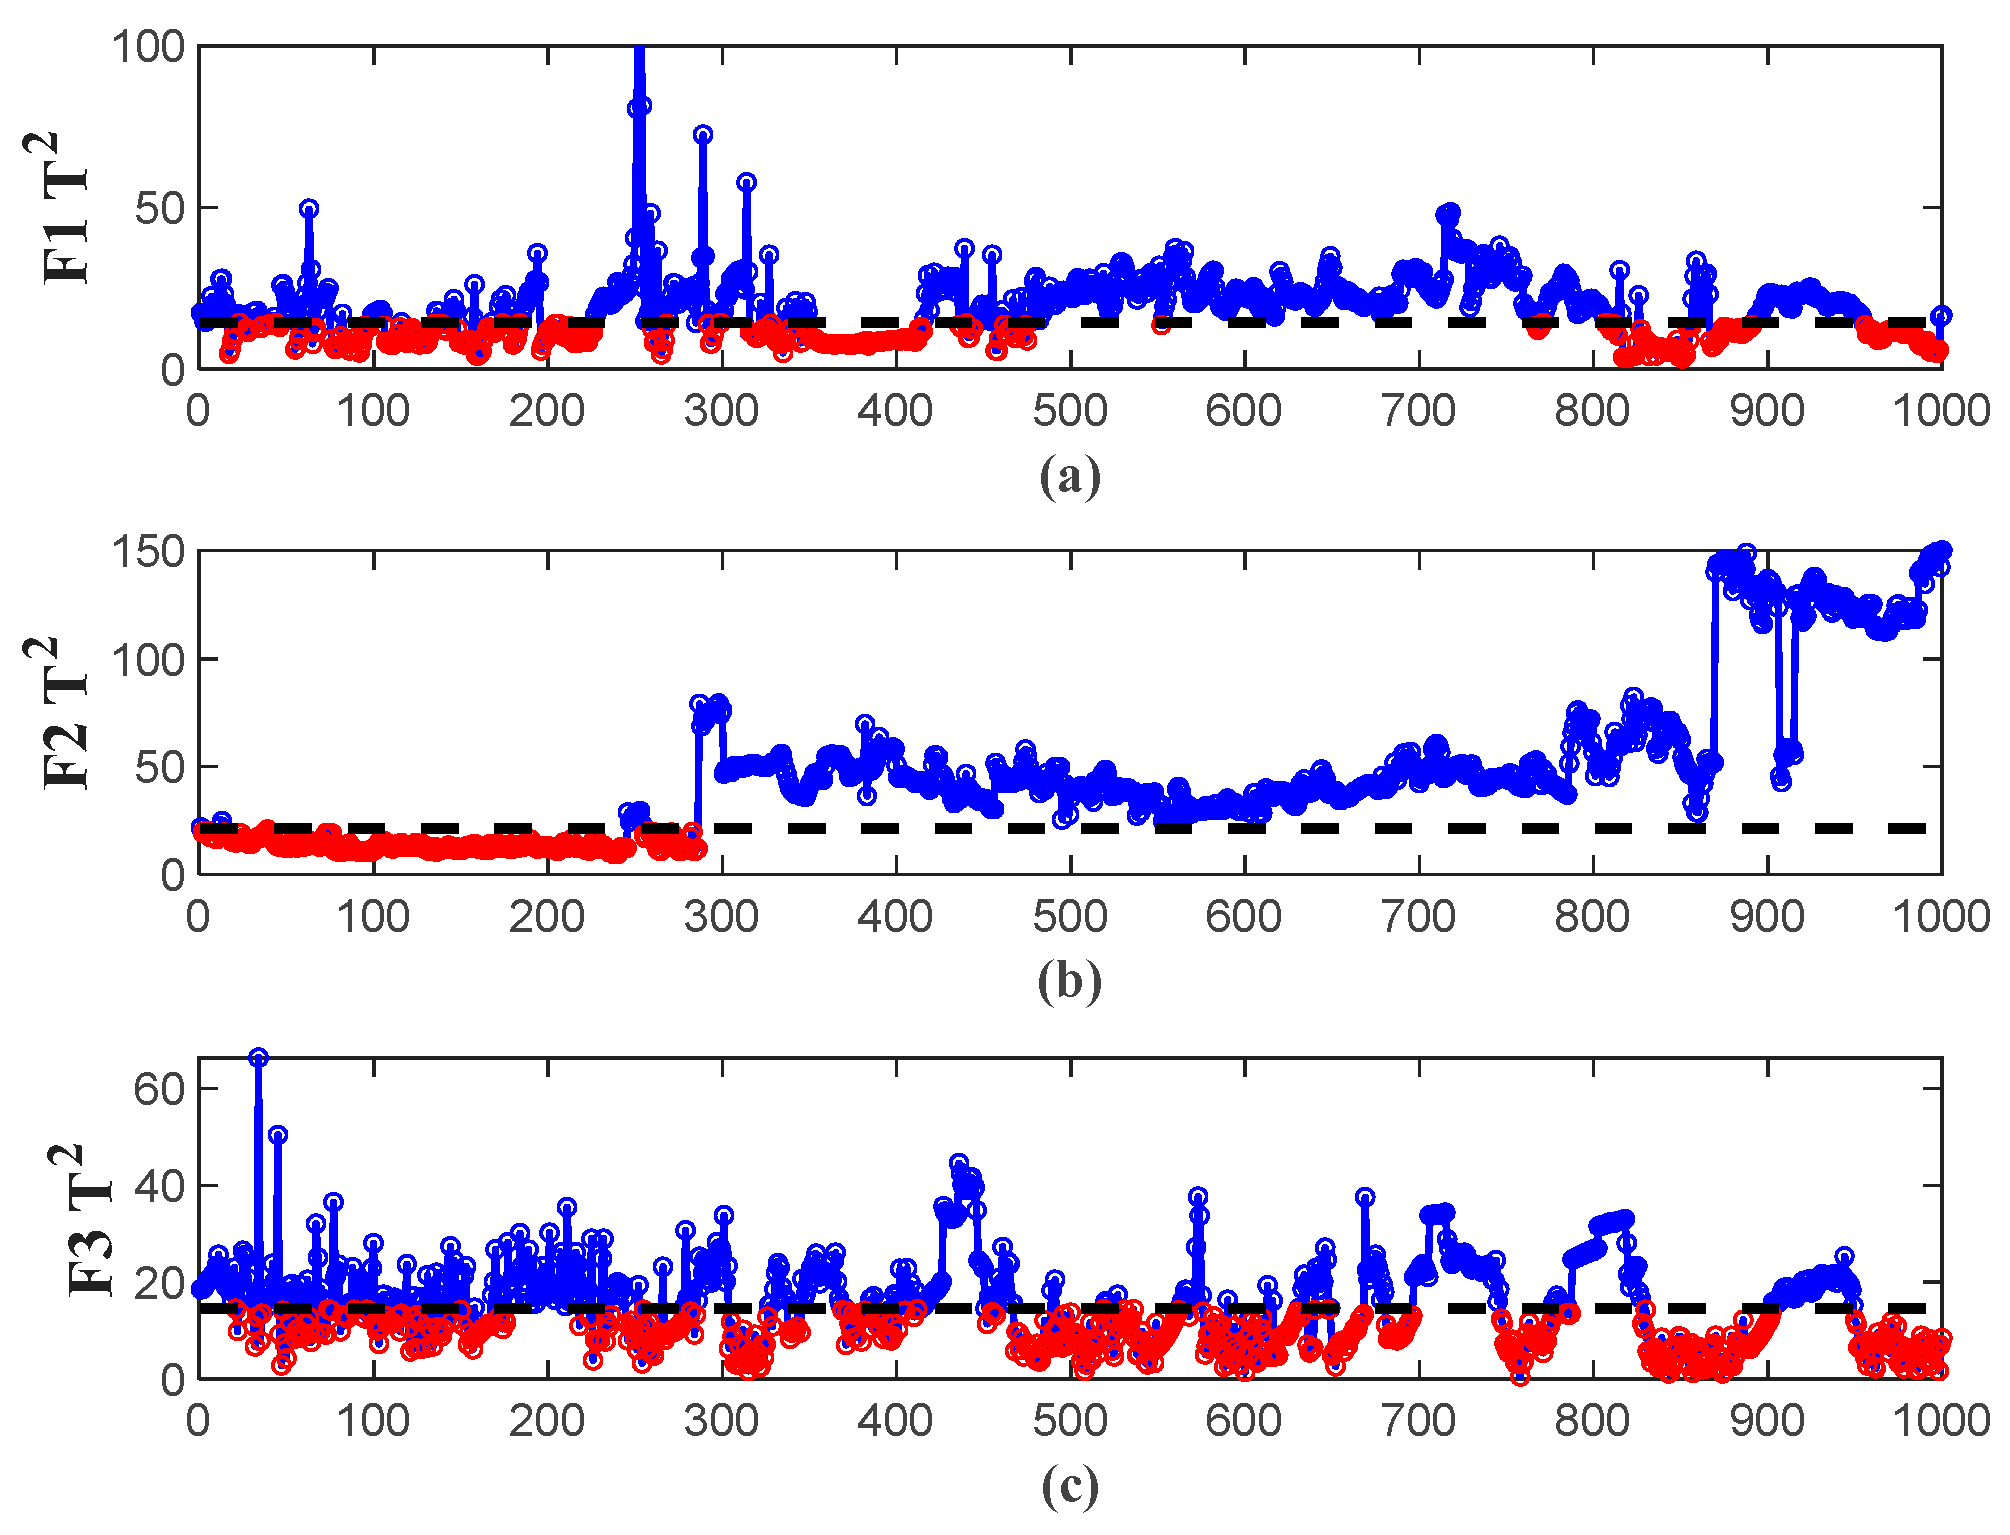
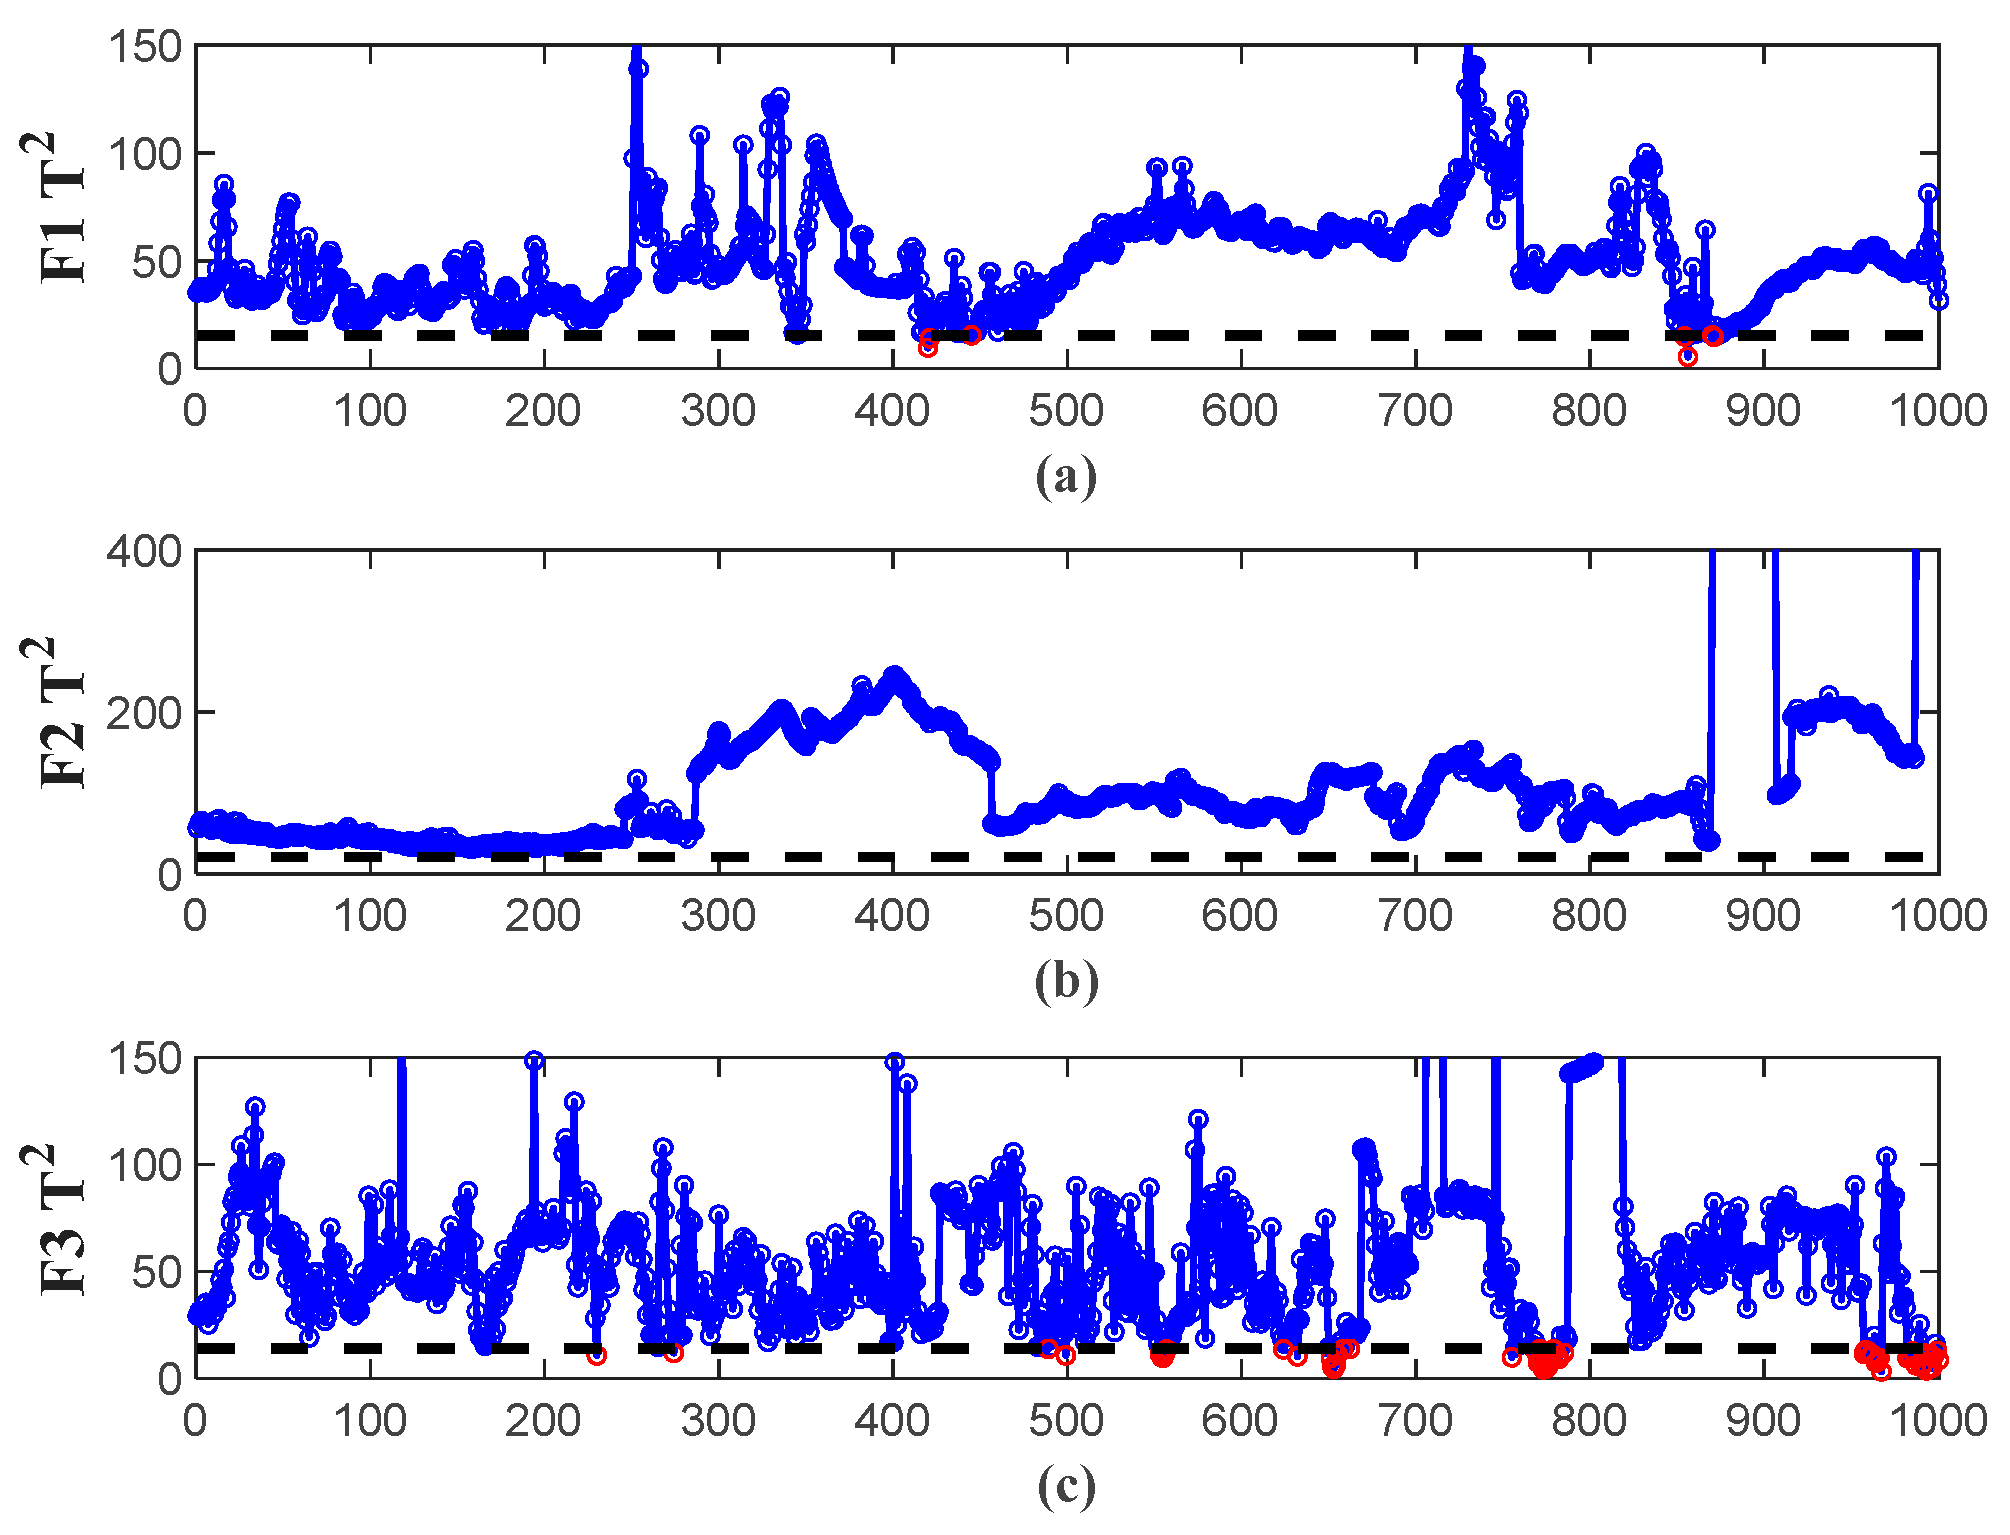
4.3. Experimental Results and Analysis Based on EGA–CCA

In order to verify the effectiveness of the method proposed in this paper, we use four methods to detect the three faults mentioned above. The CCA is compared with the conventional PCA. The EGA–PCA scheme is formed by replacing the CCA method in the EGA–CCA scheme with PCA. The CCA model is established by the formula in Section 3.2, whose FDR is that the number of samples ( T 2 > T t h 2 | f a u l t y ) divided by total fault testing samples. The EGA–CCA and EGA–PCA schemes are used to find the subsets of fault-relevant variables of sub-models, respectively. Every iteration uses the selected variables to establish a fault detection sub-model based on training data. The 1000 samples of fault training data for each fault are used to calculate the FDR of the sub-model as the population fitness value. Then, the modeling variables are optimized according to the steps in Section 3.3. The optimization results are obtained and the fault-relevant variable models are established.
Here, the full PCA/CCA fault detection model denote PCA/CCA model that use all of the candidate variables. The detection results of full PCA are shown in Figure 7, and the detection results of full CCA are shown in Figure 8. The abscissa of the statistical graph represents the sample, and the ordinate represents the statistical value. Figure 7a shows the detection result of full PCA for Fault 1, and Figure 8a shows the detection result of full CCA for Fault 1. Comparing the two figures, we find that the detected points are increased and the non-detected points are decreased. The CCA method can successfully detect most fault points of Fault 1, but the PCA method cannot detect them. Similar results are found for Fault 2, as shown in Figure 7b and Figure 8b. Moreover, the fault points not detected by the CCA method concentrate in the 50–250th samples. The detection results of full PCA and CCA for Fault 3 are presented in Figure 7c and Figure 8c respectively, from which the non-detected points still account for the majority, and the detection performance of the CCA method is not significantly improved for Fault 3.
The results show that the CCA method can extract the correlation of the actual running data and realize the fault detection of the diesel engine. However, the detection effectiveness needs to be further improved. In fact, in actual industrial production, only using all candidate variables to model and extract abnormal correlation changes cannot detect specific faults completely. For a specific fault, if there is enough fault data for the development of the detection model, the non-useful information variables can be eliminated by optimizing the subset of fault-relevant variables to improve the accuracy and sensitivity. The optimal sub-model established for the specific fault based on the EGA–CCA scheme can do this.
Specifically, the EGA–CCA and EGA–PCA schemes are applied to optimize fault-relevant variables of the three faults. Additionally, the optimization of EGA–PCA and EGA–CCA schemes for Fault 3 are shown in Figure 9, in which the red lines denote the fitness convergence, and the blue bar charts represent final subset of the fault-relevant variables. Both the initial fitness value and the optimized fitness value of the EGA–PCA scheme are smaller than that of the EGA–CCA scheme. For the three faults, the optimal fault-relevant variables X F R V s by EGA–PCA and the optimal results U F R V s , Y F R V s with EGA–CCA are shown in Table 4, which mean that the number of modeling variables in the optimal sub-model are less than that of the full model. The figures and tables show that the optimization of fault-relevant variables reduces the dimension of modeling variables, and can improve the final fault detection performance.
The detection results of the EGA–PCA scheme are shown in Figure 10, and the detection results of the EGA–CCA scheme are shown in Figure 11. Figure 10a shows the PCA detection result using the optimal variables of Fault 1, from which the PCA model after variables optimization can detect more fault points than the full PCA. Figure 11a shows the CCA detection result using the optimal variables of Fault 1. By comparing Figure 8a with Figure 11a, the detection performance has been significantly improved with EGA–CCA. As shown in Figure 10b and Figure 11b, Fault 2 has similar results. Moreover, Figure 11b shows the EGA–CCA scheme can successfully detect the 50–250th fault samples that cannot be detected by other methods. The CCA detection result of Fault 3 using optimal variables is shown in Figure 11c, which shows Fault 3 is successfully detected by the proposed EGA–CCA method. In general, it is intuitively found from the T 2 statistical detection graph that the proposed method can extract the characteristics of diesel engine data and provide the optimal detection effectiveness. For Figure 7 and Figure 10, it is noteworthy that the EGA–PCA scheme significantly reduces the number of modeling variables associated with statistical thresholds, so the statistical thresholds of PCA and EGA–PCA are significantly different. While for Figure 8 and Figure 11, the statistical thresholds of CCA are calculated by T t h 2 = χ 2 ( n ) , which depends on the dimension n = min ( l , m ) of residual, so the statistical threshold is similar between them.
For performance evaluation of fault detection methods, the higher the FDR is, the better the performance of the corresponding method will be. Table 5 lists the FDR of the four methods discussed in this paper for the three faults, which shows that the CCA method can detect Faults 1 and 2, which cannot be detected by the PCA method. For Faults 1 and 2, the FDR of CCA are 88.4% and 89.3% respectively. In addition, the EGA stochastic optimization scheme improves the detection quality. The proposed EGA–CCA scheme generally provides the best detection results for the considered three faults. The FDR of Faults 1, 2, and 3 are 99.3%, 99.9%, and 94.1% respectively, and the detection performance is satisfactory.
The experimental results show the CCA method can be used to detect the diesel engine faults with the operation data in practice. Moreover, the CCA method characterizes the correlation residual statistic to construct the detection model, which improves the detection rate of the three diesel engine faults. The optimal models of specific faults are established by optimizing subsets of fault-relevant variables with EGA–CCA, which further improves the detection accuracy and sensitivity. Therefore, this methodology can be used to alert the vehicle operator in case of failure of air and after-treatment systems in emission exceeding the legal limits.

5. Conclusions

In the present study, an EGA–CCA scheme is proposed for realizing high-dimensional real data-driven diesel engine fault detection, which has certain practical application significance. The use of operation data overcomes the limitations that most state-of-the-art detection methods for diesel engines are based on, e.g., bench test data and simulation data. The strong correlation of the actual data of the diesel engine is characterized for fault detection via the CCA method. According to the significant influence of variable selection on detection performance, variables with non-beneficial information are eliminated by fault-relevant variable optimization based on EGA, which provides optimal detection performance for specific faults. The experimental evaluation for the EGA–CCA scheme is carried out based on actual data sampled during 1 year of a diesel engine. The results show that the proposed approach improves the fault detection rate effectively, and presents feasibility and effectiveness.

Author Contributions

Conceptualization, methodology, validation, formal analysis, Q.R., W.D. (Wenli Du), W.D. (Wei Du), and X.P.; investigation and writing—original draft preparation, Q.R.; writing—review and editing and supervision, W.D. (Wenli Du), Y.S., W.D. (Wei Du), and X.P.; resources, project administration, funding acquisition, W.D. (Wenli Du), and Y.S. All authors have read and agreed to the published version of the manuscript.

Funding

This work was supported by the National Natural Science Foundation of China (Basic Science Center Program: 61988101), the National Natural Science Fund for Distinguished Young Scholars (61725301), International (Regional) Cooperation and Exchange Project (61720106008) and Fundamental Research Funds for the Central Universities.

Institutional Review Board Statement

Not applicable.

Informed Consent Statement

Not applicable.

Data Availability Statement

Not applicable.

Conflicts of Interest

The authors declare no conflict of interest.

References

  1. Quiros, D.C.; Smith, J.; Thiruvengadam, A.; Huai, T.; Hu, S.H. Greenhouse gas emissions from heavy-duty natural gas, hybrid, and conventional diesel on-road trucks during freight transport. Atmos. Environ. 2017, 168, 36–45. [Google Scholar] [CrossRef]
  2. Wu, Y.; Zhang, S.; Hao, J.; Liu, H.; Wu, X.; Hu, J.; Walsh, M.P.; Wallington, T.J.; Zhang, K.M.; Stevanovic, S. On-road vehicle emissions and their control in China: A review and outlook. Sci. Total Environ. 2017, 574, 332–349. [Google Scholar] [CrossRef] [PubMed]
  3. Apicella, B.; Mancaruso, E.; Russo, C.; Tregrossi, A.; Oliano, M.M.; Ciajolo, A.; Vaglieco, B.M. Effect of after-treatment systems on particulate matter emissions in diesel engine exhaust. Exp. Therm Fluid Sci. 2020, 116, 110107. [Google Scholar] [CrossRef]
  4. Lao, C.T.; Akroyd, J.; Eaves, N.; Smith, A.; Morgan, N.; Nurkowski, D.; Bhave, A.; Kraft, M. Investigation of the impact of the configuration of exhaust after-treatment system for diesel engines. Appl. Energy 2020, 267, 114844. [Google Scholar] [CrossRef]
  5. Guan, B.; Zhan, R.; Lin, H.; Huang, Z. Review of state of the art technologies of selective catalytic reduction of NOx from diesel engine exhaust. Appl. Therm. Eng. 2014, 66, 395–414. [Google Scholar] [CrossRef]
  6. Naifeng, H.; Zhongfeng, J.; Zhi, N. On the Influencing Factors of Integrated Aftertreatment System in Diesel Engine. J. Phys. Conf. Ser. 2020, 1578, 012165. [Google Scholar]
  7. Huang, Y.H.; Ng, E.C.Y.; Yam, Y.S.; Lee, C.K.C.; Surawski, N.C.; Mok, W.C.; Organ, B.; Zhou, J.L.; Chan, E.F.C. Impact of potential engine malfunctions on fuel consumption and gaseous emissions of a Euro VI diesel truck. Energy Convers. Manag. 2019, 184, 521–529. [Google Scholar] [CrossRef]
  8. Mohammadpour, J.; Franchek, M.; Grigoriadis, K. A survey on diagnostic methods for automotive engines. Int. J. Engine Res. 2012, 13, 41–64. [Google Scholar] [CrossRef]
  9. Liu, S.X.; Lu, M. Fault Diagnosis of the Blocking Diesel Particulate Filter Based on Spectral Analysis. Processes 2019, 7, 943. [Google Scholar] [CrossRef] [Green Version]
  10. Wang, Y.Y.; Sun, Y.; Chang, C.F.; Hu, Y.R. Model-Based Fault Detection and Fault-Tolerant Control of SCR Urea Injection Systems. IEEE Trans. Vehicul. Technol. 2016, 65, 4645–4654. [Google Scholar] [CrossRef]
  11. Jhou, J.S.; Chen, S.H.; Tsay, W.D.; Lai, M.C. The Implementation of OBD-II Vehicle Diagnosis System Integrated with Cloud Computation Technology. In Proceedings of the 2013 Second International Conference on Robot, Vision and Signal Processing, Kitakyushu, Japan, 10–12 December 2013; pp. 9–12. [Google Scholar]
  12. He, K.X.; Hu, X.; An, X.P. The Design and Implementation of Heavy-Duty Diesel Vehicles Remote Monitoring and Control System. In 2018 International Conference on Electrical, Control, Automation and Robotics; DEStech Publications, Inc.: Xiamen, China, 2018; Volume 307, pp. 768–774. [Google Scholar]
  13. Park, Y.J.; Fan, S.K.S.; Hsu, C.Y. A Review on Fault Detection and Process Diagnostics in Industrial Processes. Processes 2020, 8, 1123. [Google Scholar] [CrossRef]
  14. Ge, Z.Q.; Song, Z.H.; Gao, F.R. Review of Recent Research on Data-Based Process Monitoring. Ind. Eng. Chem. Res. 2013, 52, 3543–3562. [Google Scholar] [CrossRef]
  15. Wang, G.Z.; Liu, J.C.; Li, Y.; Zhang, C. Fault diagnosis of chemical processes based on partitioning PCA and variable reasoning strategy. Chin. J. Chem. Eng. 2016, 24, 869–880. [Google Scholar] [CrossRef]
  16. Zeng, L.; Long, W.; Li, Y. A Novel Method for Gas Turbine Condition Monitoring Based on KPCA and Analysis of Statistics T-2 and SPE. Processes 2019, 7, 124. [Google Scholar] [CrossRef] [Green Version]
  17. Zhu, J.L.; Ge, Z.Q.; Song, Z.H. Distributed Parallel PCA for Modeling and Monitoring of Large-Scale Plant-Wide Processes With Big Data. IEEE Trans. Ind. Inform. 2017, 13, 1877–1885. [Google Scholar] [CrossRef]
  18. Yin, S.; Zhu, X.P.; Kaynak, O. Improved PLS Focused on Key-Performance-Indicator-Related Fault Diagnosis. IEEE Trans. Ind. Electron. 2015, 62, 1651–1658. [Google Scholar] [CrossRef]
  19. Xie, X.C.; Sun, W.; Cheung, K.C. An Advanced PLS Approach for Key Performance Indicator-Related Prediction and Diagnosis in Case of Outliers. IEEE Trans. Ind. Electron. 2016, 63, 2587–2594. [Google Scholar] [CrossRef]
  20. Chen, Z.W.; Ding, S.X.; Zhang, K.; Li, Z.B.; Hu, Z.K. Canonical correlation analysis-based fault detection methods with application to alumina evaporation process. Control Eng. Pract. 2016, 46, 51–58. [Google Scholar] [CrossRef]
  21. Jiang, B.B.; Braatz, R.D. Fault detection of process correlation structure using canonical variate analysis-based correlation features. J. Proc. Contr. 2017, 58, 131–138. [Google Scholar]
  22. Chen, Z.W.; Yang, C.H.; Peng, T.; Dan, H.B.; Li, C.G.; Gui, W.H. A Cumulative Canonical Correlation Analysis-Based Sensor Precision Degradation Detection Method. IEEE Trans. Ind. Electron. 2019, 66, 6321–6330. [Google Scholar] [CrossRef]
  23. Chen, Z.W.; Zhang, K.; Ding, S.X.; Shardt, Y.A.W.; Hu, Z.K. Improved canonical correlation analysis-based fault detection methods for industrial processes. J. Proc. Contr. 2016, 41, 26–34. [Google Scholar] [CrossRef]
  24. Ghosh, K.; Ramteke, M.; Srinivasan, R. Optimal variable selection for effective statistical process monitoring. Comput. Chem. Eng. 2014, 60, 260–276. [Google Scholar] [CrossRef]
  25. Ming, L.; Zhao, J.S. Feature selection for chemical process fault diagnosis by artificial immune systems. Chin. J. Chem. Eng. 2018, 26, 1599–1604. [Google Scholar] [CrossRef]
  26. Qian, F.; Ma, D.; Zhu, N.; Li, P.; Xu, X.W. Research on Optimization Design of SCR Nozzle for National VI Heavy Duty Diesel Engine. Catalysts 2019, 9, 452. [Google Scholar] [CrossRef] [Green Version]
Figure 1. Diagram of diesel engine intake, exhaust, and after-treatment systems.
Processes 09 00259 g001
Figure 2. Actual measurements of P 1 , P2, T4, T5.
Processes 09 00259 g002
Figure 3. The variable selection scheme based on elitist genetic algorithm (EGA)– canonical correlation analysis (CCA).
Processes 09 00259 g003
Figure 4. Flow chart of the EGA–based fault-relevant variables optimization.
Processes 09 00259 g004
Figure 5. The pipeline of the pre-treatment operations of the data.
Processes 09 00259 g005
Figure 6. Correlation of the candidate variables (the darker the color of the small squares, the stronger the correlation between the horizontal and vertical variables).
Processes 09 00259 g006
Figure 7. PCA-based fault detection results for (a) Fault 1, (b) Fault 2, and (c) Fault 3.
Processes 09 00259 g007
Figure 8. CCA-based fault detection results for (a) Fault 1, (b) Fault 2, and (c) Fault 3.
Processes 09 00259 g008
Figure 9. The results of variables optimization for Fault 3 (a) EGA– principal component analysis (PCA), and (b) EGA–CCA.
Processes 09 00259 g009
Figure 10. EGA–PCA based fault detection results for (a) Fault 1, (b) Fault 2, and (c) Fault 3.
Processes 09 00259 g010
Figure 11. EGA–CCA based fault detection results for (a) Fault 1, (b) Fault 2, and (c) Fault 3.
Processes 09 00259 g011
Table 1. Candidate variables of the diesel engine.
Candidate VariablesVariable MeaningCandidate VariablesVariable Meaning
x 1 Exhaust gas flow 1 x 16 Actual value of intake pressure
x 2 Engine torque x 17 Closed-loop control deviation of supercharging pressure
x 3 Intake pressure after the intercooler x 18 DPF observation model carbon load Carbon load of DPF observation model
x 4 Intake temperature after the intercooler x 19 Differential pressure of the DPF (filtered)
x 5 Calculated value of the intercooler cooling efficiency x 20 Exhaust volume flow
x 6 Filter value of the intercooler cooling efficiency x 21 Mass flow of NOx
x 7 Lower limit of particulate matter differential pressure x 22 Pressure of urea pump
x 8 Rotating speed x 23 Urea level
x 9 Upstream NOx x 24 Downstream temperature of selective catalytic reduction (SCR)
x 10 Downstream NOx x 25 upstream temperature of SCR
x 11 Upstream temperature of the diesel oxidation catalyst x 26 Urea temperature
x 12 Upstream temperature of the diesel particulate filter (DPF) x 27 Throttle opening
x 13 Differential pressure of the DPF (unfiltered) x 28 Urea injection quantity
x 14 Exhaust gas flow 2 x 29 Duty ratio of urea pump
x 15 Fuel-injection quantity x 30 Speed
Table 2. The CCA-based modeling variables for diesel engine fault detection.
Fault No Candidate   Variables   U Candidate   Variables   Y
1 x 1 , x 3 , x 4 , x 5 , x 6 , x 7 , x 11 , x 12 , x 13 , x 14 , x 16 , x 17 , x 18 , x 19 , x 20 , x 21 , x 27 x 2 , x 8 , x 9 , x 10 , x 15 , x 22 , x 23 , x 24 , x 25 , x 26 , x 28 , x 29 , x 30 ,
2 x 1 , x 3 , x 4 , x 5 , x 6 , x 7 , x 9 , x 10 , x 11 , x 15 , x 16 , x 17 , x 21 , x 22 , x 23 , x 24 , x 25 , x 26 , x 27 , x 28 , x 29 x 2 , x 8 , x 12 , x 13 , x 14 , x 18 , x 19 , x 20 , x 30
3 x 1 , x 7 , x 9 , x 10 , x 11 , x 12 , x 13 , x 14 , x 15 , x 17 , x 18 , x 19 , x 20 , x 21 , x 22 , x 23 , x 24 , x 25 , x 26 , x 28 , x 29 x 2 , x 3 , x 4 , x 5 , x 6 , x 8 , x 16 , x 27 , x 30
Table 3. Parameters of the EGA model.
Parameter VariableValue
Chromosomal Gene30
Population Size50
Iterations300
Crossover Rate1
Mutation Rate0.01
Table 4. Optimized results of fault-relevant variables.
Fault No. EGA PCA   X F R V s EGA CCA   U F R V s EGA CCA Y F R V s
1 x 2 , x 4 , x 7 , x 9 , x 14 , x 19 , x 24 x 1 , x 5 , x 7 , x 17 , x 19 , x 20 , x 21 , x 27 x 2 , x 9 , x 10 , x 15 , x 24 , x 26 , x 28 , x 30
2 x 2 , x 3 , x 6 , x 8 , x 14 , x 15 , x 16 , x 18 x 19 , x 21 , x 23 , x 24 , x 26 , x 28 , x 29 x 1 , x 3 , x 4 , x 5 , x 6 , x 10 , x 11 , x 16 , x 24 , x 25 , x 26 , x 28 x 2 , x 8 , x 14 , x 18 , x 19 , x 20 , x 30
3 x 2 , x 7 , x 9 , x 12 , x 14 , x 24 , x 26 x 9 , x 12 , x 14 , x 20 , x 24 , x 28 , x 29 x 2 , x 3 , x 5 , x 6 , x 8 , x 16 , x 30
Table 5. The fault detection rate (FDR) of the four methods.
MethodsPCAEGA–PCACCAEGA–CCA
Fault No.
12.1%62.2%88.4%99.3%
247.2%72.6%89.3%99.9%
338.5%46.4%46.2%94.1%
Publisher’s Note: MDPI stays neutral with regard to jurisdictional claims in published maps and institutional affiliations.

