Article

Near Infrared Spectroscopic Evaluation of Starch Properties of Diverse Sorghum Populations

1
Grain Quality and Structure Research Unit, Center for Grain and Animal Health Research, USDA-ARS, Manhattan, KS 66502, USA
2
Plant Stress and Germplasm Development Research Unit, Cropping Systems Research Lab, USDA-ARS, Lubbock, TX 79401, USA
3
Department of Agriculture, Veterinary & Rangeland Science, University of Nevada, Reno, NV 89557, USA
4
Department of Agronomy, Kansas State University, Manhattan, KS 66506, USA
5
Agricultural Research Center, Department of Agronomy, Kansas State University, Hays, KS 67601, USA
6
Department of Soil and Crop Sciences, Texas A&M University, College Station, TX 77843, USA
7
United Sorghum Checkoff Program, Lubbock, TX 79403, USA
*
Author to whom correspondence should be addressed.
Processes 2021, 9(11), 1942; https://doi.org/10.3390/pr9111942
Submission received: 24 September 2021 / Revised: 26 October 2021 / Accepted: 27 October 2021 / Published: 29 October 2021
(This article belongs to the Special Issue Processing and Properties Analysis of Grain Foods)

Abstract

:
Starch, mainly composed of amylose and amylopectin, is the major nutrient in grain sorghum. Amylose and amylopectin composition affects the starch properties of sorghum flour which in turn determine the suitability of sorghum grains for various end uses. Partial least squares regression models on near infrared (NIR) spectra were developed to estimate starch and amylose contents in intact grain sorghum samples. Sorghum starch calibration model with a coefficient of determination (R2) = 0.87, root mean square error of cross validation (RMSECV) = 1.57% and slope = 0.89 predicted the starch content of validation set with R2 = 0.76, root mean square error of prediction (RMSEP) = 2.13%, slope = 0.93 and bias = 0.20%. Amylose calibration model with R2 = 0.84, RMSECV = 2.96% and slope = 0.86 predicted the amylose content in validation samples with R2 = 0.76, RMSEP = 2.60%, slope = 0.98 and bias = −0.44%. Final starch and amylose cross validated calibration models were constructed combining respective calibration and validation sets and used to predict starch and amylose contents in 1337 grain samples from two diverse sorghum populations. Protein and moisture contents of the samples were determined using previously tested NIR spectroscopy models. The distribution of starch and protein contents in the samples of low amylose (<5%) and normal amylose (>15%) and the overall relationship between starch and protein contents of the sorghum populations were investigated. Percent starch and protein were negatively correlated, low amylose lines tended to have lower starch and higher protein contents than lines with high amylose. The results showed that NIR spectroscopy of whole grain can be used as a high throughput pre-screening method to identify sorghum germplasm with specific starch quality traits to develop hybrids for various end uses.

1. Introduction

Sorghum (Sorghum bicolor (L.) Moench) ranks fifth in global cereal grain production after maize (Zea mays (L.)), wheat (Triticum aestivum (L.)), rice (Oryza sativa (L.)) and barley (Hordeum vulgare (L.)) with 57.9 million megagrams (Mg) of grain sorghum harvested from 40.1 million ha in 2019 with an average yield of 1.44 Mg/ha. As the third most important cereal grain in the USA after wheat and maize, the USA produced 8.7 million Mg of grain sorghum harvested from 1.9 million ha with an average yield of 4.6 Mg/ha in 2019 (FAO STAT http://faostat.fao.org, accessed on 20 October 2021). Grain sorghum is used as food, feed, fodder and as a feedstock for bioethanol production [1,2,3,4,5].
In the USA, after exports, sorghum is mostly used as an ingredient in animal feed and as a bio-fuel feedstock. However, since sorghum has potential human health benefits in the prevention of chronic diseases [6,7,8] and as a gluten free food, it is also being increasingly used for preparation of various foods [9,10].
Starch is the primary constituent of sorghum grain. Starch comprises two types of macromolecules, the relatively small (up to 106 Da) and linear amylose with few long branches and the large (107–109 Da) and highly-branched amylopectin with many short branches. These macromolecules form starch granules with alternative crystalline and amorphous layers [11,12]. Amylose and amylopectin have different physiochemical properties. Starch content and starch properties, especially the amount of amylose content in sorghum starch, influence the suitability of sorghum cultivars for specific end uses [13,14,15] and the digestibility of sorghum starch [16]. For example, higher starch contents are important for grains used for ethanol fermentation. However, just the starch content itself is not sufficient to select the best varieties as the ethanol fermentation efficiency depends on the amylose levels in starch. Likewise, when the suitability of high starch sorghum as an animal feed ingredient is evaluated, the amylose levels should also be considered as it affects the digestibility of starch. Therefore, it is imperative to measure starch and amylose contents for developing cultivars for specific uses.
For plant breeding purposes, it is necessary to analyze starch and amylose contents of a large number of samples in breeding populations. Currently there are many methods for starch analysis [17]. However, laboratory starch analysis methods are laborious, vary in cost per test, and are time consuming. Near infrared (NIR) spectroscopy has been used as a rapid analytical method for the evaluation of numerous traits of cereal grains in plant breeding programs [18], including starch and amylose contents [19]. Most NIR spectroscopy methods developed for sorghum starch and/or amylose content have been for samples from ground grain [20,21]. In some studies where NIR has been used for intact grain, details of the NIR method used were not available [22]. De Alencar Figueiredo et al., 2006 used NIR spectroscopy for the analysis of amylose content in both intact and ground sorghum grain samples and found that prediction is poor when intact grains are used [23].
However, using intact grain for analysis avoids the need to grind samples, which is laborious and time consuming, and grinding has the potential to contaminate samples without proper cleaning of grinding equipment between samples. In addition, when using intact grains for non-destructive NIR analysis, grains can be saved and used as seed. Thus, using intact grain for NIR analysis allows for large sample sets to be scanned and analyzed within a short period of time with only minor sample preparation. The primary objective of this work was to develop NIR starch and amylose calibration models for use as a non-destructive, rapid, robust, and cost-effective method to estimate starch and amylose contents in intact grain sorghum for screening breeding and genetically diverse populations.

2. Materials and Methods

2.1. Grain Samples

Grains harvested from several sorghum breeding populations and agronomic trials were collected from the 2018 through 2020 growing seasons from different locations in California, Kansas, and Texas. Grain samples used for the starch calibration were selected from five populations and four different populations were used to select samples for the amylose calibration. For the starch calibration, Population 1 (Starch Population 1, SP1) samples were drawn from the sorghum association panel (SAP) described by Casa et al., (2008) [24] grown in Kansas. Samples from Population 2 (SP2) came from seven lines within the SAP grown in Kansas that were harvested at a higher moisture content of around 18% where samples were scanned as samples dried to introduce moisture variability to calibration. Population 3 (SP3) samples were from a single hybrid grown under 10 different nitrogen fertilization treatments grown in Kansas. Population 4 (SP4) was from hybrids and inbred lines grown in Kansas and Texas and Population 5 (SP5) was from a breeding population grown in California. Samples for the amylose calibrations were selected from four different populations distinct from SP1–5 consisting of hybrids, inbreds, and segregating early F2 generation plant selections grown in Kansas and Texas (designated as amylose populations 1 through 4, or AP1, AP2, AP3 and AP4). A summary of the sorghum sample populations used for starch and amylose calibrations is given in Table 1.
Samples from two additional breeding populations harvested in California, Texas and in winter nurseries in Argentina and Mexico were scanned and used for the prediction of starch, amylose and protein contents and moisture to study the relationship between these traits in sorghum grain in genetically diverse materials. The sample populations used in generating the starch and amylose calibrations had a high degree of phenotypic diversity for pericarp color (red, white, yellow, etc.), tannin contents, grain sizes and kernel hardness, as these samples were from a diverse genetic and geographic background of several growing regions in North and South America, capturing a wide range of environmental variability in addition to different nitrogen fertilization treatments.
Preliminary starch and amylose calibrations constructed using the populations scanned in early years were used to predict starch and amylose contents in subsequent grain populations. Those predicted starch and amylose values were used to identify candidate lines across the constituent range for laboratory analysis of starch or amylose in order to use in calibration improvement. This approach enabled the efficient use of resources available for laboratory analysis to obtain samples with starch and amylose reference data more or less equally distributed along the available range of both constituents.

2.2. NIR Scanning

Grain samples were scanned as they were received at the laboratory. First, samples were screened to remove small broken pieces and dust, and then glumes and other debris were removed and cleaned seeds were used for scanning. A Perten DA7250 (Perten Instruments, Springfield, IL, USA) spectrometer was used to scan grain samples in reflectance mode. Samples were scanned using a Teflon cup (60 mm diameter and 10 mm deep) that can hold about 20 g of grains. A micromirror cup (Perten Instruments, Springfield, IL, USA) was used if the quantity of seeds available were less. The cup was filled with grains and excess grains were removed by levelling so that the distance from the surface of grains to the collecting optics of the instrument was uniform for all samples. The spectrometer recorded NIR absorbance data from 950 to 1650 nm in 5 nm intervals. Each sample was scanned in triplicate by mixing the grains and repacking the sample cup after each scan.

2.3. Starch and Amylose Content Determination

Grain samples were ground for total starch and amylose measurement using a cyclone mill equipped with a 0.5 mm screen (Udy Corp, Fort Collins, CO, USA). Total starch content was measured colorimetrically using a commercially available kit (Megazyme K-TSTA-100A kit, Bray, Ireland) and following the total starch assay procedure (amyloglucosidase/α-amylase method), procedure example (b), “Determination of total starch content of samples containing resistant starch (RTS-NaOH Procedure -Recommended).” [25]. Briefly, 100 mg grain meal in 16 × 120 mm glass tubes was wetted with 0.2 mL of 80% ethanol and dissolved in 2 mL 1.7 M sodium hydroxide for 15 min. Eight mL sodium acetate buffer (pH 3.8) was added into the glass tube to adjust pH to 5.0. The samples were hydrolyzed with thermostable α-amylase and amyloglucosidase (0.1 mL each) at 50 ℃ for 30 min. After centrifugation at 1300 rpm for 5 min, 0.1 mL of the hydrolysate was mixed with 3.0 mL GOPOD reagent and incubated at 50 ℃ for 20 min. The absorbance of the mixture was measured against the reagent blank and used to calculate the percent starch content in the grain meal sample.
Apparent amylose in the whole grain meal samples was quantitated colorimetrically taking advantage of amylose forming polyiodide-amylose complex with iodine, which has a maximum absorbance at around 620 nm [26,27]. Briefly, 25–30 mg of grain meal (alternatively 30–35 mg low amylose samples) were weighed (to ± 0.1 mg accuracy) in a 15 mL glass test tube and the samples were dispersed with 0.1 mL 80% ethanol to prevent them from forming clumps at the bottom. Next, 1 mL of 90% DMSO:0.6 M urea solution was added to the glass tubes while vortexing. The glass tubes were brought to 100 ℃ in a heat block until the starch was dissolved, another 5 mL of 90% DMSO was added, and samples were incubated at 100 ℃ for 30 min with vortexing every 5 min. The heated dissolved samples were allowed to cool to room temperature, and an aliquot (0.1 mL) was transferred into a test tube with 5.0 mL of 0.5% trichloroacetic acid and mixed with 0.1 mL 0.01 N I2-KI solution (300 mg KI in 1–2 mL of deionized water with 127 mg iodine in 100 mL). Finally, the absorbance at 620 nm was read against a reagent blank after 30 min without disturbing the precipitates when transferring the solution into a cuvette. A standard curve was established using reference amylose (potato, Megazyme # P-AMYL, Bray, Ireland) and amylopectin (maize, Sigma #10120, St. Louis, MI, USA) to make mixtures with different amylose contents (0, 5, 15, 30, 50, 100% amylose) for calculating the apparent amylose content in the samples. Note, apparent amylose contents were reported as% amylose in the ground whole meal (“flour”), not as a percent of total starch (i.e., flour basis rather than starch basis). Both starch and amylose content data were converted to dry basis using moisture values obtained from NIR ground whole meal sorghum moisture calibration (R2 = 0.98, RMSECV = 0.37%, Slope = 0.98).

2.4. Spectral Data Acquisition and Data Analysis

Spectral data from the Perten DA7250 spectrometer were retrieved in JCAMP-DX format [28] and the JCAMP-DX spectral data files were imported to the Unscrambler software Version 10.5.1 (CAMO Software AS, Oslo, Norway) for handling and subsequent pre-processing of spectra, calibration model development, validation, and prediction in new samples.
Spectral data in Unscrambler in the form of spectral identity and raw absorbance values from 950–1650 nm in 5 nm intervals were exported to Microsoft Excel. NIR spectra from three replicate sample scans were averaged. The spectra of the samples used for starch and amylose analysis by standard laboratory method for calibration and validation data sets were selected and the respective constituent values were appended. Lab-measured dry weight basis starch and amylose contents were converted to an ‘as is’ basis of the samples at the time of scanning, using the NIR predicted moisture content of the same samples.
Sample spectral data were then sorted by constituent value and samples were selected for use in the calibration and validation data sets. Samples from SP2 population for the starch calibration was divided such that the calibration included four lines scanned at different moisture contents while three lines were used in the validation set. Therefore, those sample spectra of lines scanned for multiple times at different moisture contents remained either in the calibration or the validation set, but not in both. Starch calibration spectra for SP3 came from one hybrid grown under five nitrogen fertilizer treatments, while the validation set included spectra from the same hybrid grown under five different treatments (10 treatments total). The rest of the spectra from the remaining populations were used in the ratio of 2:1 for calibration and validation sets, respectively. The spectral data and starch and amylose contents were imported to Unscrambler for analysis, calibration model development, and validations.
Raw spectral data of the starch and amylose datasets were subjected to principal component analysis to investigate similarity/diversity of spectra among sample populations. Spectra of calibration sample sets were pre-processed with extended multiplicative scatter correction (EMSC) [29] and mean centering. Resulting pre-processed and mean centered NIR spectral data were used to build partial least squares calibration models with leave-one-out cross validation. The number of PLS factors for the calibration models were selected considering the Root Mean Squared Error Cross Validation (RMSECV) and coefficient of determination (R2) of calibration models and Root Mean Squared Error Prediction (RMSEP), R2, slope and bias of the validation tests. After calibrations were validated, the spectra in the calibration and validation datasets were combined and a final cross validated model was developed using all spectra each for starch and amylose predictions.

2.5. Prediction of Moisture, Starch, Amylose and Protein Contents of New BREEDING Populations

The starch and amylose contents of samples from two diverse breeding populations grown in California, Texas, Argentina, and Mexico that had not contributed to the starch or amylose calibrations or validation sets were predicted using the above-mentioned combined starch and amylose calibrations. In addition to amylose and starch contents, moisture and protein contents of these two populations were also predicted using previously developed NIR calibrations for moisture (R2 = 0.99, RMSECV = 0.23%, Slope = 0.99) and protein (R2 = 0.92, RMSECV = 0.45%, Slope = 0.93) in intact grains [30]. Subsequently, dry weight basis starch, amylose and protein contents of the samples were calculated. Based on the predicted dry weight basis amylose contents, samples were grouped as low amylose (<5% amylose), intermediate amylose (5–15% amylose), and normal amylose (>15% amylose). The frequency distribution of the starch and protein contents of the low and normal amylose groups in the breeding populations were calculated. The relationship between starch and protein contents in this sample population was tested with Pearson correlation coefficient. Note that the breeding population used for these predictions contained early generation material which was still genetically segregating for various traits including starch, amylose, and protein contents. Thus, the wide range of intermediate amylose contents observed in this dataset may be due to the fact that each seed on a panicle could have a different starch, amylose, and/or protein content that would be averaged during NIR scans conducted on a per-panicle basis.

3. Results and Discussion

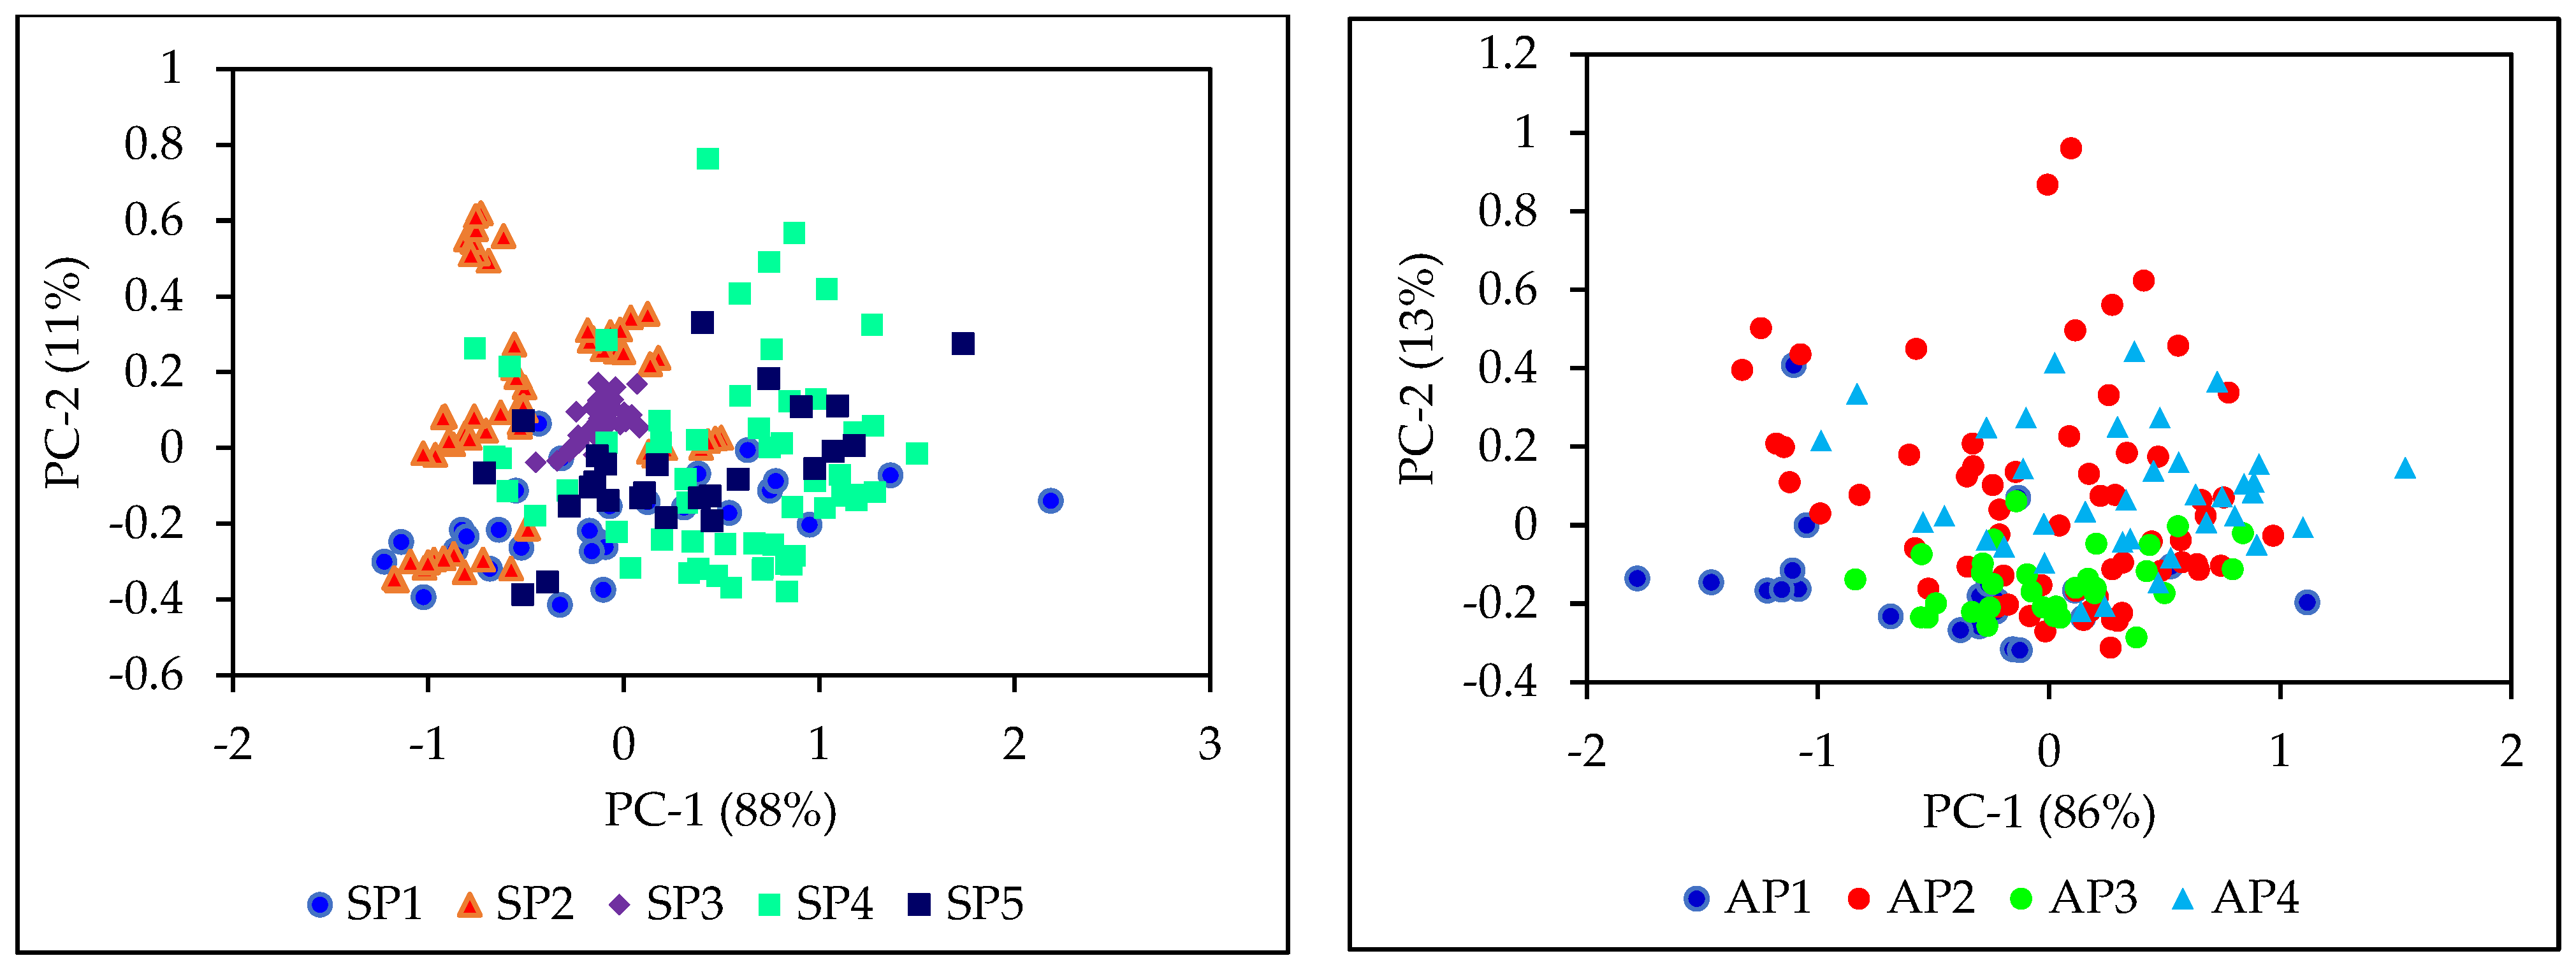
3.1. Diversity of Sample Populations

NIR spectra of intact sorghum grain samples from the populations used for starch and amylose calibrations are shown in the Figure 1. NIR spectra of the grain samples contributing to starch and amylose datasets were subjected to principal component analysis. The principal component (PC) score plot of PC1 against PC2 for raw NIR spectral data of different grain populations for starch and amylose spectral data sets are presented in Figure 2. First and second principal components of both starch and amylose datasets explained 99% of the variance of spectra. PC scores of different populations showed that the individual populations were diverse. The observed diversity may be due to changes in spectra caused by different starch and amylose contents in the samples, as well as other factors such as variations in chemical and physical properties resulting from differences in genetics, growing seasons, locations, or other unknown causes. The least diversity was observed in the SP3 dataset, which came from a single hybrid grown under different nitrogen fertilizer treatments wherein the starch content varied from 63.93–69.55%. The use of samples from very diverse and heterozygous populations grown at different locations in different years and under various management regimes helped develop calibrations which can be more robust in predicting grain starch and amylose contents in new populations.

3.2. Starch and Amylose Contents in Grain Samples

Starch calibration was developed using five while amylose calibration was developed using four populations. The distribution of starch and amylose contents on fresh weight basis in grain populations and in selected calibration and validation data sets are presented in Table 2. The starch content of combined populations varied from 50.73–74.17% with an average of 62.99% and standard deviation of 4.31%. The range of starch contents of individual populations were narrow and use of multiple populations increased the range and variability of starch content. Selection of samples for calibration and validation datasets were conducted manually such that the calibration dataset had the total range of starch content while the validation set had a slightly lower starch content of 53.46–72.70%. Likewise, the amylose calibration set covered the widest range of amylose contents in the assayed populations, ranging from 0.25–27.90%, while the validation set included samples with amylose contents ranging from 0.28–27.25%.

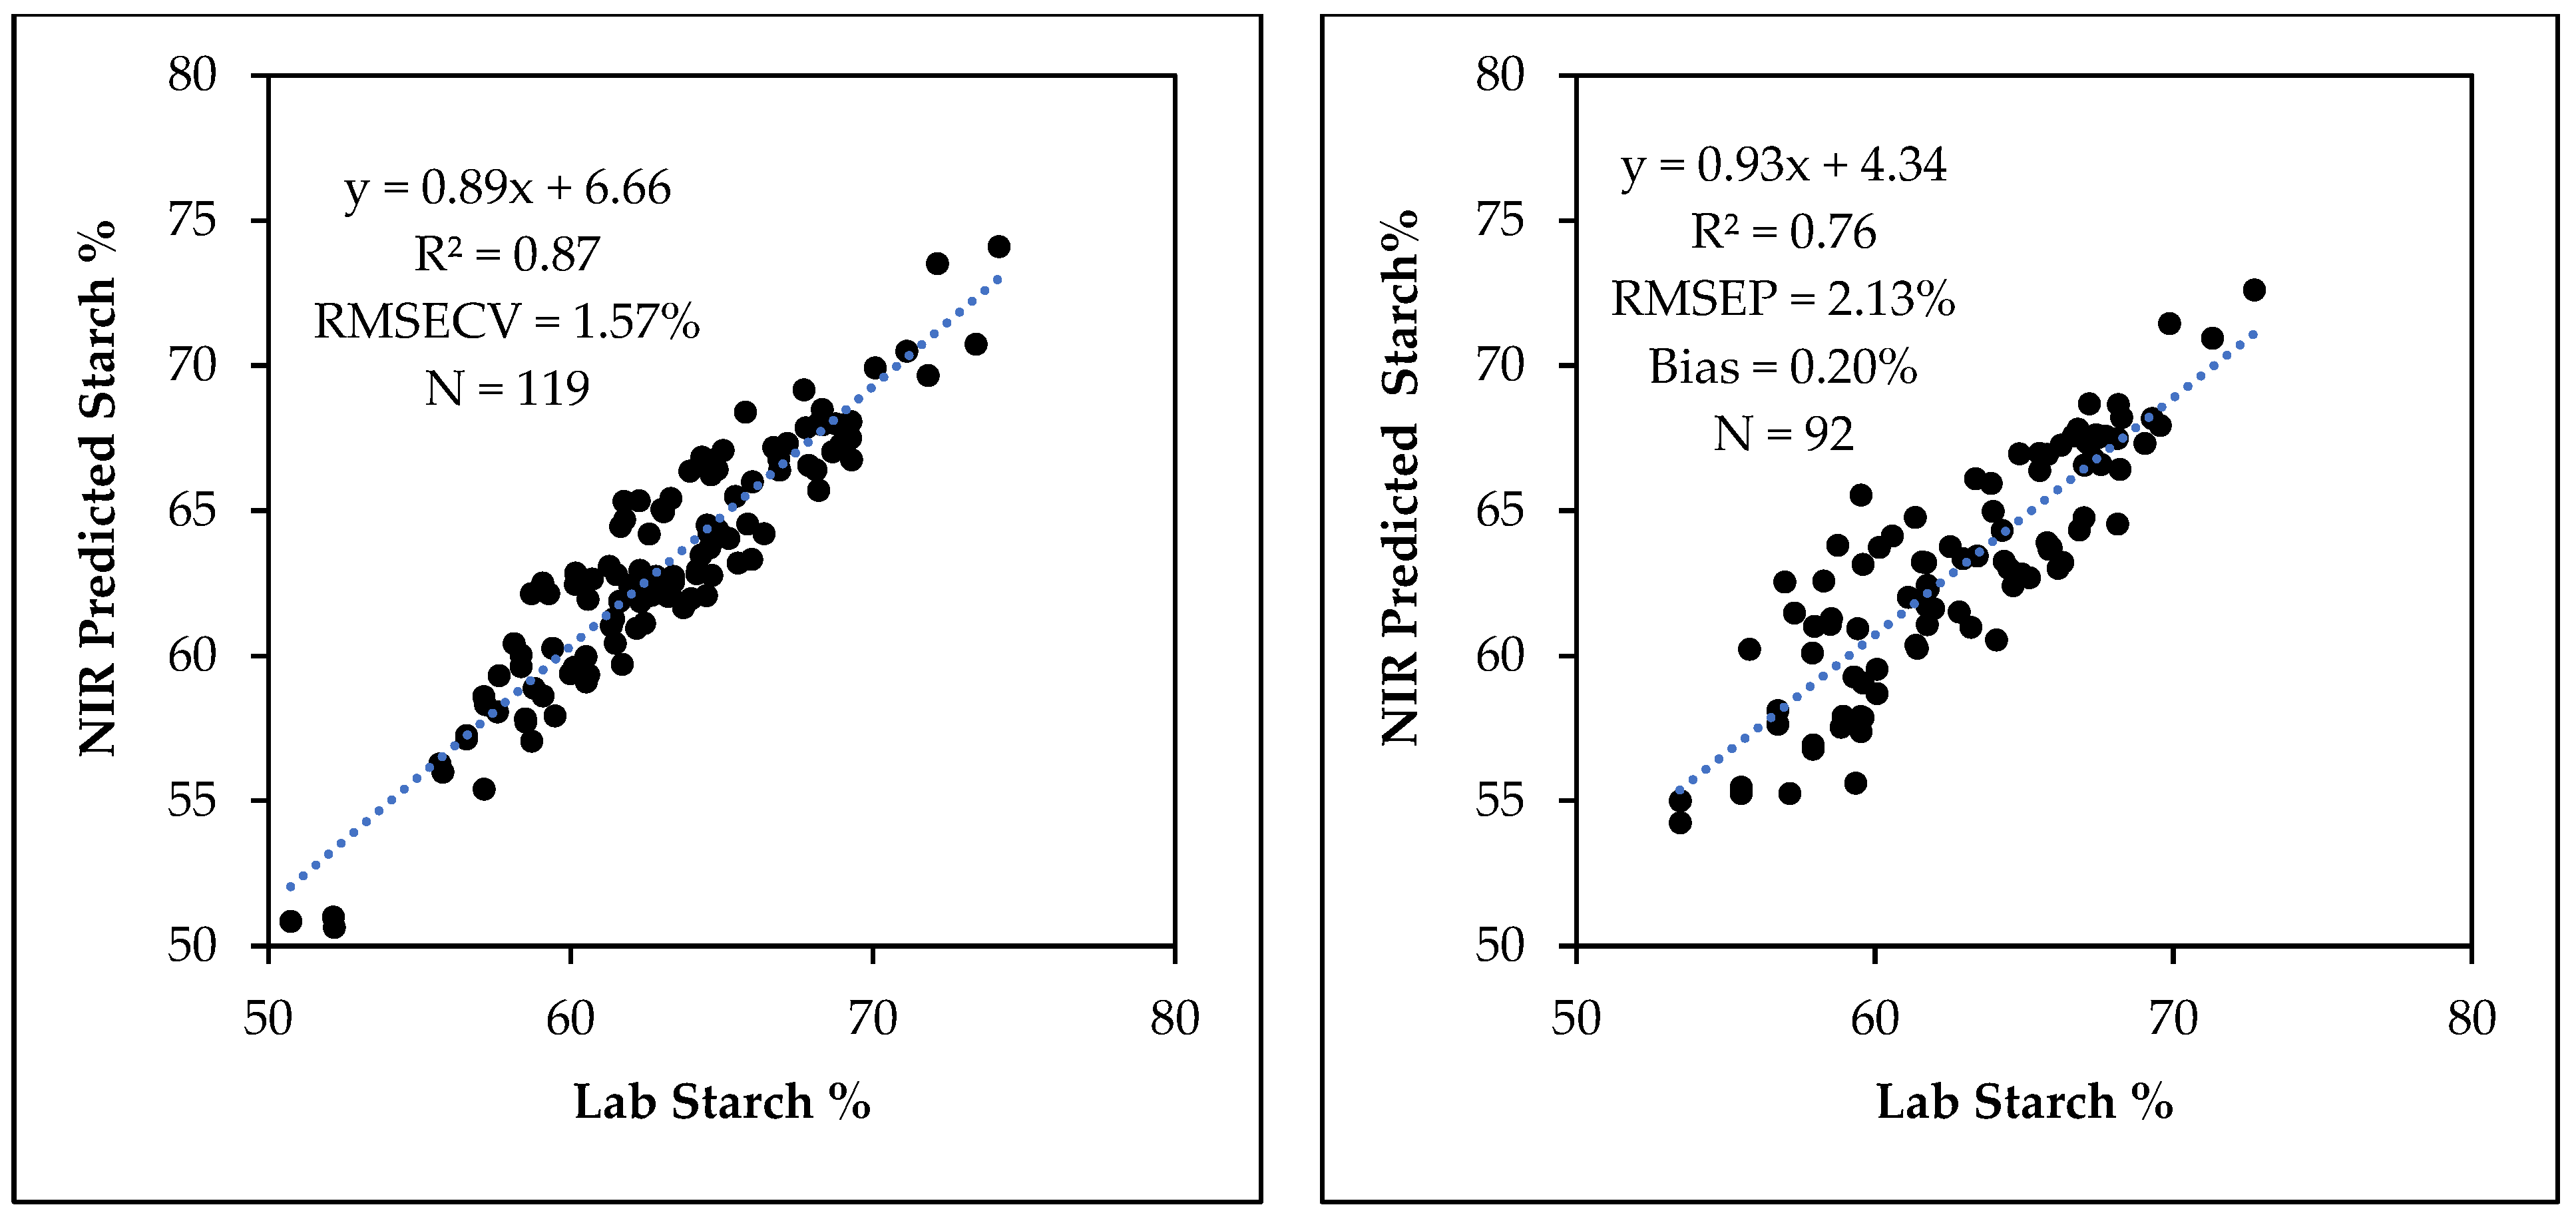
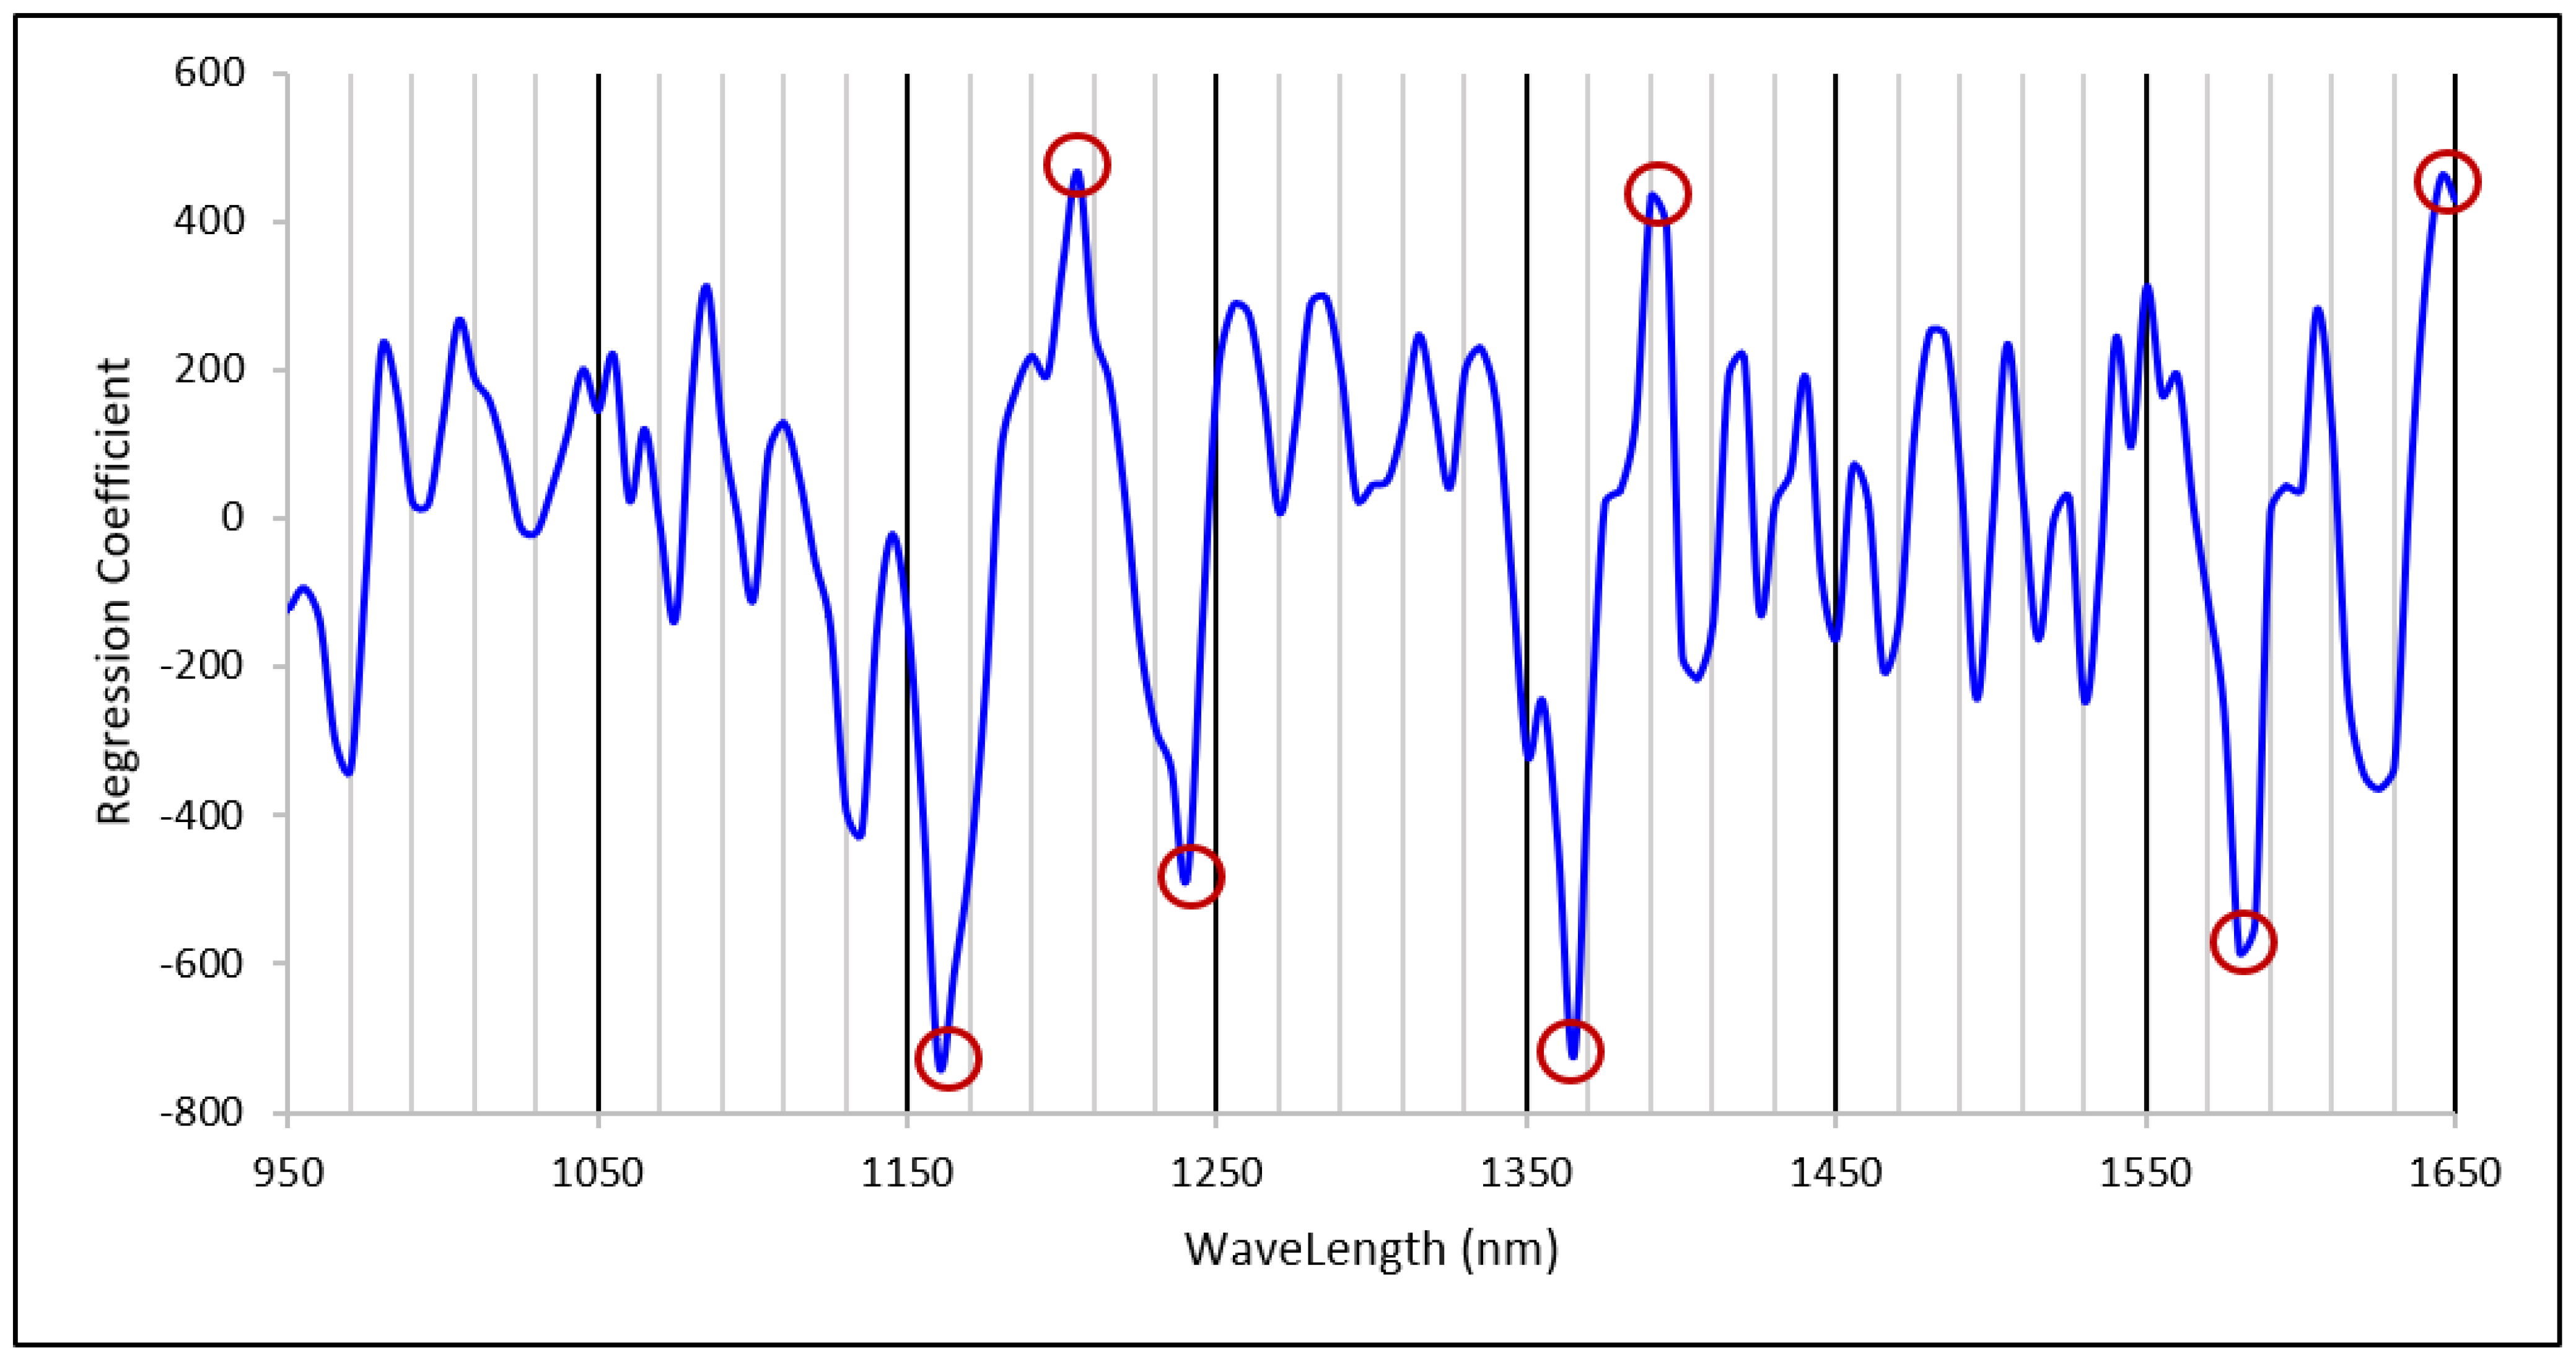
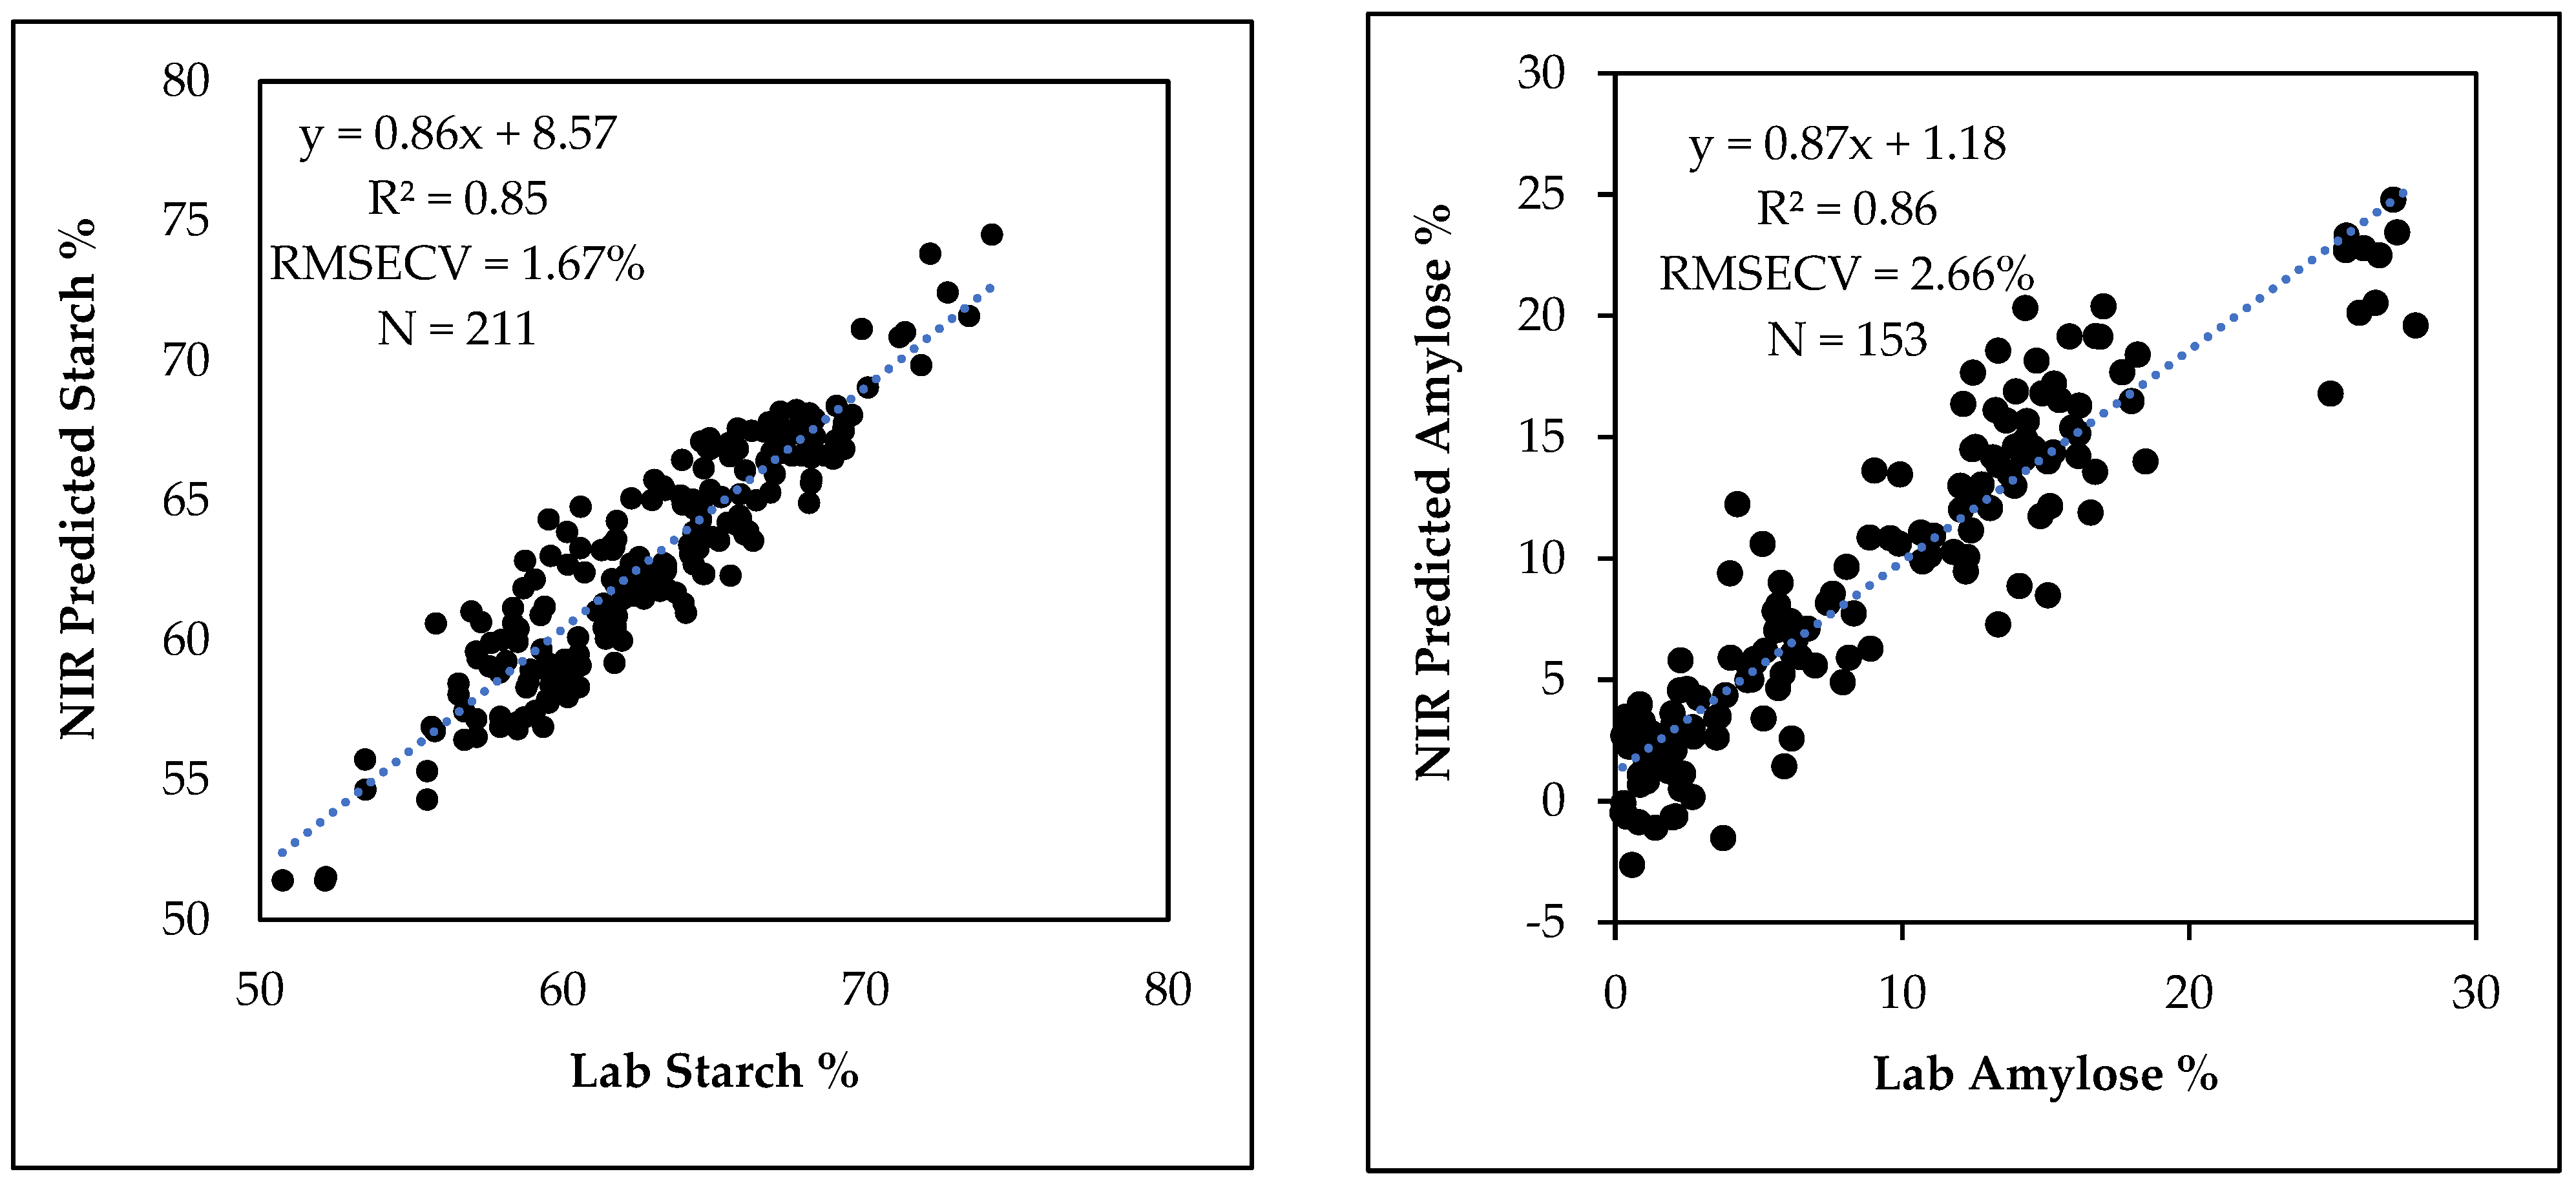
3.3. Starch Calibration Development and Model Validation

Starch calibration model constructed with 119 samples were validated with 92 samples that were not used for the construction of the calibration model. Starch calibration model with 11 PLS factors had a R2 = 0.87, RMSECV = 1.57% and a slope of 0.89. The number of PLS factors for the calibration was selected by taking into consideration the cross-validation statistics including R2, RMSECV, the slope of the curve and regression coefficient plots. This calibration model predicted the starch content in the validation sample set with R2 = 0.76, RMSEP = 2.13%, slope = 0.93 and bias = 0.20% (Figure 3).
Analysis of the regression coefficient plots of the PLS models is important to make sure that the key wavelengths of the model are related to the spectroscopic signal of the interested constituent molecule to ensure the validity of the NIR spectroscopy model [31,32]. The regression coefficient plot for the starch calibration model with 11 PLS factors is shown in Figure 4. Some of the key regression peaks, both positive and negative, in the regression coefficient plot that may have direct or indirect relation with the sorghum grain starch content may be due to second overtone of C-H stretch (peaks around 1160, 1205, 1240 nm), C-H stretch + C-H deformation (1365 and 1390 nm), first overtone of O-H stretch of starch (1580 nm) and first overtone of C-H stretch (1645 nm) vibrations of different C-H and O-H groups of starch [33,34].Therefore, it is possible that the starch model is capable of predicting the starch content of whole grain samples by using the interactions between some key NIR wavelengths and starch molecules in the grain. Hence, these results suggest that NIR spectroscopy can be used to predict starch contents of intact grain samples.

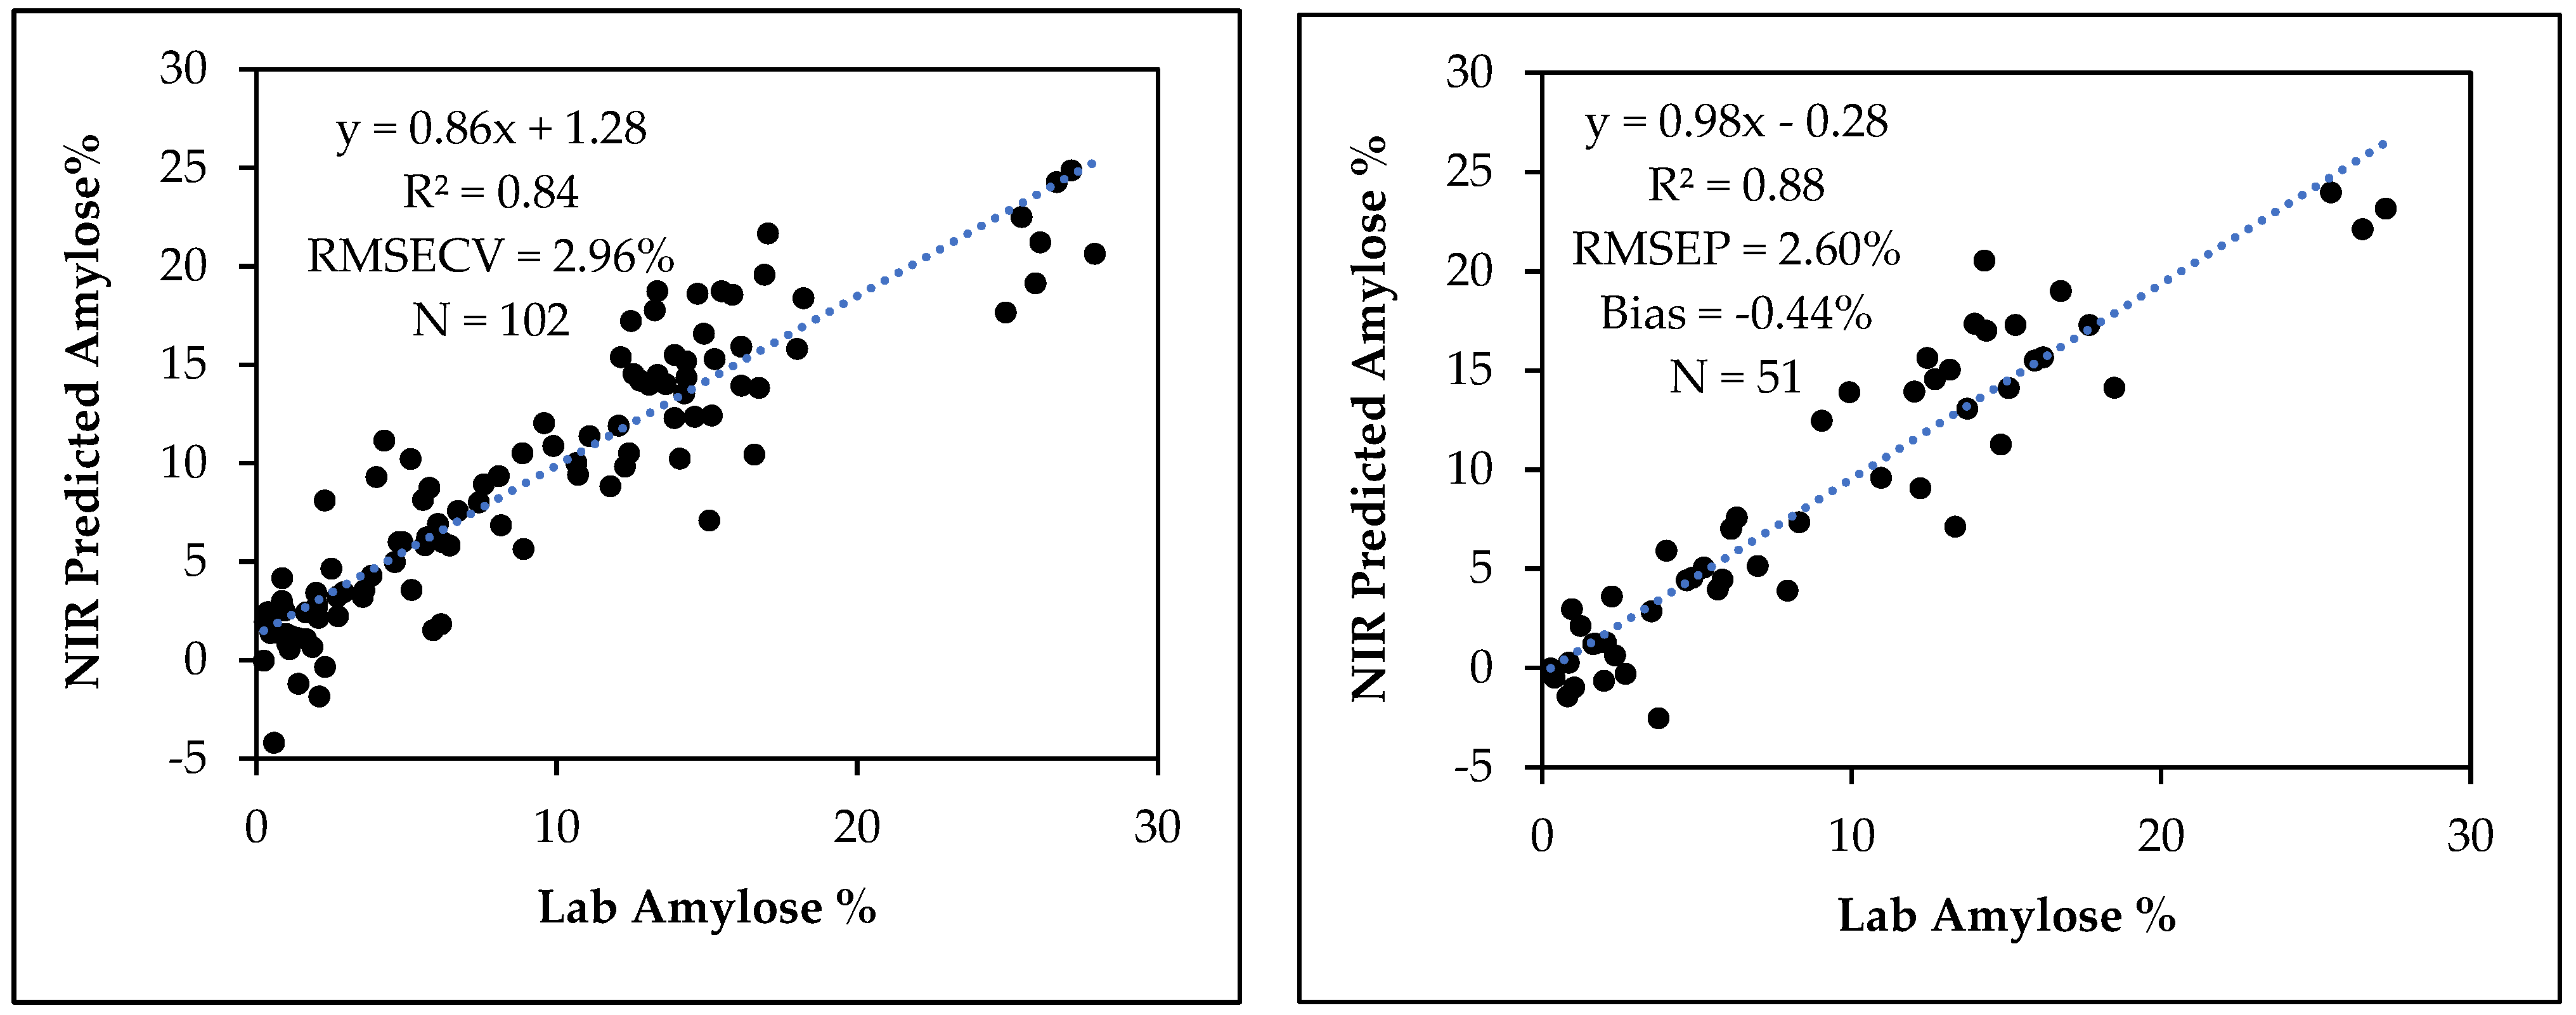
3.4. Amylose Calibration Development and Model Validation

The amylose calibration curve from 102 grain samples had 11 PLS factors with R2 = 0.84, RMSECV = 2.96% and a slope of 0.86. This amylose calibration model predicted the amylose content in an independent set of 51 samples with R2 = 0.76, RMSEP = 2.60%, slope = 0.98 and bias = −0.44% (Figure 5). The regression coefficient plot of the amylose calibration with 11 PLS factors is shown in Figure 6. The dominant regression peak in this plot is at 1235 nm and this may be due to C-H stretch second overtone of CH2 vibration [33]. Starch is a glucose polymer composed of straight chain amylose, a linear α (1–4) linked glucan, and branched amylopectin, an α (1–4) linked glucan that contains around 5% α (1–6) linkages resulting in a branched molecule [12]. Therefore, amylopectin is chemically different from amylose in that the sixth C atom of the α (1–6) linkage contain a CH2 group attached to O in one end and to the 5th C atom of a glucose unit at the branching point. The vibrational frequency of this CH2 group may differ from the vibrational frequency of other CH2 groups of the sixth C atom of glucose units in a linear chain. The second overtone C-H stretch vibration of this particular CH2 group in amylopectin around 1235 nm may be the primary wavelength that the calibration model uses to distinguish and quantify amylose from amylopectin in sorghum starch or flour samples. Fertig et al., (2004) found the best correlation of amylose content in amylose/amylopectin binary mixtures was around 1730–1750 nm which corresponds to the C-H stretch first overtone vibration of CH2 group [35]. Since the spectral range of 950–1650 nm we used mostly covered the second overtone region of C-H vibrations, our model apparently works using the difference of second overtone C-H vibrations of amylose and amylopectin in sorghum starch.

3.5. NIR Prediction of Starch and Amylose Contents in Breeding Populations

Spectra of the calibration and validation sets were combined to construct cross validated starch and amylose calibration curves for predicting starch and amylose contents in two breeding populations not used in calibration development. The starch calibration with 11 PLS factors from 211 sample spectra used for the calibration and validation of the starch curve had R2 = 0.85, RMSECV = 1.67% and a slope of 0.86. Likewise, the combined 11 PLS factor amylose calibration from 153 grain samples had R2 = 0.86, RMSECV = 2.66% and a slope of 0.87 (Figure 7). After a calibration is developed and tested with an external validation set, calibration and validation sets may be combined to make a model incorporating maximum information into the final calibration model, thereby improving the robustness of the model so that the accuracy of the predictions of future samples will generally be better [36]. Prediction of the starch and amylose contents in the breeding populations by the respective calibrations before and after validation set was combined showed that the average Mahalanobis distance (MD) [37] was reduced. Average MD of starch predictions was reduced from 2.78 to 2.48 while the average MD of amylose predictions was reduced from 4.19 to 3.83, suggesting that combining the calibration and validation datasets was helpful to improve the robustness of the calibrations.

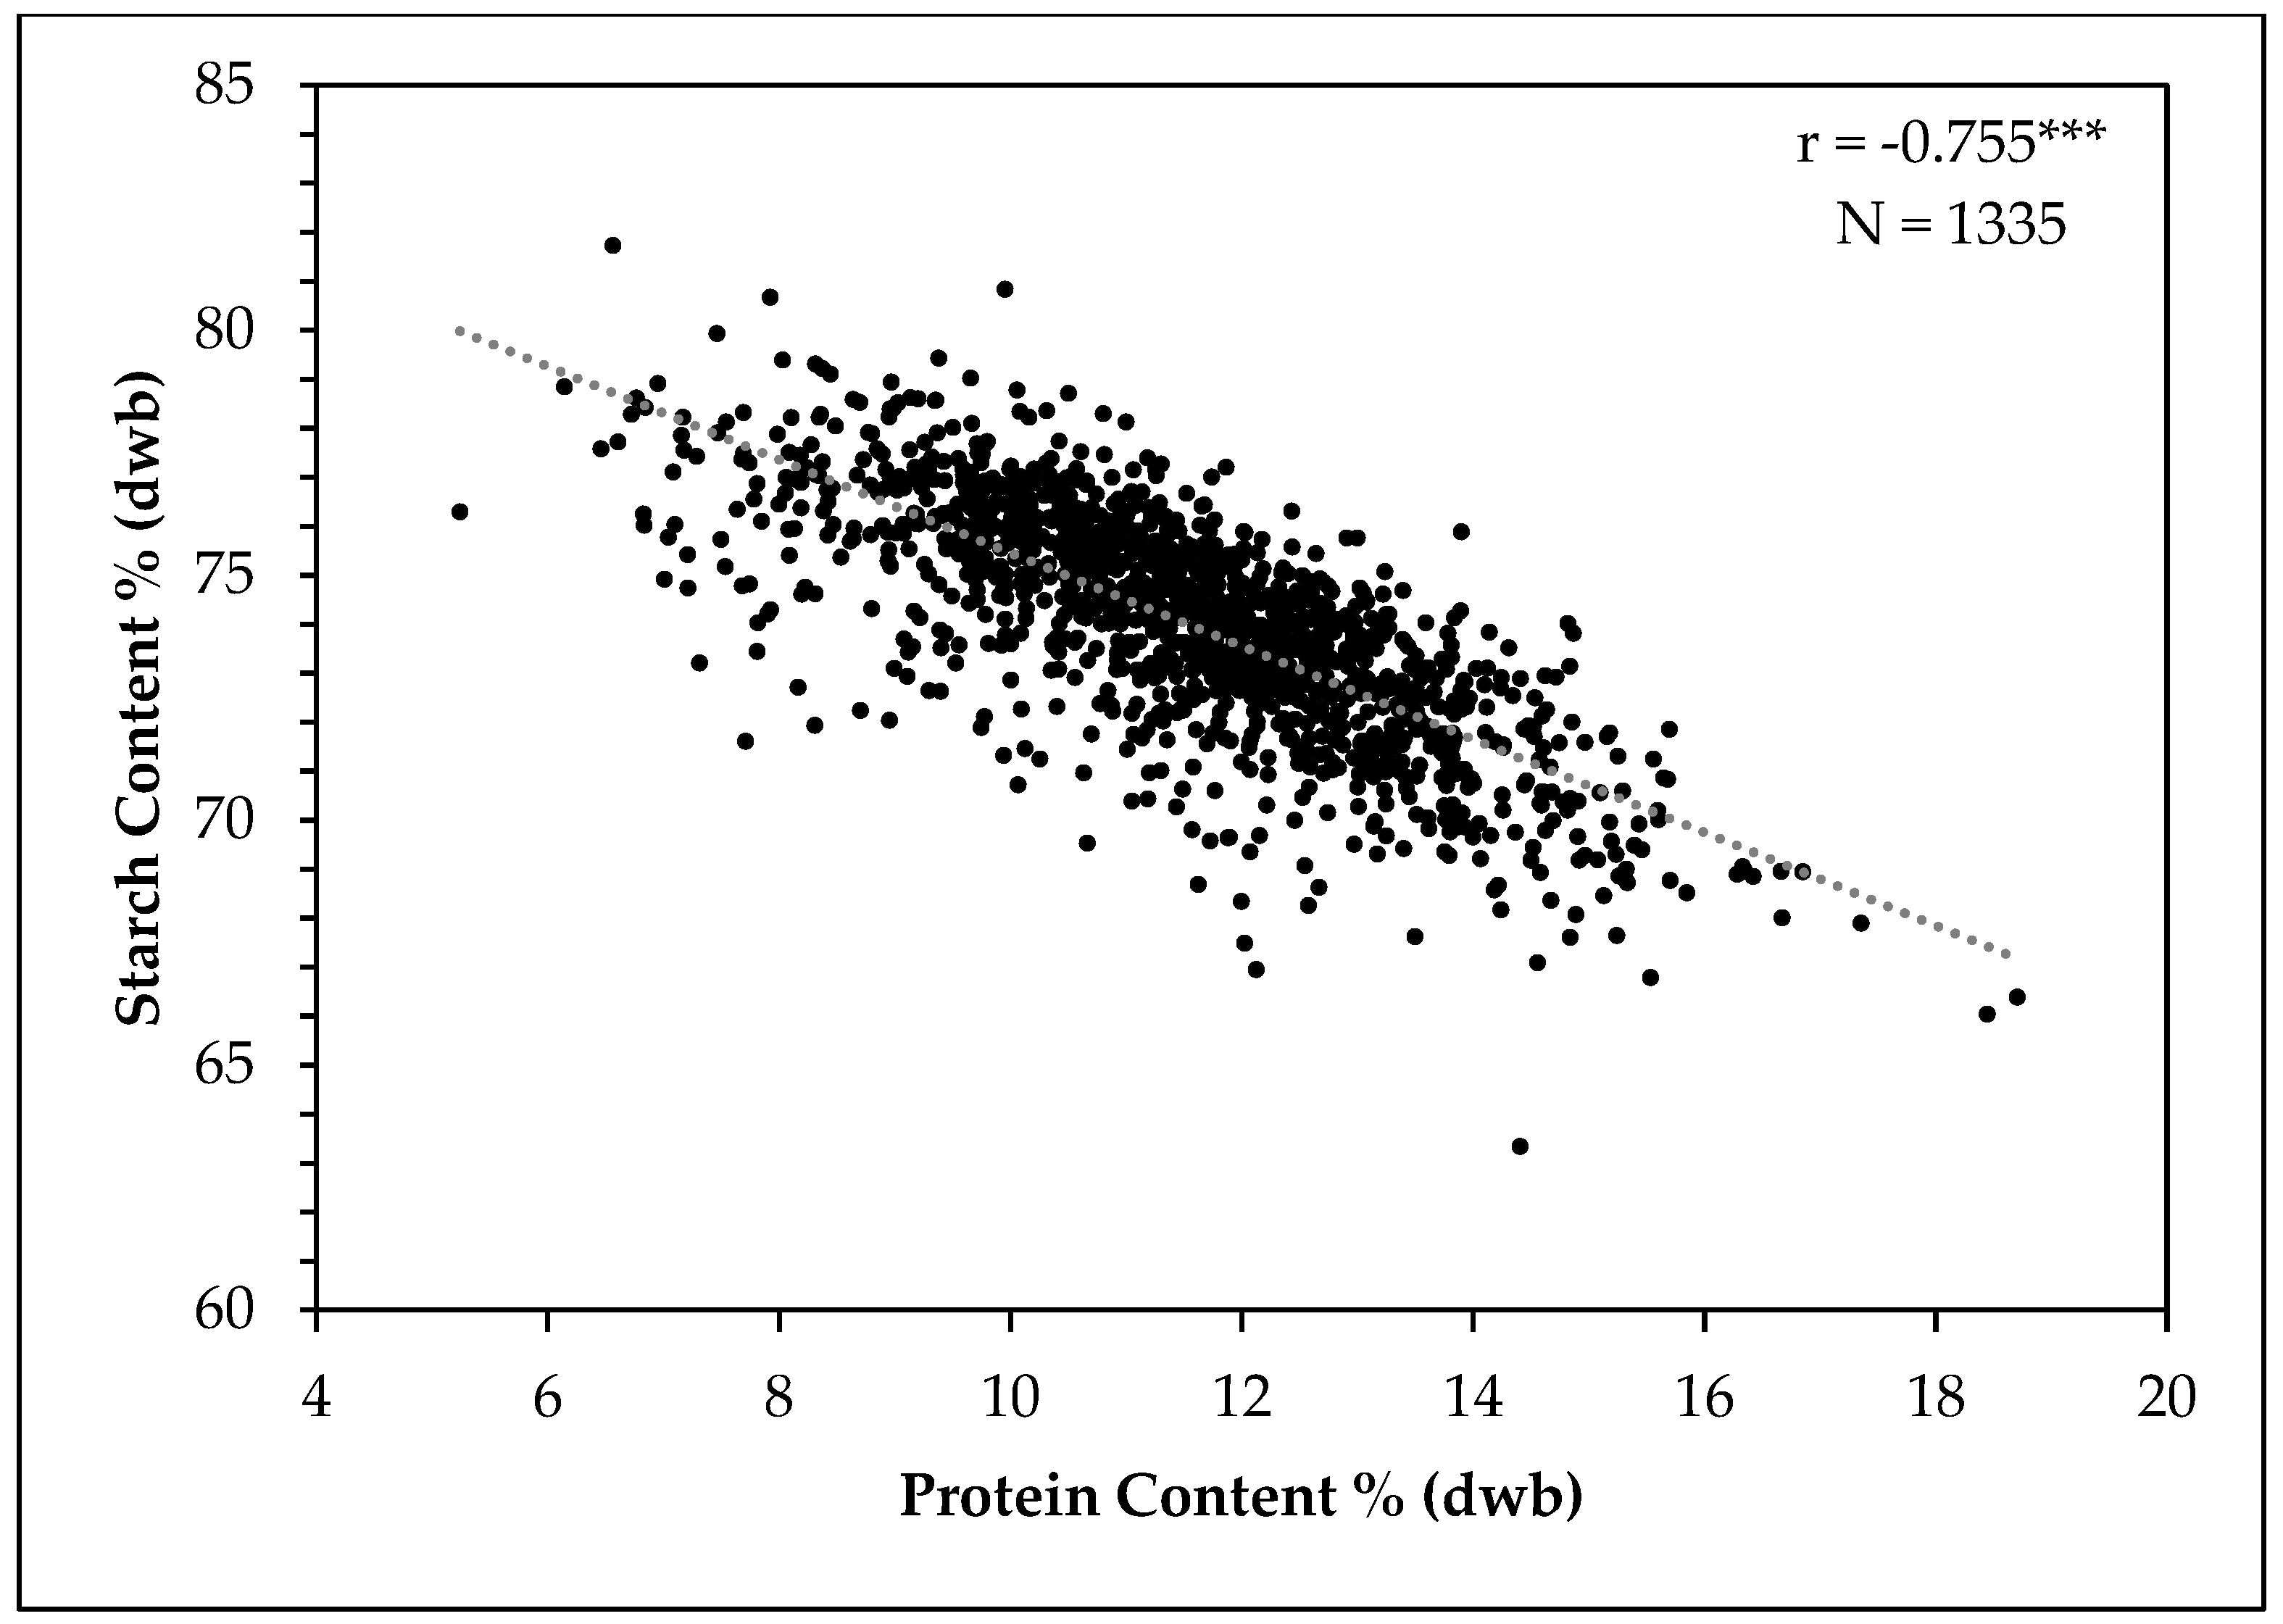
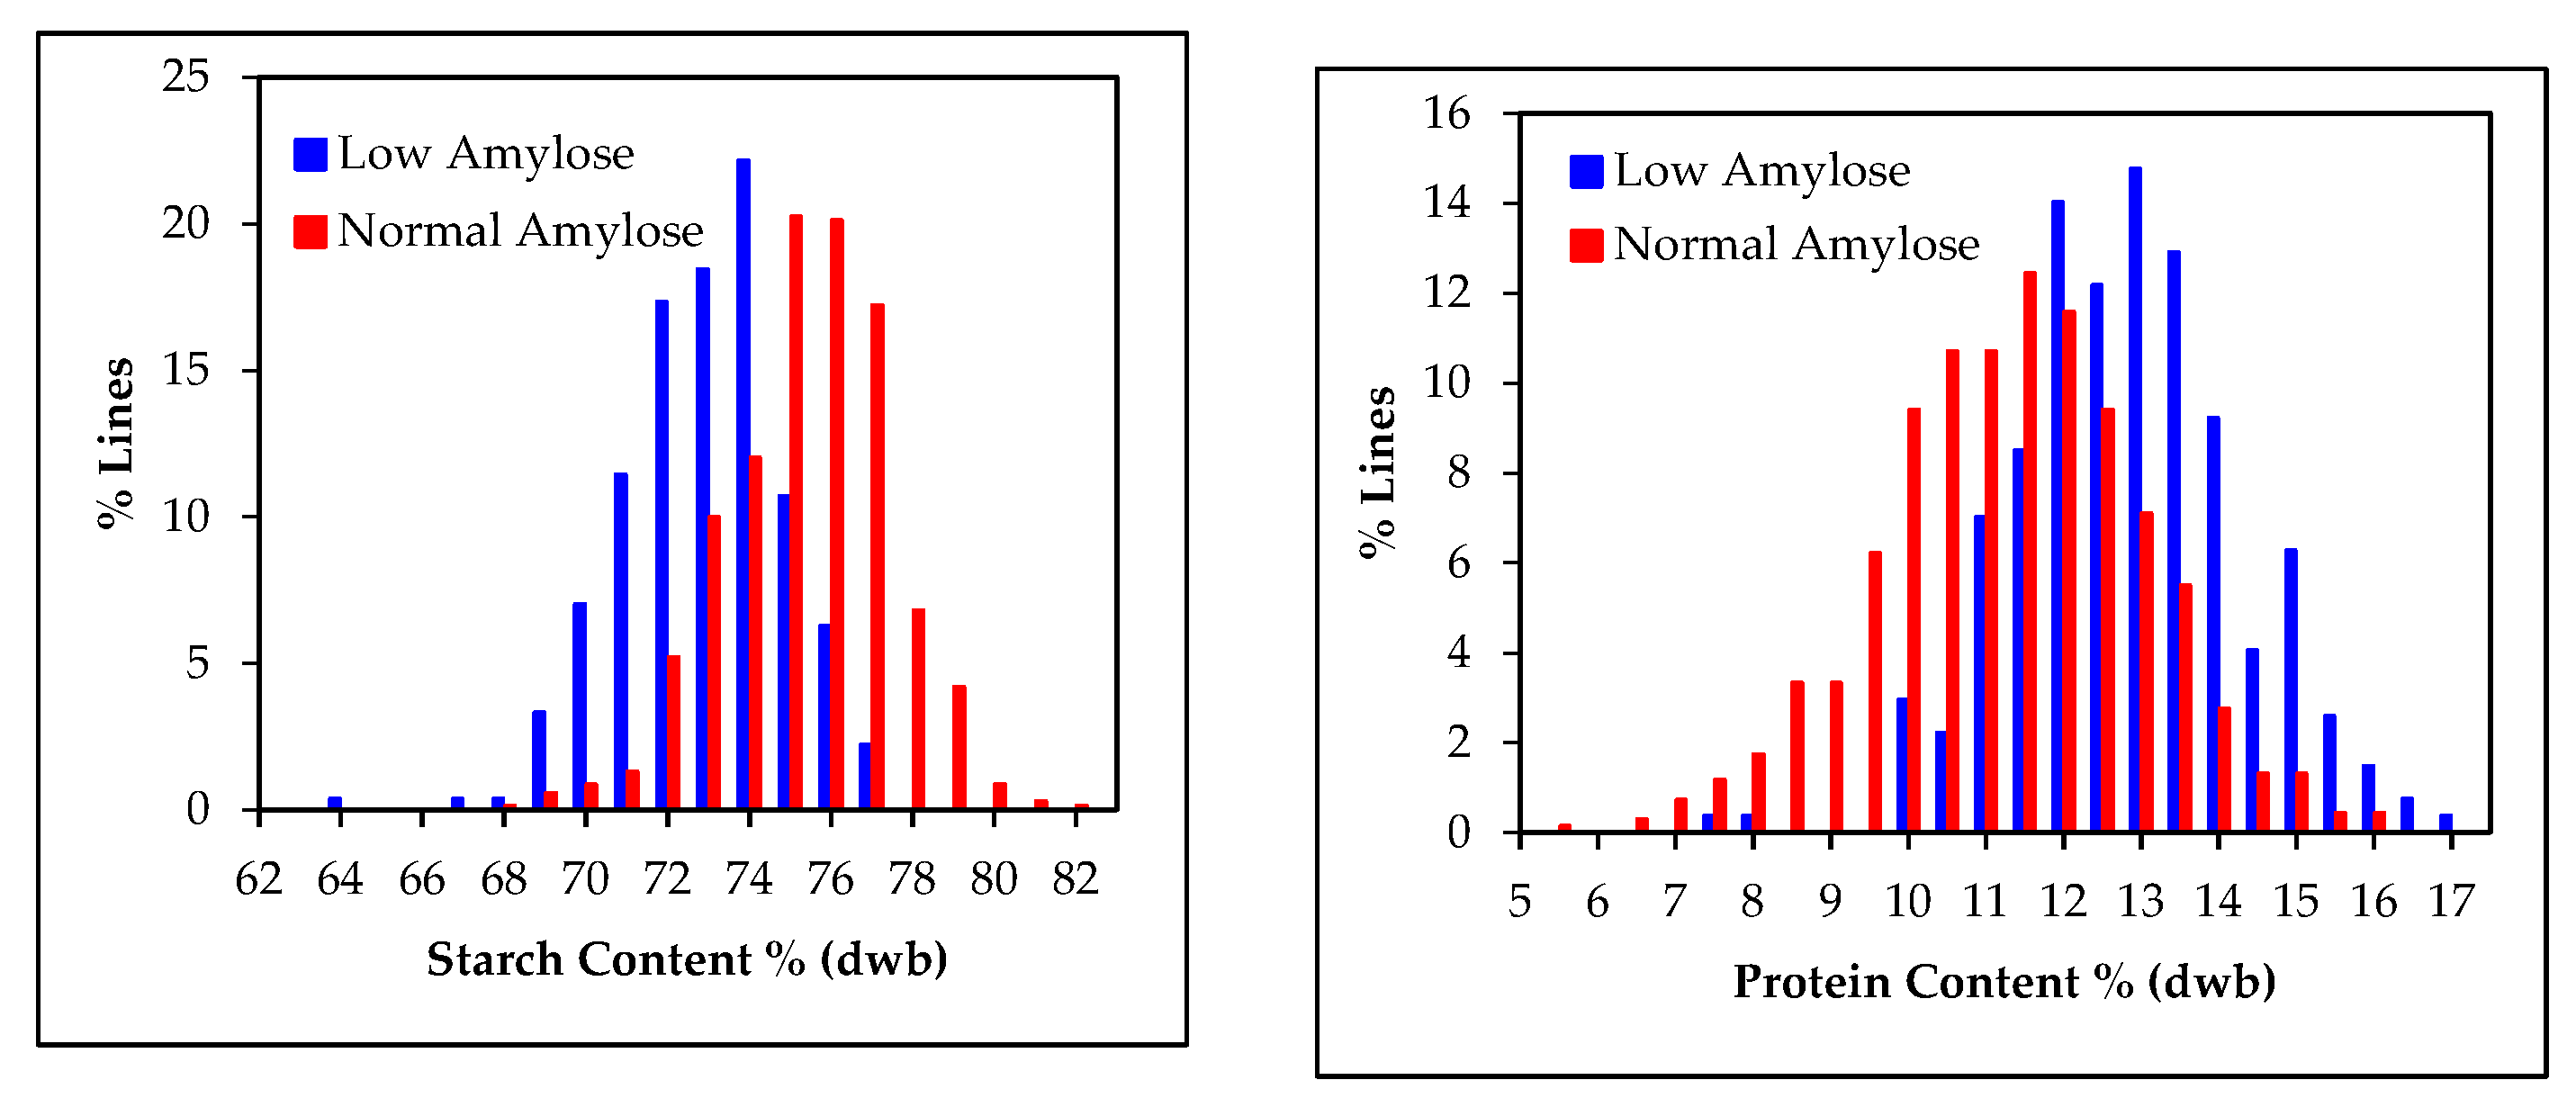
3.6. Relationship between, Starch, Amylose and Protein Contents in Grain Sorghum Populations

The relationship between the dry weight basis starch and protein contents in grain sorghum based on NIR predictions of 1337 grain samples from the two breeding populations is shown in Figure 8. There was a negative relationship between starch and protein percent in grain sorghum (r = −0.755, p < 10−181). Previous studies have shown mixed results regarding the association between starch and protein contents of sorghum grain. Subramanian and Jambunathan (1981) [38] found a strong negative correlation between starch and protein, while Buffo et al., (1998) [39] found no relationship. However, Buffo et al., (1998) [39] evaluated only 45–46 commercial hybrids and the range of starch and protein was narrow compared to the current study. Rhodes et al., (2017) evaluated 265 accessions and also reported a strong negative relationship between starch and protein contents in sorghum grain [40]. We evaluated a large number of samples covering a very wide range of starch and protein contents, and our results further confirm that there is a strong negative relationship between starch and protein content (on a percentage basis) in grain sorghum.
The amylose calibration was used to estimate amylose contents in grain samples and based upon this, samples were divided into low amylose (<5% amylose) and normal amylose groups (>15% amylose). The frequency distribution of starch and protein contents in the selected groups are given in Figure 9. In these specific sample populations, low amylose samples tended to have less starch compared to that of normal samples. Accordingly, the reverse was observed with the protein contents of low amylose samples tending to be higher than in samples with normal amylose contents, partly due to the negative relationship between grain starch and protein. Multi-location trials with pedigreed populations segregating for variability in starch, amylose, and protein contents would be beneficial to further investigate the relationship between these constituents of sorghum grain. Such effort may be necessary to identify potential germplasm that minimizes negative interactions among starch, amylose, and protein contents by breaking up deleterious genetic linkages, similar to how historically low yield in “waxy” (low amylose) sorghum was overcome [41,42,43,44]. Since starch chemical composition is important for different end uses of sorghum grain, these new NIR calibrations can be used to pre-screen and select parent lines for specific uses; for example, to develop waxy hybrids having higher starch contents for ethanol fermentation and gluten-free frozen foods, or hybrids with optimum starch and protein contents for use in animal feed.

3.7. NIR Spectroscopy for High Throughput Phenotyping of Segregating Sorghum Populations

Osborne (2006) has reviewed the application of NIR spectroscopy for quality evaluation of early generation materials in cereal breeding programs [18]. New high throughput techniques such as near-infrared spectroscopy are greatly lowering the cost per data point of phenotypic analysis. High throughput phenotyping of grain composition by NIR spectroscopy can be valuable for screening breeding populations, but also for use in genetic studies of grain composition. Genetic locus detection was improved more by increasing phenotyping throughput over accuracy [45] and NIR spectroscopic analysis of intact sorghum grain is one avenue to increase phenotypic analysis of grain composition. Amylose content and starch properties of sorghum are significantly affected by both genetic and environmental factors [46,47]. Therefore, in breeding programs selection for starch properties at a single location may be misleading [14] and the throughput of analyzing intact sorghum grain can assist in screening sorghum from multi-location trials.
A single scan of a grain sample takes about 2–3 min including sample handling and scanning, depending on the purity of sample. Thus, analysis of starch, amylose, protein, and moisture contents in large segregating breeding populations could be conducted with a much shorter time and at a fraction of the cost, compared to wet chemical analysis of similar number of samples. As long as NIR calibration for other traits are available, other interested traits can also be predicted simultaneously. Therefore, the use of NIR spectroscopy to screen germplasm may enable plant breeders to have more replicates or locations to better estimate the genetic potential of segregating plants in each generation.
Goncalves et al., 2021 used a genomics model combining single nucleotide polymorphisms (SNPs) and NIR spectroscopy data to predict fiber and sucrose content in a sugarcane population [48]. They found that the NIR model showed the highest prediction accuracy of phenotypes compared to using genomics alone or genomics + NIR models suggesting that NIR-based predictions are an effective strategy for predicting the genetic merits of sugarcane clones. This shows that NIR spectroscopy data is worth testing for its ability to enhance genomic prediction for sorghum grain end-use quality traits in the future.

4. Conclusions

NIR spectroscopy calibrations presented in this report can be used as a rapid analysis pre-screening tool for characterizing sorghum starch composition in segregating populations and to identify germplasm for developing new cultivars and hybrids for specific end uses. This whole grain NIR methodology can therefore be used to support the improvement of sorghum at the genetic level by identifying potentially useful sorghum lines based on starch and/or amylose levels. The information about the starch and protein contents in waxy (low amylose) and nonwaxy (normal amylose) groups of breeding populations can be used to identify lines with a desired combination of starch, amylose, and protein contents to match specific end use quality requirements.

Author Contributions

Conceptualization, S.R.B., K.H.S.P. and X.W.; methodology, X.W., S.R.B. and K.H.S.P.; software, K.H.S.P. and S.R.B.; formal analysis, S.R.B., X.W. and K.H.S.P.; resources, M.P.-F., C.H., M.K.Y., S.V.K.J., T.O., F.M.A., T.T., R.P., W.L.R., M.A.K. and B.B.; writing—original draft preparation, K.H.S.P. and S.R.B.; writing—review and editing, K.H.S.P., S.R.B., X.W., M.P.-F., C.H., M.K.Y., S.V.K.J., T.O., F.M.A., T.T., R.P., W.L.R., M.A.K. and B.B.; supervision, S.R.B., X.W. and F.M.A.; project administration, S.R.B. and X.W.; All authors have read and agreed to the published version of the manuscript.

Funding

MKY was funded by USDA-AFRI Plant Breeding Program Award# 2019-67014-29174.

Institutional Review Board Statement

Not applicable.

Informed Consent Statement

Not applicable.

Data Availability Statement

Data is contained within the article.

Acknowledgments

Mention of trade names or commercial products in this publication is solely for the purpose of providing specific information and does not imply recommendation or endorsement by the U.S. Department of Agriculture. The USDA is an equal opportunity provider and employer. This work was supported in part by the U.S. Department of Agriculture, Agricultural Research Service. Contribution number 22-082-J from Kansas Agricultural Research Station. For M.K.Y., this research was funded by USDA-AFRI Plant Breeding Program Award# 2019-67014-29174.

Conflicts of Interest

The authors declare no conflict of interest.

References

  1. Anglani, C. Sorghum for human food–A review. Plant Foods Hum. Nutr. 1998, 52, 85–95. [Google Scholar] [CrossRef] [PubMed]
  2. Aruna, C.; Visarada, K.B. Other Industrial Uses of Sorghum. In Breeding Sorghum for Diverse End Uses; Aruna, C., Visarada, K.B.R.S., Venkatesh Bhat, B., Tonapi, V.A., Eds.; Woodhead Publishing: Cambridge, MA, USA, 2019; pp. 271–292. ISBN 9780081018804. [Google Scholar]
  3. Dahlberg, J.; Janoš, B.; Sikora, V.; Latković, D. Assessing sorghum [Sorghum bicolor (L.) Moench] germplasm for new traits: Food, fuels & unique uses. Maydica 2012, 56, 85–92. [Google Scholar]
  4. Taylor, J.R.; Schober, T.J.; Bean, S.R. Novel food and non-food uses for sorghum and millets. J. Cereal Sci. 2006, 44, 252–271. [Google Scholar] [CrossRef]
  5. Wang, D.; Bean, S.; McLaren, J.; Seib, P.; Madl, R.; Tuinstra, M.; Shi, Y.; Lenz, M.; Wu, X.; Zhao, R. Grain sorghum is a viable feedstock for ethanol production. J. Ind. Microbiol. Biotechnol. 2008, 35, 313–320. [Google Scholar] [CrossRef] [PubMed]
  6. de Morais Cardoso, L.; Pinheiro, S.S.; Martino, H.S.D.; Pinheiro-Sant’Ana, H.M. Sorghum (Sorghum bicolor L.): Nutrients, bioactive compounds, and potential impact on human health. Crit. Rev. Food Sci. Nutr. 2017, 57, 372–390. [Google Scholar] [CrossRef] [PubMed]
  7. Xiong, Y.; Zhang, P.; Warner, R.D.; Fang, Z. Sorghum grain: From genotype, nutrition, and phenolic profile to its health benefits and food applications. Compr. Rev. Food Sci. Food Saf. 2019, 18, 2025–2046. [Google Scholar] [CrossRef] [PubMed] [Green Version]
  8. McGinnis, M.J.; Painter, J.E. Sorghum: History, use, and health benefits. Nutr. Today 2020, 55, 38–44. [Google Scholar] [CrossRef]
  9. Stefoska-Needham, A.; Tapsell, L. Considerations for progressing a mainstream position for sorghum, a potentially sustainable cereal crop, for food product innovation pipelines. Trends Food Sci. Technol. 2020, 97, 249–253. [Google Scholar] [CrossRef]
  10. Khoddami, A.; Messina, V.; Vadabalija Venkata, K.; Farahnaky, A.; Blanchard, C.L.; Roberts, T.H. Sorghum in foods: Functionality and potential in innovative products. Crit. Rev. Food Sci. Nutr. 2021, 1–17. [Google Scholar] [CrossRef] [PubMed]
  11. Taylor, J.R.; Duodu, K.G. Sorghum and millets: Grain-quality characteristics and management of quality requirements. In Cereal Grains, 2nd ed.; Wrigley, C., Batey, I., Miskelly, D., Eds.; Woodhead Publishing: Cambridge, MA, USA, 2017; pp. 317–351. ISBN 978-0-08-100719-8. [Google Scholar]
  12. Tester, R.F.; Karkalas, J.; Qi, X. Starch—composition, fine structure and architecture. J. Cereal Sci. 2004, 39, 151–165. [Google Scholar] [CrossRef]
  13. Ai, Y.; Medic, J.; Jiang, H.; Wang, D.; Jane, J.L. Starch characterization and ethanol production of sorghum. J. Agric. Food Chem. 2011, 59, 7385–7392. [Google Scholar] [CrossRef] [PubMed]
  14. Beta, T.; Corke, H. Noodle quality as related to sorghum starch properties. Cereal Chem. 2001, 78, 417–420. [Google Scholar] [CrossRef]
  15. Miller, O.H.; Burns, E.E. Starch characteristics of selected grain sorghums as related to human foods. J. Food Sci. 1970, 35, 666–668. [Google Scholar] [CrossRef]
  16. Lichtenwalner, R.E.; Ellis, E.B.; Rooney, L.W. Effect of incremental dosages of the waxy gene of sorghum on digestibility. J. Anim. Sci. 1978, 46, 1113–1119. [Google Scholar] [CrossRef] [Green Version]
  17. McCleary, B.V.; Charmier, L.M.; McKie, V.A. Measurement of starch: Critical evaluation of current methodology. Starch-Stärke 2019, 71, 1800146. [Google Scholar] [CrossRef] [Green Version]
  18. Osborne, B.G. Applications of near infrared spectroscopy in quality screening of early-generation material in cereal breeding programmes. J. Near Infrared Spec. 2006, 14, 93–101. [Google Scholar] [CrossRef]
  19. Cozzolino, D.; Degner, S.; Eglinton, J. A review on the role of vibrational spectroscopy as an analytical method to measure starch biochemical and biophysical properties in cereals and starchy foods. Foods 2014, 3, 605–621. [Google Scholar] [CrossRef] [Green Version]
  20. Boyles, R.E.; Pfeiffer, B.K.; Cooper, E.A.; Rauh, B.L.; Zielinski, K.J.; Myers, M.T.; Brenton, Z.; Rooney, W.L.; Kresovich, S. Genetic dissection of sorghum grain quality traits using diverse and segregating populations. Theor. Appl. Genet. 2017, 130, 697–716. [Google Scholar] [CrossRef] [Green Version]
  21. Li, J.; Danao, M.G.C.; Chen, S.F.; Li, S.; Singh, V.; Brown, P.J. Prediction of starch content and ethanol yields of sorghum grain using near infrared spectroscopy. J. Near Infrared Spec. 2015, 23, 85–92. [Google Scholar] [CrossRef]
  22. Griebel, S.; Adedayo, A.; Tuinstra, M.R. Genetic diversity for starch quality and alkali spreading value in sorghum. Plant Genome 2021, 14, e20067. [Google Scholar] [CrossRef] [PubMed]
  23. De Alencar Figueiredo, L.F.; Davrieux, F.; Fliedel, G.; Rami, J.F.; Chantereau, J.; Deu, M.; Courtois, B.; Mestres, C. Development of NIRS equations for food grain quality traits through exploitation of a core collection of cultivated sorghum. J. Agric. Food Chem. 2006, 54, 8501–8509. [Google Scholar] [CrossRef] [PubMed]
  24. Casa, A.M.; Pressoir, G.; Brown, P.J.; Casa, A.M.; Pressoir, G.; Brown, P.J. Community resources and strategies for association mapping in sorghum. Crop Sci. 2008, 48, 30–40. [Google Scholar] [CrossRef] [Green Version]
  25. Megazyme. Total Starch Assay Procedure (Amyloglucosidase/α-Amylase Method). K-TSTA-100A, Procedure (b). 2020. Available online: https://www.megazyme.com/documents/Assay_Protocol/K-TSTA-100A_DATA.pdf (accessed on 9 January 2021).
  26. Morrison, W.R.; Laignelet, B. An improved colorimetric procedure for determining apparent and total amylose in cereal and other starches. J. Cereal Sci. 1983, 1, 9–20. [Google Scholar] [CrossRef]
  27. Chrastil, J. Improved colorimetric determination of amylose in starches or flours. Carbohydr. Res. 1987, 159, 154–158. [Google Scholar] [CrossRef]
  28. McDonald, R.S.; Wilks, P.A., Jr. JCAMP-DX: A standard form for exchange of infrared spectra in computer readable form. Appl. Spectrosc. 1988, 42, 151–162. [Google Scholar] [CrossRef]
  29. Martens, H.; Stark, E. Extended multiplicative signal correction and spectral interference subtraction: New preprocessing methods for near infrared spectroscopy. J. Pharmaceut. Biomed. Anal. 1991, 9, 625–635. [Google Scholar] [CrossRef]
  30. Peiris, K.H.; Bean, S.R.; Chiluwal, A.; Perumal, R.; Jagadish, S.K. Moisture effects on robustness of sorghum grain protein near-infrared spectroscopy calibration. Cereal Chem. 2019, 96, 678–688. [Google Scholar] [CrossRef]
  31. Dowell, F.E.; Maghirang, E.B.; Graybosch, R.A.; Berzonsky, W.A.; Delwiche, S.R. Selecting and sorting waxy wheat kernels using near-infrared spectroscopy. Cereal Chem. 2009, 86, 251–255. [Google Scholar] [CrossRef] [Green Version]
  32. Wu, D.; Yong, H.; Shuijuan, F. Short-wave near-infrared spectroscopy analysis of major compounds in milk powder and wavelength assignment. Anal. Chim. Acta 2008, 610, 232–242. [Google Scholar] [CrossRef] [PubMed]
  33. Osborne, B.G.; Fearn, T.; Hindle, P.H. Practical NIR Spectroscopy with Applications in Food and Beverage Analysis; Longman Scientific and Technical: Singapore, 1993; 227p. [Google Scholar]
  34. Williams, P.C. Implementation of near-infrared technology. In Near-Infrared Technology in the Agricultural and Food Industries; Williams, P., Norris, K.H., Eds.; American Association of Cereal Chemist: St. Paul, MN, USA, 2001; pp. 145–169. [Google Scholar]
  35. Fertig, C.C.; Podczeck, F.; Jee, R.D.; Smith, M.R. Feasibility study for the rapid determination of the amylose content in starch by near-infrared spectroscopy. Eur. J. Pharm. Sci. 2004, 21, 155–159. [Google Scholar] [CrossRef] [PubMed]
  36. Dardenne, P. Some considerations about NIR spectroscopy: Closing speech at NIR-2009. NIR News 2010, 21, 8–14. [Google Scholar] [CrossRef]
  37. De Maesschalck, R.; Jouan-Rimbaud, D.; Massart, D.L. The mahalanobis distance. Chemometr. Intell. Lab. Syst. 2000, 50, 1–18. [Google Scholar] [CrossRef]
  38. Subramanian, V.; Jambunathan, R. Properties of sorghum grain and their relationship to roti quality. Sorghum in the eighties. In Proceedings of the International Symposium on Sorghum Grain Quality, ICRISAT Center, Patanchuru, India, 28–31 October 1981; pp. 281–288. [Google Scholar]
  39. Buffo, R.A.; Weller, C.L.; Parkhurst, A.M. Relationships among grain sorghum quality factors. Cereal Chem. 1998, 75, 100–104. [Google Scholar] [CrossRef] [Green Version]
  40. Rhodes, D.H.; Hoffmann, L.; Rooney, W.L.; Herald, T.J.; Bean, S.; Boyles, R.; Brenton, Z.W.; Kresovich, S. Genetic architecture of kernel composition in global sorghum germplasm. BMC Genom. 2017, 18, 15. [Google Scholar] [CrossRef] [Green Version]
  41. Jampala, B.; Rooney, W.L.; Peterson, G.C.; Bean, S.; Hays, D.B. Estimating the relative effects of the endosperm traits of waxy and high protein digestibility on yield in grain sorghum. Field Crops Res. 2012, 139, 57–62. [Google Scholar] [CrossRef]
  42. Yerka, M.K.; Toy, J.J.; Funnell-Harris, D.L.; Sattler, S.E.; Pedersen, J.F. Registration of A/BN641 and RN642 waxy grain sorghum genetic stocks. J. Plant Regist. 2015, 9, 258–261. [Google Scholar] [CrossRef]
  43. Yerka, M.K.; Toy, J.J.; Funnell-Harris, D.L.; Sattler, S.E.; Pedersen, J.F. Registration of N619 to N640 grain sorghum lines with waxy or wild-type endosperm. J. Plant Regist. 2015, 9, 244–248. [Google Scholar] [CrossRef] [Green Version]
  44. Yerka, M.K.; Toy, J.J.; Funnell-Harris, D.L.; Sattler, S.E.; Pedersen, J.F. Evaluation of interallelic waxy, heterowaxy, and wild-type grain sorghum hybrids. Crop Sci. 2016, 56, 1–9. [Google Scholar] [CrossRef]
  45. Lane, H.M.; Murray, S.C. High Throughput can produce better decisions than high accuracy when phenotyping plant populations. Crop Sci. 2021, 61, 3301–3313. [Google Scholar] [CrossRef]
  46. Beta, T.; Corke, H. Genetic and environmental variation in sorghum starch properties. J. Cereal Sci. 2001, 34, 261–268. [Google Scholar] [CrossRef]
  47. Tester, R.F.; Karkalas, J. The effects of environmental conditions on the structural features and physico-chemical properties of starches. Starch-Stärke 2001, 53, 513–519. [Google Scholar] [CrossRef]
  48. Gonçalves, M.T.V.; Morota, G.; Costa, P.M.D.A.; Vidigal, P.M.P.; Barbosa, M.H.P.; Peternelli, L.A. Near-infrared spectroscopy outperforms genomics for predicting sugarcane feedstock quality traits. PLoS ONE 2021, 16, e0236853. [Google Scholar] [CrossRef] [PubMed]
Figure 1. NIR spectra of some intact grain samples from populations used for starch and amylose calibrations.
Processes 09 01942 g001
Figure 2. Principal component score plots of NIR spectra of different grain sorghum populations including starch (left) and amylose (right) data sets.
Processes 09 01942 g002
Figure 3. The relationship between laboratory determined and NIR predicted starch content for NIR starch calibration (left) and validation (right).
Processes 09 01942 g003
Figure 4. Regression coefficient plot of the 11 PLS factor starch calibration with important regression peaks marked.
Processes 09 01942 g004
Figure 5. The relationship between laboratory determined and NIR predicted amylose contents for the amylose NIR calibration (left) and validation (right).
Processes 09 01942 g005
Figure 6. Regression coefficient plot of the 11 PLS factor amylose calibration with important regression peaks marked.
Processes 09 01942 g006
Figure 7. Lab-determined versus NIR predicted final starch (left) and amylose (right) cross validated calibrations constructed by combining all spectra in the calibration and validation datasets.
Processes 09 01942 g007
Figure 8. Scatter plot between dry weight basis starch and protein contents of sorghum grain. *** = p < 0.001.
Processes 09 01942 g008
Figure 9. Variability of NIR predicted dry weight basis starch and protein contents in the low amylose (Amylose < 5%) and normal amylose (Amylose > 15%) grain samples of the two breeding populations.
Processes 09 01942 g009
Table 1. Description of the sorghum grain sample population used in the study.
Sample PopulationNYearLocation(s)Type of Sample Population
Amylose
AP1222018TexasBreeding Population
AP2632019Kansas/TexasBreeding Population
AP3312020TexasBreeding Population
AP4372020TexasBreeding Population
Starch
SP1292018KansasDiversity panel
SP2612021KansasHybrid
SP3392019KansasDiversity panel
SP4562019Kansas/TexasBreeding Population
SP5262020CaliforniaBreeding Population
Predictions
Breeding 19462020TexasBreeding Populations
Breeding 23912020California/Argentina/MexicoBreeding Populations
Table 2. Starch and amylose content variability in grain sorghum populations and in calibration and validation sets.
Sample SetPopulationN *MinMaxAvgSD
Starch samples
All 21150.7374.1762.994.31
SP12955.7965.5461.442.56
SP26150.7364.5658.822.96
SP33963.9369.5567.231.40
SP45658.6968.1063.142.28
SP52659.2674.1767.853.95
Calibration set 11950.7374.1763.124.34
SP11658.1265.5462.462.16
SP23350.7364.5658.823.27
SP31963.9369.2967.311.60
SP43458.6968.1062.962.09
SP51759.2674.1767.754.38
Validation set 9253.4672.7062.834.29
SP11355.7963.4260.182.52
SP22853.4663.9558.822.59
SP32064.8469.5567.171.21
SP42258.7467.0063.422.58
SP5962.8172.7068.033.21
Amylose samples
All 1530.2527.909.177.14
AP1224.0027.9014.6810.91
AP2630.2918.218.275.71
AP3310.2512.273.703.56
AP4371.4018.4812.014.98
Calibration set 1020.2527.909.207.19
AP1164.0027.9014.3610.89
AP2410.2918.218.745.92
AP3240.2512.274.073.77
AP4211.4018.0012.034.89
Validation set 510.2827.259.127.09
AP164.0227.2515.5211.95
AP2220.8616.757.415.33
AP370.286.292.442.52
AP4161.9918.4811.985.25
* N: Number of samples; Min: Minimum; Max: Maximum; Avg: Average; SD: Standard deviation.
Publisher’s Note: MDPI stays neutral with regard to jurisdictional claims in published maps and institutional affiliations.

