
Research on Response Characteristics and Control Strategy of the Supercritical Carbon Dioxide Power Cycle

Abstract
:1. Introduction
2. Simple Description of System
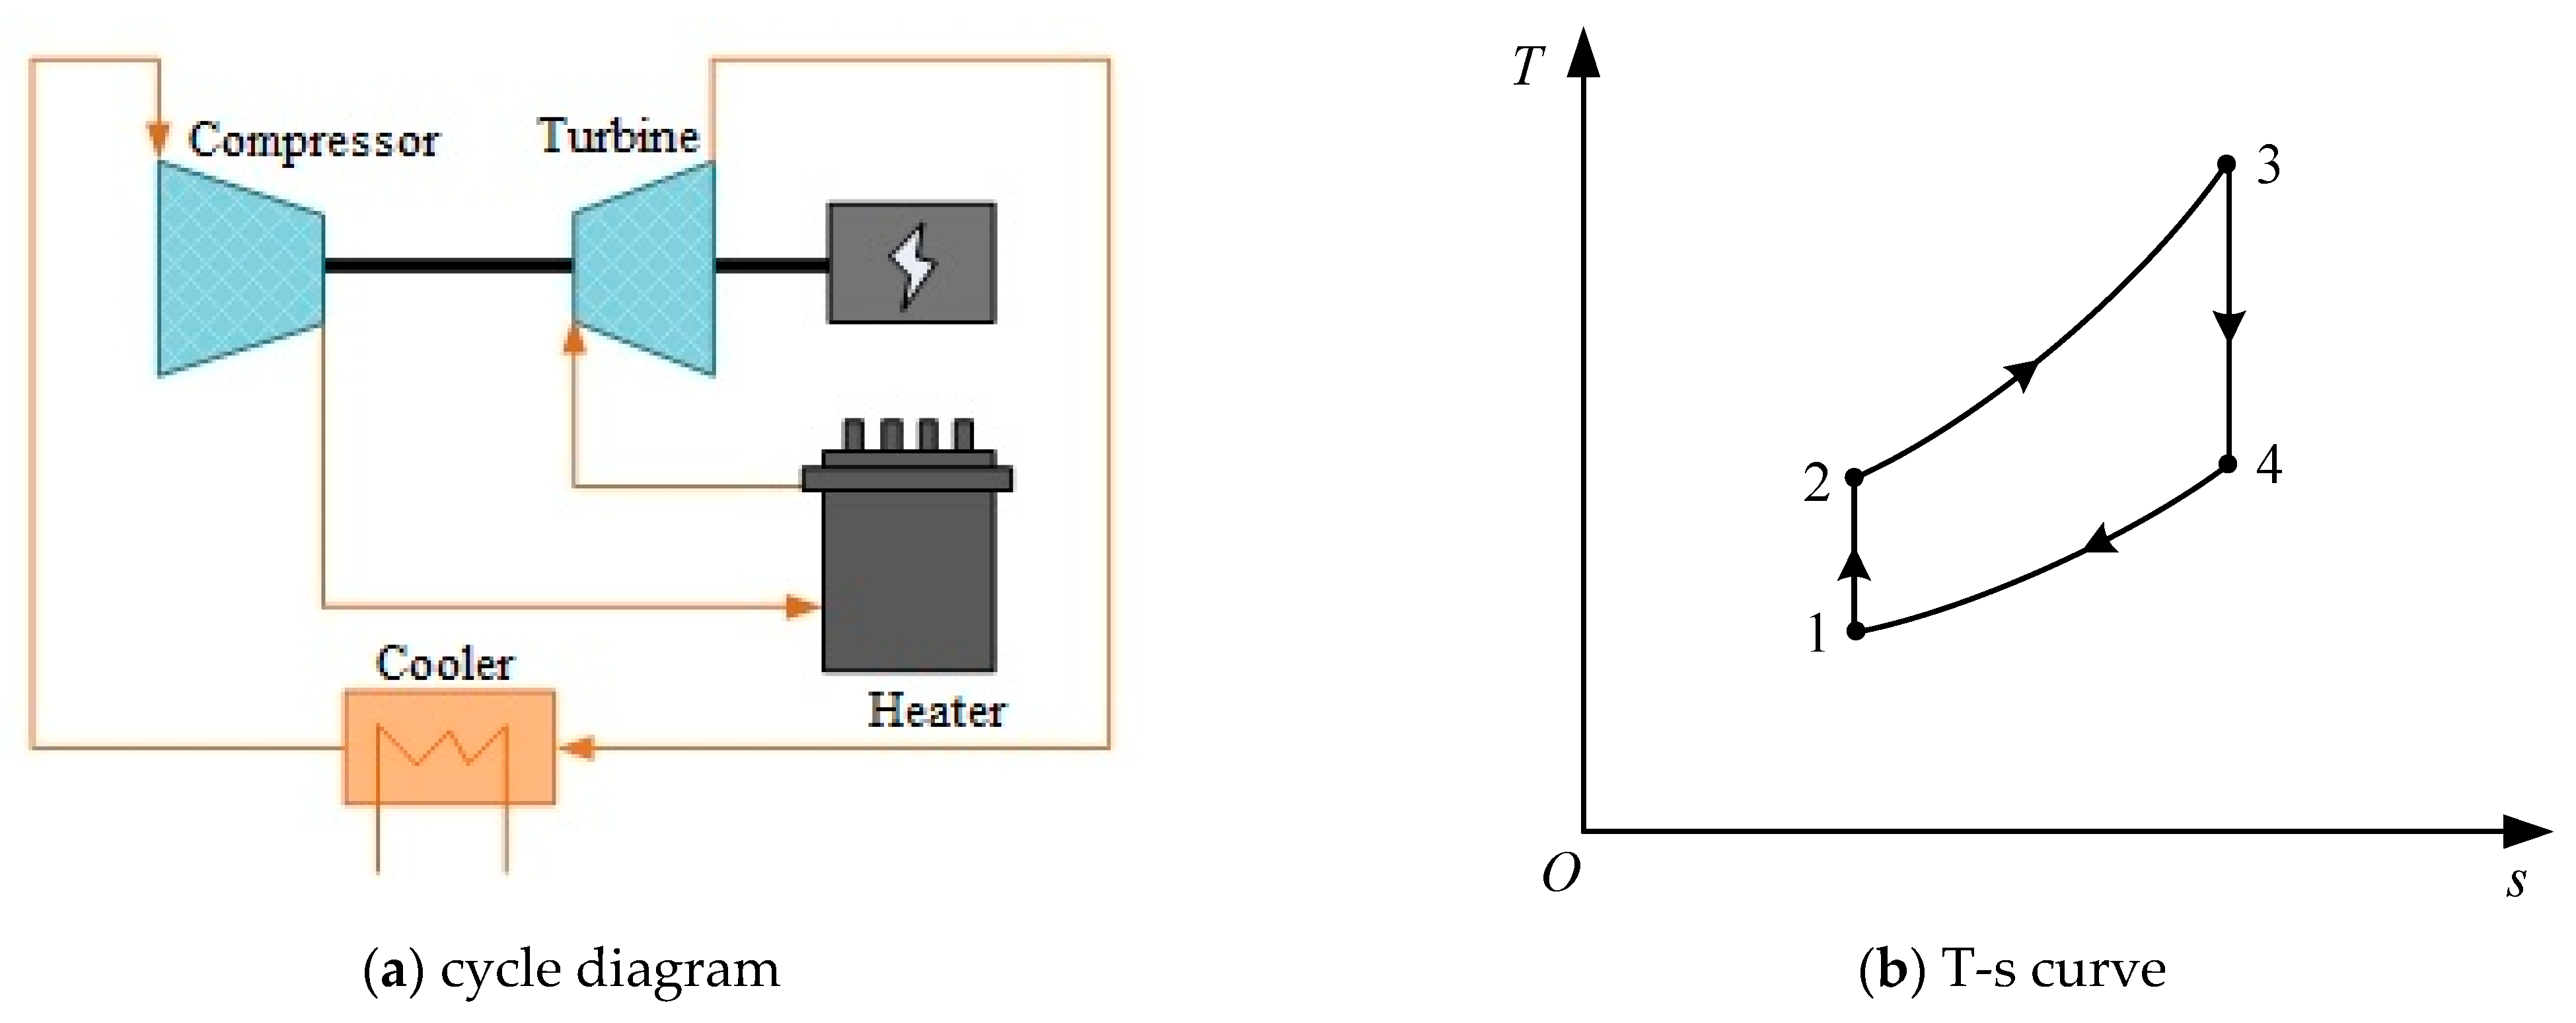
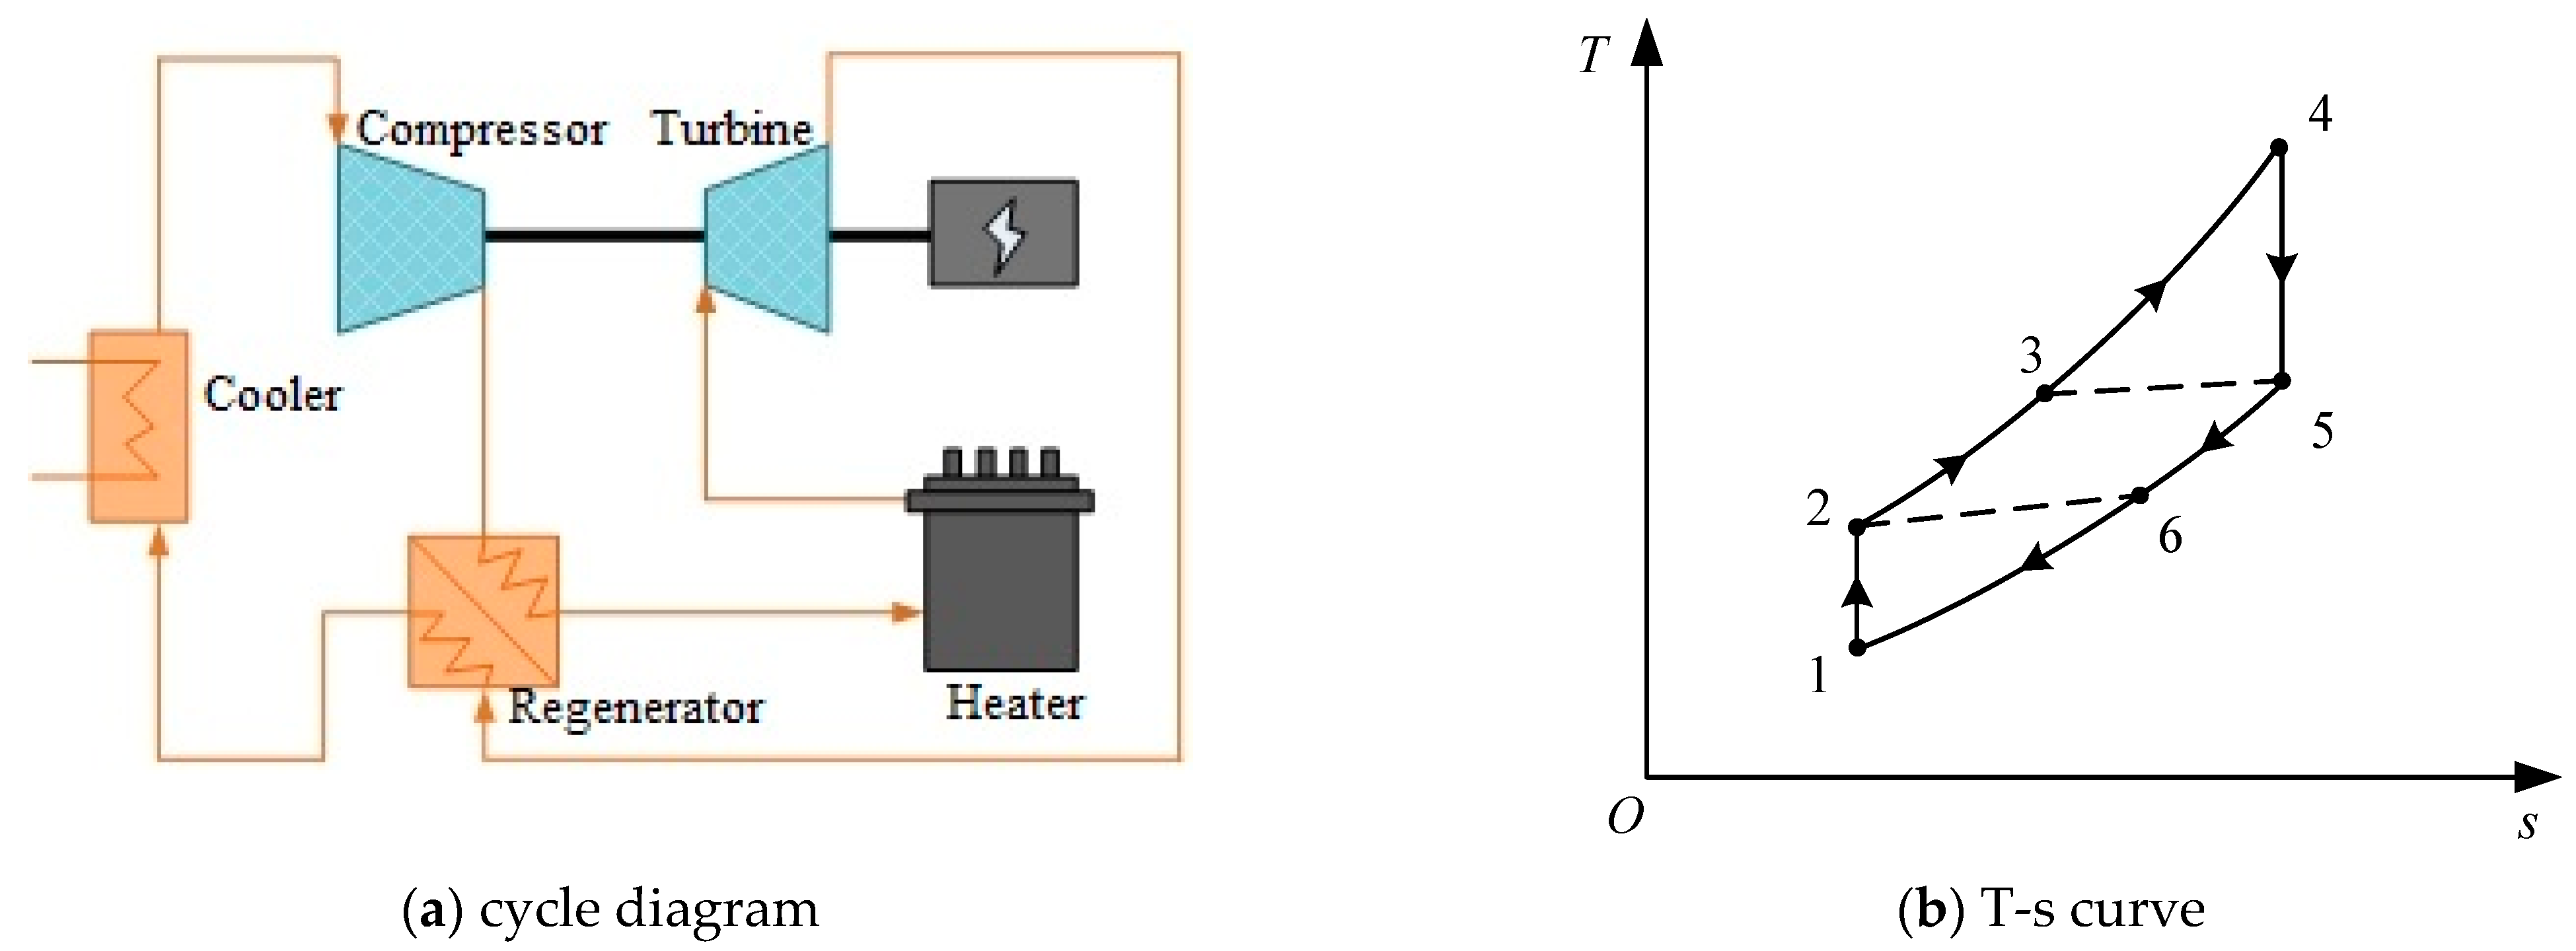
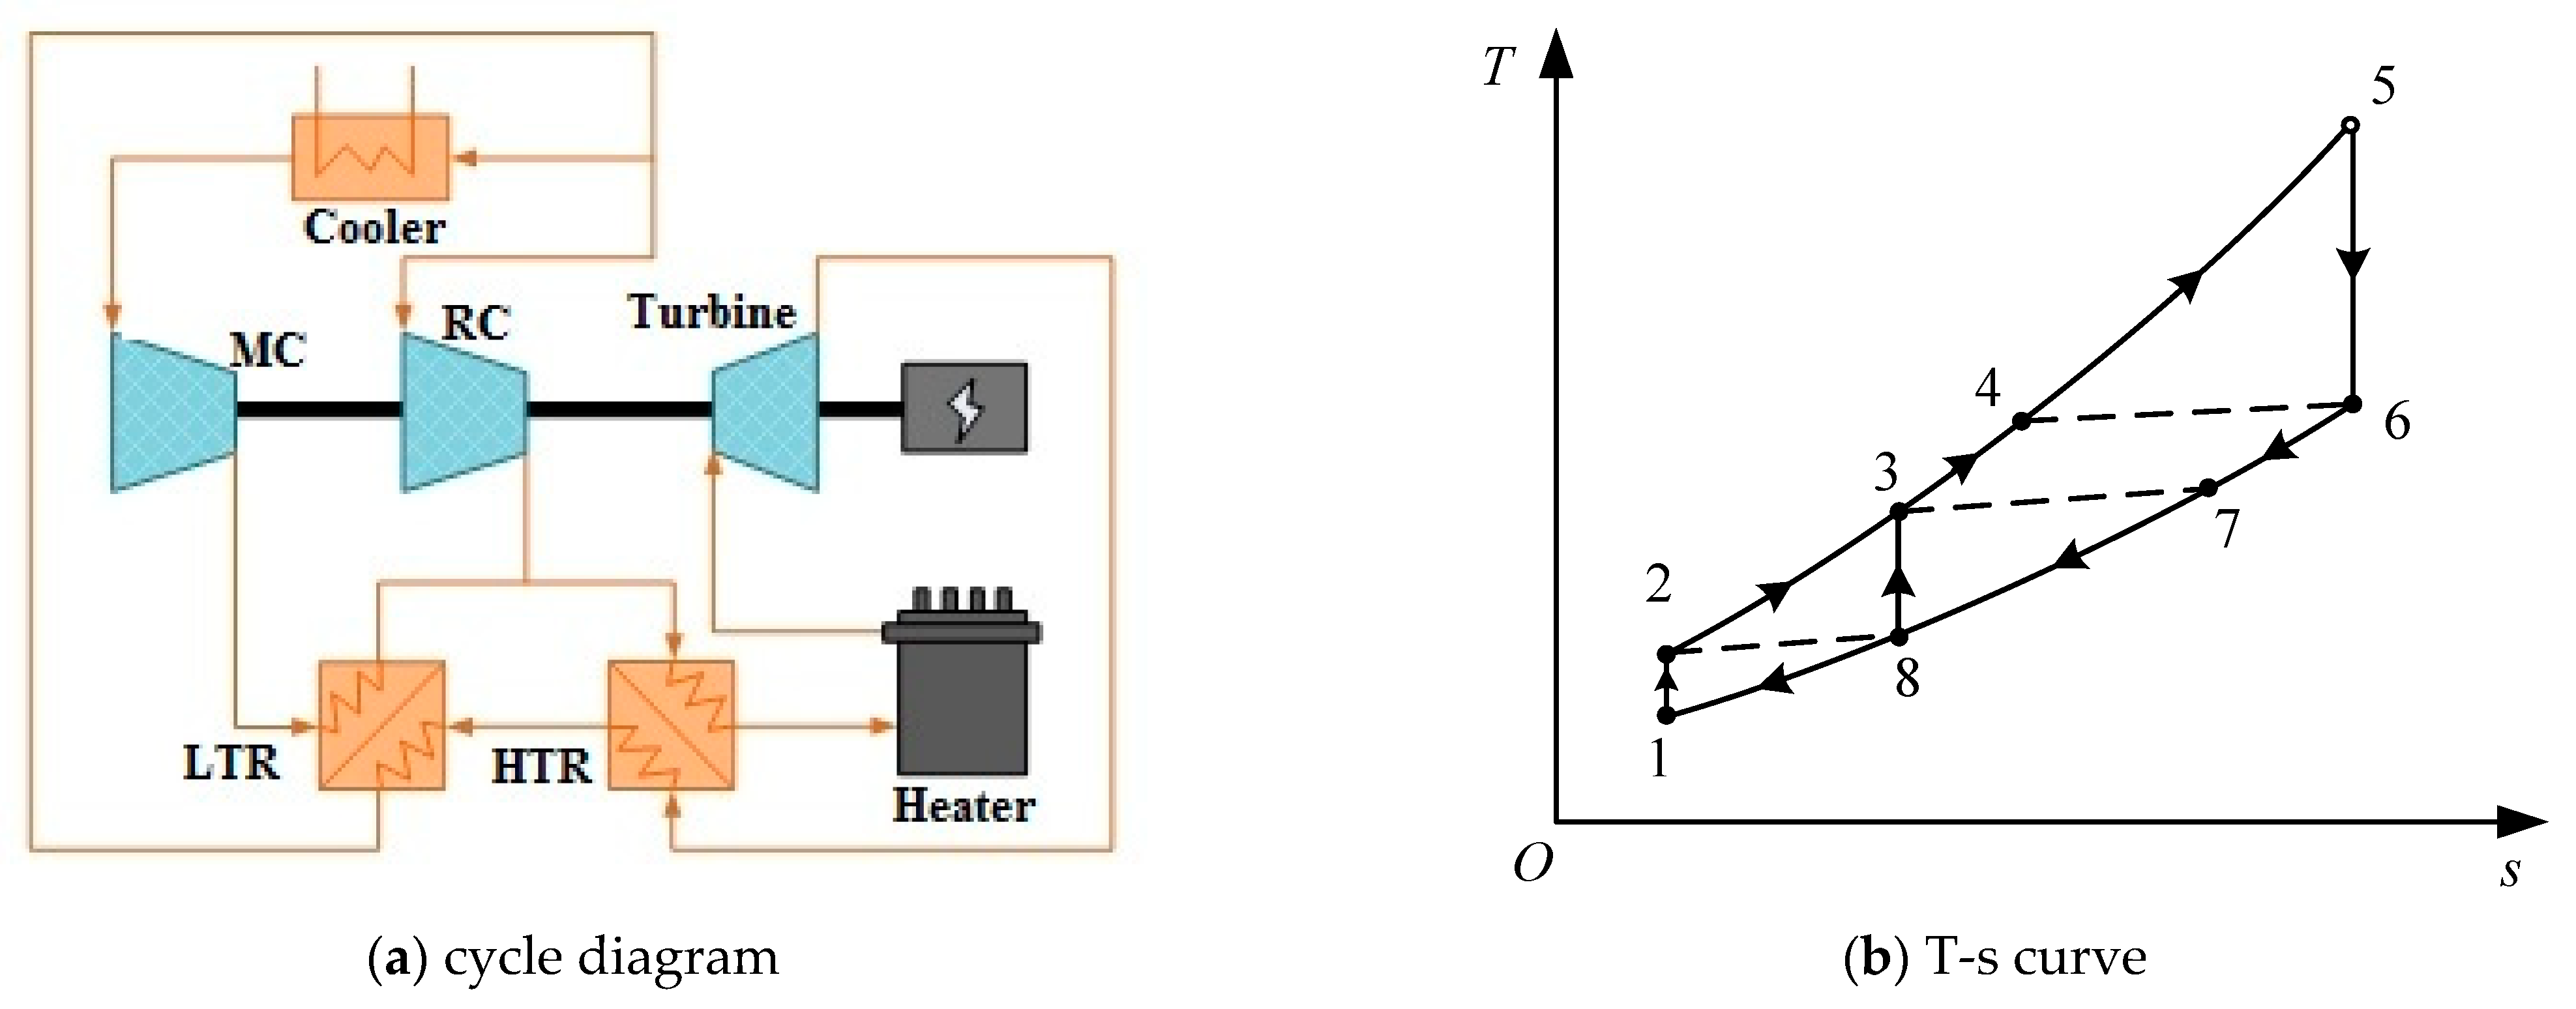
2.1. Comparison of Typical SCO2 Cycles
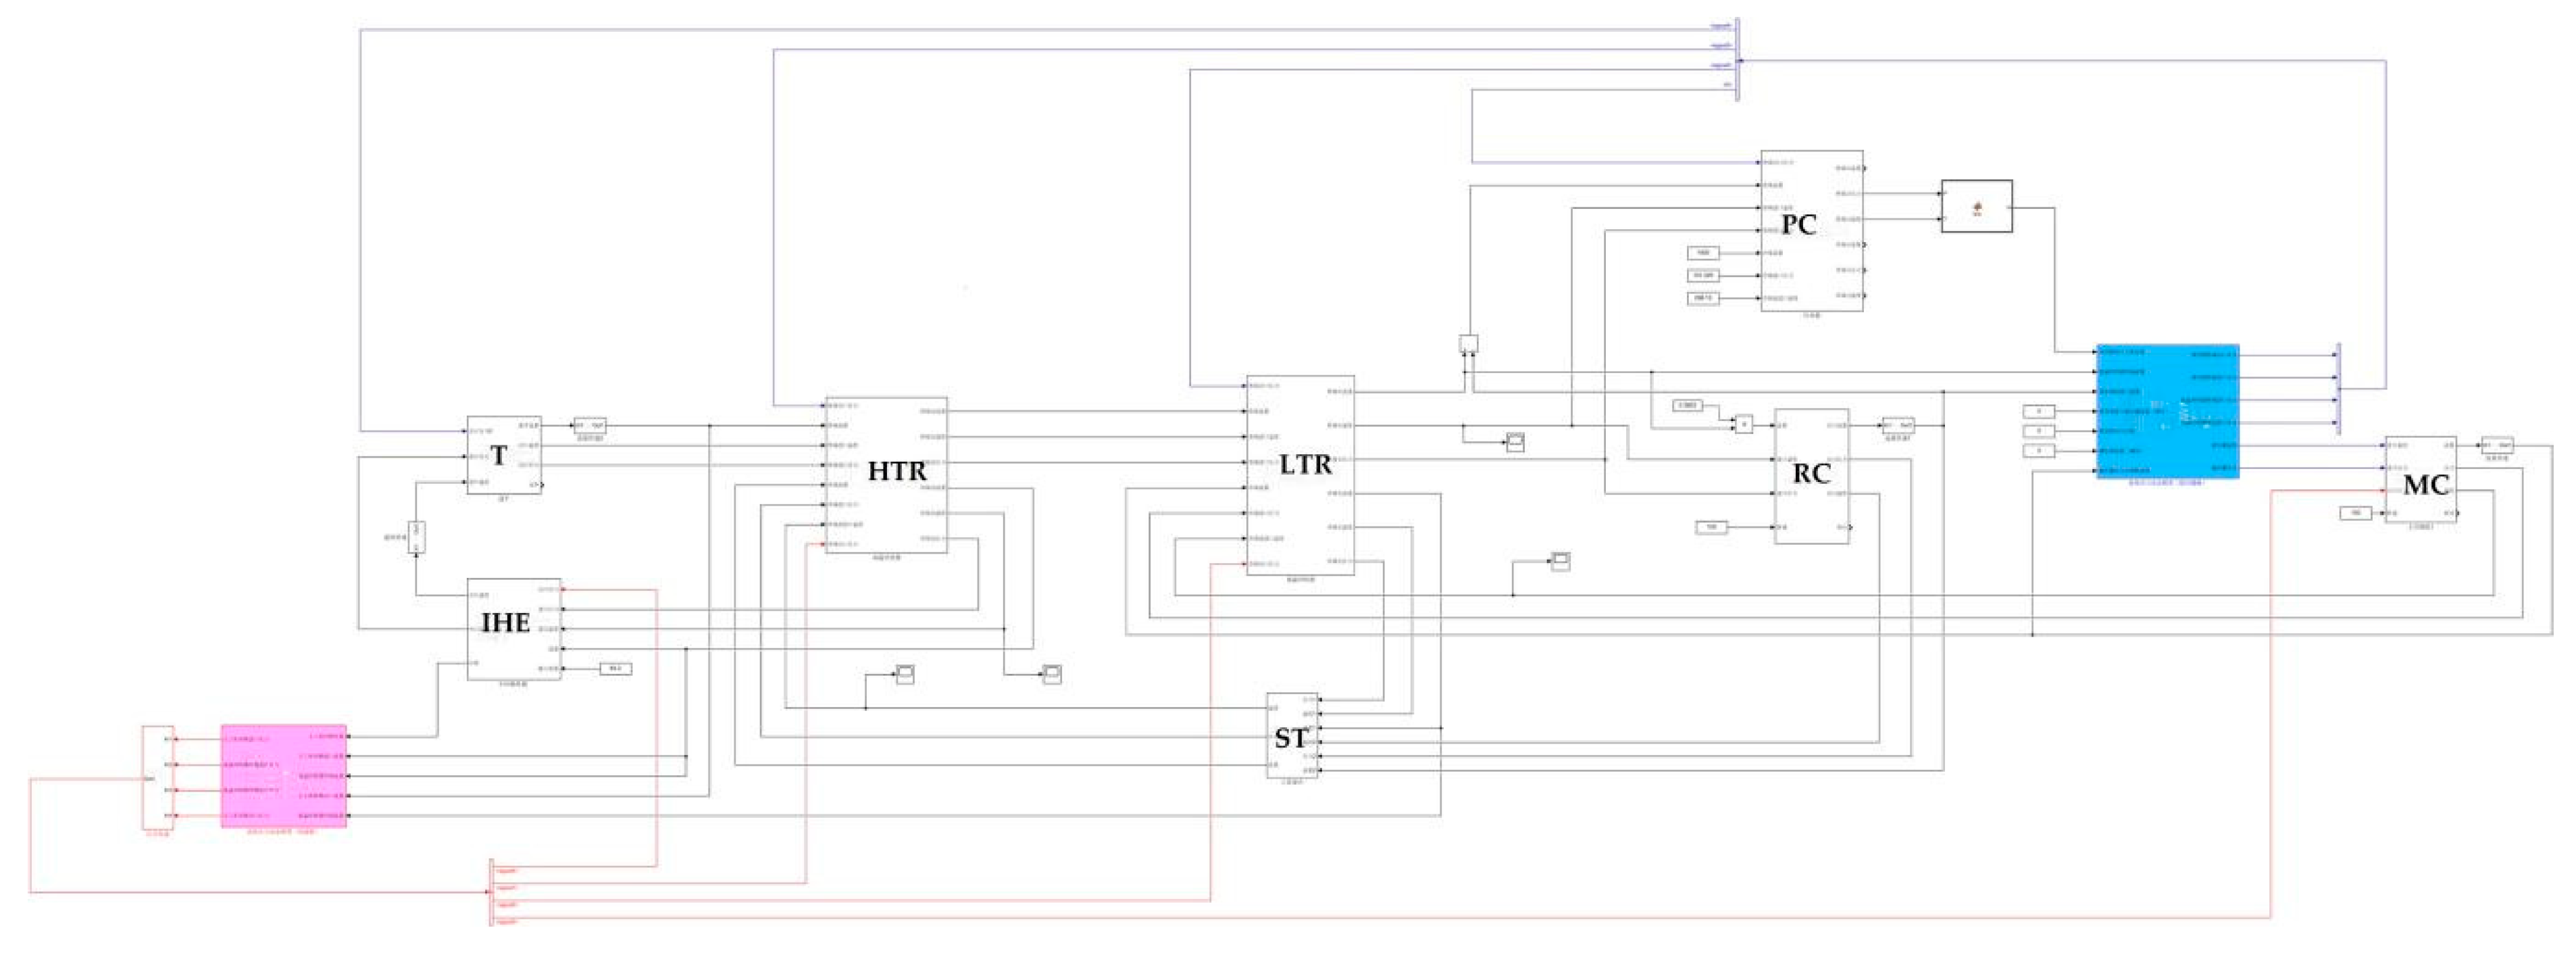
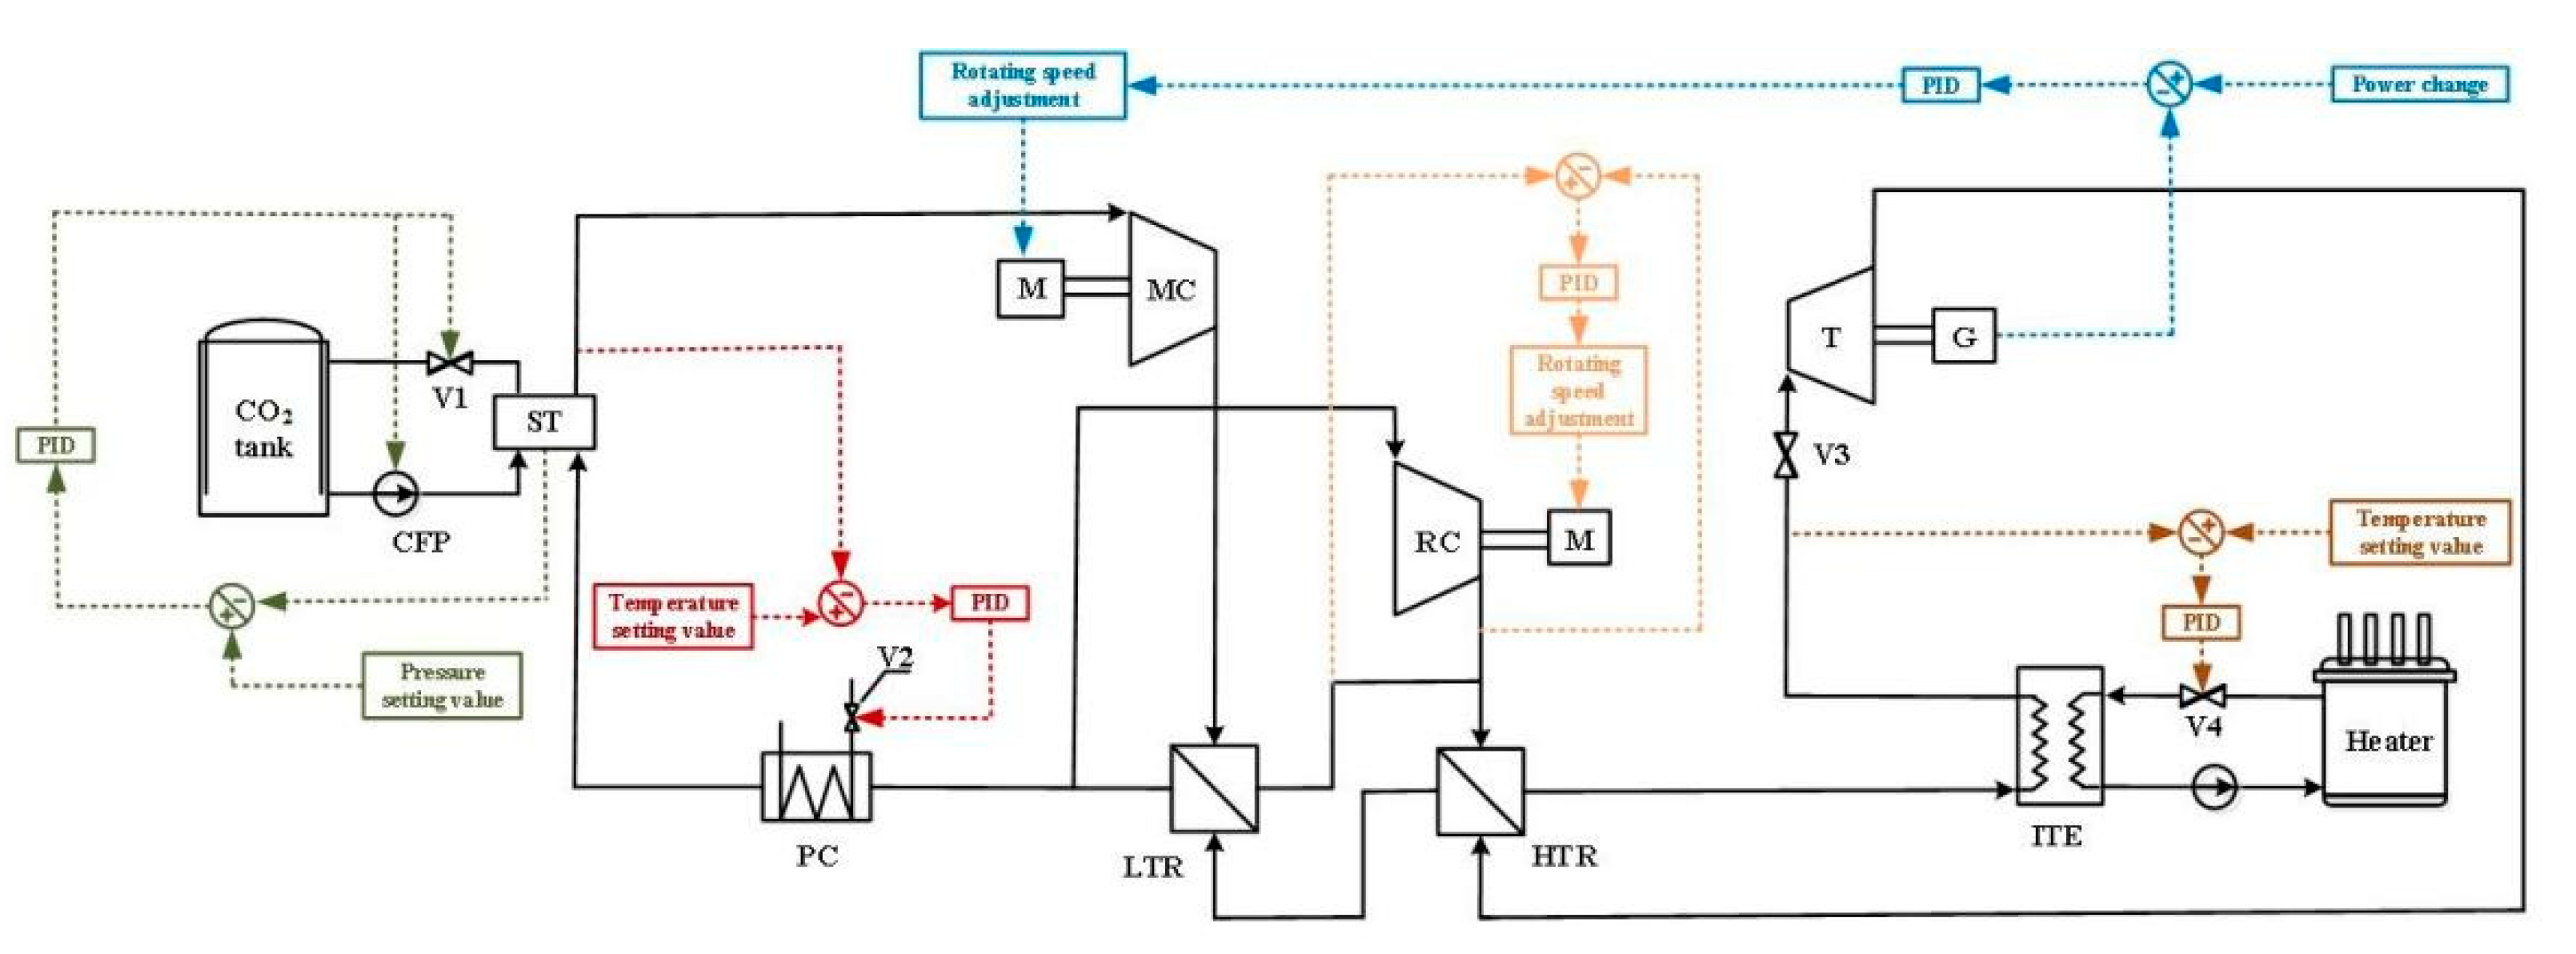
2.2. Description of Recompression System
3. Disturbance Analysis
3.1. Cooling Water Temperature
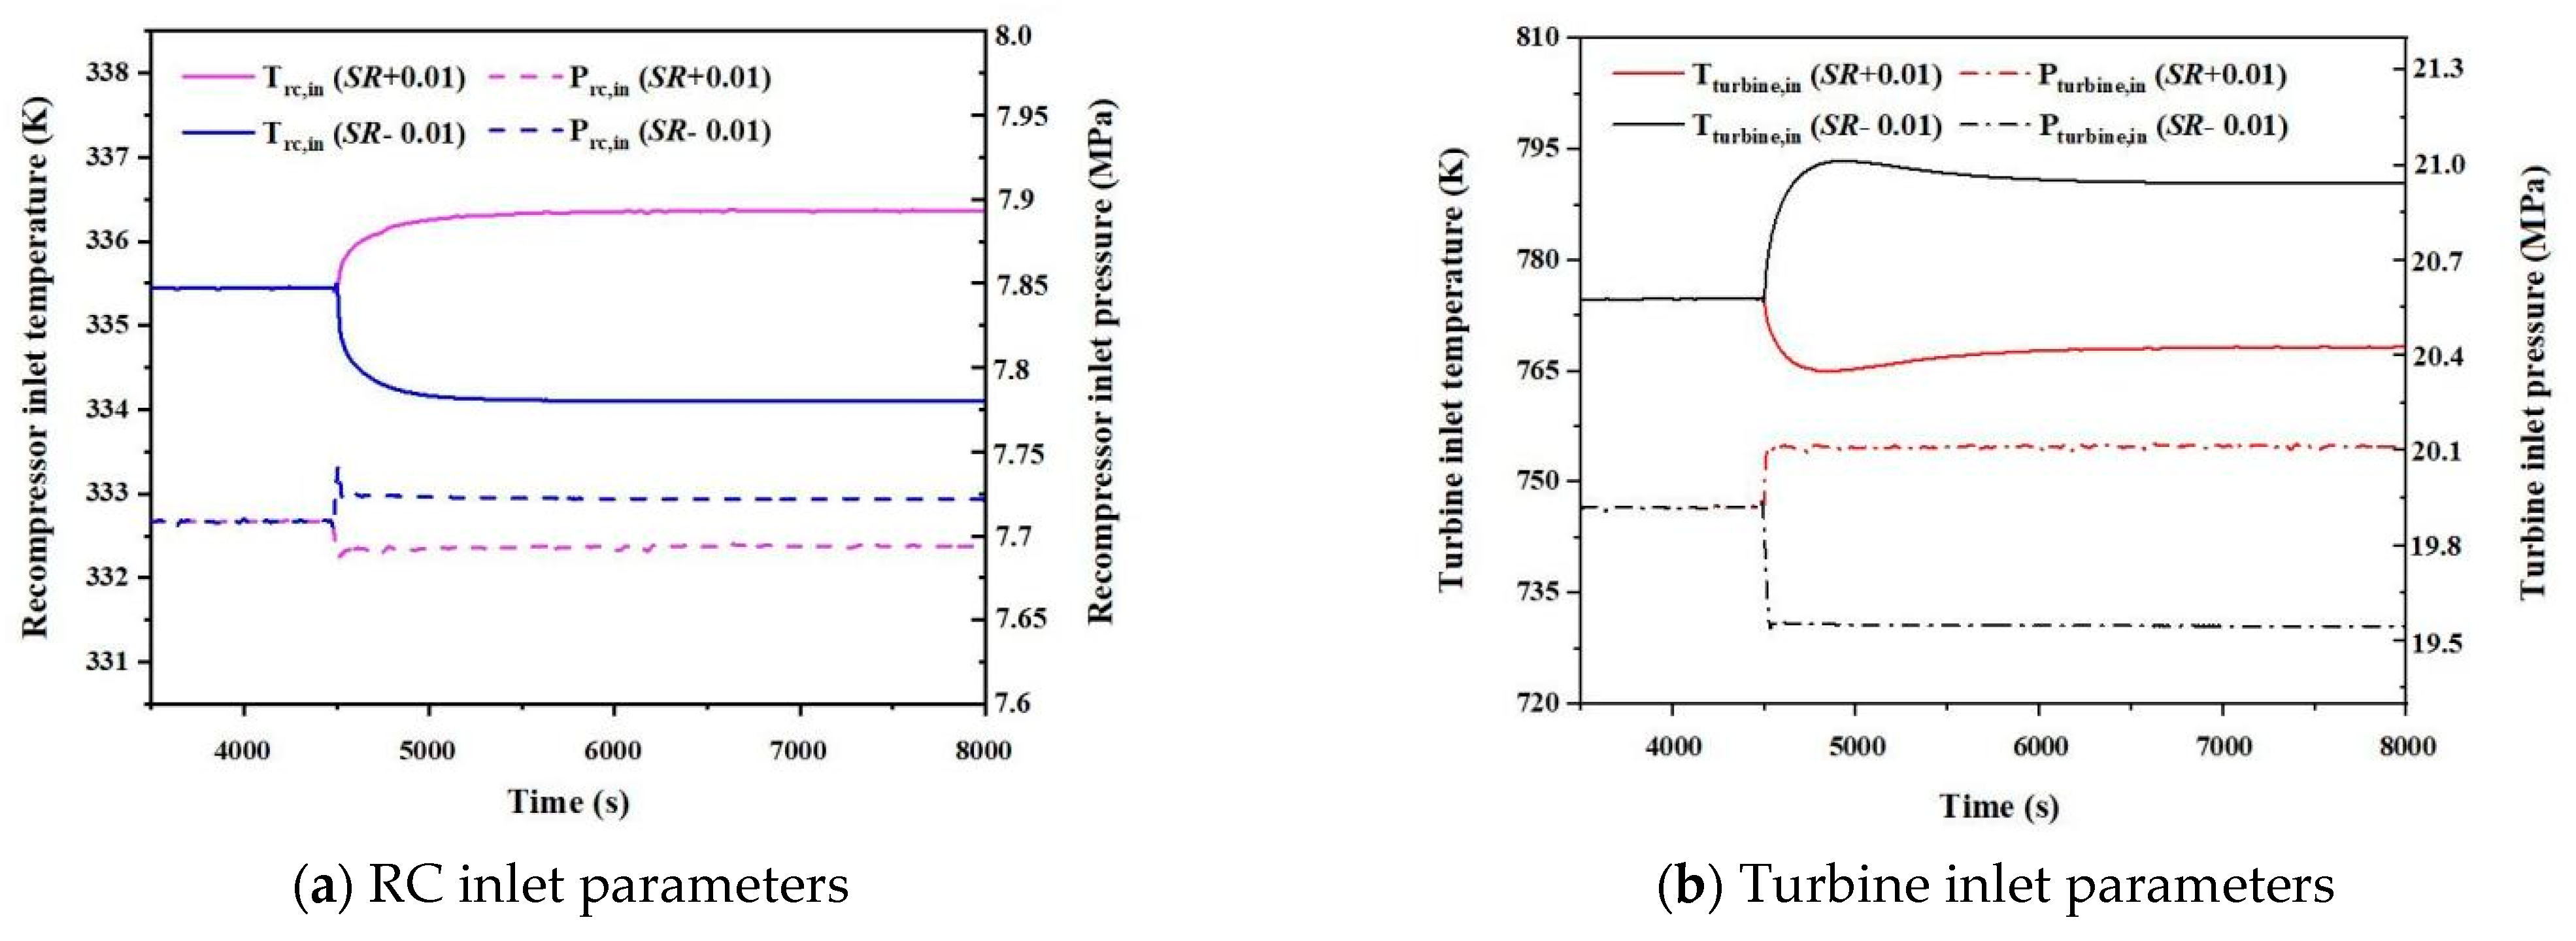
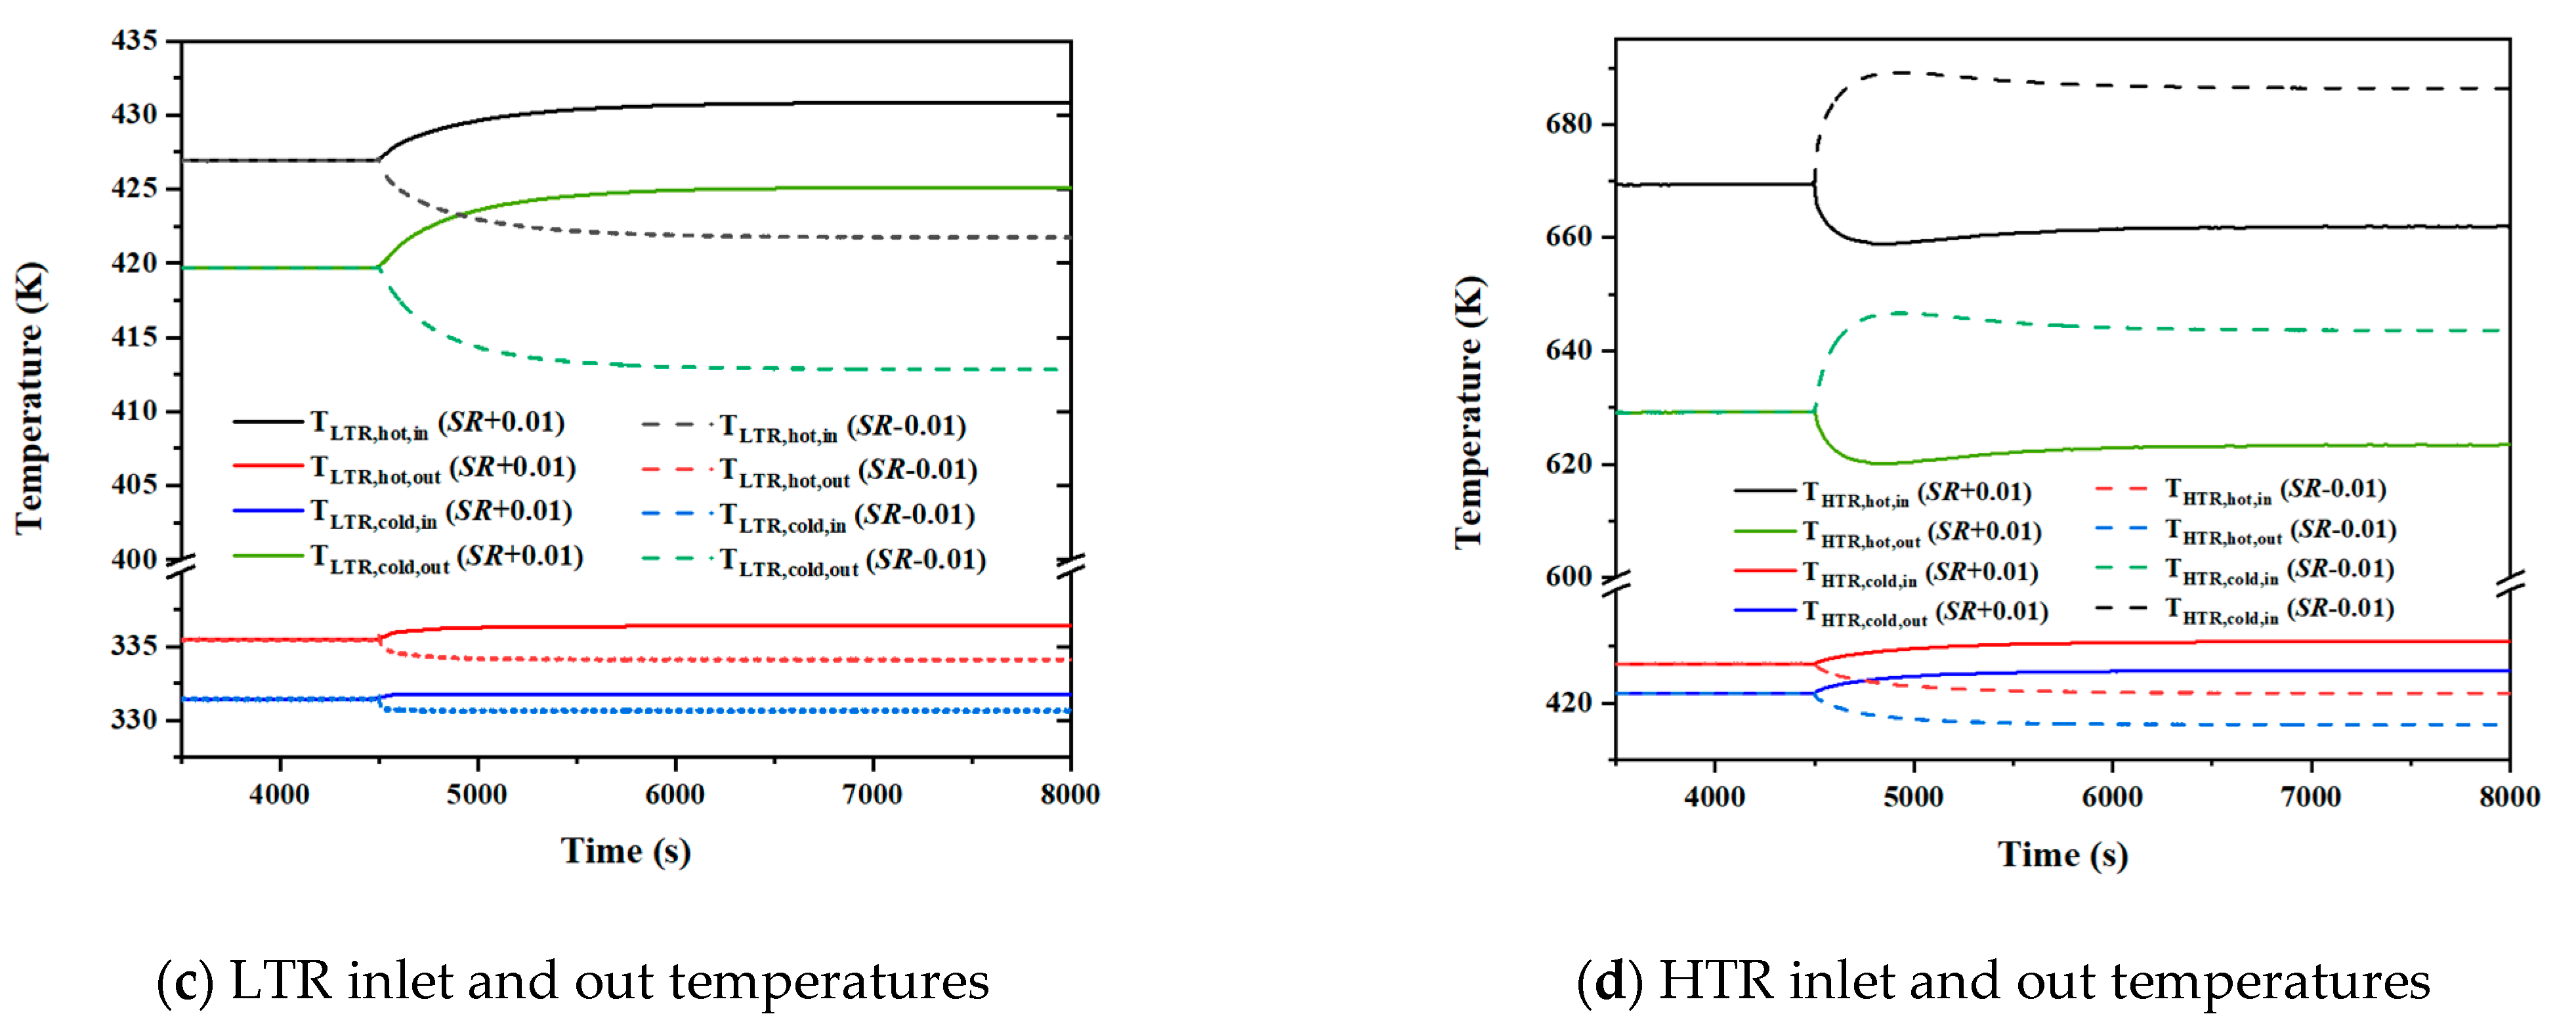
3.2. Split Ratio (SR)
3.3. MC Inlet Pressure
3.4. MC Inlet Temperature
4. Control Strategy of Stable Operation
4.1. Control Strategy
- MC inlet pressure control module
- 2.
- MC inlet temperature control module
- 3.
- Turbine inlet temperature control module
- 4.
- Turbine output power control module
- 5.
- RC outlet pressure control module
4.2. Control Effect Analysis
5. Conclusions
- When the system is subjected to a step disturbance, the pressure shows a similar step response rapidly, while the temperature change is relatively slow, especially for the turbine inlet temperature. Due to the closed-loop system features and the recuperator thermal inertia, the turbine inlet temperature fluctuates in a wide range and the re-stabilization time is the longest, about 2500–3000 s. The inlet temperature of the MC is easily reduced to below the critical point in the cooling water parameters disturbance, but adjusting the cooling water flow is an effective way to control the MC inlet temperature to be constant.
- For the split ratio disturbance and the MC inlet pressure disturbance, the reduction of the value has a greater impact on the system parameters than the increase of the value. When the MC inlet pressure is reduced from 7.7 to 7.5 MPa, the pressure at this point is closer to the critical pressure. The pressures and temperatures of the system key points will fluctuate for a short time, especially the LTR cold end inlet temperature and hot end outlet temperature responses, which may even cause the deterioration of LTR heat transfer.
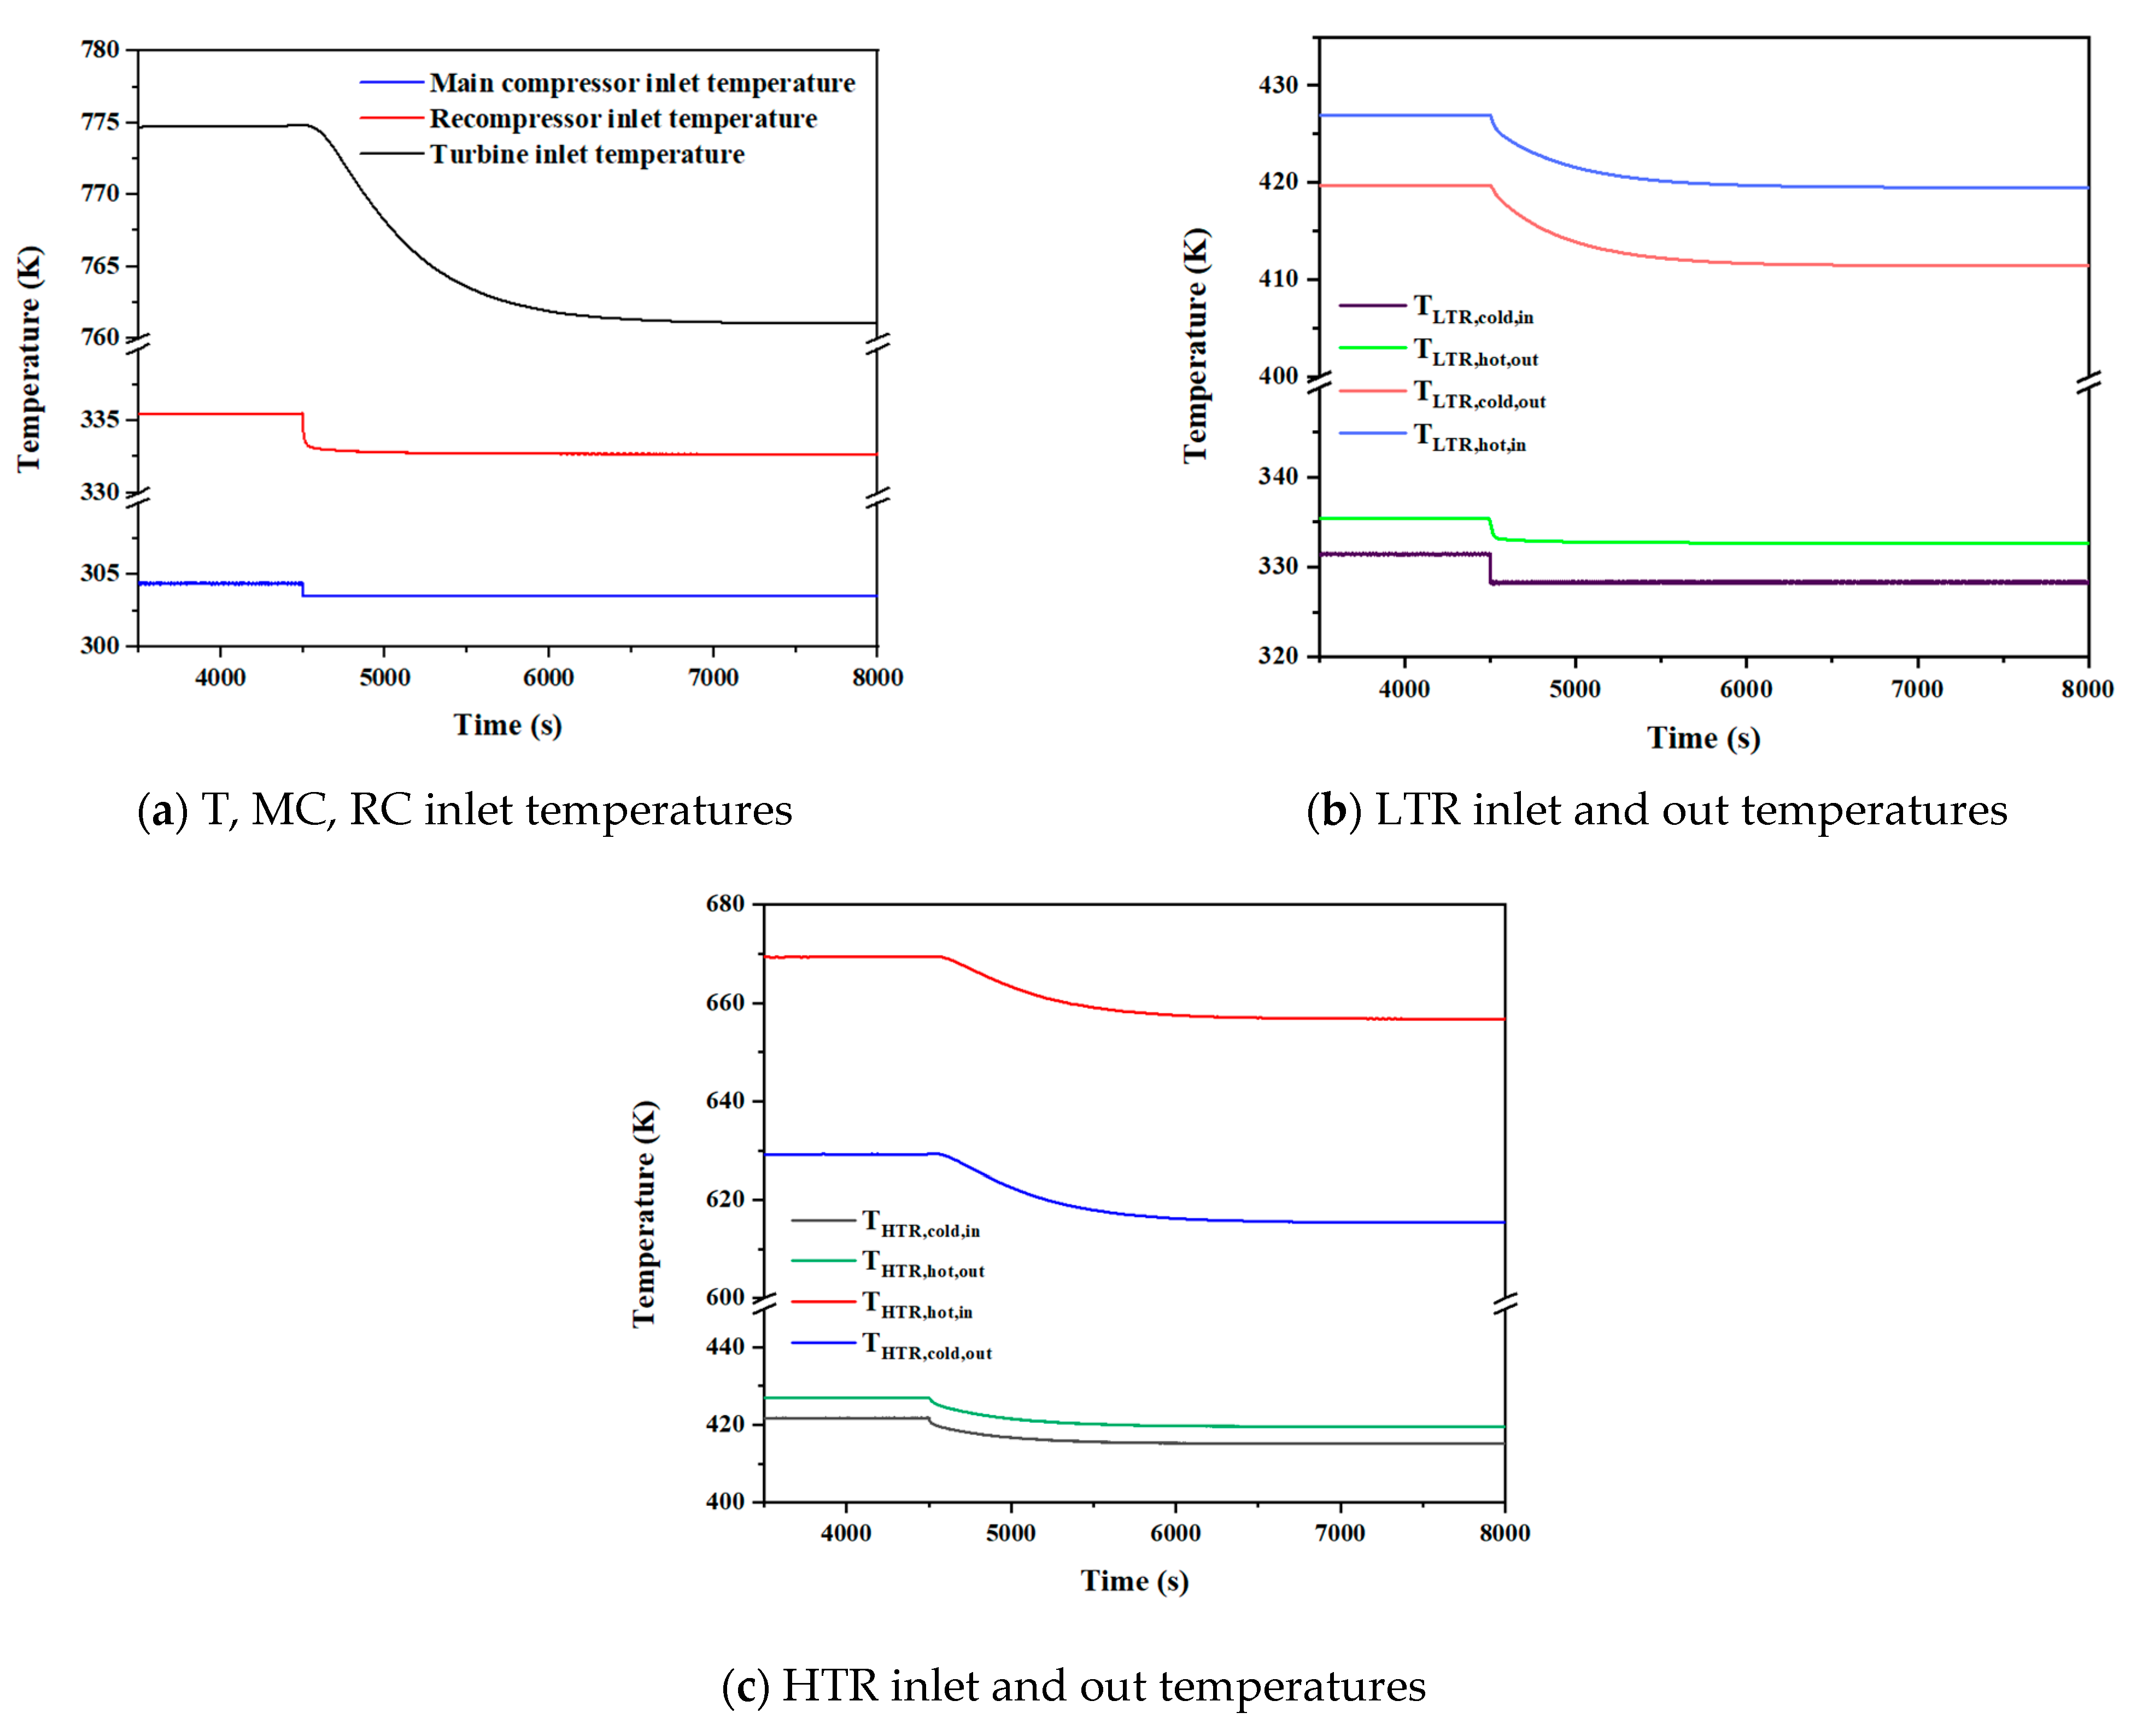
- According to the response characteristics of the system after being disturbed, this study proposed a stable operation control scheme to coordinate the MC inlet temperature and pressure control, PC outlet pressure control, turbine inlet temperature control and turbine load control. When the split ratio decreases by 0.01, the parameters deviate from the set values and the turbine output power decreases. After the control system acts on for about 130 s, the flow rate of each branch reaches the distribution balance under the new split ratio, and meanwhile the turbine load returns to the set demand. The MC inlet temperature is the first to return to the set value, and the fluctuating range of the turbine inlet temperature is ±5 K. In general, the overall control effect is good.
Author Contributions
Funding
Conflicts of Interest
References
- Li, H.; Fan, G.; Cao, L.; Yang, Y.; Yan, X.; Dai, Y.; Zhang, G.; Wang, J. A comprehensive investigation on the design and off-design performance of supercritical carbon dioxide power system based on the small-scale lead-cooled fast reactor. J. Clean. Prod. 2020, 256, 120720. [Google Scholar] [CrossRef]
- Qiao, Z.; Cao, Y.; Li, P.; Wang, X.; Romero, C.E.; Pan, L. Thermoeconomic analysis of a CO2 plume geothermal and supercritical CO2 Brayton combined cycle using solar energy as auxiliary heat source. J. Clean. Prod. 2020, 256, 120374. [Google Scholar]
- Guo, J.; Li, M.; Xu, J.; Yan, J.; Ma, T. Energy, exergy and economic (3E) evaluation and conceptual design of the 1000 MW coal-fired power plants integrated with S-CO2 Brayton cycles. Energy Convers. Manag. 2020, 211, 112713. [Google Scholar] [CrossRef]
- Liu, M.; Yang, K.; Zhang, X.; Yan, J. Design and optimization of waste heat recovery system for supercritical carbon dioxide coal-fired power plant to enhance the dust collection efficiency. J. Clean. Prod. 2020, 275, 122523. [Google Scholar] [CrossRef]
- Allamab, R.; Martin, S.; Forrest, B.; Fetvedt, J.; Lu, X.; Freed, D.; Brown, G.W., Jr.; Sasaki, T.; Itoh, M.; Manning, J. Demonstration of the Allam cycle: An update on the development status of a high efficiency supercritical carbon dioxide power process employing full carbon capture. Energy Procedia 2017, 114, 5948–5966. [Google Scholar] [CrossRef]
- Fernandes, S.; Wang, Q.; Xu, B.R.; Chen, D. Process and carbon footprint analyses of the Allam cycle power plant integrated with an air separation unit. Clean Technol. 2019, 1, 325–340. [Google Scholar] [CrossRef] [Green Version]
- Fernandes, D.; Wang, S.; Xu, Q.; Chen, D. Dynamic Simulations of the Allam Cycle Power Plant Integrated with an Air Separation Unit. Int. J. Chem. Eng. 2019, 10, 6035856 . [Google Scholar] [CrossRef]
- Xiong, J.; Zhao, H.; Chen, H.; Zheng, C. Dynamic simulation of a conceptual 600 MWe oxy-fuel combustion power plant. In Proceedings of the 3rd Oxyfuel Combustion Conference, IEAGHG, Wuhan, China, 9–13 September 2013. [Google Scholar]
- Sarkar, J. Second law analysis of supercritical CO2 recompression Brayton cycle. Energy 2009, 34, 1172–1178. [Google Scholar] [CrossRef]
- Ahn, Y.; Bae, S.J.; Kim, M.; Cho, S.K.; Baik, S.; Lee, J.I.; Cha, J.E. Review of supercritical CO2 power cycle technology and current status of research and development. Nucl. Eng. Technol. 2015, 47, 647–661. [Google Scholar] [CrossRef] [Green Version]
- Persichilli, M.; Kacludis, A.; Zdankiewicz, E.; Held, T. Supercritical CO2 Power Cycle Developments and Commercialization: Why sCO2 can Displace Steam Ste. Power-Gen India Cent. Asia 2012, 2012, 19–21. [Google Scholar]
- Ma, Y.; Liu, M.; Yan, J.; Liu, J. Thermodynamic study of main compression intercooling effects on supercritical CO2 recompression Brayton cycle. Energy 2017, 140, 746–756. [Google Scholar] [CrossRef]
- Hu, H.; Guo, C.; Cai, H.; Jiang, Y.; Liang, S.; Guo, Y. Dynamic characteristics of the recuperator thermal performance in a S–CO2 Brayton cycle. Energy 2021, 214, 119017. [Google Scholar] [CrossRef]
- Ma, T.; Li, M.; Xu, J.; Cao, F. Thermodynamic analysis and performance prediction on dynamic response characteristic of PCHE in 1000 MW S-CO2 coal fired power plant. Energy 2019, 175, 123–138. [Google Scholar] [CrossRef]
- Cho, S.K.; Lee, J.; Lee, J.I. Off design performance map similarity study of radial type turbomachinery in supercritical co brayton cycle. In Proceedings of the Asme-jsme-ksme Joint Fluids Engineering Conference, Seoul, Korea, 26–31 July 2015. [Google Scholar]
- Lee, J.; Ahn, Y.; Jung, H.Y. Off design performance of compressors of 150MWe S-CO2 Cycle for Sodium Cooled Fast Reactor. In Proceedings of the Transactions of the Korean Nuclear Society Spring Meeting, Jeju, Korea, 29–30 May 2014. [Google Scholar]
- Dyreby, J.J. Modeling the Supercritical Carbon Dioxide Brayton Cycle with Recompression; ProQuest Dissertations Publishing: Morrisville, NC, USA, 2014. [Google Scholar]
- Zhu, Y. Research on Dynamic Characteristics of Supercritical Carbon Dioxide Brayton Cycle System. Master’s Thesis, North China Electric Power University, Beijing, China, 2018. [Google Scholar]
- Luu, M.T.; Milani, D.; McNaughton, R.; Abbas, A. Dynamic modelling and start-up operation of a solar-assisted recompression supercritical CO2 Brayton power cycle. Appl. Energy 2017, 199, 247–263. [Google Scholar] [CrossRef]
- Liese, E.; Albright, J.; Zitney, S.A. Startup, shutdown, and load-following simulations of a 10 MWe supercritical CO2 recompression closed Brayton cycle. Appl. Energy 2020, 277, 115628. [Google Scholar] [CrossRef]
- Olumayegun, O.; Wang, M. Dynamic modelling and control of supercritical CO2 power cycle using waste heat from industrial processes. Fuel 2019, 249, 89–102. [Google Scholar] [CrossRef]
- Jia, S. Characteristic Simulation and Control of Supercritical Carbon Dioxide Cycle Power Generation System. Master’s Thesis, Harbin Institute of Technology, Harbin, China, 2018. [Google Scholar]
- Du, X.; Hu, J.; Xia, G. Operation characteristic of supercritical carbon dioxide-cooled reactor system under coordination control scheme. Int. J. Adv. Robot. Syst. 2020, 17, 172988142093383. [Google Scholar] [CrossRef]


| Input Parameters | Values |
|---|---|
| Rotating speed of MC\% Design rotating speed | 100 |
| Rotating speed of RC\% Design rotating speed | 100 |
| Spilit ratio | 0.3853 |
| Cooling water temperature\K | 304.4 |
| Cooling water mass flow rate\kg/s | 1400 |
| Cooling water pressure\MPa | 0.101 |
| Heater duty\MW | 64.3 |
Publisher’s Note: MDPI stays neutral with regard to jurisdictional claims in published maps and institutional affiliations. |
© 2021 by the authors. Licensee MDPI, Basel, Switzerland. This article is an open access article distributed under the terms and conditions of the Creative Commons Attribution (CC BY) license (https://creativecommons.org/licenses/by/4.0/).
Share and Cite
Dai, C.; Song, P.; Ma, C.; Zhang, K.; Zheng, W.; Chen, L.; Guo, X.; Lin, Y.; Qiu, Z. Research on Response Characteristics and Control Strategy of the Supercritical Carbon Dioxide Power Cycle. Processes 2021, 9, 1943. https://doi.org/10.3390/pr9111943
Dai C, Song P, Ma C, Zhang K, Zheng W, Chen L, Guo X, Lin Y, Qiu Z. Research on Response Characteristics and Control Strategy of the Supercritical Carbon Dioxide Power Cycle. Processes. 2021; 9(11):1943. https://doi.org/10.3390/pr9111943
Chicago/Turabian StyleDai, Chunhui, Ping Song, Can Ma, Kelong Zhang, Wei Zheng, Lie Chen, Xiaojie Guo, Yuansheng Lin, and Zhiqiang Qiu. 2021. "Research on Response Characteristics and Control Strategy of the Supercritical Carbon Dioxide Power Cycle" Processes 9, no. 11: 1943. https://doi.org/10.3390/pr9111943
APA StyleDai, C., Song, P., Ma, C., Zhang, K., Zheng, W., Chen, L., Guo, X., Lin, Y., & Qiu, Z. (2021). Research on Response Characteristics and Control Strategy of the Supercritical Carbon Dioxide Power Cycle. Processes, 9(11), 1943. https://doi.org/10.3390/pr9111943