Article

Industrial Internet of Things and Fog Computing to Reduce Energy Consumption in Drinking Water Facilities

1
Department of Automation and Applied Informatics, Faculty of Automation and Computers, University Politehnica Timisoara, 300223 Timisoara, Romania
2
Department of Automation, Faculty of Automation and Computers Science, Technical University of Cluj-Napoca, 400027 Cluj-Napoca, Romania
*
Author to whom correspondence should be addressed.
Processes 2020, 8(3), 282; https://doi.org/10.3390/pr8030282
Submission received: 18 February 2020 / Revised: 26 February 2020 / Accepted: 27 February 2020 / Published: 2 March 2020

Abstract

:
The industry is generally preoccupied with the evolution towards Industry 4.0 principles and the associated advantages as cost reduction, respectively safety, availability, and productivity increase. So far, it is not completely clear how to reach these advantages and what their exact representation or impact is. It is necessary for industrial systems, even legacy ones, to assure interoperability in the context of chronologically dispersed and currently functional solutions, respectively; the Open Platform Communications Unified Architecture (OPC UA) protocol is an essential requirement. Then, following data accumulation, the resulting process-aware strategies have to present learning capabilities, pattern identification, and conclusions to increase efficiency or safety. Finally, model-based analysis and decision and control procedures applied in a non-invasive manner over functioning systems close the optimizing loop. Drinking water facilities, as generally the entire water sector, are confronted with several issues in their functioning, with a high variety of implemented technologies. The solution to these problems is expected to create a more extensive connection between the physical and the digital worlds. Following previous research focused on data accumulation and data dependency analysis, the current paper aims to provide the next step in obtaining a proactive historian application and proposes a non-invasive decision and control solution in the context of the Industrial Internet of Things, meant to reduce energy consumption in a water treatment and distribution process. The solution is conceived for the fog computing concept to be close to local automation, and it is automatically adaptable to changes in the process’s main characteristics caused by various factors. The developments were applied to a water facility model realized for this purpose and on a real system. The results prove the efficiency of the concept.

1. Introduction

One of the main focuses of the industry today is represented by the transition towards the Industry 4.0 paradigm, which is stimulated by the associated advantages that this new concept promises to deliver: productivity increase, cost reduction, increased availability, and safety.
The term of Industry 4.0 [1,2] is relatively recent, being intensely promoted by [3] and backed up by the German Government. This concept is also closely related to the Industrial Internet of Things (IIoT), both paradigms emphasizing the importance of information exchange and communication in industrial environments [4,5].
The classical automation pyramid is transforming under the Industry 4.0 guidance into a different structure that facilitates direct connection and communication between entities [6,7,8].
The current functional solutions from the industrial environment consist of a large variety of dispersed systems, both chronologically and by location, leading to the necessity of ensuring the interoperability of those solutions.
Although the heterogeneity of devices used in industry naturally supported the appearance of many communication protocols (see [9,10,11]), the Open Platform Communications Unified Architecture (OPC UA) was gradually imposed as the standard IIoT protocol.
The studies from [12,13,14] analyze the current OPC UA implementations regarding Industry 4.0 specific digitalization solutions, while [15,16,17,18] have successfully used OPC UA for increasing both interoperability and connectivity of different automation systems, thus emphasizing that OPC UA is an essential requirement for any Industry 4.0 compliant technical system.
The superior connectivity and interoperability between entities from technical systems under the Industry 4.0 guidance have led to the appearance of the data accumulation concept, which is primarily implemented in industry using historian applications [19,20].
The data gathered by historian applications is mostly unused, although it opens new possibilities in the proactive historian applications area. Research towards stored data analysis algorithms and optimization strategies must provide insights into pattern identification, learning capabilities, and solid conclusions regarding real-world optimizations. In order to develop a completely autonomous optimizing loop, both model-based analysis as well as decision and control procedures must be applied to the technical systems, but in a non-invasive manner. The large amount of gathered data is not able to create any added value without the usage of data analytics, the study from [21] bringing more insight into this aspect. Although, as in [22,23,24], ideas are emerging about the benefits of the next phase offered by the data analysis, no clear, detailed, and complete perspective is yet available. A more significant study is performed in [25], where data-driven analysis is approached for the somehow latent alarms and events data in the IIoT context to gain valuable information regarding processes.
The fog computing concept is starting to become more significant to the industry under the Industry 4.0 context, thus providing solutions that are closer to the local automation. The study from [26] compares a middleware platform, which supports the rapid development of IoT-based solutions in both fog and cloud configurations, by analyzing its performance in water irrigation scenarios. Fog computing is proposed also in [27,28] compared to a cloud perspective. The fog computing would also be successfully applied to decision and control solutions associated with hybrid wind farms [29] The cloud perspective would be useful in situations where large scale distributed processes would be analyzed from a less granular view when trying to adjust/optimize the integrated process (e.g., a key supplier and multiple downstream manufacturers, as in [30]).
Because many drinking water facilities are starting to adapt to the Industry 4.0, and therefore the physical and digital worlds become more connected, several issues appear, such as high energy consumption, maintenance, water sources quality changes [31], water pump failures [32], or high consumption of substances (chlorine cost issues and other problems, as in [33]).
In [34], the authors studied the energy requirements and carbon footprint for tourist swimming pool water, obtained from desalination plants. Although the study proposes an algorithm that identifies the characteristic function which defines both the water and energy consumptions (stored data analysis), the paper does not highlight any optimizing steps or procedures. Towards this system functioning improvements, the study from [35] proposes a methodology for both control and optimization of water loss in the water supply system by using real-time monitoring and industrial Supervisory Control and Data Acquisition (SCADA) systems. In the same direction, the authors from [36] analyzed the groundwater resources used for irrigation and identified a non-linear multi-year optimal distribution model of groundwater, which is capitalized for obtaining a sustainable utilization of groundwater in irrigation. The water demand pattern is analyzed in terms of impact over the calibration process in [37]. The authors of [38] presented the optimization of water treatment regarding the water turbidity levels by using a natural coagulant, while the monitoring of water quality is analyzed in [39] from both data collection and data analysis perspectives.
Regarding the wastewater treatment, Sandu et al. present a numerical study in [40] that creates new water paths by introducing wall structures and thus ensuring that low velocity flows of water (which facilitates the appearance of a sedimentation process that disturbs the normal water treatment process) cannot form. Also, in the wastewater treatment domain, the study from [41] presented predictive control schemes and tackled the wastewater treatment stability and efficiency improvement problems, while paper [42] details an optimizing strategy regarding wastewater network and treatment plant implemented non-invasively using IIoT concepts over legacy systems.
Considering the upper mentioned ideas, the current paper proposes a fog computing decision and control solution (FDC) that reduces the energy consumption in a water treatment and distribution process using IIoT driven concepts such as interoperability and non-invasive augmentation of local control systems following recipe identification after long-term data dependency analysis.
The next chapter, in the first section, describes a drinking water facility, the main existing control structures for water request and distribution, respectively, process and cost issues. The second section of Section 2 focuses on describing the solution to increase energy efficiency in the treatment process, also considering the interface of the existing functional systems. Section 3 presents the obtained results in the context of two long-term scenarios. Both scenarios required long-term data accumulation, analysis and concluding phases, finalized by strictly supervised tests on a real plant. The first scenario uses the complete researched strategy and applies it through supervised short-term efficiency testing. The second scenario depicts a longer-term, two-week continuous testing on the real system, but with constraints imposed by the facility operators, causing the researched strategy to function without all the implemented modules. The last chapter presents a concluding discussion.

2. Materials and Methods

2.1. Description of Drinking Water Facilities

The typical newer drinking water facility (DWF) is presented in Figure 1 (a functional real process) and consists of water sources, water treatment plant (WTP), and water distribution facility (WDF). Figure 1 expresses water wells (WW) as sources, each of them having two main local control loops in the automatic regime that guide the water pumping. The main local control loop is flow-based and the second one (used only as redundant structure) is level-based. The setpoints have fix values, set by the operators. The presented DWF contains 6 WWs, but only 4 of them presented in Figure 1 were encountered functioning in automatic regime during the first period of analysis.
The water from the WWs flows into the WTP where it is treated according to the process presented in Figure 2. The phases of the water treatment are aeration (aeration tank), filtering with sand and charcoal (the exemplified plant contains 4 sand filters and 2 charcoal filters for a population of around 8000 inhabitants), disinfection (chlorine station with residual chlorine measuring and injection points) and sludge treatment. The sand filters are reducing turbidity. The aeration and the charcoal filtering are essential to obtain the desired PH and conductivity levels of the treated water. Therefore, to maintain water acidity/alkalinity (PH) and conductivity levels inside legal limits requires energy and chlorine consumptions (e.g., aeration blowers, maintenance of charcoal filters, chlorine station). The filters are cleaned frequently using air or water because high turbidity may lead to clogging. Therefore, high energy consumption and water losses are caused by filter cleaning. Regarding the chlorine station, the basic, most-common water flow-based chlorine control strategy is augmented with a supplementary closed-loop control having the residual chlorine on the feedback. This requires continuous water flow from the WWs to the WTP because the second chlorine control loop requires around 30 minutes to be efficient.
The treated water after the filters is taken over by the WDF (see Figure 1). Generally, a WDF contains a pumping station (PS3), electrical valves, and reservoirs. PS3 in the current research contains three pumps with frequency converters (FC). The usual main type of implemented control algorithms to distribute and request water are
  • a pressure-based control loop for water distribution and functioning hours based pumps rotation;
  • a primary level-based control loop that keeps the level in the reservoirs inside hysteresis limits. If the level in the reservoirs decreases, water is requested from the WWs. The level in the reservoirs cannot always be kept inside two hysteresis limits because of perturbing water consumption variation in the distribution network, respectively, water reserve issues may occur, and, consequently, higher energy consumption and water treatment process disturbances.
  • a secondary flow-based control loop that is used for anticipating high water demands in the distribution network at critical hours. Considering Figure 1, values of Flowmeters 4 and 1 are compared and if the difference exceeds a threshold then water is requested from WWs. The secondary flow-based control loop is much faster than the first. Both water requesting control loops are selecting WWs considering functioning hours, and both should consider water and time losses inside the WTP.
During nighttime, the water demand is lower and therefore the water sources may be automatically stopped by the level control algorithm. However, most water distribution networks present water losses. In this context, especially dictated by the higher flow-based control loop and the fixed WW local fix flow setpoint, the water sources may start and stop multiple times during the night, causing pump and water source to wear out. Other important outcome of the WWs multiple starts/stops would lead to water treatment process disturbance due to the entire WTP activation for short periods of time that would not be enough to enter in normal parameters (e.g., chlorine reaction, aeration, filtering).
WWs have different characteristics (flow capacity, water quality). Water quality indicators are changing in time. The authors have analyzed in detail more than 50 DWFs over the years and the WWs water quality indicators were not considered by any of the implemented automation solutions. By monitoring parameters inside the DWF (e.g., residual chlorine, blowers functioning hours, filters washing cycles, WWs states, flows, and functioning hours), WW quality indicators may be identified and afterwards adapted. Therefore, with proper WWs quality indicators and variable flow setpoint distribution, the energy and substances consumption can be reduced. Also, another cost variable must be considered, equipment functioning hours and the number of starts, because maintenance/ replacement is expensive.
Regarding the encountered SCADA architectures, the WWs are equipped with programmable logic controllers (PLC), functioning either in direct connection with the SCADA control room from the WTP, or integrated into the PLC from the WDF. Some encountered solutions when WWs are integrated directly in the WTP SCADA system are not requesting water from the WWs, considering WDF reservoir levels and flow information. In this situation, either WWs are activated by aeration tank level or simply by local pressure increase due to a WTP inlet valve closing. These older technologies are not emphasized by the current FDC solution, but the energy consumption reduction rate would be significantly higher as the legacy system lacks more evolved control strategies.
Newer WTP automation solutions are implemented around redundant PLCs. Usually, the WDF PLC is integrated into the WTP SCADA system, which is centering mostly redundant servers. The electrical parameters are monitored in real-time. Figure 3 depicts an example of the main values, as energy, power, current, voltage for both power lines (usually redundant). The energies taken over from the WTP automation (MCC), the WDF (PS3), the internal services panel, and the total WTP+WDF consumption are of main importance in the concept of the current solution.
A DWF is a critical infrastructure and any research is carefully monitored. Detailed motivation, strategy, proofs, and approvals are necessary to implement research procedures. Therefore, any intervention towards the legacy structures must be as non-invasive as possible. Even for newer WTP automation, constraints may be applied by the infrastructure owners for the newly researched strategies that sometimes have to be tested without their full capacity. In this sense, Section 3 presents, in the last part, relevant results after long-term experiments with a real DWF, when several constraints regarding the control strategy are imposed by the plant operators as caution measures. These results are compared with current operational strategy.

2.2. Increasing Energy Efficiency

To increase cost efficiency in DWF means to reduce consumption of energy and substances, and to increase productivity and availability. Following long-term data analysis and dependencies considering thousands of tags from the process, the best recipe must be concluded regarding a cost objective. The found recipe has to be tested on process models and, after that, it has to be non-invasively implemented in practice in the fog of the real systems.
The conceived FDC solution have to interface the local systems, to vehiculate data, and to non-invasively react over the process automation by applying the best-encountered recipe. The available interfacing option with local SCADA from the WTPs is usually OPC UA and sometimes older OPC Classic. If WDF and WWs are totally integrated into WTPs SCADA, then the main communication with the local structures will be made through the redundant SCADA servers. However, FDC is also prepared for local PLC interoperation, meaning most times legacy protocol availability. When redundant SCADA is present, the direct PLC communication lines are implemented as backup structures and used only when the SCADA servers are in maintenance or the OPC UA communication is not functioning (mainly problems with the OPC UA server on the SCADA side).
For a significant connection with the industry, high technological readiness level, and the fog computing abilities, the hardware and software environments used for FDC were the same as in [42]. Figure 4 details the fog-based FDC solution in direct relation with the local water infrastructure on various protocols. Also, the configured OPC UA server of the FDC solution allows integration in the regional/central SCADA control center. Besides the WTP SCADA, the OPC UA may be present at the PLC level directly or using OPC UA based wrappers/gateways as developments in [43,44].
Following data gathering and dependency analysis from [19] and [45], quality indicators are identified for the WWs. These quality indicators are considered in the current paper in relation to the total energy consumption used for treating and distributing the water. After associating quality indicators for the sources, the solution has to establish priorities and flow setpoint references for each WW. Considering the control strategies described in Section 2.1, the currently proposed strategy to increase energy efficiency is considered complete when the reaction over the analyzed local system is realized both based on WW priority indicators and on WW flow setpoints.
After analyzing the local process, a priority is established for each WW. The priority will provide sorting based on provided water quality and functioning hours, and it will influence the flow setpoint that will be transmitted to the local flow-based control loop of the well. Therefore, variable flow setpoints can replace the existing fix values.
The WWs starting order and functioning frequencies will be sorted descending, from the highest to the lowest priority in the group. The priority (Pf) of a WW will be
P f   =   α · P H f   +   β ·   P Q f
where
  • PHf is the priority indicator considering WW functioning hours; P H f [ 0 10 ] ;
  • PQf is the priority indicator considering WW water quality indicator; P Q f [ 0 10 ] ;
  • α is the weighting factor of PHf; α [ 0 1 β ] ;
  • β is the weighting factor of PQf; β [ 0 1 α ] ;
  • The following equality is valid α + β = 1 ;
  • P f     [ 0 10 ] .
The priority indicator PHf is normalized in domain 0…10:
P H f = 10 h f · 10 m a x ( h 1 , , h n )
where hf indicates the functioning hours of the WW, and n is the number of the WWs.
E.g., for 6 WWs with h = [2 7 9 8 3 5], max ( h ) = 9 and therefore PF = [7.78 2.23 0 1.12 6.67 3.34].
The priority indicator PQf is normalized in domain 0…10:
P Q f = q f · 10 m a x ( q 1 , , q n )
where qf indicates the quality indicator of the WW.
The flow setpoint control for a WW will be calculated as
F w f = F f m i n + γ · ( F f m a x F f m i n ) · P Q f 10
where:
  • FW_f indicates the flow setpoint of the WW.
  • Ff_min indicates WW minimum flow.
  • Ff_max indicates WW maximum flow.
  • γ indicates a weighting factor that has to be experimentally determined.
The FW_f value for a WW will be determined always considering the minimum flow added with the weighting factor that considers the WW water quality. If PQf = 10 then for γ = 0, FW_f = Ff_min, and for γ = 1, FW_f = Ff_max. Using γ, the influence of the water quality indicator over PQf =10, the flow setpoint, can be controlled. If γ = 1 and for example PQf = 6, Ff_min = 10 mc/h, Ff_max = 30 mc/h, the maximum flow setpoint is FW_f = 22 mc/h, according to (4).
The decision and control algorithm distinguishes a scenario when the level in the reservoirs is under the minimal hysteresis limit. The total flow requested from the WWs (Ft_r) is increased (but being limited by the WTP water treatment capacity) until the level in the reservoirs reaches the higher hysteresis limit. Tint from (5) is determined through simulations as 100 s.
F t _ r = W D F _ o u t p u t _ f l o w · 1 T i n t · s
The level data is affected by noise, influencing the behavior of the control structure. Therefore, a low-pass filter is implemented with a filtering constant of 100 s:
H l e v e l _ d a t a _ f i l t e r ( s ) = 1 100 s + 1
According to the quality indicator of the wells, the logic of the flow setpoint requests is briefly depicted as follows:
  • If the calculated FW_f for the highest priority WW covers Ft_r, then other WWs will have flow setpoint set to zero.
  • If the sum of the calculated flows for the highest priority WWs is smaller than Ft_r, then a next WW will be activated and set to minimal reference flow and previous one will adapt its setpoint value. All other setpoints are zero. The flow distribution algorithm is extendable if Ft_r increases dramatically in time, exceeding the optimal capacity of the WWs, with a first raise of γ and then with a raise of β.
To avoid sudden multiple flow setpoint changes for the WWs that may be caused by noise in the WDF output flow signal evolution, a lowpass filter from was considered for all referenced flow signals.

3. Results

The FDC solution was tested on a DWF developed and calibrated model using input real data and on a real system. Applying new research directly on a functional critical infrastructure such as a WTP is not possible, even testing the current experimental model was a long-term procedure. The chapter presents two scenarios.
The first scenario presents the obtained results using the complete FDC solution. After the first long-term data accumulation, analysis, and concluding phases, the scenario consists of model-based and short-term real system tests to prove the energy efficiency increase, under strict operator supervision. The real system complete tests in the first scenario were only short term.
After finalizing the first type of scenario, in order to better prove the impact of the solution on a real system and to reach higher TRL, the solution had to be tested on a longer-term and reacting (applying the conclusions) autonomously over the local system. The second scenario depicts a longer-term, two-week continuous testing on the real system, but with several constraints imposed by the facility operators. The most impacting imposed constraints were that the prescribed flow setpoints for WWs must not be changed from their fixed individual values, respectively; no additional WWs should be activated besides those selected. Particularly for the presented scenario, the selected WWs were also 4 from the 6 available, but WW4 was replaced with WW1. Therefore, the FDC solution was tested on the plant in the second scenario without all the implemented modules (without the WW variable individual flow setpoint and the activation of all available wells). The supplementary data analysis with the proactive historian, when transiting towards longer-term tests, lasted around 1 more year.
The scenarios are focusing on the DWF from Figure 1, having the WTP process from Figure 2. The local PLCs from the WDF and WWs are interfaced using an S7 protocol. The WTP is automated using two redundant S7-400 H PLCs, and the SCADA is WinCC 7.2 with Connectivity Pack on two redundant servers and two clients, integrating the entire DWF. Therefore Figure 4 is reduced for the current scenario to Figure 5, where OPC UA is the main interface to vehiculate data, and the S7 protocol is used for backup.
In the first scenario, the entire FDC solution will non-invasively augment the DWF local system, and short-term efficiency tests will be realized on the real plant. Initially, Figure 6 presents the evolution of the flows from the four WWs in the context of the fixed flow setpoint operation, without FDC. This way, the water demand will activate WWs without taking into consideration the quality and the quantity from the sources.
The first scenario that is presented using Figure 7, Figure 8, Figure 9 and Figure 10 applies priority setting results (Figure 8) for the four WWs considering functioning hours (Figure 7) and water quality indicators. The determined values for α are [0.8, 0.6, 0.7, 0.9], and for β, [0.2, 0.4, 0.3, 0.1]. The γ factor was set to 1 for all wells because of the high demand of water (WW1 and WW6 were not activated).
The evolutions of Ft_r, respectively, the level in the distribution reservoir, and FW_f, after applying the FDC solution, are presented in Figure 9.
The FDC solution impacts on reducing energy consumption is consistent. Concluding from Figure 10 (percentage power differences between the system with and without FDC), the resulting improvement is about 9%.
The second scenario follows another consistent period of data accumulation, analysis, and testing, to assure longer-term efficiency tests on the real system. As said before, overcoming procedural issues and the imposed constraints on FDC functioning, the solution was tested in autonomous functioning on the real plant for a two-week periods.
Also, during the additional consistent data accumulation and analysis, changes in the local system functioning were encountered and assimilated. The most important was the manual WWs activation/deactivation procedures over time, caused mainly by local operator’s preferences, but also by shorter-term faults on the well’s equipment. As noticed in the last 1.5 years of experiments, the local operators are manually activating/deactivating WWs every 4–7 months (usually selecting 4–5 active wells), which are entered into the local algorithm. Particularly, the presented second scenario uses also four selected WWs from the six available, but WW4 is replaced with WW1. The authors conclude that when a new water source is added to the system, the proactive historian requires at least four months of consistent data analysis to include the new structure correctly in the decision and control algorithm.
The second scenario details the functioning of the real system, augmented with the constrained FDC solution (restricted to fixed flow setpoints at the four mentioned WWs), over a two-week period between 23 November 2019 to 7 December 2019. In this period, Figure 11 and Figure 12 are illustrating the evolution of the flows for the 4 WWs (WW 1, 2, 3, 7), respectively, the total consumed energy.
Figure 13, Figure 14, Figure 15 and Figure 16 present the evolution of the flows for the 4WWs and the total consumed energy over four weeks, between 11 January 2020 to 8 February 2020, without the FDC solution. For a correct comparison, the tests without FDC are realized in a period with the same water demand and consumption as in the first two weeks, not considering the winter holidays period.
Table 1 details the initial and the final values of the energy index for each week, the consumed energy for each week, the average energy consumption for the two, respectively, the four-week period, and finally the difference of energy consumption in percentages to prove the efficiency of the proposed solution.
In Table 1, the consumed energy average for the two weeks tests with FDC was 2.7 MWh, and for the four-week tests without FDC was 3.5 MWh. The study identifies and exposes, in Table 1, a consistent increase in energy consumption of around 30% when the system is not foreseen with the proposed solution.

4. Discussion

The paper presents a fog computing decision and control solution that reduces the energy consumption in water treatment and distribution, the energy efficiency being highly related to proper water sources allocation and usage. The study follows previous research steps in researching and developing a proactive historian which concluded in a fog-based data accumulation system (practically a low-cost and lightweight historian) and a data-dependency analysis solution that is able to establish valuable correlations in a process-aware manner. Process specific constraints, statuses, impact, degrees of freedom, and limitations are taken into consideration to filter dependencies and to provide the proper recipe and feedback for the functioning system.
The solution is applied non-invasively over the local control structures and uses interoperation. Therefore, its applicability is widespread in the water sector and generally in the manufacturing industry, where the local systems are of various types with a high percentage of legacy structures.
In the authors’ opinion, the correct and more complete answer to clarify specific outcomes, representations, and impact of IIoT and Industry 4.0 may come only after applicative research and detailed particularizing and long-term studies of local systems and processes. The current research provides an applicable recipe for drinking water facilities, and the obtained results are proving the efficiency of the concept.
Although the efficiency is considerably increased in the first scenario, the authors claim and prove within the second scenario that more than 9% can be obtained. Some of the reasons:
  • The reduced possibility to properly compare the results in the real system using short-term tests, because of yet-limited FDC applicability access on the DWF for longer periods determined the consideration of the lowest value of 9%.
  • The small number of WWs in the context of a high water demand implies longer functioning times for each well and therefore not many degrees of freedom (e.g., the degrees of freedom would increase if all 6 WWs from the real DWF would be in function);
  • The initial WDF–WWs automation solution in many DWFs is poorly implemented. The current comparison implies initial fixed flow setpoint for the WWs that were highly adjusted (e.g., the flow setpoints were set using the best knowledge of the operators and the initial system developer for the DWF);
The second scenario, implying longer-term two-week testing and autonomous functioning of the system augmented with the constrained proposed solution, proves a much more consistent impact. The system without the FDC proved an increase in energy consumption by 30% in the hypothesis that the FDC solution was constrained from using the individual variable flow setpoints algorithm for the water wells that would provide even higher efficiency, and of considering only 4 of the 6 available water sources.
The presented results demonstrate the efficiency of the concept.

Author Contributions

Conceptualization, A.K.; methodology, A.K., R.C.; software, A.K., R.C., A.N.; validation, A.K., R.C.; formal analysis, A.K., I.S.; investigation, A.K., R.C.; resources, A.K., I.S.; data curation, A.K., R.C.; writing—original draft preparation, A.K., A.N.; writing—review and editing, A.K.; visualization, A.K.; supervision, A.K.; project administration, A.K.; funding acquisition, A.K., I.S. All authors have read and agreed to the published version of the manuscript.

Funding

This research received no external funding.

Conflicts of Interest

The authors declare no conflict of interest.

Abbreviations

OPCOpen Platform Communications or Object Linking and Embedding (OLE) for Process Control
UAUnified Architecture
DAData Access
IIoTIndustrial Internet of Things
FDCFog computing decision and control solution
PLCProgrammable logic controller
SCADASupervisory control and data acquisition
DWFDrinking water facility
WTPWater treatment plant
WDFWater distribution facility
WWWater well
PSPumping station
FCFrequency converter

References

  1. Reference Architecture Model Industrie 4.0 (RAMI 4.0); DIN Std. DIN SPEC 91345; Beuth: Berlin, Germany, April 2016. [CrossRef]
  2. Industrie 4.0. Available online: http://www.plattform-i40.de (accessed on 3 November 2019).
  3. Pfeiffer, S. The Vision of Industrie 4.0 in the Making—A Case of Future Told, Tamed, and Traded. NanoEthics 2017, 11, 107–121. [Google Scholar] [CrossRef] [Green Version]
  4. Khan, W.A.; Wisniewski, L.; Lang, D.; Jasperneite, J. Analysis of the requirements for offering industrie 4.0 applications as a cloud service. In Proceedings of the 26th IEEE International Symposium on Industrial Electronics (ISIE), Edinburgh, UK, 19–21 June 2017. [Google Scholar]
  5. Beier, G.; Niehoff, S.; Xue, B. More Sustainability in Industry through Industrial Internet of Things? Appl. Sci. 2018, 8, 219. [Google Scholar] [CrossRef]
  6. Schriegel, S.; Kobzan, T.; Jasperneite, J. Investigation on a distributed SDN control plane architecture for heterogeneous time sensitive networks. In Proceedings of the 14th IEEE International Workshop on Factory Communication Systems (WFCS), Imperia, Italy, 13–15 June 2018. [Google Scholar]
  7. Gerrikagoitia, J.K.; Unamuno, G.; Urkia, E.; Serna, A. Digital Manufacturing Platforms in the Industry 4.0 from Private and Public Perspectives. Appl. Sci. 2019, 9, 2934. [Google Scholar] [CrossRef] [Green Version]
  8. Bányai, Á.; Illés, B.; Glistau, E.; Machado, N.I.; Tamás, P.; Manzoor, F.; Bányai, T. Smart Cyber-Physical Manufacturing: Extended and Real-Time Optimization of Logistics Resources in Matrix Production. Appl. Sci. 2019, 9, 1287. [Google Scholar] [CrossRef] [Green Version]
  9. Fysarakis, K.; Askoxylakis, I.; Soultatos, O.; Papaefstathiou, I.; Manifavas, C.; Katos, V. Which IoT protocol? Comparing Standardized Approaches over a Common M2M Application. In Proceedings of the IEEE Global Communications Conference (GLOBECOM), Washington, DC, USA, 4–8 December 2016. [Google Scholar]
  10. Jaloudi, S. Communication Protocols of an Industrial Internet of Things Environment: A Comparative Study. Future Internet 2019, 11, 66. [Google Scholar] [CrossRef] [Green Version]
  11. Gutierrez-Guerrero, J.M.; Holgado-Terriza, J.A. Automatic Configuration of OPC UA for Industrial Internet of Things Environments. Electronics 2019, 8, 600. [Google Scholar] [CrossRef] [Green Version]
  12. Haskamp, H.; Meyer, M.; Mollmann, R.; Orth, F.; Colombo, A. Benchmarking of existing OPC UA implementations for Industrie 4.0-compliant digitalization solutions. In Proceedings of the 15th IEEE International Conference on Industrial Informatics (INDIN), Emden, Germany, 24–26 July 2017; pp. 589–594. [Google Scholar]
  13. Gonzalez, I.; Calderon, A.J.; Figueiredo, J.; Sousa, J.M.C. A Literature Survey on Open Platform Communications (OPC) Applied to Advanced Industrial Environments. Electronics 2019, 8, 510. [Google Scholar] [CrossRef] [Green Version]
  14. Schiekofer, R.; Scholz, A.; Weyrich, M. REST based OPC UA for the IIoT. In Proceedings of the IEEE 23rd International Conference on Emerging Technologies and Factory Automation (ETFA), Torino, Italy, 4–7 September 2018; pp. 274–281. [Google Scholar]
  15. Moraes, E.; Lepikson, H.; Konstantinov, S. Improving connectivity for runtime simulation of automation systems via OPC UA. In Proceedings of the 13th IEEE International Conference on Industrial Informatics (INDIN), Cambridge, UK, 22–24 July 2015. [Google Scholar]
  16. Dai, W.; Vyatkin, V.; Christensen, J.H.; Dubinin, V.N. Bridging Service-Oriented Architecture and IEC 61499 for Flexibility and Interoperability. IEEE Trans. Ind. Inform. 2015, 11, 771–781. [Google Scholar] [CrossRef]
  17. Cavalieri, S.; Regalbuto, A. Integration of IEC 61850 SCL and OPC UA to improve interoperability in Smart Grid environment. Comput. Stand. Interfaces 2016, 47, 77–99. [Google Scholar] [CrossRef]
  18. Derhamy, H.; Ronnholm, J.; Delsing, J.; Eliasson, J.; van Deventer, J. Protocol interoperability of OPC UA in Service Oriented Architectures. In Proceedings of the 15th IEEE International Conference on Industrial Informatics (INDIN), Emden, Germany, 24–26 July 2017; pp. 44–50. [Google Scholar]
  19. Nicolae, A.; Korodi, A. Node-Red and OPC UA Based Lightweight and Low-Cost Historian with Application in the Water Industry. In Proceedings of the 16th Int. Conf. on Industrial Informatics (INDIN), Porto, Portugal, 18–20 July 2018; pp. 1012–1017. [Google Scholar]
  20. Mazur, D.C.; Entzminger, R.A.; Kay, J.A. Enhancing Traditional Process SCADA and Historians for Industrial and Commercial Power Systems with Energy (Via IEC 61850). IEEE Trans. Ind. Appl. 2016, 52, 76–82. [Google Scholar] [CrossRef]
  21. Wang, D. Building Value in a World of Technological Change: Data Analytics and Industry 4.0. IEEE Eng. Manag. Rev. 2018, 46, 32–33. [Google Scholar] [CrossRef]
  22. Savastano, M.; Amendola, C.; Bellini, F.; D’Ascenzo, F. Contextual Impacts on Industrial Processes Brought by the Digital Transformation of Manufacturing: A Systematic Review. Sustainability 2019, 11, 891. [Google Scholar] [CrossRef] [Green Version]
  23. Maskuriy, R.; Selamat, A.; Ali, K.N.; Maresova, P.; Krejcar, O. Industry 4.0 for the Construction Industry—How Ready Is the Industry? Appl. Sci. 2019, 9, 2819. [Google Scholar] [CrossRef] [Green Version]
  24. Johansson, N.; Roth, E.; Reim, W. Smart and Sustainable eMaintenance: Capabilities for Digitalization of Maintenance. Sustainability 2019, 11, 3553. [Google Scholar] [CrossRef] [Green Version]
  25. Bezerra, A.; Silva, I.; Guedes, L.A.; Silva, D.; Leitão, G.; Saito, K. Extracting Value from Industrial Alarms and Events: A Data-Driven Approach Based on Exploratory Data Analysis. Sensors 2019, 19, 2772. [Google Scholar] [CrossRef] [Green Version]
  26. Zyrianoff, I.; Heideker, A.; Silva, D.; Kamienski, C. Scalability of an Internet of Things Platform for Smart Water Management for Agriculture. In Proceedings of the 23rd Conference of Open Innovations Association (FRUCT), Bologna, Italy, 13–16 November 2018. [Google Scholar]
  27. Ma, K.; Bagula, A.; Nyirenda, C.; Ajayi, O. An IoT-Based Fog Computing Model. Sensors 2019, 19, 2783. [Google Scholar] [CrossRef] [Green Version]
  28. Chekired, D.A.; Khoukhi, L.; Mouftah, H.T. Industrial IoT Data Scheduling Based on Hierarchical Fog Computing: A Key for Enabling Smart Factory. IEEE Trans. Ind. Inform. 2018, 14, 4590–4602. [Google Scholar] [CrossRef]
  29. Dhiman, H.; Deb, D. Studies in Systems, Decision and Control. In Decision and Control in Hybrid Wind Farms; Springer Nature: London, UK, 2020; ISBN 978-981-15-0274-3. [Google Scholar]
  30. Lee, H. Effective Dynamic Control Strategy of a Key Supplier with Multiple Downstream Manufacturers Using Industrial Internet of Things and Cloud System. Processes 2019, 7, 172. [Google Scholar] [CrossRef] [Green Version]
  31. Mohammed, H.; Longva, A.; Seidu, R. Impact of Climate Forecasts on the Microbial Quality of a Drinking Water Source in Norway Using Hydrodynamic Modeling. Water J. 2019, 11, 527. [Google Scholar] [CrossRef] [Green Version]
  32. Patel, R.; Gojiya, A.; Deb, D. Failure Reconfiguration of Pumps in Two Reservoirs Connected to Overhead Tank. In Innovations in Infrastructure. Advances in Intelligent Systems and Computing; Deb, D., Balas, V., Dey, R., Eds.; Springer: Singapore, 2019; Volume 757. [Google Scholar]
  33. Fischer, J.; Freudenthaler, P.J.; Lang, R.W.; Buchberger, W.; Mantell, S.C. Chlorinated Water Induced Aging of Pipe Grade Polypropylene Random Copolymers. Polymers 2019, 11, 996. [Google Scholar] [CrossRef] [Green Version]
  34. Pérez, F.J.; Otín, M.R.; Mouhaffel, A.G.; Martín, R.D.; Chinarro, D. Energy and Water Consumption and Carbon Footprint in Tourist Pools Supplied by Desalination Plants: Case Study, the Canary Islands. IEEE Access 2018, 6, 11727–11737. [Google Scholar] [CrossRef]
  35. Babunski, D.; Zaev, E.; Tuneski, A.; Bozovic, D. Optimization methods for water supply SCADA system. In Proceedings of the 7th Mediterranean Conference on Embedded Computing, Budva, Montenegro, 10–14 June 2018. [Google Scholar]
  36. Huang, Q.; Du, Z.; Lu, N.; Yu, X. Application of non-linear optimization model of groundwater in well irrigation district of northern China. In Proceedings of the International Symposium on Water Resource and Environmental Protection, Xi’an, China, 20–22 May 2011. [Google Scholar]
  37. Bartkiewicz, E.; Zimoch, I. Impact of Water Demand Pattern on Calibration Process. Proceedings 2018, 2, 191. [Google Scholar] [CrossRef] [Green Version]
  38. Ali, E.N.; Muyibi, S.A.; Alam, M.Z.; Salleh, H.M. Optimization of water treatment parameters using processed Moringa oleifera as a natural coagulant for low turbidity water. In Proceedings of the International Conference on Statistics in Science, Business and Engineering, Langkawi, Malaysia, 10–12 September 2012. [Google Scholar]
  39. Whitfield, P. Monitoring water quality through data collection and analysis. In Proceedings of the GEOSS Workshop XLI, Vancouver, BC, Canada, 24 July 2011. [Google Scholar]
  40. Sandu, M.; Bode, F.; Danca, P.; Voicu, I. Water flow structure optimization between the screenings and grit removals in a wastewater plant. In Proceedings of the International Conference on Energy and Environment (CIEM), Bucharest, Romania, 19–20 October 2017. [Google Scholar]
  41. Black, K.; Mazier, S. Optimisation of stability and efficiency of wastewater treatment. In Proceedings of the IET Water Event 2013: Process Control and Automation, Nottingham, UK, 21–22 May 2013. [Google Scholar]
  42. Korodi, A.; Radu, M.A.; Crisan, R. Non-Invasive Control Solution inside Higher-Level OPC UA based Wrapper for Optimizing Groups of Wastewater Systems. In Proceedings of the IEEE 23rd International Conference on Emerging Technologies and Factory Automation (ETFA), Torino, Italy, 4–7 September 2018; pp. 597–604. [Google Scholar]
  43. Korodi, A.; Silea, I. Achieving Interoperability Using Low-Cost Middleware OPC UA Wrapping Structure. Case Study in the Water Industry. In Proceedings of the 15th IEEE International Conference on Industrial Informatics (INDIN), Emden, Germany, 24–26 July 2017; pp. 1223–1228. [Google Scholar]
  44. Toc, S.I.; Korodi, A. Modbus-OPC UA Wrapper using Node-RED and IoT-2040 with application in the water industry. In Proceedings of the 16th IEEE International Symposium on Intelligent Systems and Informatics (SISY), Subotica, Serbia, 13–15 September 2018. [Google Scholar]
  45. Nicolae, A.; Korodi, A.; Silea, I. Identifying Data Dependencies as First Step to Obtain a Proactive Historian. Test Scenario in the Water Industry. Water 2019, 11, 1144. [Google Scholar] [CrossRef] [Green Version]
Figure 1. A drinking water facility (DWF).
Processes 08 00282 g001
Figure 2. A water treatment plant (WTP).
Processes 08 00282 g002
Figure 3. Main electrical parameters monitoring of the WTP and water distribution facility (WDF).
Processes 08 00282 g003
Figure 4. The fog computing decision and control solution (FDC) solution interfacing with the DWF and the regional/central SCADA control centre (WW—water well; WDF—water distribution facility; WTP—water treatment plant).
Processes 08 00282 g004
Figure 5. FDC solution integration in the tested scenario.
Processes 08 00282 g005
Figure 6. Example of flow evolution from the water wells with fixed setpoints.
Processes 08 00282 g006
Figure 7. Water wells functioning hours in the test scenario.
Processes 08 00282 g007
Figure 8. Water wells priority indicators in the test scenario.
Processes 08 00282 g008
Figure 9. The evolution of: the total flow requested from the water wells (Ft_r), the level in the distribution tank, and the flow setpoint for each water well (Fw_f), resulting after FDC.
Processes 08 00282 g009
Figure 10. Percentage power difference after using FDC.
Processes 08 00282 g010
Figure 11. Results with constrained FDC. Well flows (mc/h) and energy consumption (kWh) in Week 1 of tests.
Processes 08 00282 g011
Figure 12. Results with constrained FDC. Well flows (mc/h) and energy consumption (kWh) in Week 2 of tests.
Processes 08 00282 g012
Figure 13. Results without FDC. Well flows (mc/h) and energy consumption (kWh) in Week 1 of tests.
Processes 08 00282 g013
Figure 14. Results without FDC. Well flows (mc/h) and energy consumption (kWh) in Week 2 of tests.
Processes 08 00282 g014
Figure 15. Results without FDC. Well flows (mc/h) and energy consumption (kWh) in Week 3 of tests.
Processes 08 00282 g015
Figure 16. Results without FDC. Well flows (mc/h) and energy consumption (kWh) in Week 4 of tests.
Processes 08 00282 g016
Table 1. Total energy consumption (MWh) of the drinking water facility (DWF).
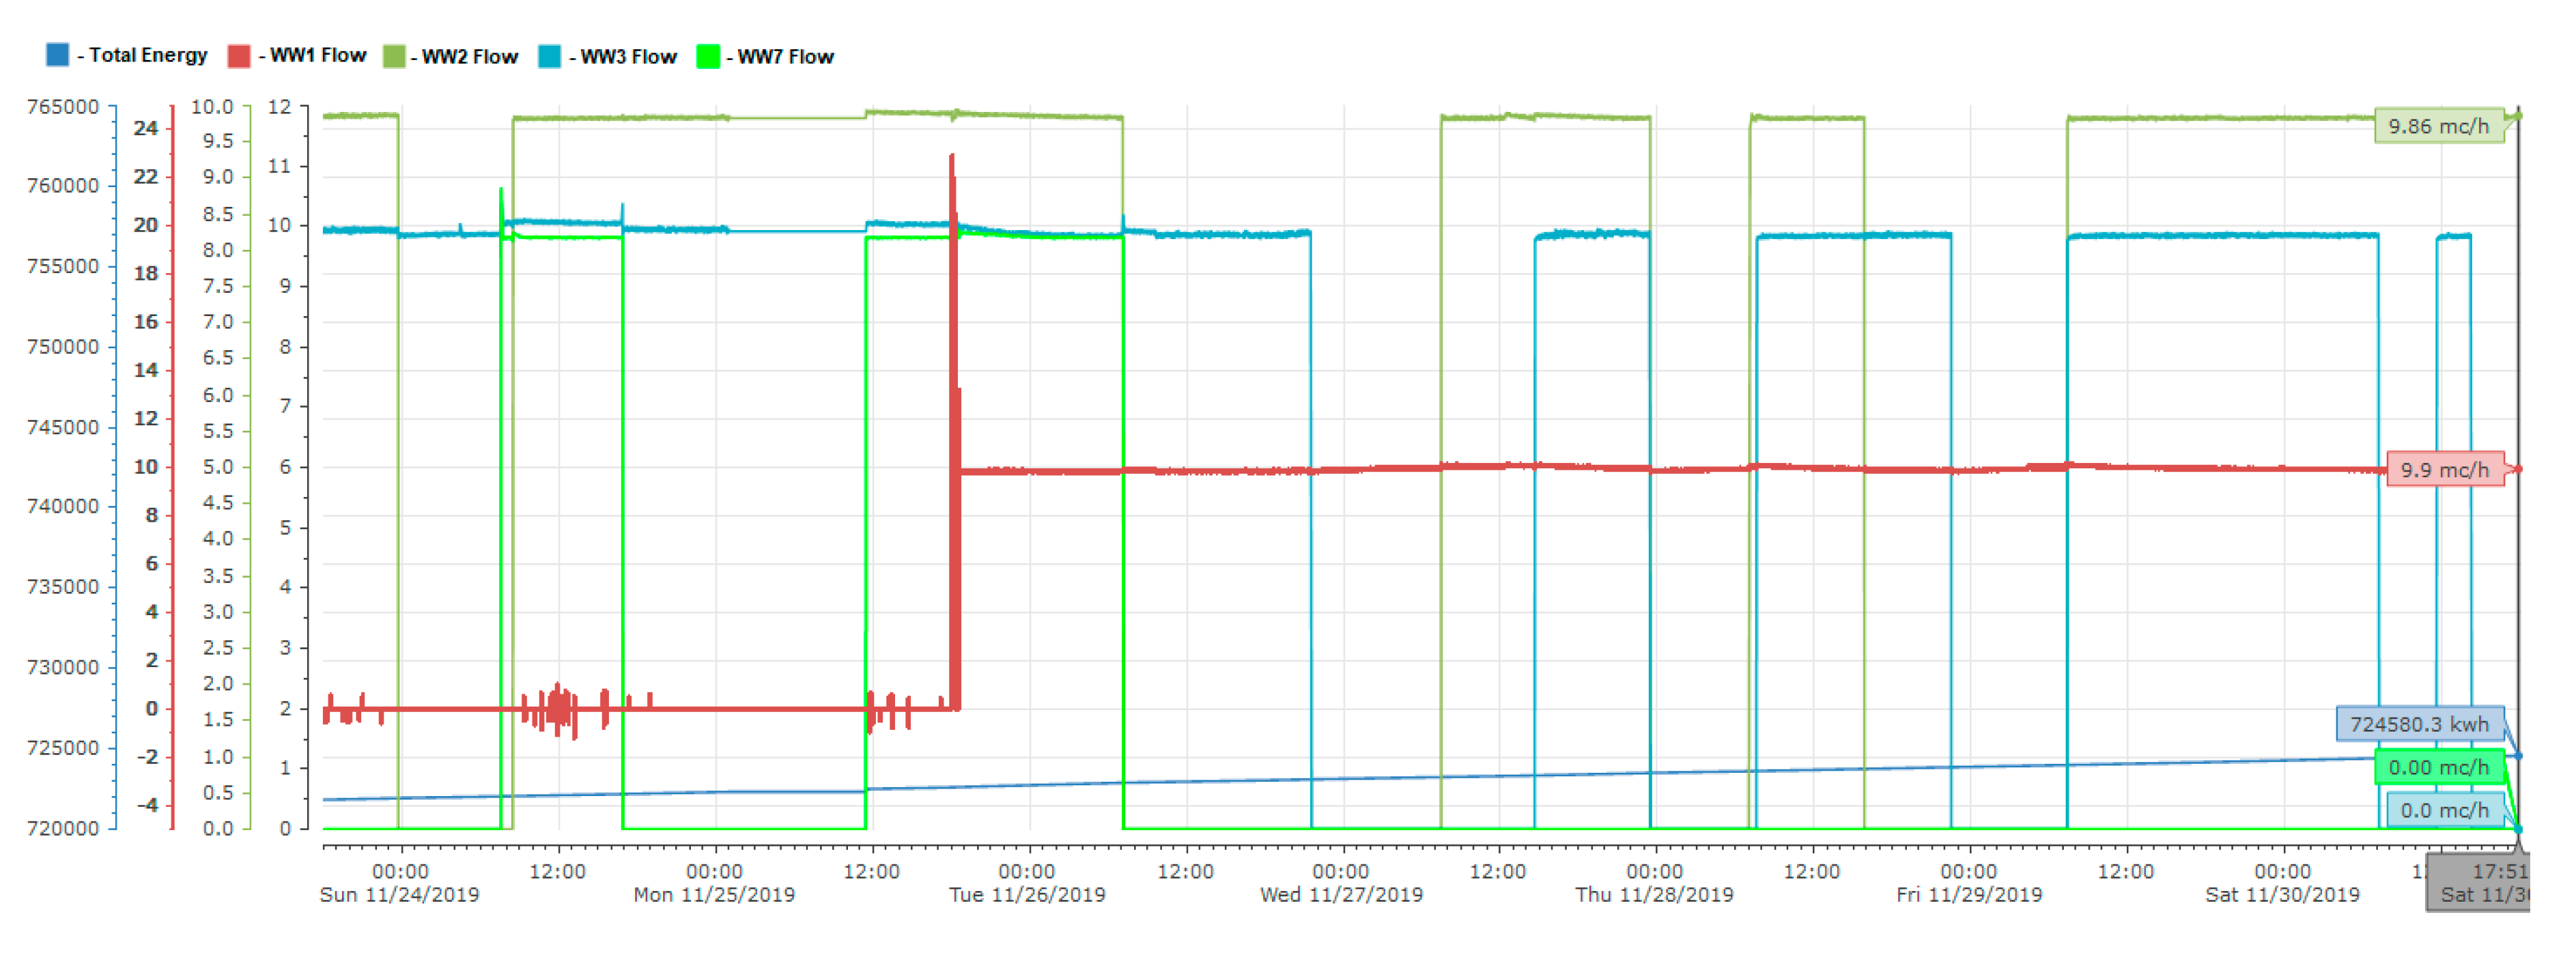
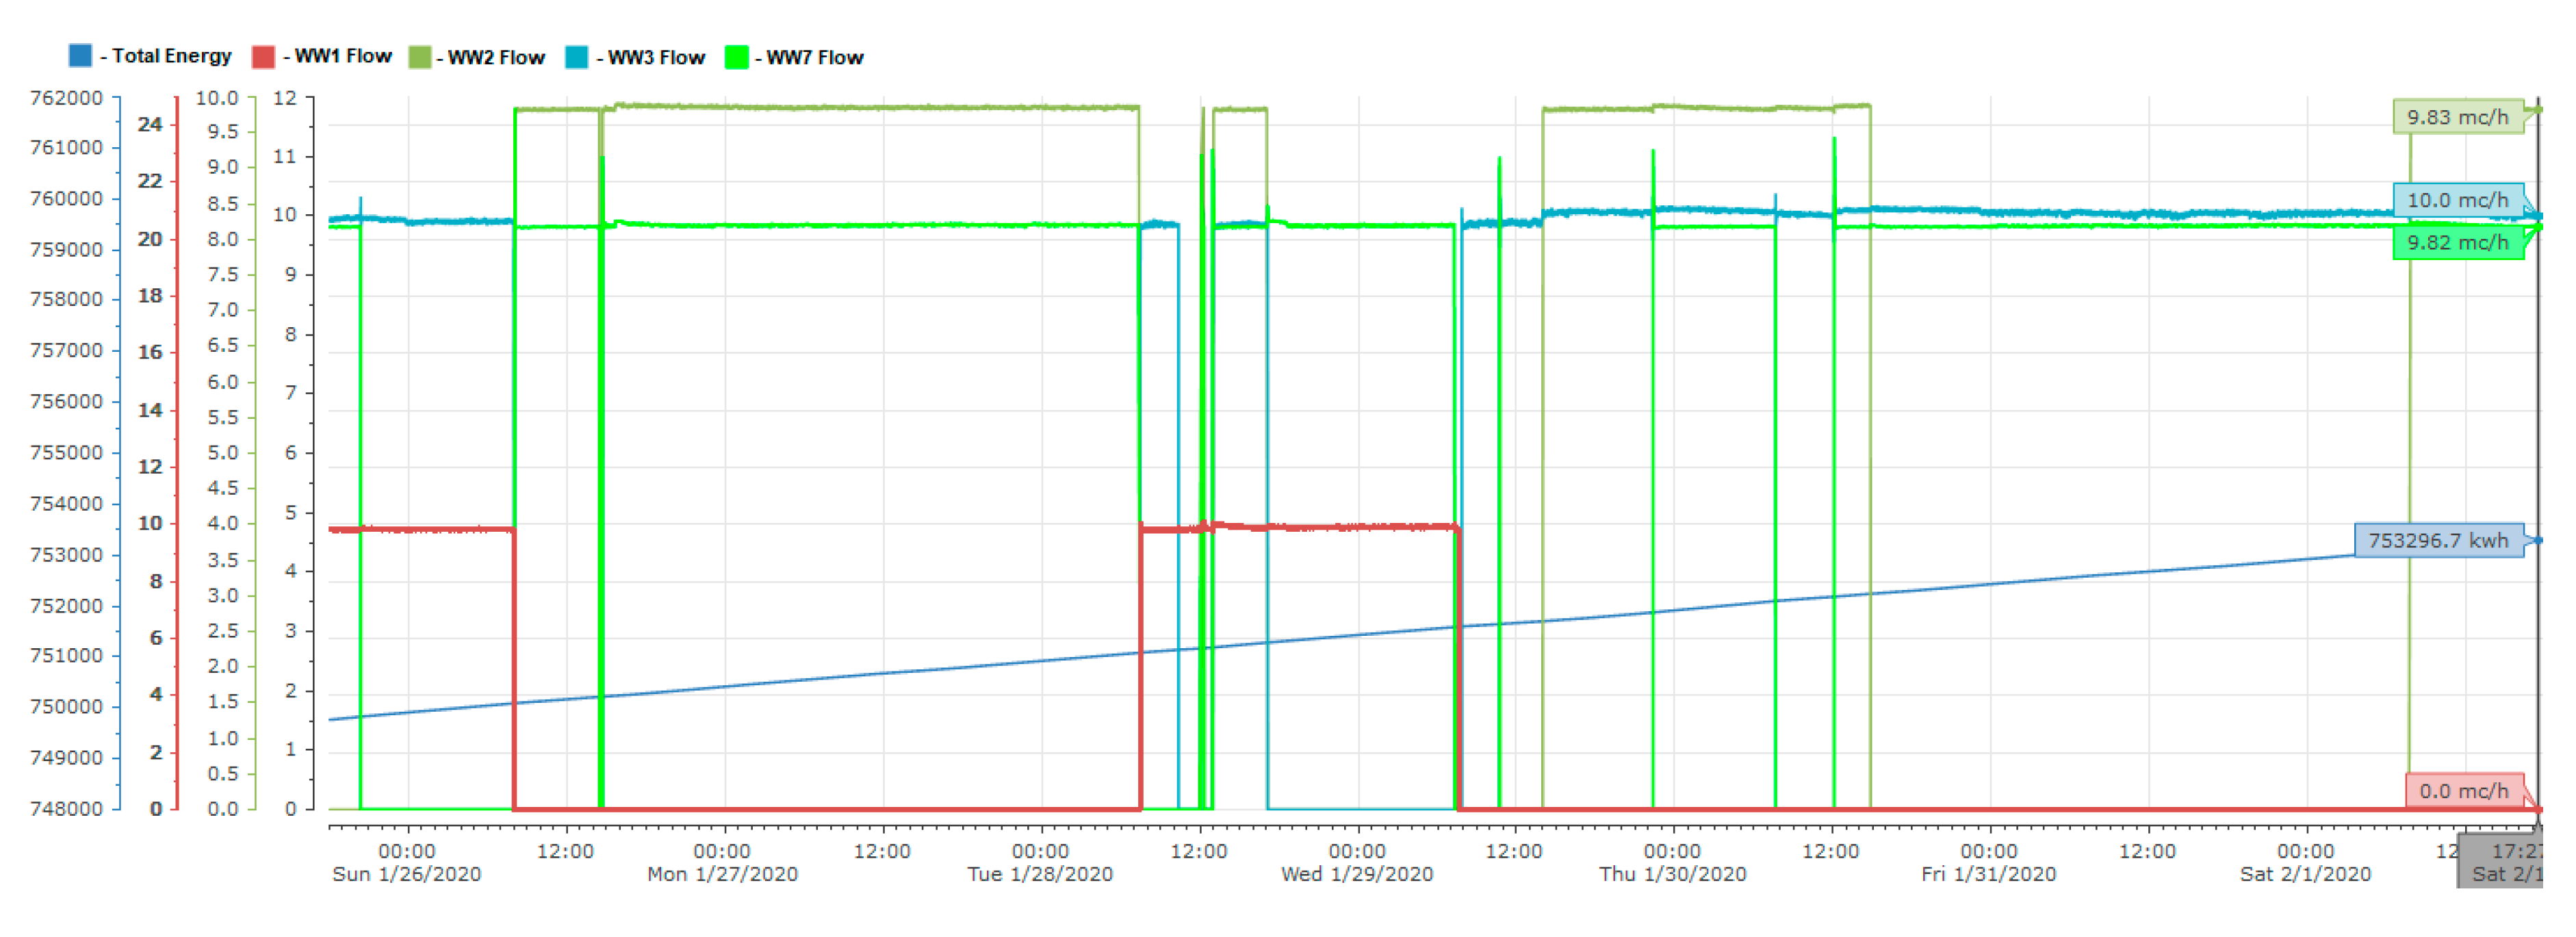
Two Weeks with Constrained FDC Solution
(23 November 2019–7 December 2019)
Four Weeks without FDC Solution
(11 January 2020–8 February 2020)
Week 1Week 2Week 1Week 2Week 3Week 4
Init. val. (MWh)722724.6742.7746.3749.8753.3
Final val. (MWh)724.6727.4746.3749.8753.3756.7
Consumption (MWh)]2.62.83.63.53.53.4
Average (MWh)2.73.5
Difference (%) +30%

