Article

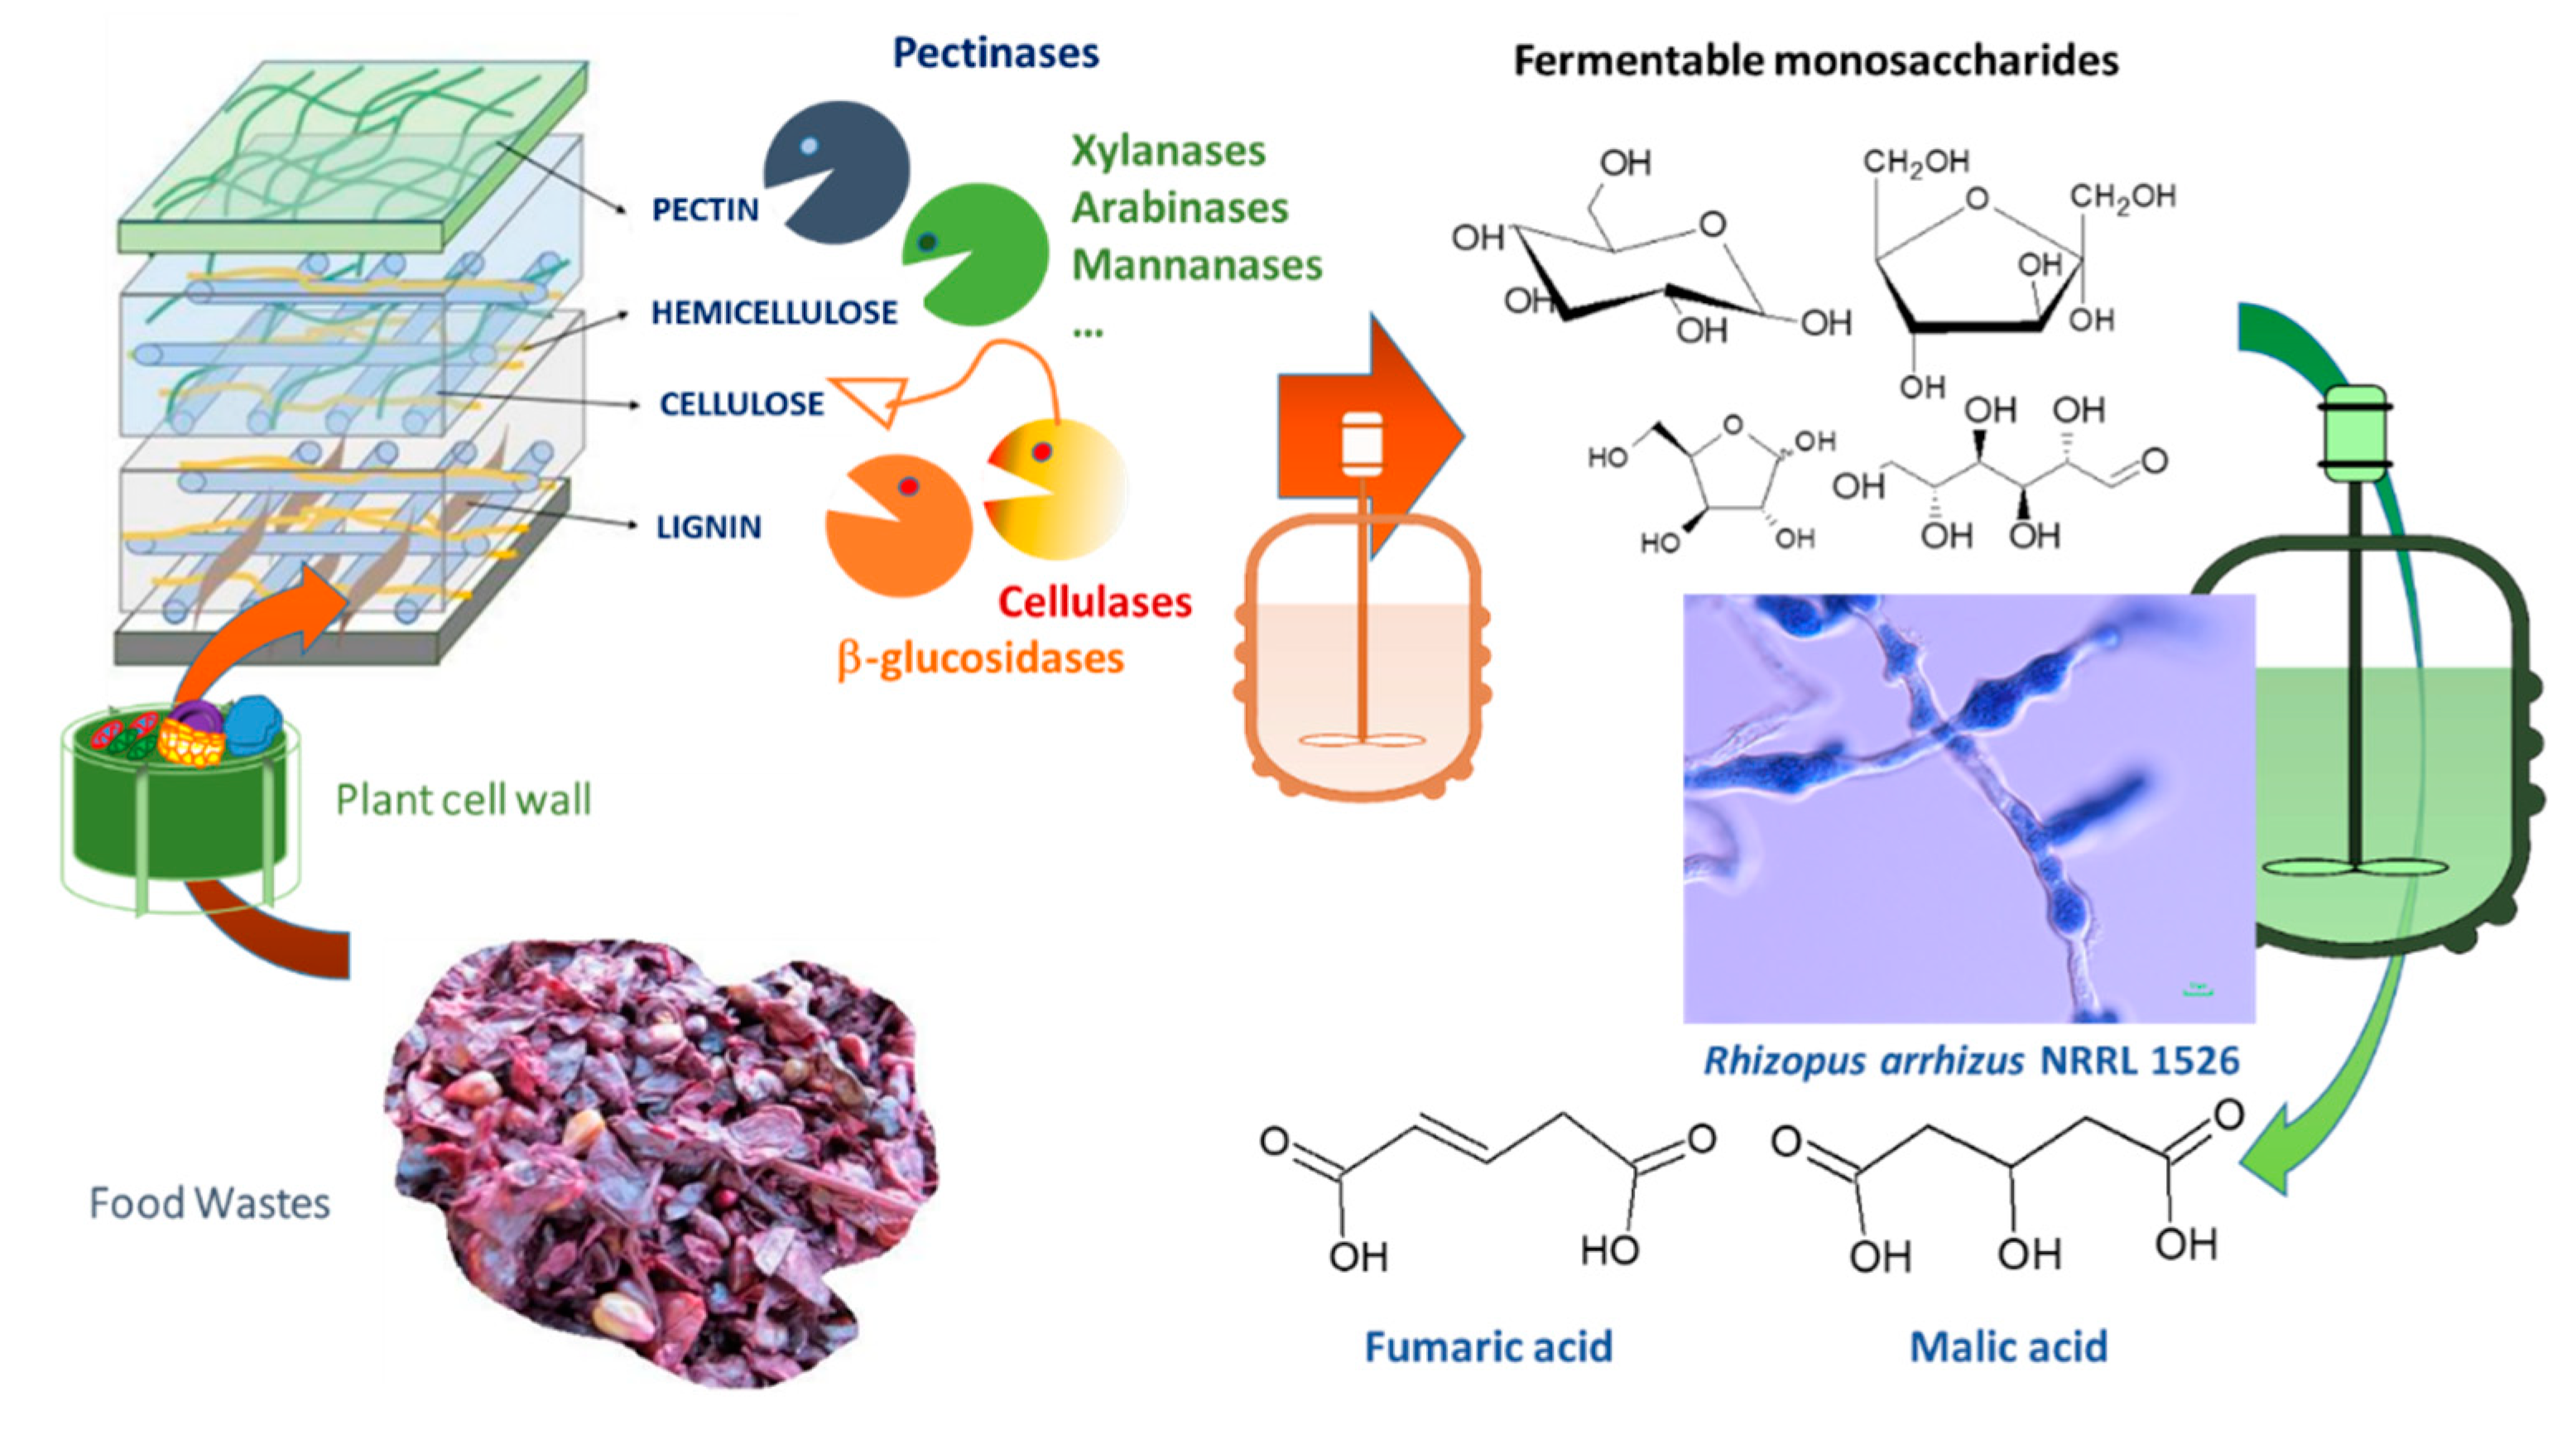
Kinetic Modelling of the Coproduction Process of Fumaric and Malic Acids by Rhizopus arrhizus NRRL 1526

by
Victor Martin-Dominguez
,
Laura Bouzas-Santiso
,
Nieves Martinez-Peinado
,
Victoria E. Santos
and
Miguel Ladero
*
Chemical Engineering and Materials Department, Chemistry College, Complutense University, 28040 Madrid, Spain
*
Author to whom correspondence should be addressed.
Processes 2020, 8(2), 188; https://doi.org/10.3390/pr8020188
Submission received: 22 December 2019 / Revised: 21 January 2020 / Accepted: 25 January 2020 / Published: 5 February 2020
(This article belongs to the Special Issue Green Sustainable Chemical Processes)

Abstract

:
The production of organic acids by biotechnological processes has experienced a notable impulse with the advent of first and second generation biorefineries and the need of searching for renewable and sustainable feedstock, such as biomass. Fumaric acid is a promising biomonomer for polyamide production and a well-known acidulant and preservative in food and feed industries. Malic acid is a well-known food acidulant with a high market share. The biotechnological Fumaric and Malic acid production via fungi of the Rhizopus genus is being explored nowadays as a process for the valorization of food and food-related waste to obtain food ingredients and key platform chemicals of the so-called biochemical biorefinery. In this work, a preliminary study is performed to find reproducible conditions for the production of the acids by Rhizopus arrhizus NRRL 1526 by controlling fungi morphology and inoculum conditions. Afterwards, several production runs are performed to obtain biomass, glucose, and acid concentration data at different processing time values. Finally, an unstructured, unsegregated model including a logistic-type equation for biomass and potential-type equations for the substrate and the products is fitted to experimental data. We find that the production of the organic acids is mainly non-associated with fungal growth.

1. Introduction

Biorefinery as a concept is an answer to the increasing environmental awareness in society and the gradual depletion of fossil resources. The quest for sustainability is critical in view of the increment of the human population and the need for higher standards of living with a limited stock of resources [1,2].
First generation biorefineries are based on food crops as biomass raw material. Food is a very limited and ethically questionable source for the production of biofuels, chemicals, and biomaterials. Therefore, the development of second and third generation biorefineries, based on lignocellulosic biomass and marine (algae) biomass, seems to be based in almost inexhaustible resources, avoiding the food vs. chemicals/fuels controversy and paving the way towards circular, sustainable strategies for the creation of materials, chemicals, and fuels [3]. For the development of these processes, biotechnology includes a prominent set of technological concepts, tools, and strategies to establish new eco-friendly processes that are able to reach high titers of key chemicals and fuels to satisfy the great demand of contemporary society [4]. Industrial biotechnology processes are carried out by enzymes, microorganisms, or upper cells at moderate temperature, pH, and pressure conditions.
The increment of agriculture and food wastes is one of the key problems linked to an increasing human population and standard of living. Just considering food wastes, which are not as plentiful as those of agriculture and forestry, more than 1300 million tons are produced worldwide each year [5]. These organic residues, usually rich in free sugars, polysaccharides, proteins, and fats, are amenable to biotechnological transformation into chemicals and fuels.
Fumaric acid is an ingredient and excipient in pharmaceutic and food products [6,7]. Its high acidity results in a very powerful yet non-toxic antimicrobial agent, as well as an acidulant that can substitute citric and lactic acids. This acid has a huge potential in the polymer industry as a viable substitute of petroleum-based monomers, providing biodegradable polymers with very interesting applications in industry [8]. Furthermore, fumaric acid is a food complement of cattle feed that reduces up to 70% of methane emissions, reaching a 10% global reduction of methane, due to humans [9]. In fact, fumaric acid has been designated by the US Department of Energy as one of the Top 12 value added chemicals to be obtained from biomass [10].
Fumaric acid production by a biotechnological process supposes a notable environmental and economic advantage because an actual production process consists of maleic acid isomerization using metallic catalysts and extensive temperature and pressure conditions. Maleic acid is obtained from its anhydride, a chemical whose production and use is very aggressive to the environment [9]. A possible alternative could be the use of enzymes to perform maleic acid isomerization, using maleic isomerase from the Bacillus or Pseudomonas genus; however, this process is currently being researched and entails certain control problems [8]. The use of a fermentative process is more attractive, as waste materials can be valorized at moderate process conditions, as presented in Figure 1 [11,12].
Glucose fermentation to fumaric acid was studied and partially developed in the 1940s [13,14], but it was abandoned, due to the great development of the petroleum-based industry after WWII. However, in the 1980s, a production method was patented by Dupont for producing different carboxylic acids by using bioprocesses [15]. These processes are always based on fungi from genus Rhizopus, which are known to be the best fumaric acid producers. These fungi produce fumaric acid via two different pathways: the TriCarboxilic Acids Cycle (TCA) or the Krebs cycle and the reductive TCA pathway. In the first case, fumaric acid is produced as an intermediate inside the mitochondria (and not released) [8,16]. Fumaric acid production heavily depends on the reductive TCA pathway that involves CO2 fixation and releases the produced fumaric acid outside the cell [16]. Therefore, from an industrial perspective, this pathway must be favored by obtaining a proper fungus morphology, which is the result of an adequate production strategy [17].
Malic acid is a biomass-derived chemical that can be obtained by fumaric acid hydration using Rhyzopus oryzae whole cells in anaerobic conditions [18]. This acid potential has been growing in the last years, as its chelating properties render it very promising in the recovery of valuable metals from batteries [19], in the production of polymalic acid and copolymers for controlled drug released [20], and in the production of malic acid deep eutectic solvents [21], to name some examples of the emerging applications of this compound.
Most studies on fumaric acid of biotechnological origin focus on the development of an effective fermentative process for fumaric acid production at an industrial level. However, although kinetic models are of great interest to simulate and design industrial processes, during their scale-up and final production control, in the case of fumaric acid, there is, to the best of our knowledge, only a kinetic model study focused on immobilized Rhizopus oryzae, but none for the more common free or suspended fungus [22]. The kinetic Monod model proposed in this study is employed to determine yields of fumaric acid and by-products by understanding the evolution of the system through the different catabolic carbon fluxes proposed (fumaric acid production, respiration and ethanol production). In particular, a main objective of the study is to optimize pH and oxygen diffusion in order to maximize the desired carbon flux, the one that renders the highest possible yield of fumaric acid.
Therefore, the aim of the present work is to develop an initial kinetic model able to predict and simulate fumaric and malic acids production using R. arrhizus at flask scale. To obtain this kinetic model, experimental procedures and methods were developed to reach reproducible and reliable production data (including fumaric and malic acids, but also biomass, glucose, and any minor by-product). To this end, reaching a proper morphology to grow the fungus and tuning up the inoculum stages were critical.

2. Materials and Methods

2.1. Microorganism and Spore Production

Rhizopus arrhizus NRRL 1526 was kindly donated by the research group of Dr. Ulf Pruesse and Dr. Anja Kuenz from the Thünen Institute of Agricultural Technology (Braunschweig, Germany), within the framework of the FAPA (Fumaric Acid for Polymer Applications) project inside ERA-net ERA-IB2.
Spores were cultivated on agar plates with medium A [13] for 5 days at 28 °C, after sporulation, spores were extracted from fungal mycelium with a glycerol and saline (50%) solution. The final spore solution (containing approximately 30 × 107 spores/mL) was stored at −80 °C. This stock was the initial biological inoculum of every single experiment.

2.2. Culture Mediums

Sporulation stages have been carried out on agar plates using medium A defined by Rhodes in 1959 [13], and described in Table 1, this medium is indicated for promoting sporulation on fungi applying saline stress.
Inoculum previous stages were tested using medium B developed by Ling and Ng in 1989 [15]. This medium has been modified, removing their original content in CaCO3 for preliminary experiments at free pH, and is also described in Table 1.
Finally, production stage experiments were performed using medium C, optimized by Ling and Ng [15] (the same as medium B), this medium is recommended for this production stage, due to its high content in glucose, and proper concentrations of nitrogen sources and micronutrients, as described in Table 1 as well.

2.3. Culture Conditions

All experiments were performed in 100 mL cotton-covered flasks containing 20 mL of medium (5:1 ratio), in aerobic conditions. Agitation was at 200 rpm to ensure a proper mixing and oxygen diffusion, while avoiding shear damage or stress to the fungus [23].
Before the production of the acids, previous inoculum stages were performed, reaching an adequate morphology in the first step; studies about temperature, number of stages, duration, and evolution were performed later. In these previous stages, pH evolution was free, while, on the other hand, in production experiments, pH is controlled using CaCO3 in the medium C (Table 1), observing a slightly decreasing pH during the fermentation process whose average value is 6, approximately.
After the selection of the previous stages’ conditions, production stage experiments were carried out to obtain kinetic data that was subsequently employed to find the most adequate model, together with the values and errors of its relevant parameters.
Due to the morphological characteristics of the used fungus, which develops hyphae, biomass concentration cannot be measured by turbidity techniques, such as in bacterial bioprocesses [24,25,26], so biomass quantification must be done by dry weight cell determination. To this end, a working protocol called “one flask, one sample” was developed. In this working protocol, every single sample took along the culture in an independent flask, so the reproducibility of the sampling method and the experiments were deeply tested, and runs were conducted in triplicate.

2.4. Analitical Methods

Broth components, as glucose, fumaric acid, malic acid, and any other acids and by-products, were quantified by High Performance Liquid Chromatography (HPLC) with a modular equipment (Jasco PU-2089. AS-2059. CO-2060. RI-2031 & MD-2015. Jasco MD-2015 & Jasco RI-2031, Tokyo, Japan) using, as the stationary phase, a Rezex ROA-Organic Acid H+ column. Analytes were eluted with H2SO4 0.005 M at a 0.5 mL/min flow rate and at a column temperature of 60 °C. Fumaric acid was measured using a diode array detector (Jasco MD-2015, Tokyo, Japan) whose main wavelength was set as 236 nm, whereas the other components in the broth were quantified using a refractive index detector (Jasco RI-2031, Tokyo, Japan).
In all samples, a pH measurement was performed using a pH-meter Hanna Instruments HI 5521. Dry weight cell determination was carried out by filtering the mycelial biomass, using paper filters that were subsequently dried at 105 °C for 48 h.

2.5. Mathematic Methods

In the kinetic study, several models were fitted to the results obtained during fumaric acid production experiments. For this purpose, software Aspen Custom Modeler V10® (ACM) and OriginLab 2019® were used, employing mathematic methods as numeric integration by variable-step Euler method coupled with a nonlinear regression method based on the Levenberg–Marquardt Algorithm.
For kinetic modelling using this software, the proposed kinetic model (described in Section 3.4) is introduced by using ACM programming language, firstly defining the parameters and variables of the model to be fitted followed by the relevant equations; secondly, introducing experimental results in the ACM dataset and, thirdly, setting approximate initial values for the kinetic constants contained in the model. Finally, the program (attached as Supplementary Material) was run to obtain values and their standard errors for such kinetic constants, together with goodness-of-fit parameters.
To select the best kinetic model, typical physical and statistical criteria were applied. Goodness-of-fit statistical criteria were based on the Sum of Squared Residuals (SSR –Equation (1)-), from which the Fisher distribution parameter for 95% of confident (F95) –Equation (2)- and the Root Mean Square Error (RMSE) –Equation (3)- can be computed. Both SSR and RMSE parameters are measures of the accumulative error between experimental data and the fitted model, so both should be minimal and are best if near or equal to zero. On the other hand, F95 is used to fit data to a Fisher–Snedecor distribution with 95% confidence. This parameter must be over a critical value (tabulated) for given numbers of data and model parameters to dismiss the null hypothesis, supporting in this way the correlation between the proposed model and experimental data.
SSR = j = 1 j = C i = 1 i = N ( C ji   exp C ji   calc )
F 95 = j = 1 j = C n = 1 n = N ( C jn . calc K ) 2 j = 1 j = C n = 1 n = N ( SSR N K )
The percentage of variation explained (VE) –Equation (4)- is another goodness-of-fit parameter and shows how good the model is at explaining the variability of obtained results with the independent experimental variable (time, in this case). A 100% supposes a perfect explanation by the model of the experimental change of concentrations with time.
VE ( % ) = 100 ( 1 l = 1 L SSQ l l = 1 L SSQ mean l )

3. Results and Discussion

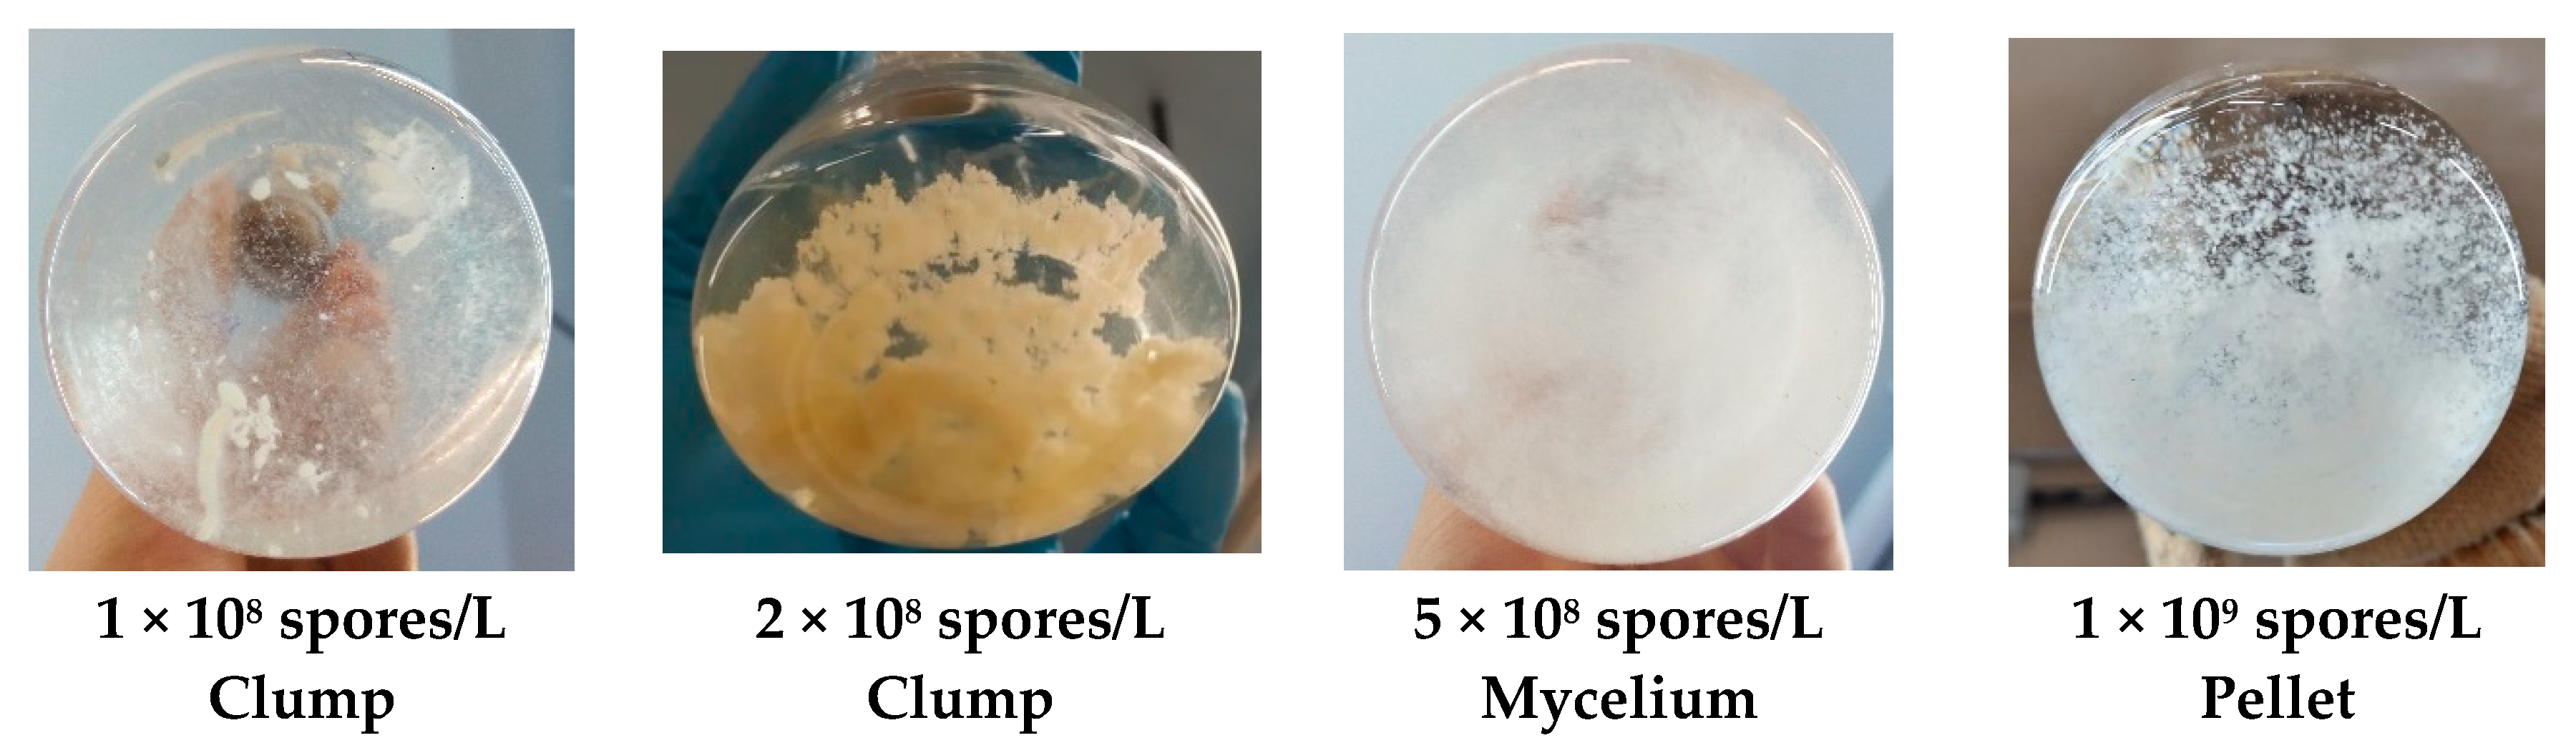
3.1. Fungi Morphology Selection at the Inoculum Stage

The first step to develop a reproducible and consolidated production stage is to reach a proper morphology to obtain high and reproducible productions [17,27,28]. Several studies have been aimed at analyzing the effects of operational variables in the process, such as: fermentation volume, agitation rate, pH, culture temperature, presence of certain metals, addition of surfactants [29] or, even, the nitrogen source employed in the morphology developed by the fungus [12,27].
Higher fumaric acid production titers were obtained with dispersed mycelium morphology, but this morphology is not suitable for an industrial process, due to the technical problems related with broth viscosity that it entails [27]. Hence, the desired morphology at that scale would be pellets because it provides an acceptable fumaric acid titer, similar to that of mycelium morphology, while a low viscosity is ensured, facilitating biomass manipulation and reducing mechanical energy input [27]. In this study, we have found a proper initial spore concentration to develop small and dispersed pellets during the inoculum stage.
In Figure 2, the results obtained when using different values of spore concentration and the morphology reached with them are collected. It seems evident that a higher concentration of spores favors the pellet morphology, while, on the other hand, lower concentrations stimulate clump formation, favoring mycelium growth instead of nucleation, leading to small mycelia or pellets. Therefore, in the subsequent experiments, 109 spores/L will be the selected initial spore concentration for the inoculum stage, as it leads to the desired morphology: small and dispersed pellets.

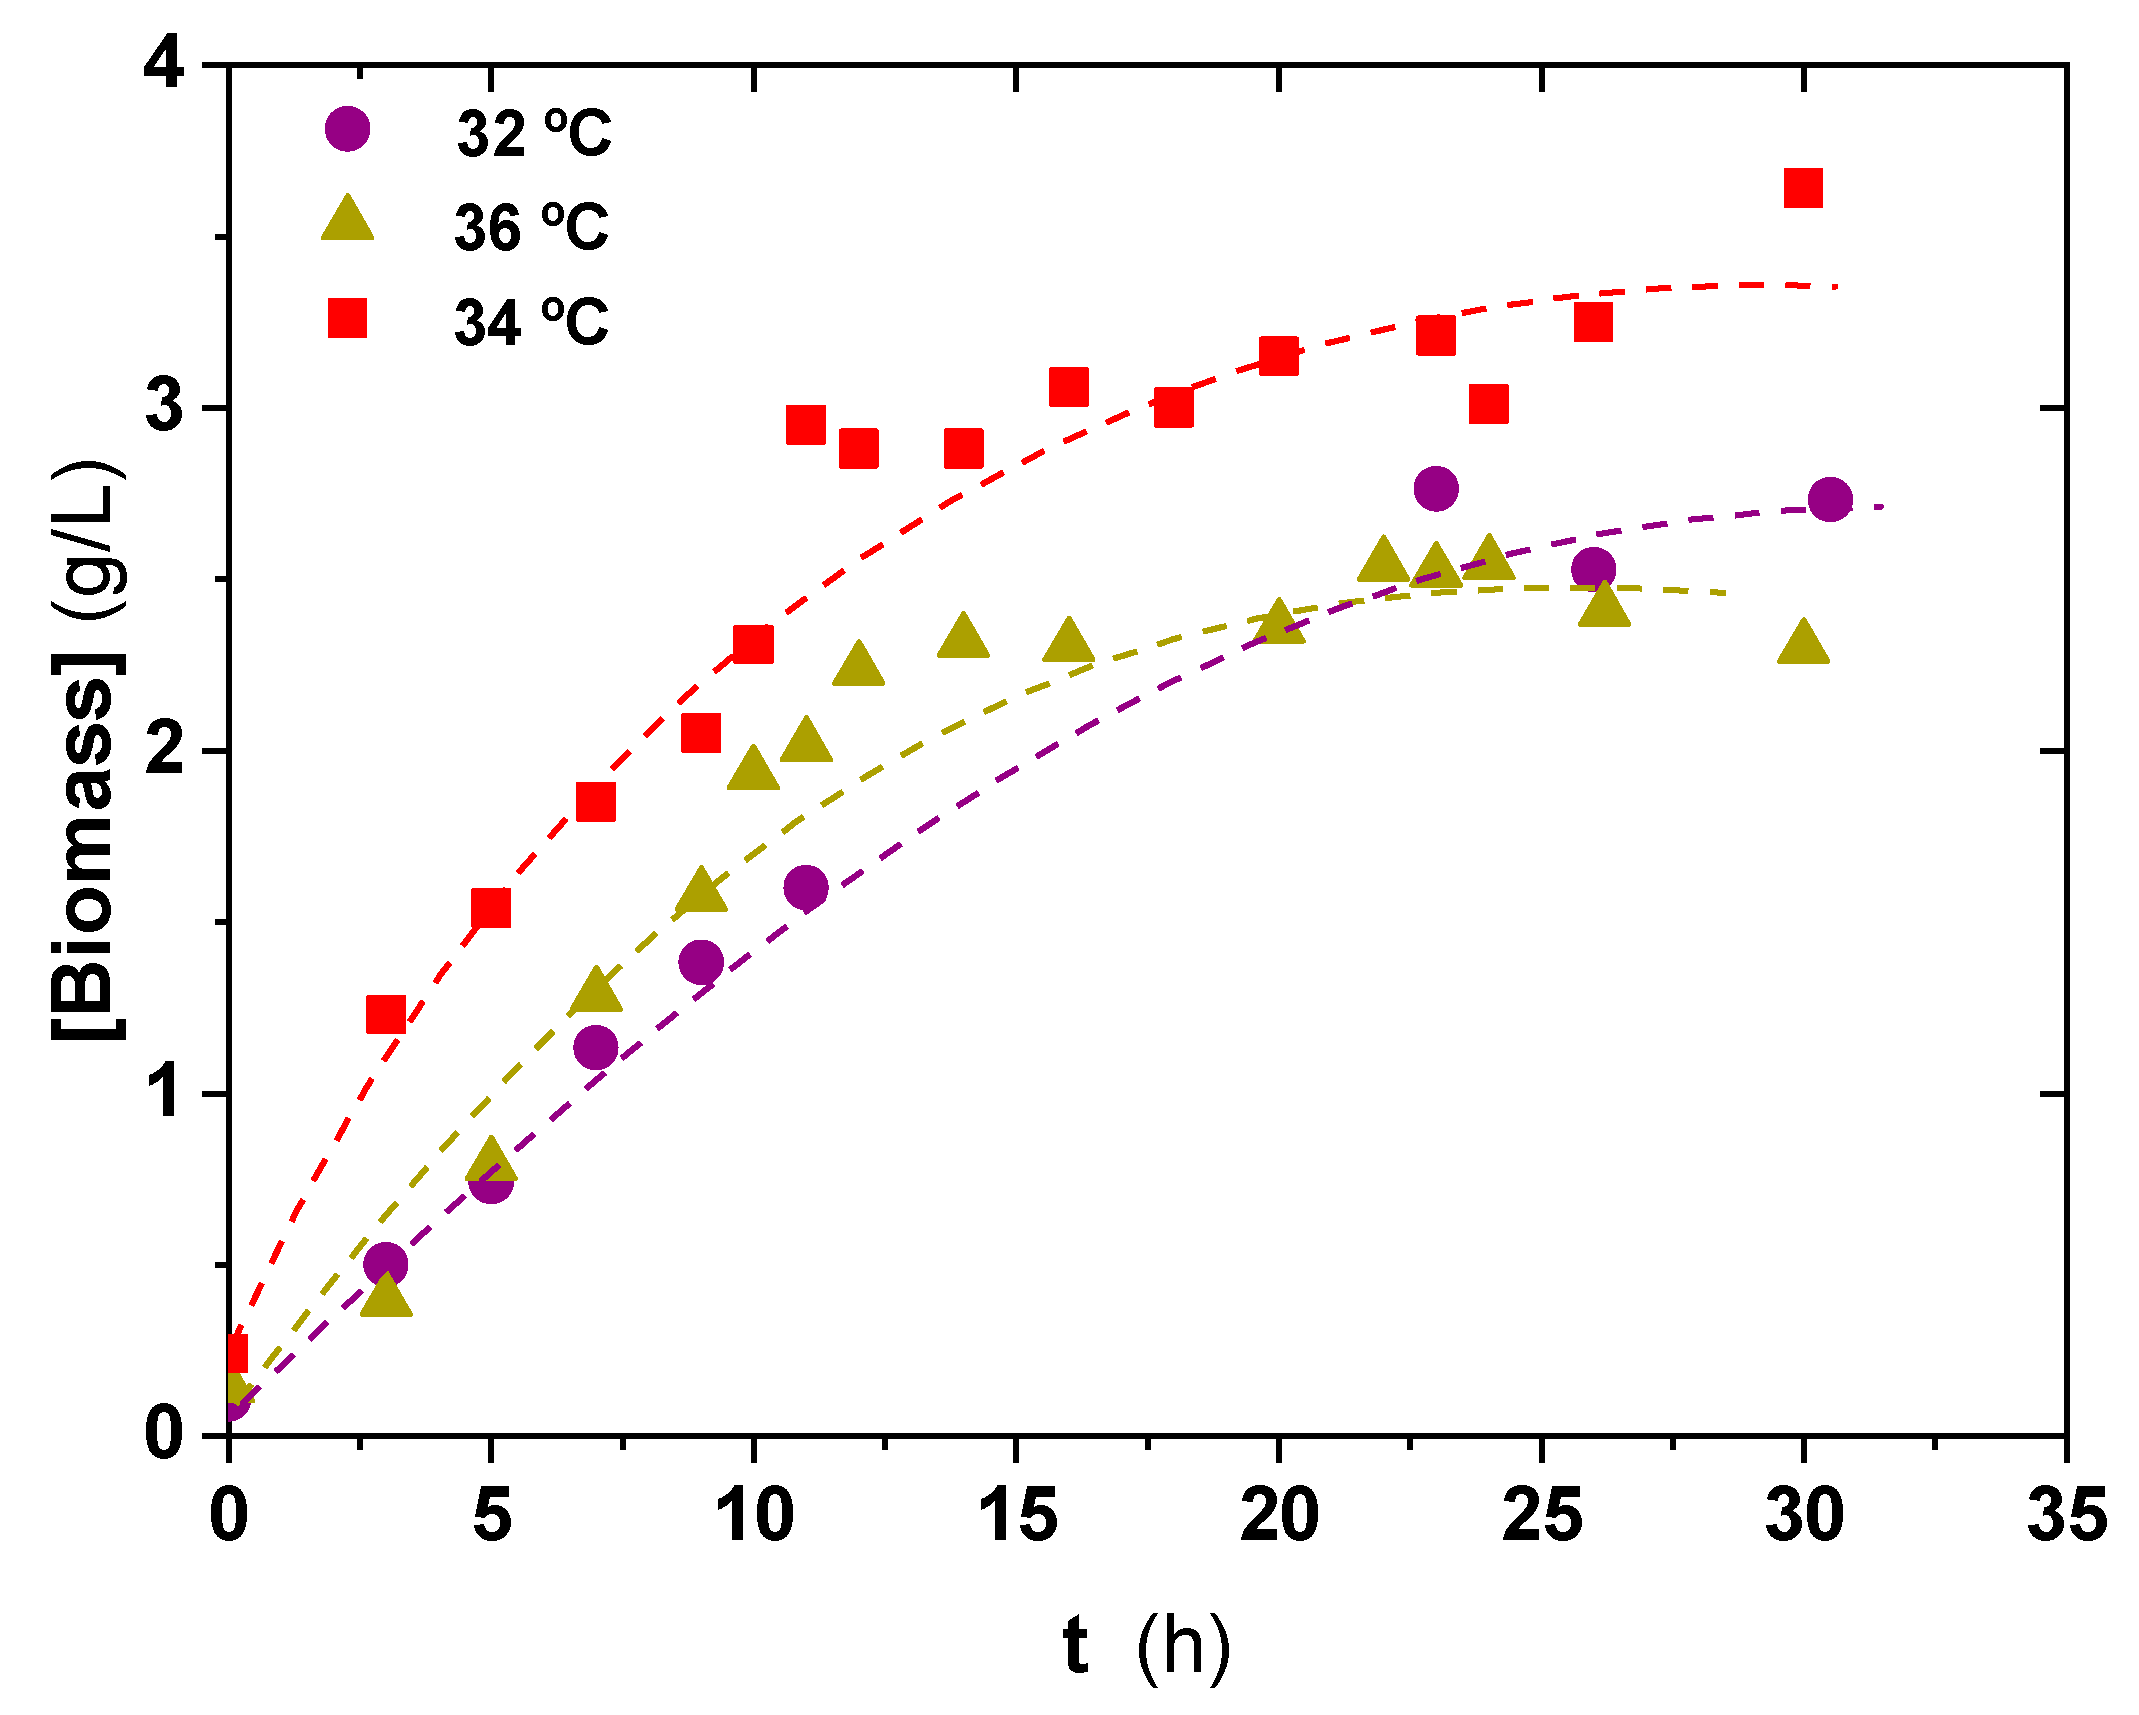
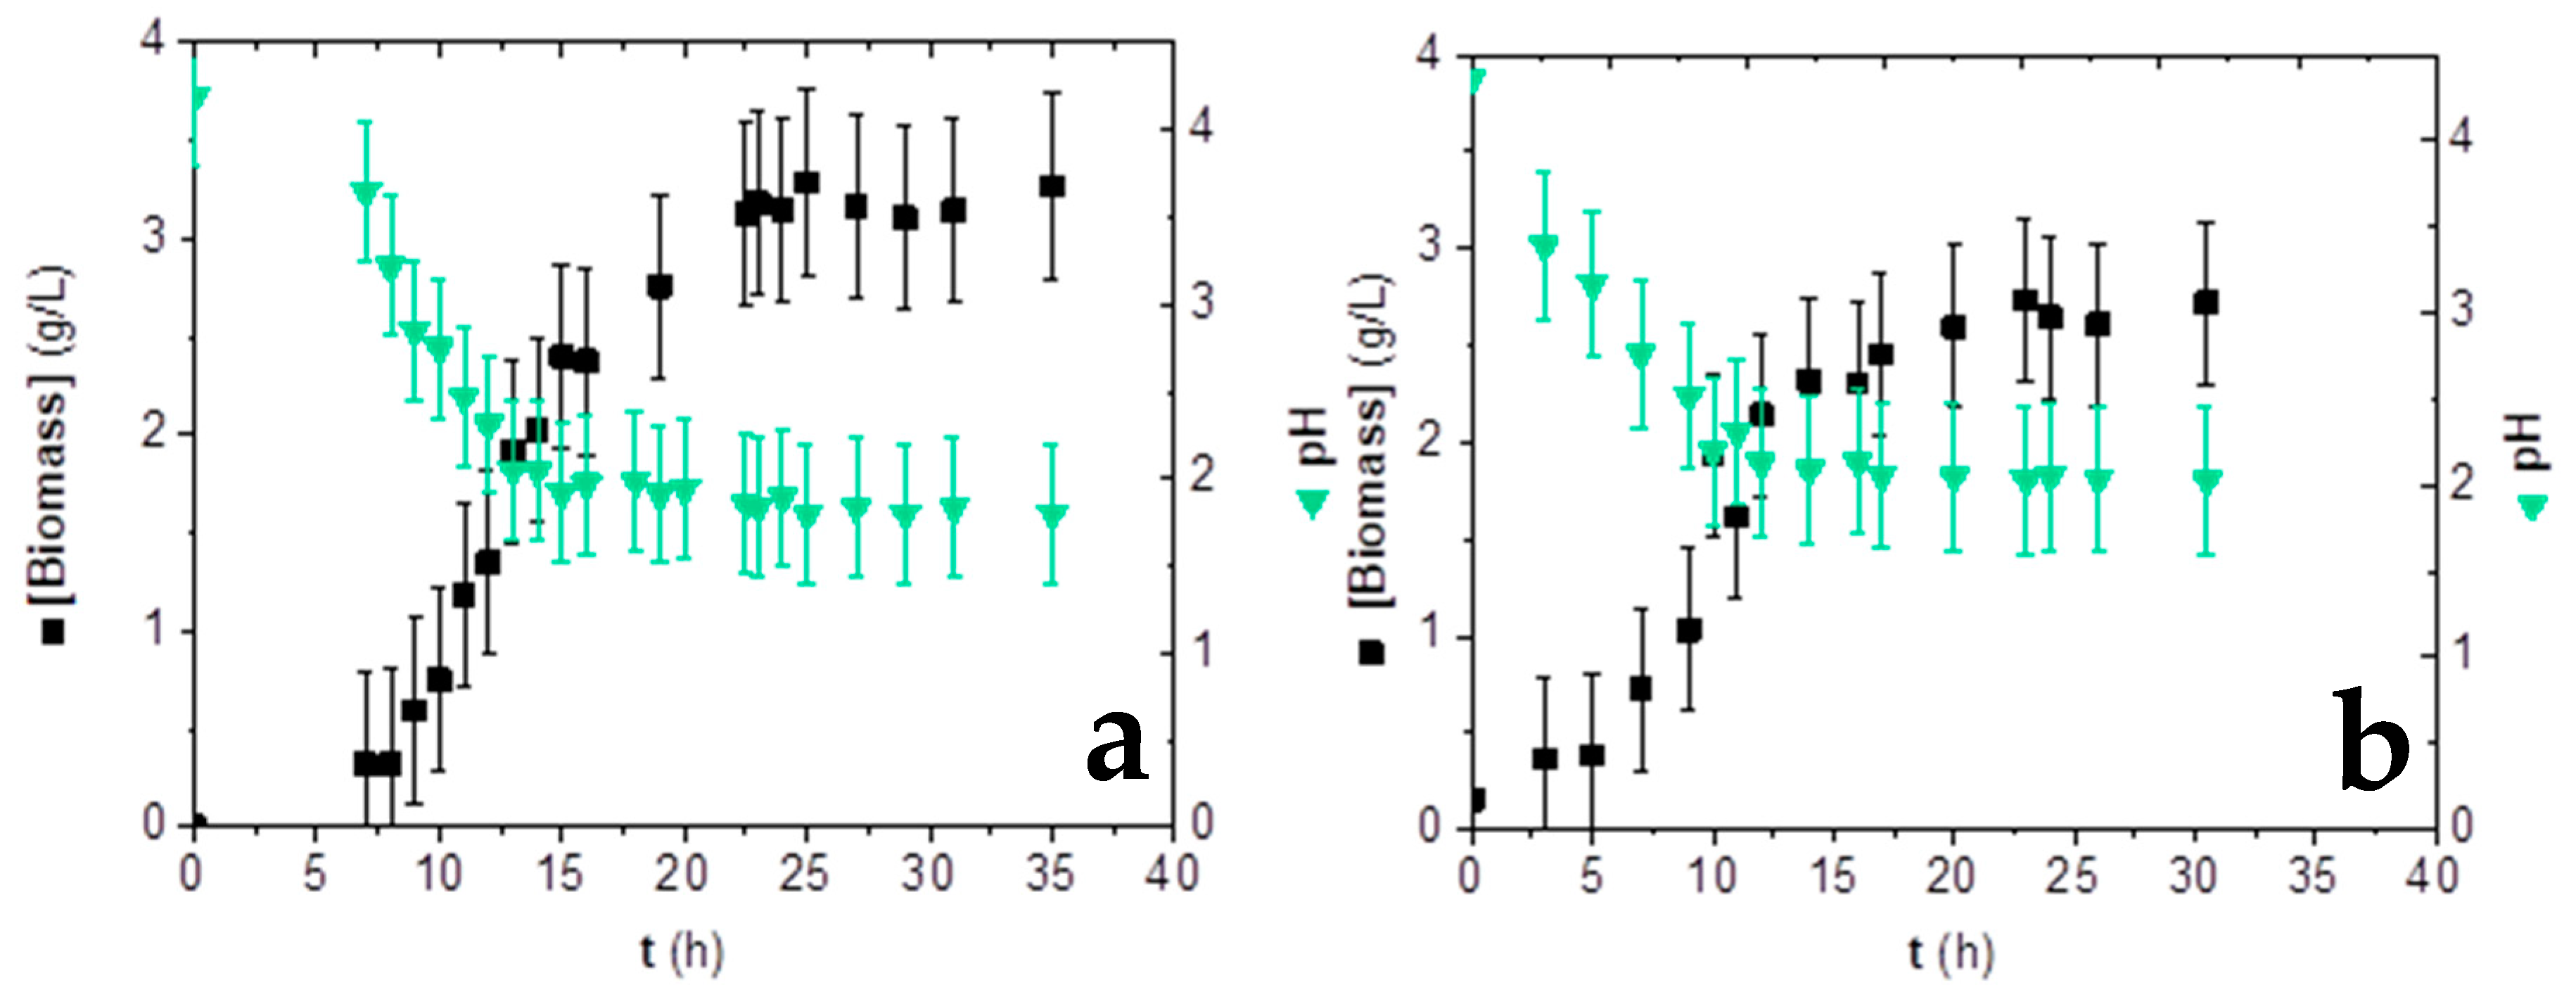
3.2. Temperature and pH Effect on Inoculum Biomass Growth

Once an adequate morphology was achieved, the growth of the fungus in the inoculum stage was studied. To start with, the operation temperature was selected by following the biomass growth with time at several temperatures, as can be seen in Figure 3. The best temperature for the fungus development, both in terms of biomass yield and productivity, seems to be 34 °C, when higher concentrations of biomass are gotten, while preserving the morphology reached on the previous set of experiments. Higher temperatures, as 36 °C, lead to lower initial biomass production and lower final biomass yields, suggesting a thermal deactivation of the biomass growth process.
Having selected the bioprocess temperature, the inoculum growth was analyzed by following the evolution of the biomass, the consumption of glucose and the production of fumaric acid concentration and pH. These results are displayed in Figure 4, only biomass and pH are represented, as fumaric acid was not found on the analyzed samples of this inoculum stage. If we consider the glucose concentration change during the bioprocess, it was only reduced from 40 to 35 g/L in the best of cases, so it could be considered almost constant.
These facts are probably due to the absence of pH control at this stage, with a possible inhibition of fumaric acid production. In general, low pH values not only avoid the production of fumaric acid, but also, when they are as low as pH 2 (at 15 h, approximately), biomass growth stops and glucose is no longer consumed.
To avoid possible damages to biomass due to low pH, this transferred biomass into the production stage must be in the early exponential growth phase and, thus, in a reasonably good physiological state. Therefore, the inoculum stage will last 12 h for all subsequent experiments. For all of them, the biomass inoculum will be 10% v/v of the operation volume (2 mL inoculation) [15].

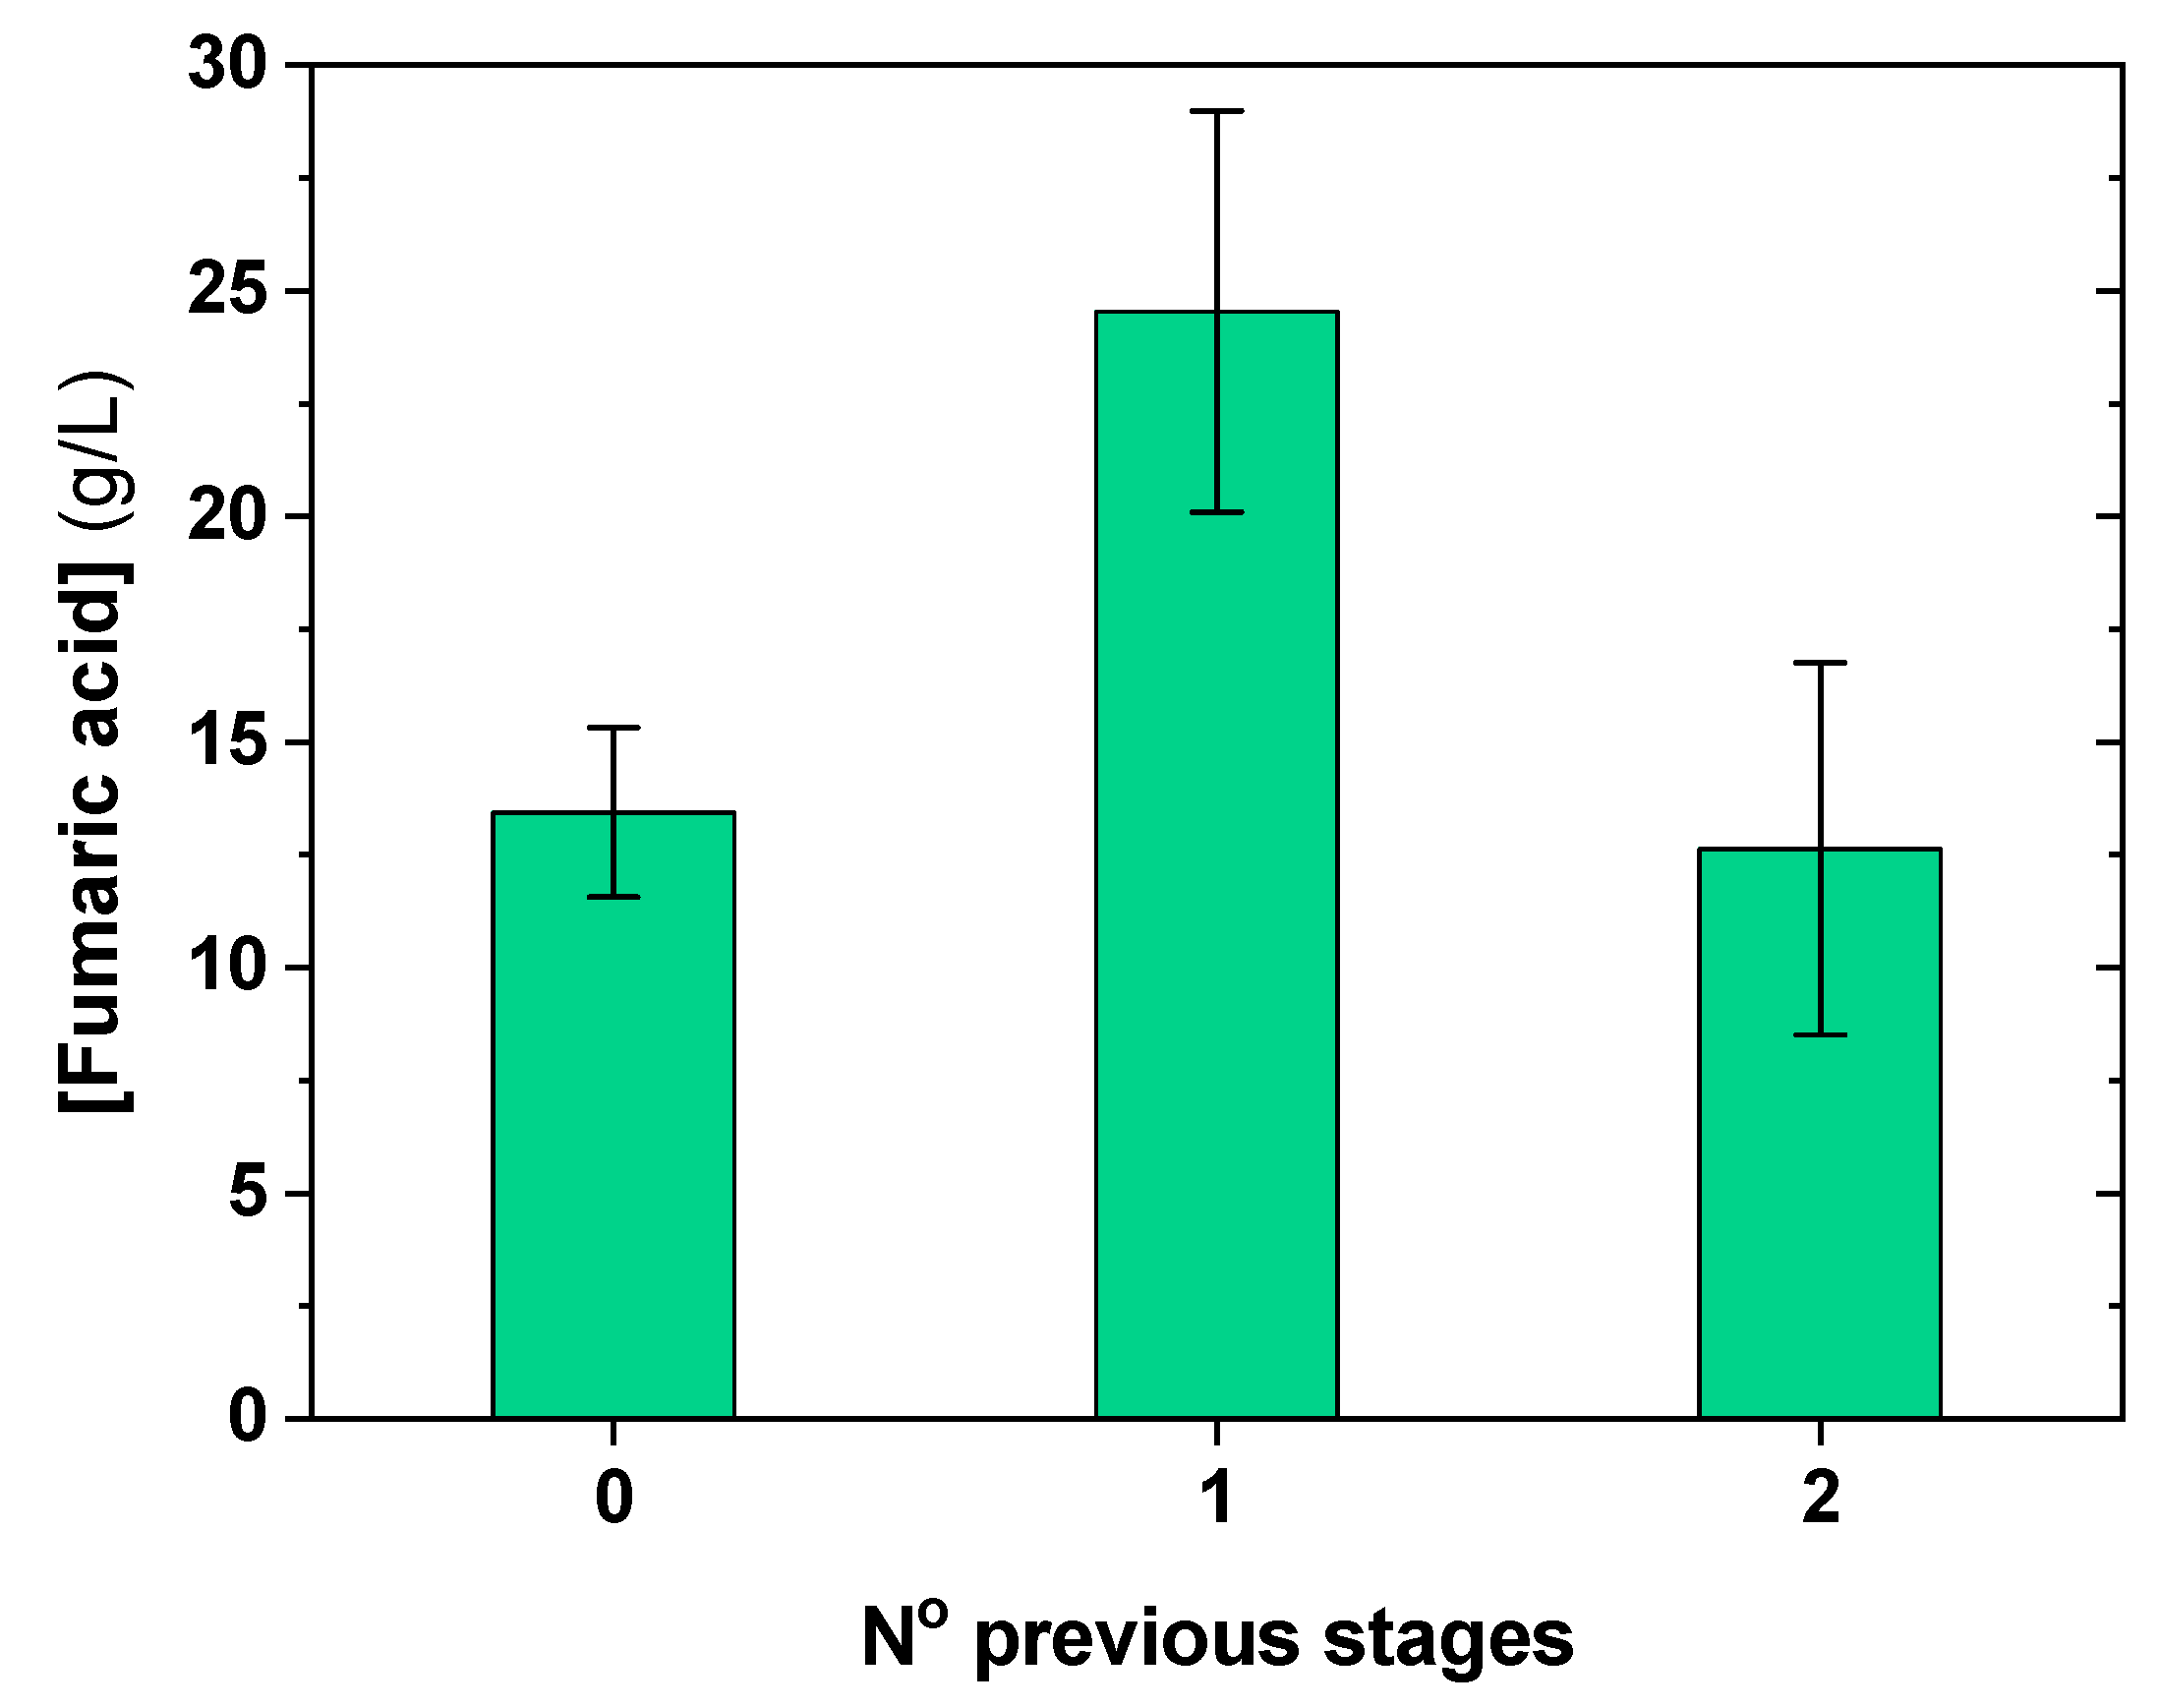
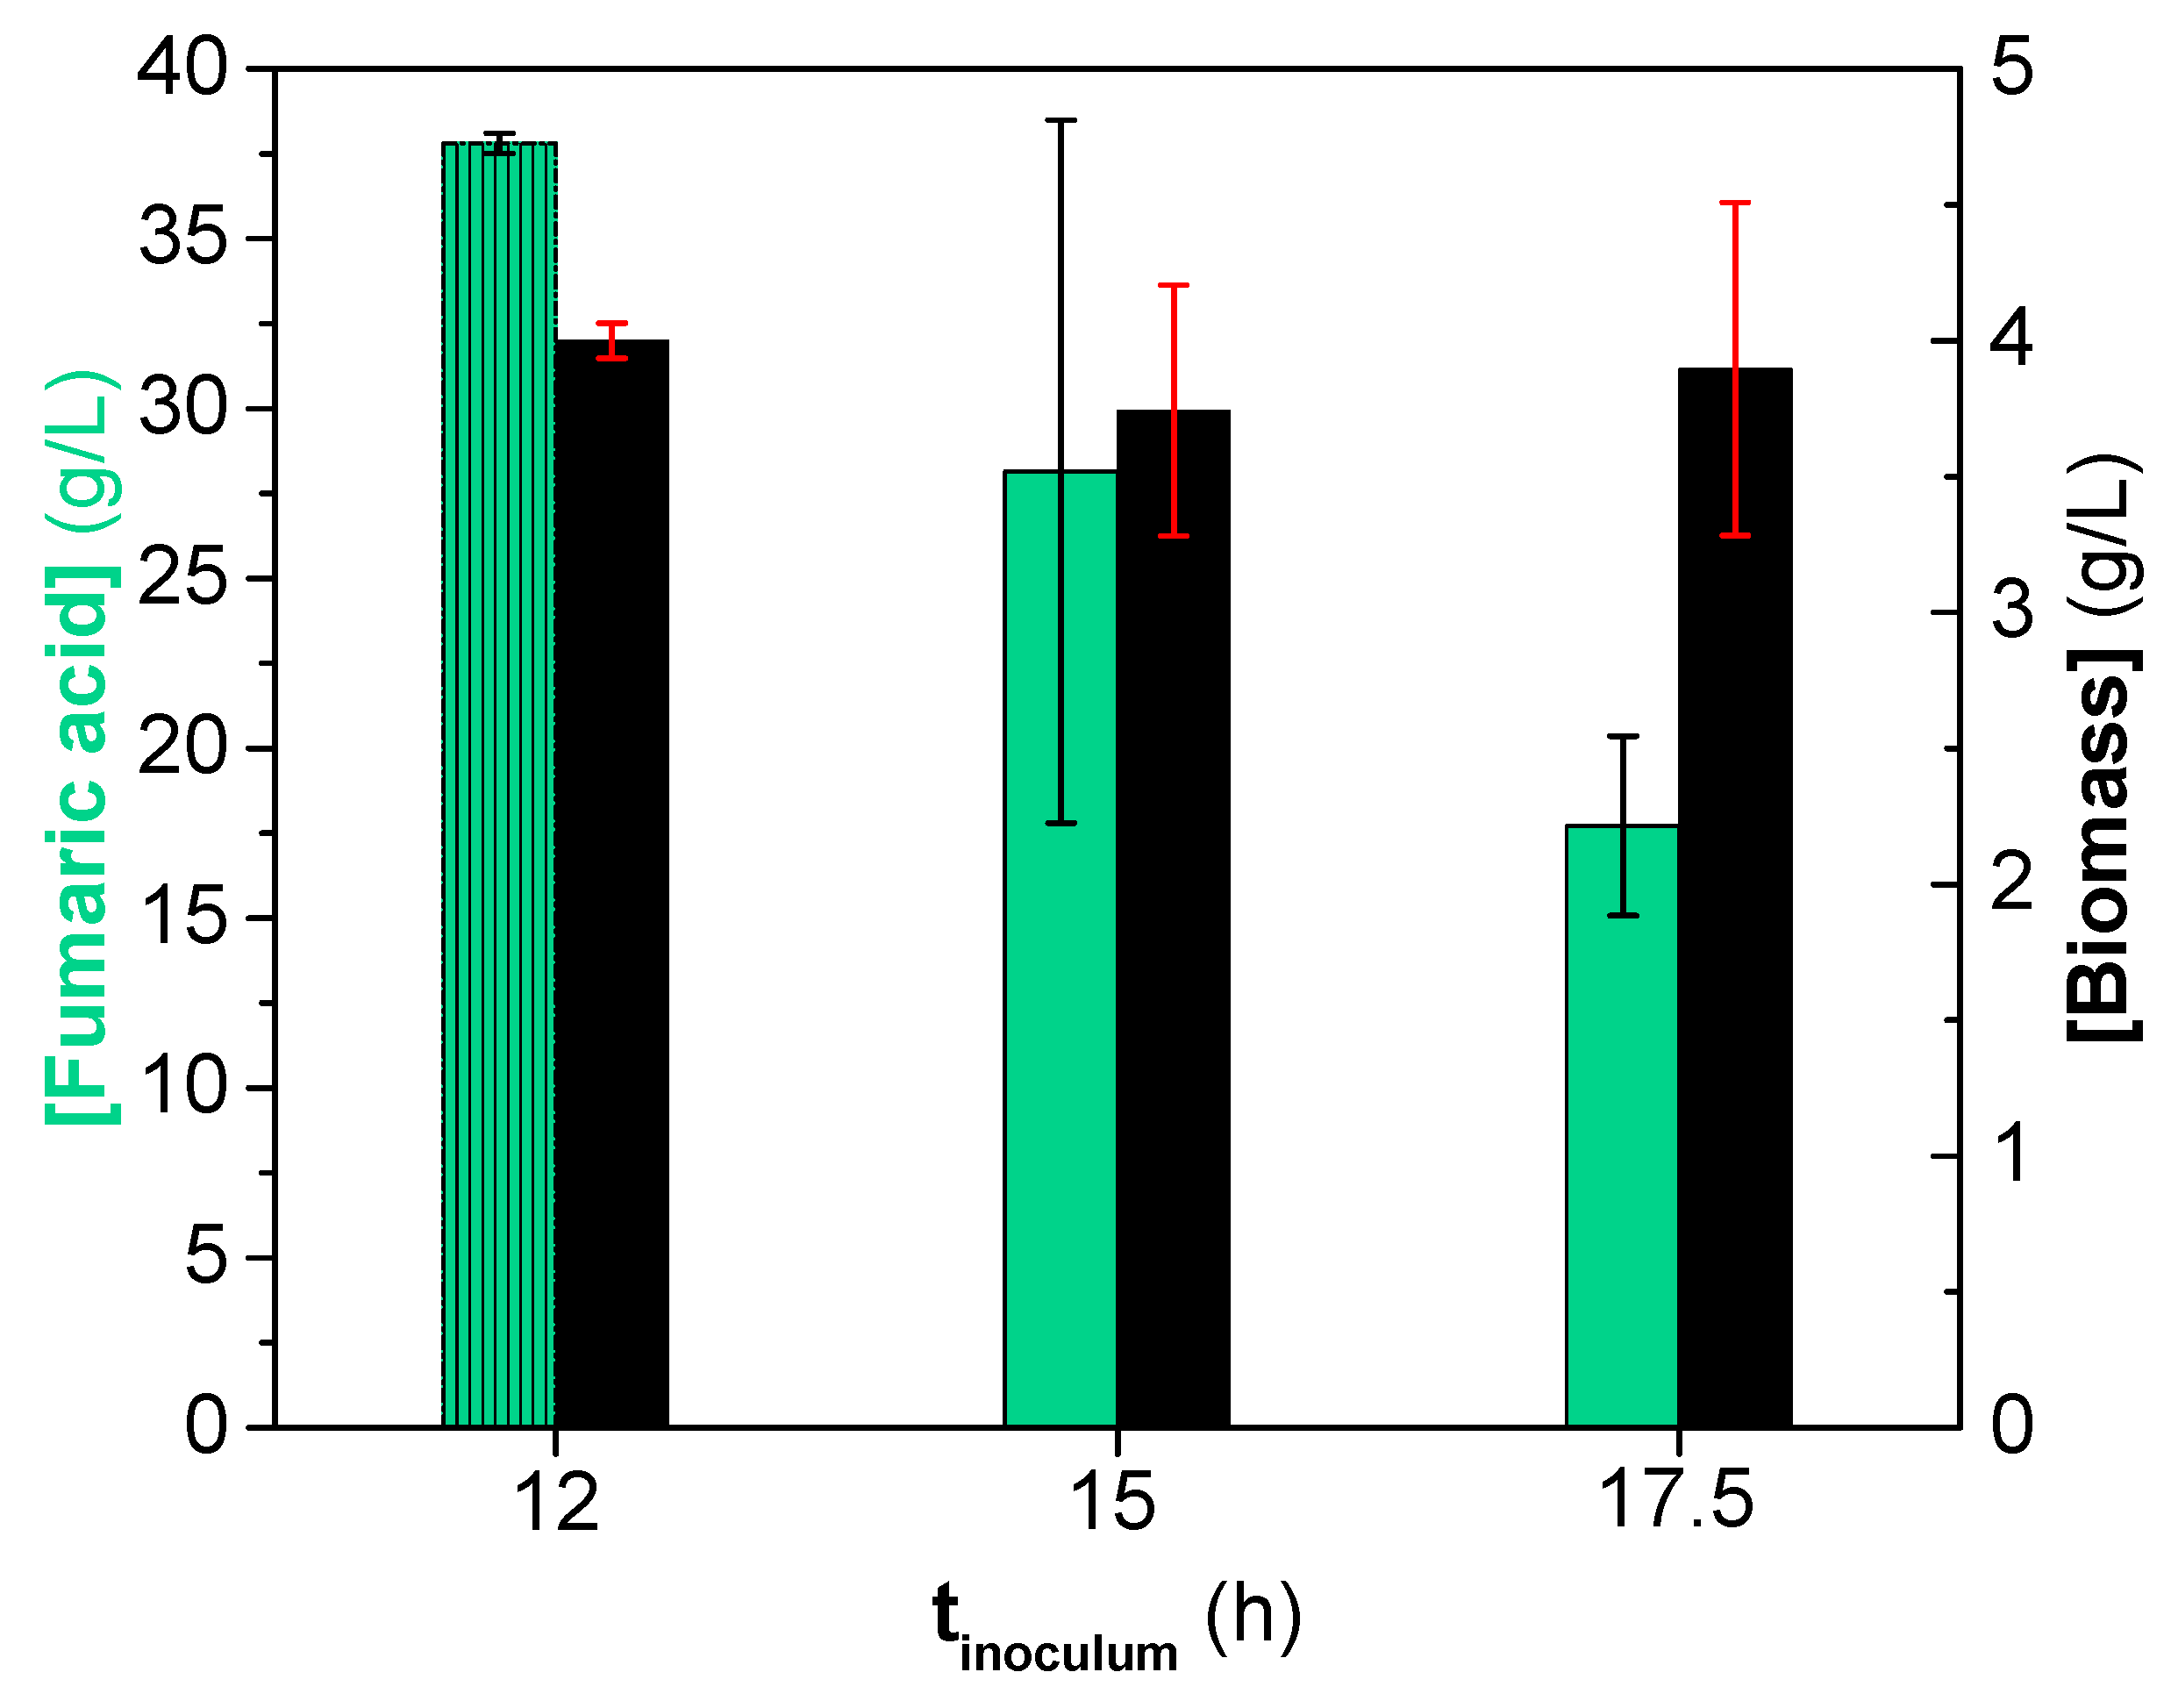
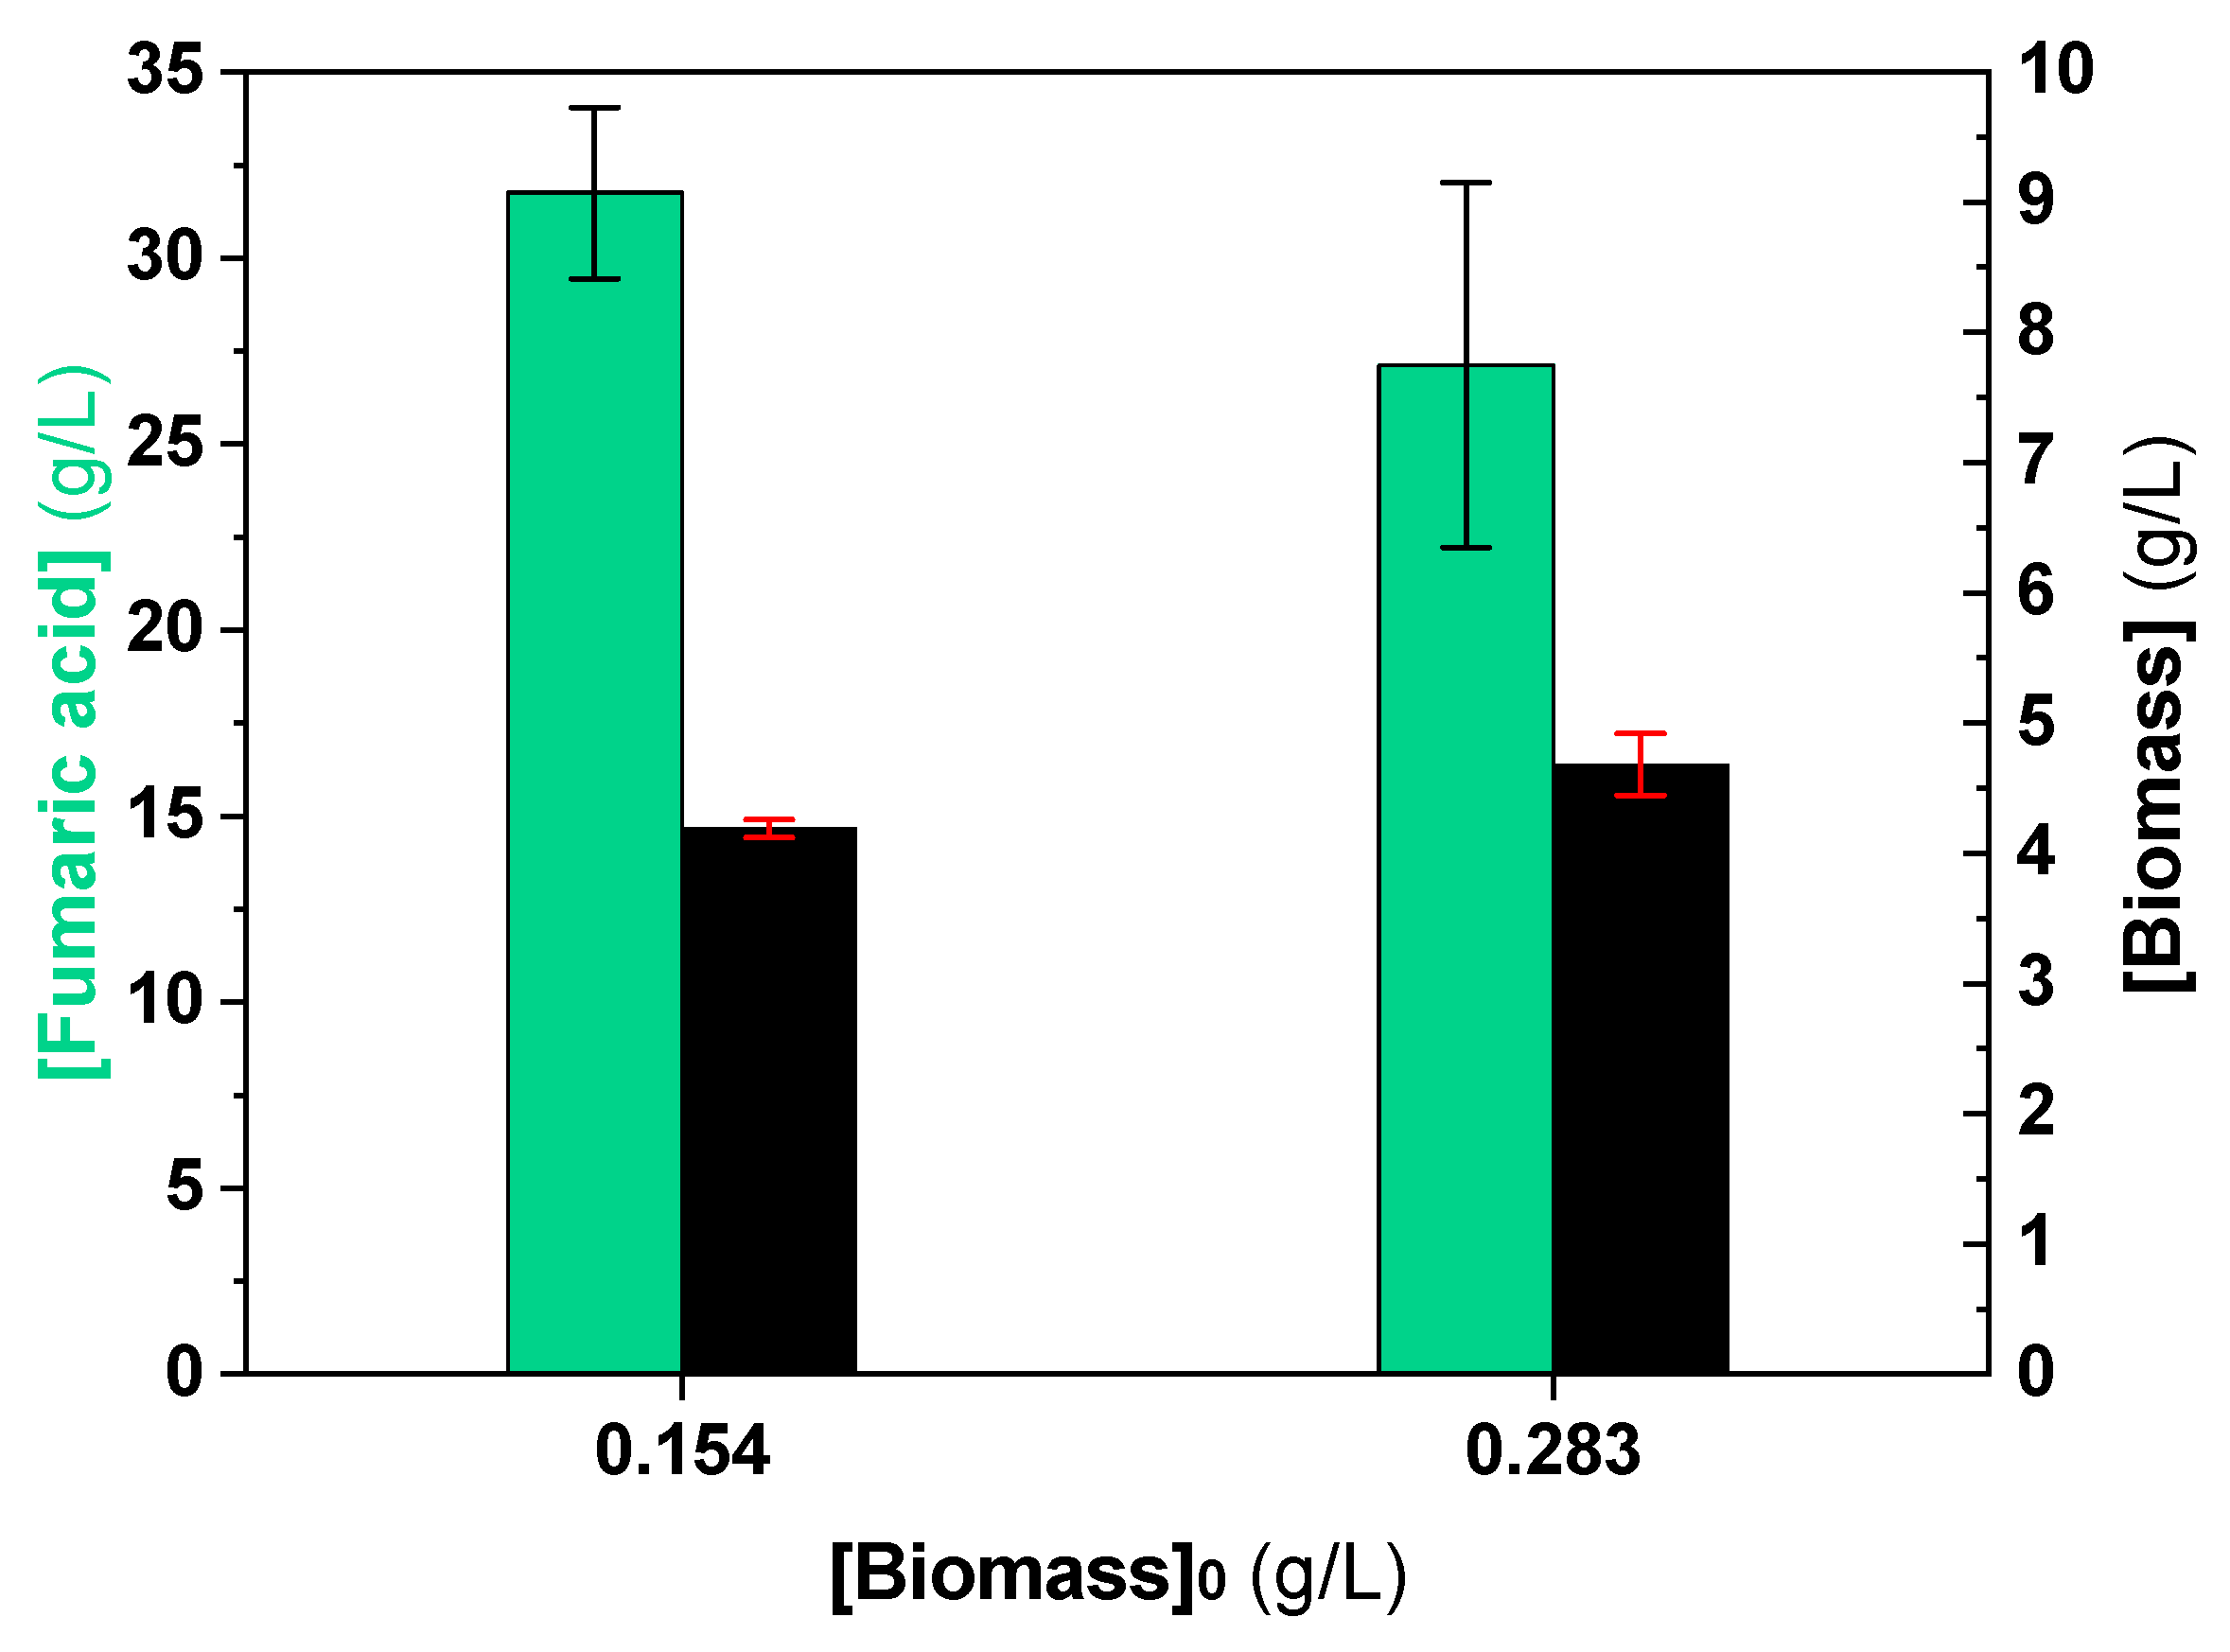
3.3. Influence of Inoculum Stages on Fumaric Acid Production

As can be deduced from the previous results, fumaric acid production is profoundly affected by pH. Two production runs were performed using conditions established in the previous experiments and using either medium C, as described in Section 2.2, or a modified medium C with no CaCO3 content. In these runs, fumaric acid was only produced when CaCO3 was present, avoiding a pH drop below 6. Once fumaric acid, as the main product, was obtained, the effect of certain parameters related to inoculum addition in the production stage were studied.
A first question to be answered concerns the number of previous stages that must be done previously to the production of the acid. On certain bacterial processes, it is known that the use of two previous stages (called inoculum and pre-inoculum) can be beneficial for reaching a proper metabolic state and, as a consequence, the desired product concentration is maximized [24,25,26]. In Figure 5, it can be seen how this procedure is not applicable to this fungal process. This could be explained by the lower initial biomass concentration in the production stage when using two inoculum phases instead of only one (0.154 g/L were inoculated in the production phase in this last case instead of 0.092 g/L inoculated to production flasks when using two in-series previous stages) (Figure 4b). This loss of biomass in the second inoculum could be an effect of a certain metabolic lethargy, a possible consequence of the pH damage hypothesized in previous experiments.
A possible response to this progressive biomass productivity degradation, with an increasing number of growth stages for inoculum production, was to use biomass directly produced in Petri dishes with medium A (sporulation) to inoculate medium C containing flasks, so as to produce fumaric acid. In Figure 5, it can be perceived that this strategy did not work. Possibly, the fungus morphology was not well developed, so the biomass had not reached a metabolic state suitable for fumaric acid production in medium C.
When the proper number of previous stages was selected; the length of this previous stage could be determined. If comparing results in Figure 4a,b, the existence of a pH inhibition on the inoculum stage can be inferred, especially at pH values lower than 2. Therefore, a lengthy exposition of biomass to low pH values is detrimental to fumaric acid production and biomass should be separated before reaching such a low pH.
Inoculum time was set on 12 h for later production experiments because, at this time, the pH value is over 2 and the biomass, in the first exponential phase, has a proper concentration ready to be inoculated in the production stage. In these conditions, a promising fumaric acid concentration was reached within a five-day production process (Figure 6).
The last parameter studied was the initial biomass concentration on production stage. In Figure 7, the results of fumaric acid production at 5 days are available. It is evident that a high initial biomass inoculum does not necessarily mean a high fumaric acid titer, but it is just the opposite. More biomass in the inoculum means a slightly higher biomass at the end of the production stage, but a notably lower fumaric acid titer, suggesting a swift of the carbon flux towards the aerobic metabolism, reducing C consumption in the fermentative pathways.

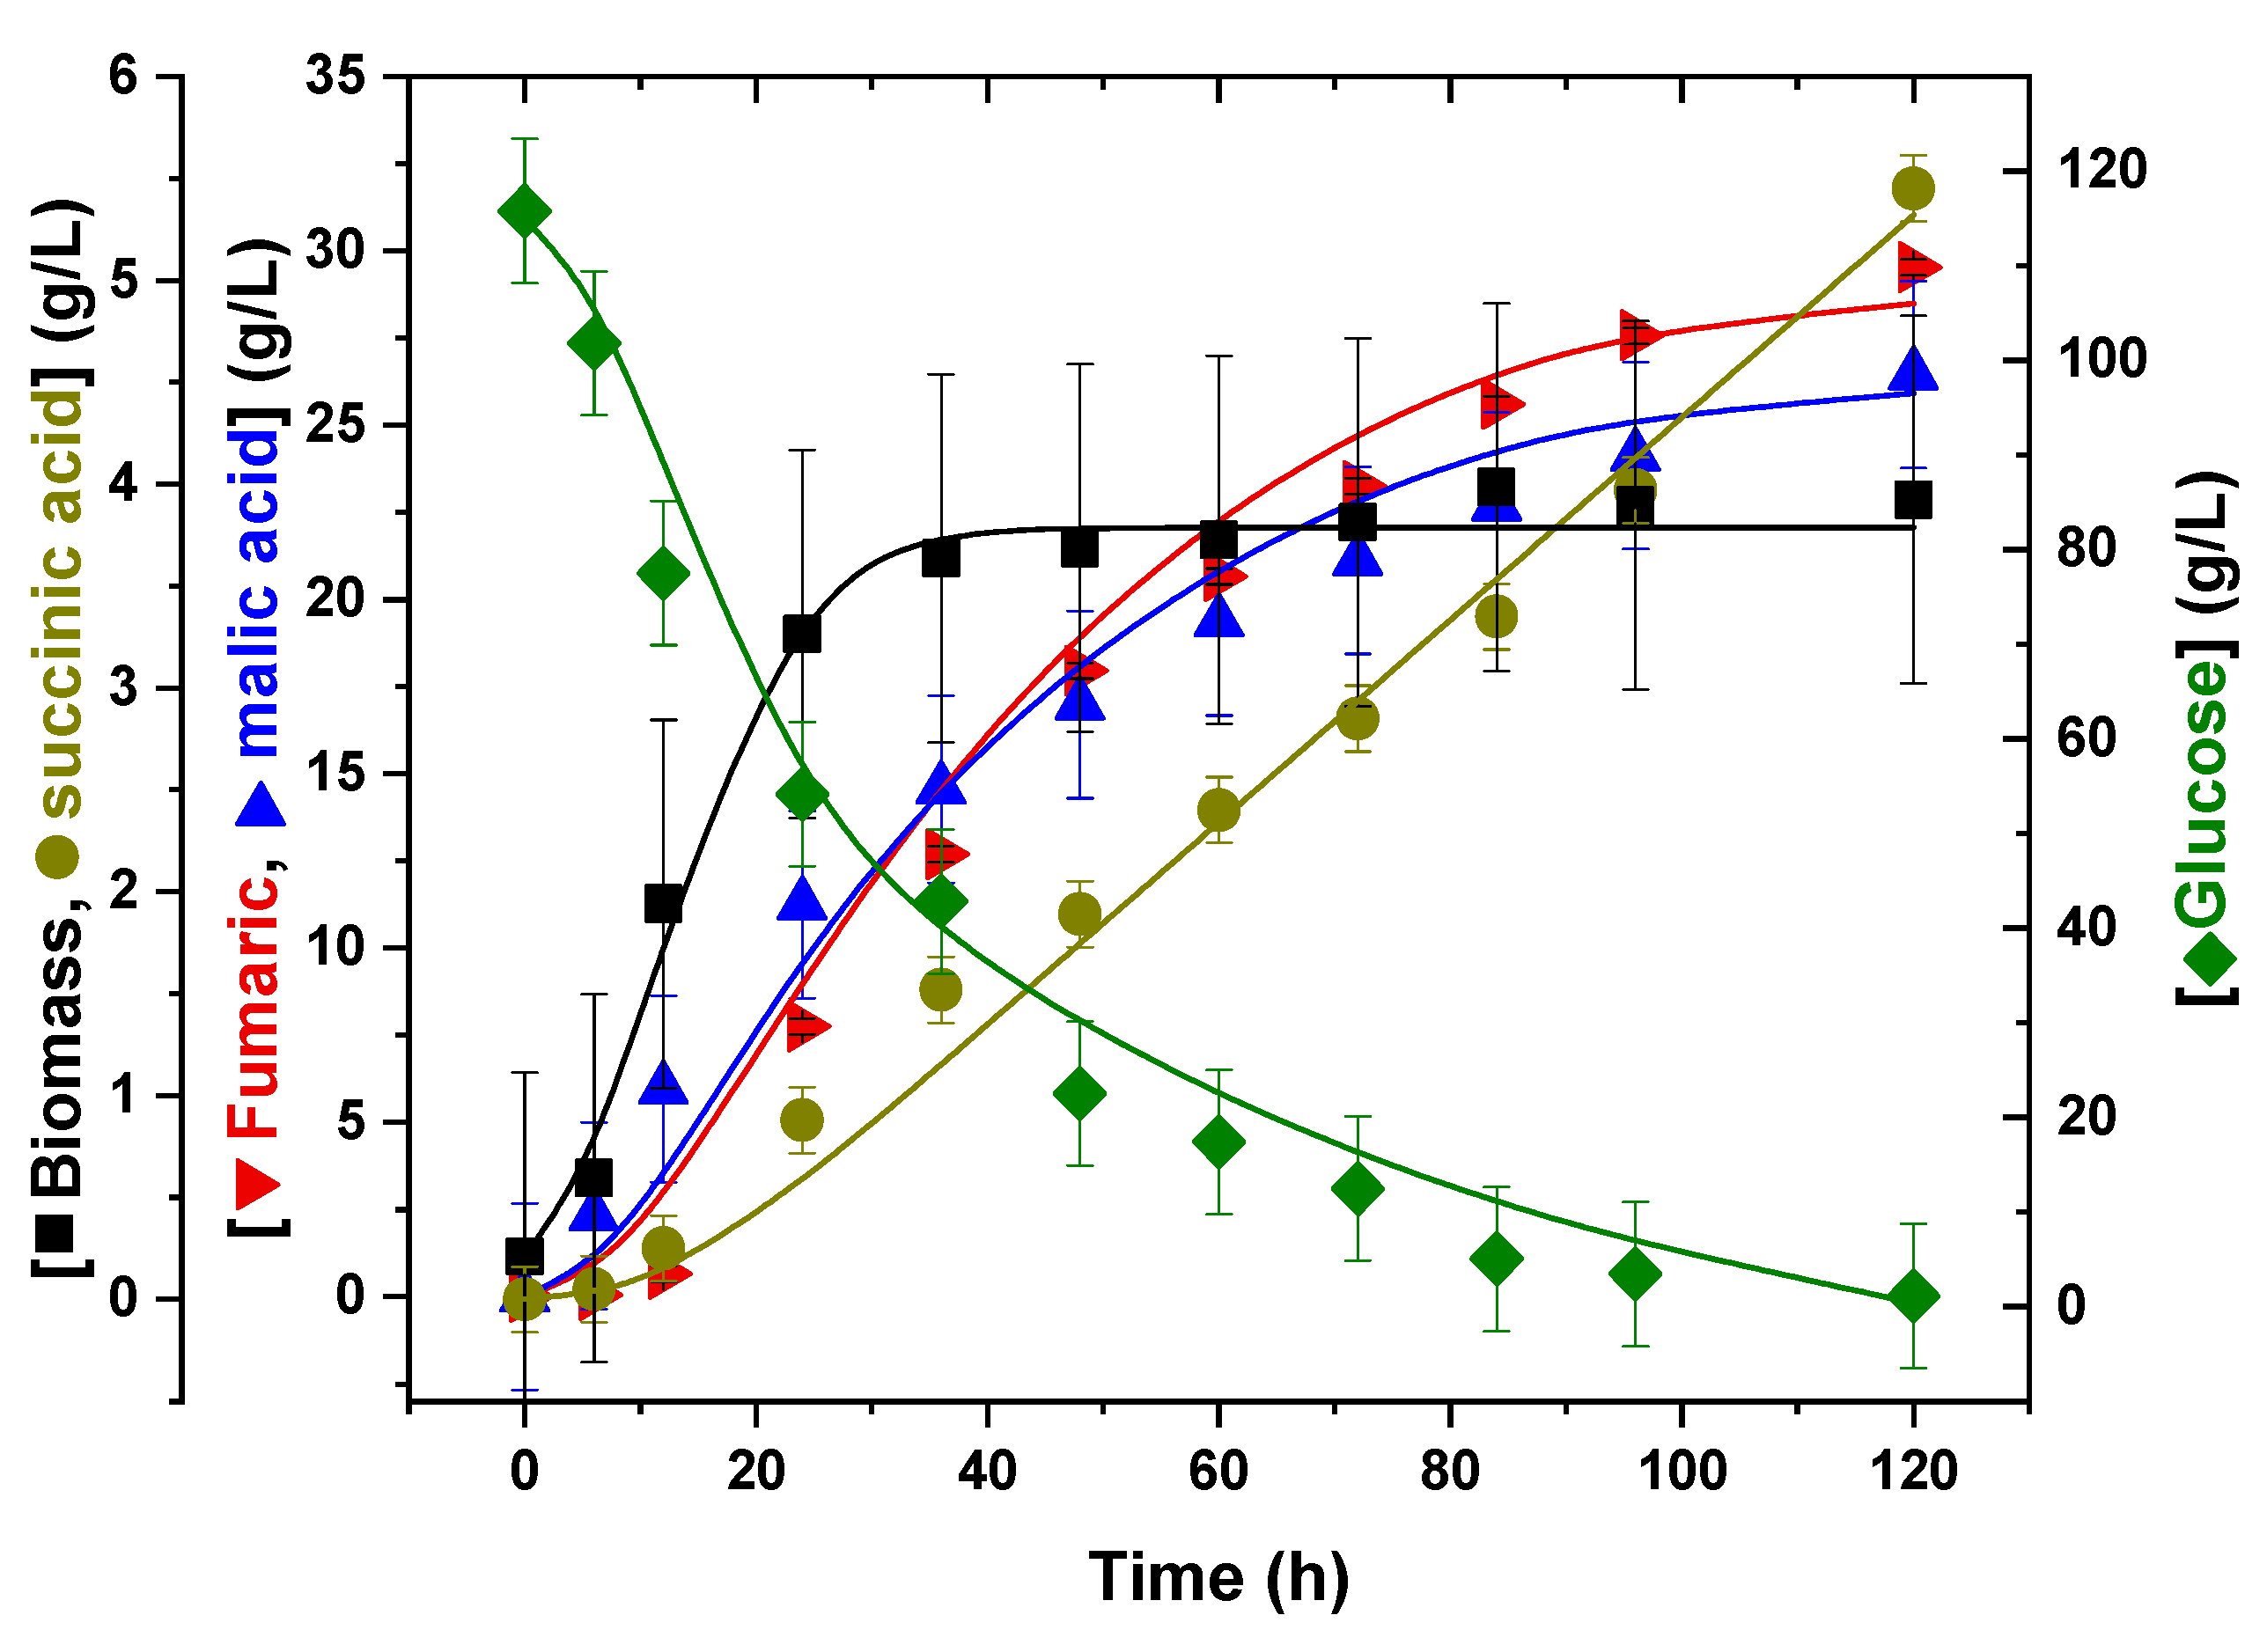
3.4. Kinetic Modelling

After selecting the proper working conditions to obtain an adequate inoculum, an experiment of fumaric acid production in medium C to obtain kinetic data was performed in triplicate. The concentrations of major components as glucose (the carbon source), fungal biomass (the biocatalyst), fumaric acid (the product of interest) and other acids, such as malic and succinic (the by-products), were followed by ion-exclusion HPLC and dry weight determination. Their evolution with the process time is displayed in Figure 8.
On the first hand, glucose, the carbon source, is totally consumed by the fungus in 5 days. However, Rhizopus only grows during the first 48 h, so the process is partially associated with biomass growth. Likewise, acid production happens during the whole process, though most of it is obtained within the biomass stationary phase (66% of all acid production, regardless of the acid considered). Glucose is mainly consumed in the exponential or growth phase (66% of all glucose), so most of it is derived towards biomass growth or respiration (TCA cycle).
As in other studies [8,17,22], the presence of some by-products have been detected. The major by-product was identified as malic acid (C4H6O5), as malic and fumaric acid concentrations are very similar [8]. Succinic acid (C4H6O4) was identified as the minor by-product; its presence could be due to the release of this compound from the cytoplasm and from mitochondria, as a major component in the TCA cycle. No ethanol was present in this occasion, though it is observed in other works as a by-product that is produced during biomass growth and disappears in the stationary phase [17,22]. Apart from this, results are very similar to those obtained in other studies [8].
With this information, a simple unstructured unsegregated kinetic model was proposed defining the reaction rate of every reaction proposed on the network:
Biomass growth:
Y GX   C 6 H 12 O 6     X     r 1 = R X = μ · C X · ( 1 C X C Xm )
Maintenance:
C 6 H 12 O 6 Energy r 2 = m S · C X
Fumaric acid production:
Y GF   C 6 H 12 O 6 C 4 H 4 O 4 r 3 = R F = k F · C G · C X
Malic acid production:
Y GM   C 6 H 12 O 6 C 4 H 6 O 5 r 4 = R M = k M · C G · C X + Y MX · R X
Succinic acid production:
Y GS   C 6 H 12 O 6 C 4 H 6 O 4 r 5 = R S = k S · C X
Finally, combining the different rates the production or consumption reaction rates could be obtained. In the case of biomass growth and acids production, the reaction rates are the same as those described in Equations (5), (7)–(9), with the maintenance term being considered in Equation (6). For glucose consumption, the reaction rate is shown in Equation (10) obtained from combination of different production rates and the glucose consumption associated to maintenance (Equation 6):
Glucose consumption:
R G = Y GX · R X m S · C X Y GF · R F Y GM · R M Y GS · R S
Biomass growth was described using a logistic equation (Equation (10)); the one that showed the best fit of a set of sigmoidal growth functions commonly used with microbial growth.
To define the partial reaction rates, a partially associated production of malic acid is supposed, due to its evolution along the exponential growth phase, having a high production rate at the beginning of the process, which is reduced when the microorganism arrives at the stationary state. According to the model, parameter YMX is defined as the dependence of malic acid formation associated with biomass growth.
As for fumaric and succinic acids, they are supposed to be produced in a non-associated fashion, as suggested by their temporal evolutions, shown in Figure 8, in which it can be seen that there is a lag time in the production of these acids and that the production rates are not affected by the different phases of microbial growth. Succinic acid production rates have been defined as only dependent on the biomass concentration because their production rate is almost constant along time once it starts to be produced, even if the glucose is almost consumed.
For fumaric and succinic acids production and for the non-associated component on malic acid production, reaction rate coefficients kF, kS, and kM have been defined.
In addition, glucose consumption parameters linked to production of acids (biomass: YGX; fumaric acid: YGF; malic acid: YGM and succinic acid: YGS) are defined as the distributions of the carbon fluxes to different productions.
Using Aspen Custom Modeler V10® for fitting the model to obtained data, values for the the parameters were obtained (Table 2), while the fitting results were represented in Figure 8. As shown in this figure, the model fits properly to the experimental results, a fact that is confirmed by the value of the different statistical parameters obtained after kinetic modelling.
Results in Table 2 show reasonable error intervals for the parameters, while the values of kinetic constants confirm a notable swift of glucose, as the carbon source, towards the production of energy and a lower trend to be converted to acids, even to fumaric acid. A comparison of kF and kM indicates that (a) they are an order of magnitude lower than mS and (b) they are very similar, so the fungus is a good producer of both acids (evident also in Figure 8), as the carbon flux is distributed between both productions in a very similar way. The value of kS is an order of magnitude higher than kF and kM, due to being only dependent on the biomass concentration, but not on the glucose concentration. Thus, the reaction rate to succinic acid is one order of magnitude lower than those related to fumaric and malic acid and it is independent of the glucose concentration (order zero with respect to this substrate), showing either saturation of enzymes in the succinic acid route or succinic acid production on other carbon source (e.g., those contained in complex nitrogen sources in medium C). This last explanation is less probable, as only minute amounts of carbon are introduced in the production medium through tartaric acid and corn steep liquor, so enzyme saturation with glucose in the route to succinic acid seems like a good explanation for succinic acid production trends.
Regarding the values of kinetic parameters concerning malic acid, we remark how its production is mostly due to a non-associated component, supposing more than 65% of the total contribution on the lowest result. This fact is observed by comparing the values of both components of the malic acid reaction rate (Equation (8)) and how the obtained values of each parameter in both components provide higher contributions, due to the non-associated component to malic acid production, which has an even higher contribution as the process proceeds. The yield obtained for fumaric acid production supposes a 24.12%, with respect to the maximum theory, that could be reached from glucose (1.29 gfumaric acid/gconsumed glucose). However, a notable production of malic acid is also obtained (0.23 gmalic acid/gconsumed glucose), so 0.58 g/gconsumed glucose of both organic acids, in sum, are produced in these conditions, with malic acid being a coproduct. Malic acid is also obtained from fumaric acid by chemical and biotechnological means, being a food acidifier with a notable market share (10%), due to its high acidity and solubility [18]. These dicarboxylic acids can be separated between them and from glucose by combining adsorption on activated carbon, where fumaric acid can be recovered up to 200 mg/g of solid, followed by the removal of the adsorbed acid with acetone [30,31].
Finally, the maximum specific fungal growth rate could be compared with values found in the literature. Values obtained during this research are very similar but slightly lower to those in similar papers [19].
Regarding Table 3, where the values of the goodness-of-fit parameters are collected, it is remarkable how low the values of SSR and RMSE are, highlighting the low accumulative error present in the model. The value of F95 is high compared with tabulated values at 95% confidence, confirming the good fit of the model and its statistical significance (i.e., the null hypothesis is overcome and the mathematical model significantly fits the experimental data). Finally, the value of VE indicates that the model explains almost all the variation of the concentrations of the components with the process time (a 98.12% of this variation).
Therefore, we can conclude that the proposed model fits adequately to the experimental data and can explain several trends that were observed. In this way, further studies about fumaric acid production maximization, looking for the minimization of by-products (malic acid overall), will show, by comparison of the kinetic parameters coming from the application of this, or similar, models, how such improvements are reflected in them. This would facilitate the scaling-up of the process, progressively including the effects of relevant physical phenomena not influencing lower scales and the effect of including new, and more economical, carbon sources from food waste hydrolysates.

4. Conclusions

In this study, a preliminary search for an adequate biomass and inoculum conditions permits to conclude that only one phase of the inoculum development is adequate to reach suitable fumaric acid yields and should be started with 109 spores/L, that grow into pellets at 34 °C for 12 h to reach a pH slightly higher than 2. When 0.154 g/L of the biomass are inoculated in medium C, fumaric and malic acid are coproduced from 120 g/L glucose, reaching 30 and 25 g/L of each dicarboxylic acid, respectively. A simple kinetic model with a logistic equation for the biomass growth and potential kinetic equations for the substrate and the products, including the less produced succinic acid, fits well to the data from several production experiments in medium C at 34 °C, according to all goodness-of-fit parameters used in this study. The model, and a previously set reaction scheme, show that most glucose is used for biomass maintenance, but yields to fumaric and malic acid are appreciable.

Supplementary Materials

The following are available online at https://www.mdpi.com/2227-9717/8/2/188/s1.

Author Contributions

Conceptualization, V.E.S. and M.L.; data curation, V.M.-D. and M.L.; formal analysis, V.E.S.; funding acquisition, V.E.S. and M.L.; investigation, V.M.-D., L.B.-S. and N.M.-P.; methodology, V.M.-D., L.B.-S., N.M.-P. and V.E.S.; project administration, M.L.; software, V.M.-D.and M.L.; supervision, V.E.S.; validation, M.L.; writing—original draft, V.M.-D. and M.L.; writing—review and editing, V.E.S. and M.L. All authors have read and agreed to the published version of the manuscript.

Funding

This research has been funded by the Spanish Science Innovation and Universities Ministry through contract CTQ2017-84963-C2-1-R and scholarship PRE2018-084908.

Acknowledgments

We also express our gratitude to Laslo Eidt, Anja Kuenz, and Ulf Pruesse for their generous support in the development of the bioprocess through numerous discussions and counsel and for supplying the strain NRRL 1526 of Rhizopus arrhizus.

Conflicts of Interest

The authors declare no conflict of interest.

Nomenclature

CGGlucose concentration (gglucose/L)
CxBiomass concentration (gbiomass/L)
CXmBiomass concentration at stationary phase (logistic equation parameter) (gbiomass/L)
F95Fisher distribution parameter with 95% confident
HPLCHigh Performance Liquid Chromatography
tTime (h)
mSReaction rate coefficient of maintenance reaction (L∙h−1∙gbiomass−1)
kFReaction rate coefficient of fumaric acid production (gfumaric acid∙L∙h−1∙gglucose−1∙gbiomass−1)
kMReaction rate coefficient of malic acid production
(gmalic acid∙L∙h−1∙gglucose−1∙gbiomass−1)
kSReaction rate coefficient of succinic acid production (gsuccinic acid∙L∙h−1∙gbiomass−1)
r1Reaction rate of reaction 1 (biomass production) (gbiomass/(L∙h))
r2Reaction rate of reaction 2 (maintenance reaction) (-gglucose/(L∙h))
r3Reaction rate of reaction 3 (fumaric acid production) (gfumaric acid/(L∙h))
r4Reaction rate of reaction 4 (malic acid production) (gmalic acid/(L∙h))
r5Reaction rate of reaction 5 (succinic acid production) (gsuccinic acid/(L∙h))
RMSERoot Mean Squared Error
RFReaction rate of fumaric acid production (gfumaric acid/(L∙h))
RGReaction rate of glucose consumption (gglucose/(L∙h))
RMReaction rate of malic acid production (gmalic acid/(L∙h))
RSReaction rate of succinic acid production (gsuccinic acid/(L∙h))
RXReaction rate of biomass production (gbiomass/(L∙h))
SSRSum of Squared Residuals
YGFGlucose consumption to fumaric acid production parameter
(gglucose/gfumaric acid)
YGMGlucose consumption to malic acid production parameter (gglucose/gmalic acid)
YGSGlucose consumption to succinic acid production parameter (gglucose/gsuccinic acid)
YGXGlucose consumption to biomass production parameter (gglucose/gbiomass)
YMXMalic acid production associated to biomass growth parameter
(gmalic acid/gbiomass)
VEVariation Explained (%)
WWIIWorld War II
µSpecific growth rate (h−1)

References

  1. Parajuli, R.; Dalgaard, T.; Jørgensen, U.; Adamsen, A.P.S.; Knudsen, M.T.; Birkved, M.; Gylling, M.; Schjørring, J.K. Biorefining in the prevailing energy and materials crisis: A review of sustainable pathways for biorefinery value chains and sustainability assessment methodologies. Renew. Sustain. Energy Rev. 2015, 43, 244–263. [Google Scholar] [CrossRef] [Green Version]
  2. Moncada, B.J.; Aristizábal, M.V.; Cardona, A.C.A. Design strategies for sustainable biorefineries. Biochem. Eng. J. 2016, 116, 122–134. [Google Scholar] [CrossRef]
  3. Nanda, S.; Rana, R.; Sarangi, P.K.; Dalai, A.K.; Kozinski, J.A. A broad introduction to first-, second-, and third-generation biofuels. Recent Adv. Biofuels Bioenergy Util. 2018, 1–25. [Google Scholar] [CrossRef]
  4. Straathof, A.J.J.; Wahl, S.A.; Benjamin, K.R.; Takors, R.; Wierckx, N.; Noorman, H.J. Grand Research Challenges for Sustainable Industrial Biotechnology. Trends Biotechnol. 2019, 37, 1042–1050. [Google Scholar] [CrossRef] [PubMed]
  5. Esteban, J.; Ladero, M. Food waste as a source of value-added chemicals and materials: A biorefinery perspective. Int. J. Food Sci. Technol. 2018, 53, 1095–1108. [Google Scholar] [CrossRef]
  6. Sebastian, J.; Hegde, K.; Kumar, P.; Rouissi, T.; Brar, S.K. Bioproduction of fumaric acid: An insight into microbial strain improvement strategies. Crit. Rev. Biotechnol. 2019, 39, 817–834. [Google Scholar] [CrossRef] [PubMed]
  7. Sheppard, P.; Garcia-Garcia, G.; Angelis-Dimakis, A.; Campbell, G.M.; Rahimifard, S. Synergies in the co-location of food manufacturing and biorefining. Food Bioprod. Process. 2019, 117, 340–359. [Google Scholar] [CrossRef]
  8. Martin-Dominguez, V.; Estevez, J.; De Borja Ojembarrena, F.; Santos, V.E.; Ladero, M. Fumaric acid production: A biorefinery perspective. Fermentation 2018, 4, 33. [Google Scholar] [CrossRef] [Green Version]
  9. Roa Engel, C.A.; Straathof, A.J.J.; Zijlmans, T.W.; Van Gulik, W.M.; Van Der Wielen, L.A.M. Fumaric acid production by fermentation. Appl. Microbiol. Biotechnol. 2008, 78, 379–389. [Google Scholar] [CrossRef] [Green Version]
  10. Werpy, T.; Petersen, G. Top Value Added Chemicals from Biomass Volume I—Results of Screening for Potential Candidates from Sugars and Synthesis Gas Energy Efficiency and Renewable Energy; Northwest Natl. Lab.: Golden, CO, USA, 1992.
  11. Figueira, D.; Cavalheiro, J.; Sommer Ferreira, B. Purification of polymer-grade fumaric acid from fermented spent sulfite liquor. Fermentation 2017, 3, 13. [Google Scholar] [CrossRef] [Green Version]
  12. Papadaki, A.; Papapostolou, H.; Alexandri, M.; Kopsahelis, N.; Papanikolaou, S.; de Castro, A.M.; Freire, D.M.G.; Koutinas, A.A. Fumaric acid production using renewable resources from biodiesel and cane sugar production processes. Environ. Sci. Pollut. Res. 2018, 25, 35960–35970. [Google Scholar] [CrossRef] [PubMed]
  13. Rhodes, R.A.; Moyer, A.J.; Smith, M.L.; Kelley, S.E. Production of fumaric acid by Rhizopus arrhizus. Appl. Microbiol. 1959, 7, 74–80. [Google Scholar] [CrossRef] [PubMed] [Green Version]
  14. Rhodes, R.A.; Lagoda, A.A.; Misenheimer, T.J.; Smith, M.L.; Anderson, R.F.; Jackson, R.W. Production of Fumaric Acid in 20-Liter Fermentors. Appl. Microbiol. 1962, 10, 9–15. [Google Scholar] [CrossRef] [PubMed] [Green Version]
  15. Ling, L.; Ng, T. Fermentation Process for Carboxylic Acids. US Patent 4,877,731, 31 October 1989. [Google Scholar]
  16. Xu, Q.; Li, S.; Huang, H.; Wen, J. Key technologies for the industrial production of fumaric acid by fermentation. Biotechnol. Adv. 2012, 30, 1685–1696. [Google Scholar] [CrossRef]
  17. Eidt, L.; Kuenz, A.; Prüße, U. Biotechnologische produktion von fumarsäure: Prozessoptimierung und kontrolle der morphologie. Chemie Ing. Technik 2018, 90, 1272. [Google Scholar] [CrossRef] [Green Version]
  18. Naude, A.; Nicol, W. Malic acid production through the whole-cell hydration of fumaric acid with immobilised Rhizopus oryzae. Biochem. Eng. J. 2018, 137, 152–161. [Google Scholar] [CrossRef]
  19. Sun, C.; Xu, L.; Chen, X.; Qiu, T.; Zhou, T. Sustainable recovery of valuable metals from spent lithium-ion batteries using DL-malic acid: Leaching and kinetics aspect. Waste Manag. Res. 2018, 36, 113–120. [Google Scholar] [CrossRef]
  20. Pinto Carneiro, S.; Moine, L.; Tessier, B.; Nicolas, V.; dos Santos, O.; dos Santos, D.H.; Fattal, E. Pyrazinoic acid-Poly(malic acid) biodegradable nanoconjugate for efficient intracellular delivery. Precis. Nanomed. 2019, 2, 303–317. [Google Scholar] [CrossRef] [Green Version]
  21. Castro, V.I.; Mano, F.; Reis, R.L.; Paiva, A.; Duarte, A.R.C. Synthesis and physical and thermodynamic properties of lactic acid and malic acid-based natural deep eutectic solvents. J. Chem. Eng. Data 2019, 63, 2548–2556. [Google Scholar] [CrossRef]
  22. Naude, A.; Nicol, W. Fumaric acid fermentation with immobilised Rhizopus oryzae: Quantifying time-dependent variations in catabolic flux. Process Biochem. 2017, 56, 8–20. [Google Scholar] [CrossRef]
  23. Zhang, K.; Yang, S.T.; Chalmers, J.J.; Wood, D. Fumaric Acid Fermentation by Rhizopus oryzae with Integrated Separation Technologies. Ph.D. Thesis, The Ohio State University, Columbus, OH, USA, 2012; pp. 1–210. [Google Scholar]
  24. Acedos, M.G.; Ramon, A.; de la Morena, S.; Santos, V.E.; Garcia-Ochoa, F. Isobutanol production by a recombinant biocatalyst Shimwellia blattae (p424IbPSO): Study of the operational conditions. Biochem. Eng. J. 2018, 133, 21–27. [Google Scholar] [CrossRef]
  25. De la Morena, S.; Acedos, M.G.; Santos, V.E.; Garcia-Ochoa, F. Dihydroxyacetone production from glycerol using Gluconobacter oxydans: Study of medium composition and operational conditions in shaken flasks. Biotechnol. Prog. 2019, 35, e2803. [Google Scholar] [CrossRef] [PubMed]
  26. De la Torre, I.; Ladero, M.; Santos, V.E. Production of d-lactic acid by Lactobacillus delbrueckii ssp. delbrueckii from orange peel waste: Techno-economical assessment of nitrogen sources. Appl. Microbiol. Biotechnol. 2018, 102, 10511–10521. [Google Scholar] [PubMed]
  27. Zhang, K.; Yu, C.; Yang, S.T. Effects of soybean meal hydrolysate as the nitrogen source on seed culture morphology and fumaric acid production by Rhizopus oryzae. Process Biochem. 2015, 50, 173–179. [Google Scholar] [CrossRef]
  28. Papadaki, A.; Androutsopoulos, N.; Patsalou, M.; Koutinas, M.; Kopsahelis, N.; de Castro, A.M.; Papanikolaou, S.; Koutinas, A.A. Biotechnological production of fumaric acid: The effect of morphology of Rhizopus arrhizus NRRL 2582. Fermentation 2017, 3, 33. [Google Scholar] [CrossRef] [Green Version]
  29. Zhou, Z.; Du, G.; Hua, Z.; Zhou, J.; Chen, J. Optimization of fumaric acid production by Rhizopus delemar based on the morphology formation. Biores. Technol. 2011, 102, 9345–9349. [Google Scholar] [CrossRef]
  30. Zhang, K.; Zhang, L.; Yang, S.T. Fumaric acid recovery and purification from fermentation broth by activated carbon adsorption followed with desorption by acetone. Ind. Eng. Chem. Res. 2014, 53, 12802–12808. [Google Scholar] [CrossRef]
  31. Cao, N.; Du, J.; Gong, C.S.; Tsao, G.T. Simultaneous production and recovery of fumaric acid from immobilized Rhizopus oryzae with a rotary biofilm contactor and an adsorption column. Appl. Environ. Microbiol. 1996, 62, 2926–2931. [Google Scholar] [CrossRef] [Green Version]
Figure 1. General process strategies from lignocellulosic biomass in food wastes to fumaric acid.
Processes 08 00188 g001
Figure 2. Different morphologies depending on initial spore concentration.
Processes 08 00188 g002
Figure 3. Biomass evolution with time showing Rhizopus arrhizus inoculum growth in medium B at several temperatures.
Processes 08 00188 g003
Figure 4. Rhizopus arrhizus NRRL 1526 first (a) and second (b) inoculum stages growth at 34 °C and free pH evolution in medium B.
Processes 08 00188 g004
Figure 5. Number of previous stages determination.
Processes 08 00188 g005
Figure 6. Inoculum age determination looking for fumaric acid production maximization by avoiding pH damage and biomass reduction.
Processes 08 00188 g006
Figure 7. Results of fumaric acid (green) and biomass (black) concentrations using different initial biomass concentration during inoculation.
Processes 08 00188 g007
Figure 8. Evolution of biomass, glucose, and products during the production stage. Lines show the fit of the proposed kinetic model to all retrieved data.
Processes 08 00188 g008
Table 1. Culture media used [13,15].
Medium A Medium BMedium C
ComponentConcentration
(g/L)
ComponentConcentration
(g/L)
Concentration
(g/L)
Glucose4Glucose40130
Urea0.6(NH4)2SO441.8
MgSO4·7H2O0.3MgSO4·7H2O0.40.4
ZnSO4·7H2O0.088ZnSO4·7H2O0.0440.44
K2PO40.4K2PO41.60.3
FeSO4·7H2O0.25FeCl3·6H2O0.00750.0075
CuSO4·5H2O0.00782Tartaric acid0.00840.0075
MnSO4·H2O0.038CaCO350
Lactose × H2O6.32Corn steep liquor0.5 mL/L0.5 mL/L
KCl0.4
NaCl40
Agar-agar30
Peptone1.6
Corn steep liquor1 mL/L
Glycerol10 mL/L
Table 2. Kinetic parameters of proposed model.
ParameterUnitsValue
CXmgbiomass/L3.79±0.35
h10.23±0.15
mSL∙h−1∙gbiomass−13.47 × 10⁻²±8.43 × 10⁻³
kFgfumaric acid∙L∙h−1∙gglucose−1∙gbiomass−12.80 × 10⁻³±1.25 × 10⁻³
kMgmalic acid∙L∙h−1∙gglucose−1∙gbiomass−12.29 × 10⁻³±1.81 × 10⁻³
kSgsuccinic acid∙L∙h−1∙gbiomass−11.31 × 10⁻²±3.95 × 10⁻³
YGFgglucose/gfumaric acid6.38 × 10−1±1.16 × 10⁻²
YGMgglucose/gmalic acid1.07±0.52
YGSgglucose/gsuccinic acid1.65±0.34
YGXgglucose/gbiomass14.4±3.34
YMXgmalic acid/gbiomass0.73±0.33
Table 3. Statistical parameters obtained from fitting experimental data to proposed kinetic model.
ParameterValue
Degrees of freedom45
Root Mean Square Error (RMSE)21.13
F9537.76
Variation Explained (VE) (%)98.12
Sum of Squared Residuals (SSR)359.4

