Abstract
Ice cream viscosity is one of the properties that most changes during crystallization in scraped surface heat exchangers (SSHE), and its online measurement is not easy. Its estimation is necessary through variables that are easy to measure. The temperature and power of the stirring motor of the SSHE turn out to be this type of variable and are closely related to the viscosity. Therefore, a mathematical model based on these variables proved to be feasible. The development of this mathematical relationship involved the rheological study of the ice cream base, as well as the application of a method for its in situ melting in the rheometer as a function of the temperature, and the application of a mathematical model correlating the SSHE stirring power and the ice cream viscosity. The result was a coupled model based on both the temperature and stirring power of the SSHE, which allowed for online viscosity estimation with errors below 10% for crystallized systems with a 30% ice fraction at the exit of the SSHE. The model obtained is a first step in the search for control strategies for crystallization in SSHE.
1. Introduction
In the ice cream crystallization process, viscosity is the most evolving property. This is due to the liquid transforming into a semi-solid as a result of the occurrence of ice crystals. Clarke [1] described that ice cream mixture viscosity increases for two reasons: the liquid mixture temperature decreases and the volume fraction of solid particles (ice crystals) increase. Thus, ice cream viscosity is determined by the non-frozen phase viscosity and the ice fraction generated during its freezing. For an ice cream liquid mixture, apparent viscosity values have been reported between 0.1 and 0.8 Pa∙s, at a shear rate of 115 s−1 [2,3]. For already crystallized ice cream, there are not many references about viscosity values. However, most authors agree that their rheological parameters, such as storage and loss modules (G’ and G”), increase exponentially as temperature decreases and ice fraction increases. This effect translates into an exponential viscosity increase [4,5,6].
To understand the evolution of ice cream mixture viscosity, its complex composition must be considered. In fact, ice cream is a mixture of air, water, milk fat, non-fat milk solids, sweeteners, stabilizers, emulsifiers, and flavorings. This mixture is partially frozen through water crystallization, which is the critical stage during its elaboration [1,7,8]. Thus, from a physicochemical point of view, ice cream is a complex colloidal system, considered at the same time as an emulsion, a dispersion, and a foam. These structures play an important role to determine the product quality and shelf life [9,10,11,12].
It has been determined that the rheological behavior of an ice cream corresponds to a shear thinning non-Newtonian fluid [2,13]. Furthermore, this fluid acquires a viscoelastic behavior as the temperature decreases and the concentration of the crystals increases. This change in rheological behavior is due to the complex microstructure mixture that evolves significantly with temperature changes, which is the main crystallization promoter during processing and storage recrystallization [6,9,14].
There are some studies that propose mathematical models to describe the viscosity evolution of ice cream mixtures during crystallization [13,15]. All these models are based on the viscosity estimation equation for suspensions with rigid spherical particles proposed by Einstein, as described below:
where is the apparent ice cream viscosity, is the non-frozen liquid mixture viscosity, and is the solids volumetric fraction. This model has been the basis to determine the viscosity of different suspensions at low solid concentrations [16]. Using this model as a basis and seeking to extend its range of use, Thomas proposed a modification to the Einstein equation [17]. The modified equation is expressed as follows:
This model is valid for a solid fraction up to 0.625 and for a particle size range between 0.1 and 435 μm. This equation has been widely used by several authors to study ice suspensions [13,15,18] Equation (2) has been even used to estimate viscosity evolution in ice cream production, but it has been found to be valid only for solid concentrations below 10% [16,17]. For solid concentrations higher than 10%, the authors propose a parameters readjustment. Arellano et al. (2013) measured the viscosity of a sorbet at the SSHE exit using the capillary viscometer technique. The ice fraction was estimated knowing the sorbet temperature and by considering the equilibrium liquidus curve. Hence, once experimentally determined the sorbet’s rheological parameters, using the Thomas model, the system’s apparent viscosity was estimated with an error percentage of ±20%. Benkhelifa et al. [19] measured the viscosity of sorbets and ice cream by using a rotational viscometer inserted in a batch SSHE and by applying a Couette analogy in this non-conventional geometry.
There are also studies that relate ice cream viscosity with the stirrer energy consumption inside the scraped surface heat exchangers (SSHE). These models allow to estimate the power consumption of scraping blades as a function of ice cream viscosity during crystallization. The developed models consider that mixture viscosity increases as the crystal content increases. So, a direct proportional relationship between the energy consumption of the SSHE stirrer and apparent viscosity is proposed [1]. This increase in engine power leads to a friction increase between the scrapers and the internal wall of the SSHE, requiring a complementary energy input to the system to keep a constant agitation rate during the process. This extra energy is dissipated in the ice cream and later it is also removed by the cooling system [13,17].
One of the first models that relates an SSHE system viscosity with the energy consumed was developed by Skelland and Leung [20]. The model relates the power number ( with the rotational Reynolds number () and the number of scraping vanes (F). Thus, for the freezing of a glycerol-water solution, the proposed equation is:
Trommelen and Beek [21] established that in the SSHE the power number was not solely a function of the rotational Reynolds number (), since their experimental results showed that for the same , the was increased with a decrease of apparent viscosity. Therefore, they proposed the empirical equation:
where is the power consumed by agitation, is the rate of rotation of the scraping blades, is the fluid apparent viscosity, is the length of the scraping blades, while and are the diameter of the tank and the stator of the SSHE, respectively. This model showed a proper agreement with experimental data (R2 = 0.992).
In another study, Trommelen and Boerema [22], proposed a modification to the Skelland and Leung model. The proposed model can be expressed as:
where the rotational Reynolds number is a function of the viscosity (), K and a are model fitted constants. This model was retaken by Qin et al. (2006 and 2007) to propose a predictive model of apparent viscosity during the crystallization of sucrose aqueous solutions. The proposed methodology consists in estimating the apparent viscosity, during crystallization, using the Thomas predictive model (Equation (2)). Complementarily, the stirrer torque in the SSHE was measured and the consumed power was calculated. Subsequently, the power number was estimated . Finally, the obtained values were used to find the adjusted parameters of the Trommelen and Boerema model (Equation (5)). Predictive curves were obtained and compared with experimental data, obtaining a proper fit. It is important to note that these tests were performed with sucrose solutions in water, with a less than 15% ice crystals volume fraction.
In conclusion, the models found in the literature, for the prediction of the apparent viscosity of mixtures during crystallization by freezing in SSHE’s, have been developed mainly for sugar solutions and sorbets. The current challenge is to develop new models for complex mixtures, such as ice cream, considering a concentration of solids (ice crystals) up to 50% in the outlet stream. Therefore, the objective of this work focuses on the development of a viscosity predictive model for an ice cream mixture during its batch crystallization in a SSHE. This model could serve to build an online virtual instrument for viscosity estimation as a starting point to develop new control strategies for ice cream process production.
2. Materials and Methods
2.1. Ice Cream Mixture and SSHE Description
The ice cream was made using a branded commercial mixture from Golden Abarca® (La Perseverancia, Mexico). The mixture is composed of 15.4% carbohydrates (10.6% added saccharose and 4.8% lactose from milk), 5.2% fat, 2.7% proteins, 76.1% water and 0.6% ash. The SSHE consists of a jacketed cylindrical tank with a capacity of 500 mL. This tank is coupled with a primary cooling system using R404-A refrigerant and a secondary cooling bath using ethylene glycol, this system allows to reach a bath temperature of −30 ± 0.5 °C. The cooled ethylene glycol circulates inside the SSHE jacket as shown in Figure 1. The scraping blades are coupled to a Vexta® motor, model BLFM5120-GFS, equipped with a rotation rate control. Stirring rate can be controlled in the range of 0–800 rpm. In addition, a Hioki® power meter model 3286-20, connected to the motor power supply line, is used to record energy consumption during the process. The equipment is also equipped with a set of T-type thermocouples located at critical points of the cooling system, as well as inside the SSHE, for temperature measurement. These thermocouples are connected to a 34970A Agilent® data acquisition system.
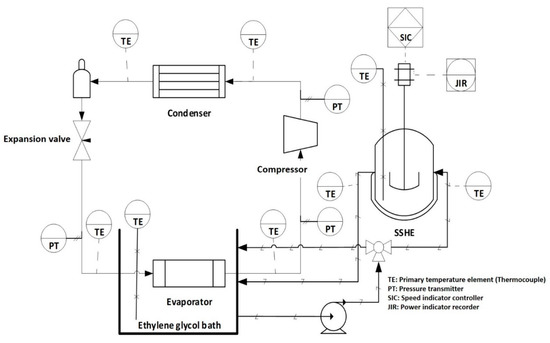
Figure 1.
Scheme of the SSHE coupled to a cooling system.
2.2. Ice Cream Production
For each experiment, 300 mL of ice cream mixture were frozen using three stirring rates (73.78, 129.18 and 184.58 s−1). The temperature of the cooling bath was kept at −30 °C, which allowed to control the mixture temperature in a range of 20 to −5 °C. Temperature was measured and recorded for each experiment as a function of time. Similarly, the energy consumption (power) of the stirring motor was recorded for each test. The ice fraction was estimated from the temperature of the mixture during the crystallization stage. For this purpose, the ice cream crystallization temperature curve at different concentrations, obtained by means of differential scanning calorimetry (DSC), using a TA Instrument® calorimeter model Q2000 coupled to a cooling system model RCS90, was used.
2.3. Rotational and Oscillatory Rheology for Ice Cream Mixtures during Their Transformation
Experiments were carried out to measure the rheological properties of the mixture and the frozen ice cream, according to the methodology for the rheological characterization of ice cream proposed by Anton Paar® [23]. For this, a Physical MCR 302 rheometer from Anton Paar® was used with a stainless-steel parallel plate geometry model PP25-P/TG with TruGapTM (25 mm diameter). The geometry is coated with a ceramic chrome oxide (Cr2O3) layer. In order to prevent slip, a profiled geometry was used. The temperature was controlled with a Peltier PTD 150 unit. A gap of 2 mm and a deformation constant of 0.02% was programmed for all experimental runs. At the beginning of each run the temperature was adjusted to 20 °C, maintaining control by means of the Peltier unit. Subsequently, the evolution of the apparent viscosity of the mixture during crystallization was determined. For this purpose, crystallization runs were carried out in the SSHE, which were interrupted at different temperatures (0, −1, −2, −3, −4, −5 °C) to take a sample for each temperature and determine the apparent viscosity. All experiments were carried out twice to verify repeatability. It should be mentioned that necessary measures were taken to avoid the melting of the samples in their passage from the SSHE to the rheometer, placing the SSHE as close as possible to the rheometer, as well as keeping the rheometer temperature at the sample temperature.
It should be noted that, for the first three temperatures (0, −1, −2 °C), the mixture was obtained as a liquid. So, the rheological tests were carried out in rotational mode. To do this, for each temperature a cut rate sweep was made over the sample from 1 to 500 s−1 (). Then, using experimental data, the evolution of apparent viscosity was determined (). Typically, for each rheological analysis 50 measurement points were obtained with an average interval of 6 s between them.
For temperatures of −3, −4, and −5 °C, the mixture showed a certain degree of freezing. So, an oscillating measurement mode was chosen. For this purpose, at each temperature sampled, an angular frequency sweep from 1 to 500 s−1 was performed. The rheological results obtained were complex viscosity () as well as loss and storage modules. In this case, the experimental data obtained represent a total of 100 measuring points with an average sampling time of 6 s. These data were then used to estimate dynamic viscosity (η’).
2.4. Oscillatory-Rotational Mode Tests for Viscosity vs. Temperature Measurement
To determine the ice cream viscosity evolution during crystallization, three thermo-rheological tests from the ice cream melt were carried out. A combination of oscillatory and rotational mode was used in the rheometer, using a temperature sweep of −10 to 10 °C [4]. Each run corresponds to a frequency (Hz) and a shear rate (s−1) equivalent to the stirring rate used in the SSHE (73.78, 129.18, and 184.58 s−1). In these experiments, samples of ice cream frozen at −18 °C, with more than 24 h of storage, were used. The rheometer was conditioned to a temperature of −10 °C at the beginning of each run and the sample was placed.
The test started in oscillatory mode at constant frequency equivalent to the respective stirring rate (73.78, 129.18 and 184.58 s−1). The oscillatory mode was used from −10 °C to −2.5 °C, with a heating rate of 0.25 °C/min, with a sampling time of 30 s taking 60 measuring points. Subsequently, the rheometer operation was switched to rotational mode at a constant shear rate equivalent to each stirring rate (73.78, 129.18, 184.58 s−1). Thus, heating was continued from −2.4 °C to 10 °C with a heating rate of 1.2 °C/min, and a sampling time of 12 s taking 50 measuring points. As a result, complex viscosity (), as well as storage and loss modules (G’ y G”) were obtained for the oscillatory mode and dynamic viscosity was calculated from these parameters (η’). Alternatively, from rotational mode operation, the apparent viscosity was calculated ().
3. Results and Discussion
3.1. Temperature, Stirring Power and Ice Fraction Monitoring
Figure 2 shows temperature evolution for the mixture during ice cream preparation. It is noted that the room temperature at the beginning of the process is approximately 20 °C. From this temperature it begins a gradual decrease, it is called “cooling stage”. At this stage, the temperature decreases rapidly, reaching values close to −5 °C, corresponding to a mixture temperature below its initial crystallization temperature (Tc). Subsequently, a slight increase in temperature is observed until its Tc. Finally, a continuous decrease is observed, but with a slower cooling rate, and this stage corresponds to the crystallization process of ice fraction.
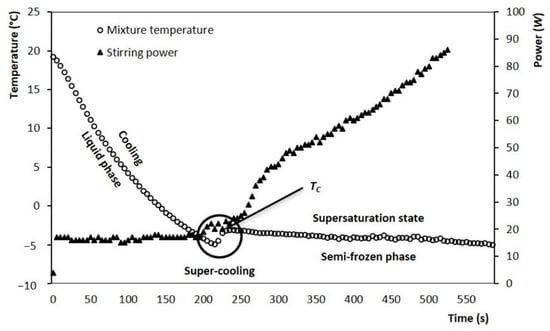
Figure 2.
Evolution of the mixture temperature (▲) during crystallization in the SSHE and evolution of the power consumed by stirring motor (○), test performed at 200 rpm (3.33 s−1).
As is known, the crystallization is an exothermic process that provokes a sharp temperature increase until reaching the Tc, in this study the increment was −2.8 °C, as shown in Figure 2. The results of Tc at different solid concentrations were obtained by DSC analysis (Figure 3) and compared with the experimental results obtained in the SSHE (Figure 4). As shown in Figure 4, the Tc depends on the formulation of the mixture, mainly on the concentration of solids, and it is from this temperature that the formation of the ice fraction begins [16]. The slower temperature decrease observed after the initial crystallization point can be explained by the exothermic contribution of the phase change, the energy generated by the scraping that increases as solids concentration increases, and also by the increase in viscosity which decreases the heat dissipation rate [24,25].
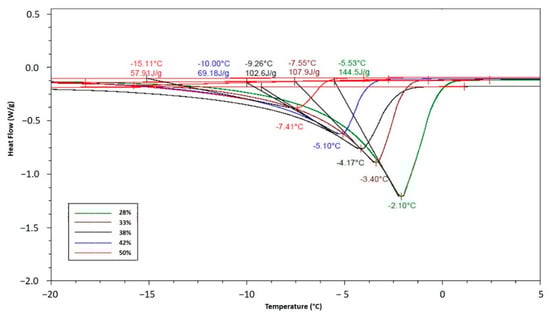
Figure 3.
TC values determined by DSC analysis at different solid concentrations in the ice cream mixture.
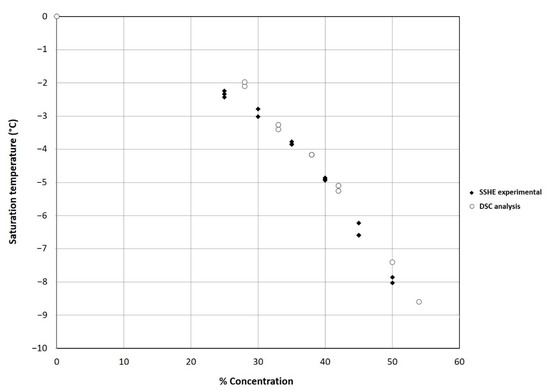
Figure 4.
Comparison of experimental Tc values obtained in the SSHE and DSC analysis results of the ice cream mixture as a function of solid concentration (%).
The evolution of the power consumed by the stirring motor of the SSHE is also shown in Figure 2. It is observed that after the Tc occurs, the power consumed by the stirrer rotation increases significantly, as the temperature drops, and the ice fraction increases (Figure 5). Consequently, the highest value of power consumption (~90 W) was found at the end of the crystallization (−5 °C, 600 s). In the first stage, the stirrer had a continuous consumption of 15 W, to maintain a constant stirring rate of 3.33 s−1 for the liquid mixture. During the crystallization process, this energy consumption gradually increased as the temperature of the semi-frozen phase decreased. The end of the process was established at −5 °C and the fraction of ice was estimated as a function of temperature, according to the methodology proposed by Cerecero (2003). This methodology is based on the solute mass balance considering that there are only water crystals. The mathematical relationship considers the initial mass fraction of solute and the residual mass fraction related to temperature by the liquidus curve (Figure 4). The increase in the ice fraction, for this same process, can be seen in Figure 3. It is observed that, like the power, the increase in the ice fraction starts at temperatures below the Tc. This increase in the ice fraction (Figure 5) corresponds to the increase in the power consumed for the agitation of the semi-frozen phase (Figure 2). At the end of the process, an approximate ice fraction of 30% was obtained. To keep the stirring rate constant with this ice concentration, the energy consumption increased to values close to 90 W. As can be seen, the increase in power consumption is six times greater than the power required for stirring the liquid mixture. It should be noted that the heat generated by these changes is dissipated in the ice cream and finally removed by the cooling system [1,2,15,26].
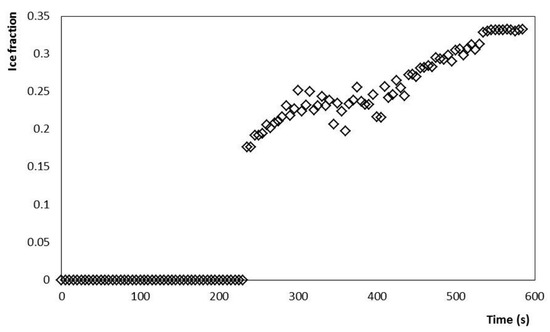
Figure 5.
Ice fraction increase during crystallization of the mixture up to −5 °C at a stirring rate of 200 rpm (3.33 s−1).
This dynamic crystallization process is similar to that described by several authors, who have studied ice cream crystallization in SSHE [2,7,10,13,15,25,27,28,29,30]. The evolution of the temperature and therefore the ice fraction were similar in all the tests carried out at different agitation rates.
The results show that the energy increase in the power consumed by the stirring motor of the SSHE is proportional to the increase in the fraction of crystals formed, and therefore must be related to the increase in the viscosity of the ice cream during its crystallization. So, it is possible to find the relationship that manages to estimate viscosity evolution based on the power consumed by a SSHE engine.
3.2. Rheological Results
3.2.1. Behavior of the Mixture in Liquid and Crystallized State
The ice cream mixture was kept in a liquid state when it was above −2.8 °C, and although its viscosity increased slightly with the decrease in temperature, this increase is not significant (0.16%). In addition, the results at temperatures of 0, −1, and −2 °C (Figure 6) show that the apparent viscosity of the mixture is dependent on the shear rate, this being a typical characteristic of a non-Newtonian fluid.
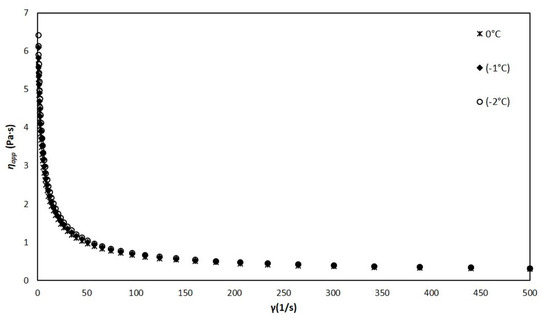
Figure 6.
Viscosity of the liquid mixture vs. shear rate at temperatures of 0, −1, −2 °C.
The liquid mixture near the freezing point behaves as a shear-thinning pseudoplastic fluid, which has already been reported by other authors [2,31]. This behavior is due to the so-called thixotropy, which is caused by the breakdown of interactions and associations (weak bonds) between the different components of the mixture. This thinning behavior is well described by the power law (Equation (6)). From the experimental results, the values of the consistency coefficient and the flow behavior index n (Table 1) were obtained.

Table 1.
Values of k and n for the ice cream mixture at different temperatures.
When the mixture reaches below −2.8 °C, the appearance and growth of ice crystals is noticeable in the values obtained from dynamic viscosity measurements, for temperatures of −3, −4 and −4.5 °C (Figure 7).
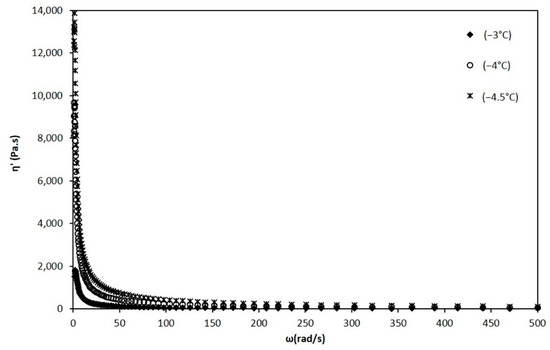
Figure 7.
Dynamic viscosity vs. angular frequency at temperatures of −3, −4, and −4.5 °C.
The behavior of the mixture changed radically since it was transformed into a semi-solid system with a viscoelastic behavior [12]. This behavior, in the presence of crystals, prevents the apparent viscosity from being evaluated. Therefore, the complex viscosity was determined and from this the dynamic viscosity. In Figure 7 it can be seen that as the temperature decreases, the dynamic viscosity has increasing values. This dynamic viscosity was similarly adjusted to the power law to determine the values of the and n indices, which are also shown in Table 1.
3.2.2. Ice Cream Melting for Evaluating the Dynamic and Apparent Viscosity
Ice cream melting tests in the rheometer showed a very similar behavior to that already described in other investigations [4,5]. Three zones are identified when evaluating G’ and G” modules, these zones can be seen in Figure 8 and are described below.
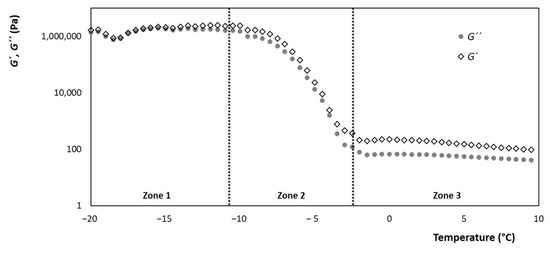
Figure 8.
Evolution of the storage and loss modules (G’ and G” respectively) of ice cream, with respect to the change in temperature, with a constant frequency and shear rate of 68.93 s−1.
Zone 1: It is in low temperatures between −20 °C and −10 °C, where the microstructure of the ice crystals dominates. The storage module G’, which describes the behavior of a solid body, has a greater decrease as the theoretical ice fraction decreases. While the loss module G” which describes the viscous behavior is shown to be constant in this temperature range, this can be correlated with the rigidity and the formation of the ice cream ball when spooning it.
Zone 2: Includes the temperature range of −10 °C to −2.8 °C, where the theoretical ice fraction decreases significantly. Here, there is a slope of both modules that has a steep inclination, which refers to the melting rate of the ice crystals. Therefore, it can be correlated with the sensory attribute of cold when consuming ice cream.
Zone 3: It goes from the temperature range greater than TC where both modules, G’ and G”, enter their lowest levels and remain constant. There are no ice crystals here, so the foamy structure formed by the air and the fat become the dominant phase. The level at which the modules are can be related to the creaminess attribute.
Dynamic crystallization, carried out in SSHE, includes temperatures ranging from 5 to −5 °C, placing this process in zones 2 and 3 described above. For this region of temperatures, the modules are superimposed, as long as it is below the TC, making the predominant behavior to be viscoelastic. This leads to the use of dynamic viscosity as the most appropriate parameter for temperatures where there is an ice fraction (T < TC). However, when the T > TC the mixture is completely at a liquid state and its apparent viscosity can be estimated, from rotational tests, applying the power law.
Thus, from the thermo-rheological melting tests, it was possible to obtain the evolution of viscosity with respect to temperature. The result is shown in Figure 9, where there are two defined zones. One corresponding to the frozen part described by the ice cream dynamic viscosity η’, in the range of −10 to −2.8 °C. Meanwhile, for the liquid part, it is described with the apparent viscosity ηapp and corresponds to temperatures greater than −2.8 °C. The zone of union between both behaviors is considered a critical zone for the development of the model. This zone has a curvature that is dependent on the heating rate at which the rheometer was adjusted, during the fusion test. Therefore, since melting and crystallization are opposite phenomena, it is expected that this area will not be fully adjusted. In the crystallization process, the appearance of the ice fraction is instantaneous. On the other hand, in the fusion, the melting of the crystals is a gradual change that ends until reaching the TC. Therefore, for this area, the viscosity data obtained during the rheological tests were used to determine and n, which were explained in the previous section.
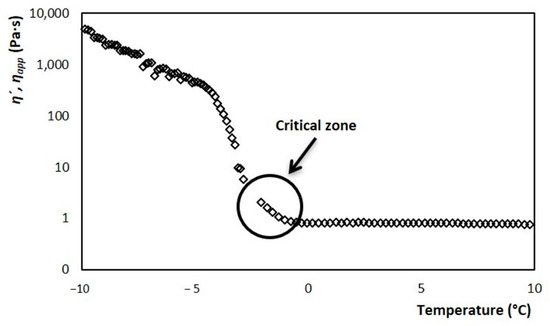
Figure 9.
Evolution of dynamic viscosity (−10 to −3 °C) and apparent viscosity (−2.5 to 10 °C) of ice cream, with respect to change temperature, with a constant frequency and shear rate from 73.78 s−1.
In Figure 7, three slopes are observed during the temperature increase. These denote the three areas where the ice cream structure is evolving in different ways, and primarily due to the disappearance of ice crystals. The viscosity decreases dramatically as the temperature increases in the range of −10 to −2 °C, which is the area where the fraction of crystals melts. From the range of −10 to −5 °C, the viscosity gradually decreases. Here, the ice crystals melt slowly. However, from −5 °C and until TC the viscosity decreases dramatically, because the rate at which the crystals melt increases sharply [29,32]. Around the TC and towards higher temperatures, the viscosity value stabilizes, as the ice fraction has completely disappeared.
The results obtained corroborate the relationship between the ice fraction, the power consumed by the SSHE engine, and the viscosity of the system. Each of these, increases as the mixture’s temperature decreases during crystallization. Therefore, it is possible to develop a model that allows for the online estimation of viscosity based on the power consumed by the SSHE, which is an easy measurement parameter.
4. Model Development for Viscosity
4.1. Initial Considerations
A mathematical model was developed for viscosity estimation, contemplating two stages during the crystallization process: the first is a cooling stage (starting in the initial temperature range to the initial point of crystallization) while the second stage contemplates the appearance and crystals growth (from the initial point of crystallization to −5 °C). The two stages can be seen in Figure 10; the cooling stage is represented by an apparent viscosity (ηapp), and the crystallization stage by dynamic viscosity (η’). The evolution of both viscosities was obtained from melting tests of an ice cream sample at a constant shear rate, using a rheometer, according to the methodology proposed by Wildmoser et al. (2004). For the critical zone shown in Figure 9, the values obtained from the fusion were replaced, with values determined at the end of interrupted crystallizations at different temperatures (0, −1, −2, −3, −4, and −4.5 °C). These values adjusted very well to the two stages described by the fusion. But the most significant event is that the critical zone was filled with real crystallization values, which is the path that truly follows the ice cream viscosity during its processing in the SSHE.
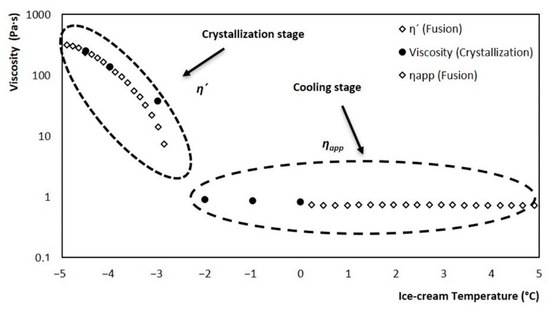
Figure 10.
Evolution of ice cream apparent and dynamic viscosity: at a stirring rate of 3.33 rev/s. Crystallization stage (−2.8 °C to −5 °C), cooling stage (−2.8 °C to 5 °C).
The evolution of viscosity during crystallization at a stirring rate of 3.33 rev/s in the SSHE is represented in Figure 10. This is the behavior that was estimated from the mathematical model. As you can see, the behavior consists of two stages, the first is a cooling stage and the second is the crystallization stage. For the cooling stage, the apparent viscosity values obtained from the rheometer through a rotational mode fusion were used. For the crystallization stage, the dynamic viscosity values obtained from rheometer tests which consisted of a fusion in oscillatory mode were used. Point viscosity values were obtained in the transition zone between both stages; for this, crystallizations were performed which were stopped at different temperatures and from which a sample was taken and brought to the rheometer for viscosity determination (black dots in Figure 10).
A scheme of the model shaping strategy is shown in Figure 11, where t represents the time at which crystallization took place. The study was delimited at a temperature range (T) of 5 to −5 °C, highlighting that the TC of the mixture was found at −2.8 °C. In this range, the temperature and power measurement (P) was made. These experimental values are used as model variables. For the cooling stage, the viscosity is estimated from the temperature using the power law model, resulting in an apparent viscosity (ηapp). Once the temperature reaches the TC, the power law model is replaced by a function based on the power consumed by the motor; which allows to estimate the dynamic viscosity (η’) during the crystallization stage. The model was validated with measurements of apparent viscosity as a function of the shear rate () for the first stage, and dynamic viscosity measurements as a function of the loss module G” for the second stage. Thus, the global model for viscosity prediction is shaped by coupling these two functions.
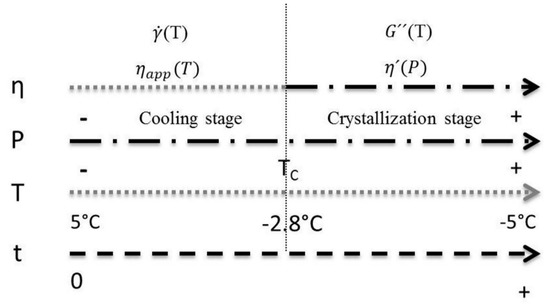
Figure 11.
Representation of the model’s two stages of action. TC is the mixture’s crystallization temperature, P is power consumed by the stirring motor, η is the viscosity (ηapp is apparent viscosity, η’ is dynamic viscosity), t is time, is velocity of cut and G” is the loss module.
4.2. Calculation of Average SHEAR Rate in the SSHE
The determination of the average shear rate, within the SSHE, is a function of the scraping blades agitation rate. There are different models that focus on the calculation of an average shear rate for this type of equipment [33], Yataghene et al. [34] make a compendium of these models. Another methodology to estimate an average shear rate in the SSHE is using the Couette analogy described by Steffe [35], and used by Benkhelifa et al. (2008). The proposed by Mabit et al. [36] is one of the most employed. This model consists in estimating the shear rate in two important areas within the SSHE. The first zone is on the rotor (Equation (7)). The second corresponds to the hollow space between the cylinder and the rotor (Equation (8)). From the two cut rates, an overall shear rate of the SSHE is calculated as an average (Equation (9)). Table 2 shows the calculated values for each of the rates used in this study. In addition, the values of the power consumed at the beginning and end of each run are presented, as well as the final temperature and the estimated ice fraction.
Table 2.
Estimated shear rate values for different SSHE agitation rates, power consumed at each rate and estimated ice fraction.
In both equations, Rr and Rs are the ratio of the rotor and the stator (internal radius of the cylinder), respectively. NR is the rotational rate in s−1 and n was taken as an average of the different values obtained for this parameter in liquid state, which was 0.492, according to the values presented in Table 1.
4.3. Development of Model Equations
4.3.1. Estimation of Dynamic Viscosity from Power (Crystallization Stage)
Authors such as Skelland and Leung (1962), Trommelen and Beek (1971) and Qin et al. (2006), have estimated the energy consumption (P) in the SSHE by means of the relationship between variables such as, the length of the scraping blades (LB), the number of scraping blades (F), and the number of Reynolds (Re). This relationship has been expressed in Equation (5), where Po is the power number, while K and a are adjustment constants. For this study, F = 4 and LB = 0.126 m. The Po is given by the following equation:
The Reynolds number of the mixture within the SSHE was obtained by the equation:
The model was constructed by combining Equations (5) and (11). Thus, the apparent viscosity is a function of the power:
Equation (12) represents the first part of the model and corresponds to the relationship of viscosity with the stirring motor increase in energy consumption. A maximum value of ρ = 650 kg/m3 was considered for the ice cream density, which corresponds to the largest fraction of ice generated (ϕ = 0.3). This ice cream density was calculated using the mixture density and the experimental overrun determined from production runs [2]. The internal diameter of the SSHE was dt = 0.073 m. NR as already mentioned is the rotational rate of the scraping blades (3.33, 5.83, 8.33 s−1).
The values of the model adjustment parameters, represented in Equation (12), K and a, were determined from the experimental data using a nonlinear least squares regression method, according to the equation:
where M is the number of experimental points, ηapp.measure is the apparent viscosity and ηapp.estimated is the predicted value for the ice cream mixture apparent viscosity. Values of 16.73 and −1.38 were obtained for K and a, respectively.
The relative error between the experimental viscosity and the estimated viscosity was determined for limit values of ±10% and is reported in Figure 12. It is observed that the dispersion of the results is within the delimited region. So, it can be stated that in any case, the estimation error is less than 10%. This confirms the coherence between the data estimated from the stirring power and the experimental viscosity data obtained in the rheometer. These results represent a fair estimate for the crystallization of a complex mixture such as ice cream base. Therefore, it can be said that the power-based model was accurate for the crystallization zone.
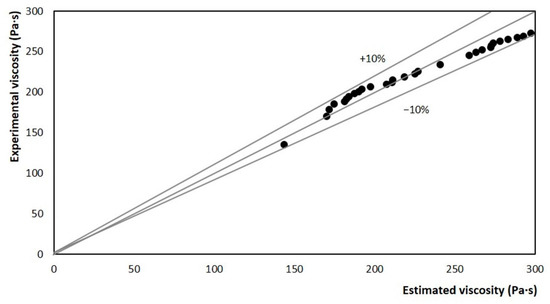
Figure 12.
Comparison between experimental and estimated values for apparent viscosity, using the model as a function of the stirring motor power at 3.33 rev/s.
4.3.2. Estimation of Apparent Viscosity from Temperature (Cooling Stage)
At temperatures above the TC, the mixture has no ice fraction, so the apparent viscosity of the mixture is only affected by the temperature and is determined based on the shear rate that is applied. At this stage the behavior of the mixture is well described by the power law (Equation (6)), where k and n are the variables that characterize the mixture and are affected by temperature. Equation (6) represents the second part of the model, for the cooling stage, where the change in viscosity is minor and is only due to a change in temperature.
To determine the effect of temperature on the variables of Equation (6), Arrhenius’s law was used, obtaining Equations (14) and (15), where Ak, Ek, An and En are adjustment parameters that were determined from experimental data, using Scilab® 6.0 software, with the nonlinear least squares regression method. These data were the values of k and n, obtained at three temperatures at which the mixture still remained in a liquid state (0, −1, −2 °C) and the adjustment was made by means of a linear regression.
The values obtained for Ak, Ek, An and En are 3.5754 × 10⁻⁴, 4578.4, 4.4965, and −602.16, respectively. These values are in the same order of magnitude of the values reported for other fluids with slimming behavior, such as ice cream mixture [37].
4.3.3. Coupling of Power and Temperature Models
The complete model of viscosity evolution is represented by Equations (6) and (12), with their respective parameters adjusted by experimental data. These equations were coupled using a Heaviside function that uses the crystallization temperature TC (−2.8 °C) as the transition parameter. Equations (16) and (17) represent the final model.
T′ =T − TC
In this way, the predictive model for the entire temperature range used during crystallization in the SSHE was formed, being constituted by the power law, depending on the temperature, and the modified Qin model, depending on the power consumed.
The validation of the model was carried out with tests performed at different agitation rates, which correspond to the average shear rates of the SSHE to which the mixture is subjected during crystallization. Figure 13a shows the graph that contrasts the values estimated by the model throughout the crystallization run and the actual viscosity measurements obtained in the rheometer by the melt run, for a velocity of 3.33 s−1. The model accurately describes the viscosity behavior at both stages of the process (cooling and crystallization). Similar results were obtained for the three case studies where the agitation rate was varied (5.83 and 8.33 s−1), Figure 13b,c.
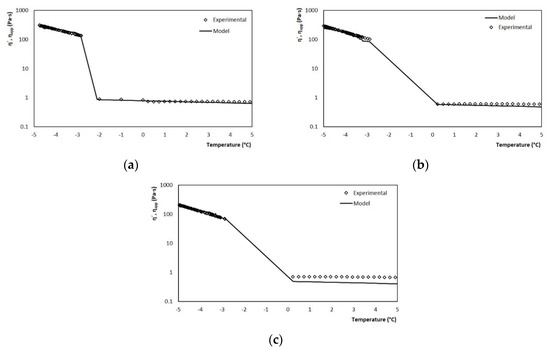
Figure 13.
Comparison between experimental values and those estimated by the model for viscosity using the coupled model for rates of (a) 3.33, (b) 5.83 and (c) 8.33 s−1.
In the three cases, the power-based model managed to adjust very well to the experimental values, this crystallization stage being the one of greatest interest in the model. Therefore, it can be said that the model managed to adequately estimate the evolution of viscosity regardless of the operating conditions of the process, thus demonstrating with it its efficiency for the online measurement of viscosity in discontinuous SSHE.
5. Conclusions
This study found that the dynamic crystallization of ice cream in SSHE is the most important stage for the development of physical properties (ice fraction and viscosity), which determine the quality of the ice cream. With this work, a predictive model of the evolution of these properties was obtained, which was effective when tested at different stirring rates (<10% error). In this way, on-line estimation of the ice fraction and the ice cream viscosity was possible. Moreover, this was possible from the measurement of simple variables such as the stirring power consumption and the mixture temperature. Furthermore, the proposed model is valid for ice fractions up to 30%, which are typical values found in crystallization processes of this type of product, and which have not been reported in the literature. This represents a first step in establishing a control strategy for the ice cream crystallization process.
Author Contributions
Conceptualization, J.E.G.R., R.E.D.P. and M.M.S.; formal analysis, A.D.l.C.M., A.J.B.E., J.E.G.R. and M.M.S.; investigation, A.D.l.C.M., A.D.V.L. and A.J.B.E.; methodology, R.E.D.P., J.E.G.R., J.D.P.M. and M.M.S.; project administration J.E.G.R. and M.M.S.; resources R.E.D.P., J.D.P.M. and M.M.S.; supervision, R.E.D.P., J.E.G.R. and M.M.S.; visualization, A.D.l.C.M. and A.D.V.L.; writing—original draft, A.D.l.C.M.; writing-review & editing, R.E.D.P. and M.M.S. All authors have read and agreed to the published version of the manuscript.
Funding
This research was funded by FAI program from Universidad Autónoma de San Luis Potosí.
Acknowledgments
The authors acknowledge the use of the facility access in Food Pilot Plant and the Food Microbiology Laboratory, of the Universidad Autónoma de San Luis Potosí, where experiments were carried out for the development of the research. Especially to M.C. María del Refugio Pérez Barba and Ing. Alejandra Loredo Becerra.
Conflicts of Interest
The authors declare no conflict of interest.
References
- Clarke, C. The physics of ice cream. Phys. Educ. 2003, 38, 248–253. [Google Scholar] [CrossRef]
- Goff, H.D.; Hartel, R.W. Ice Cream; Springer: Boston, MA, USA, 2013. [Google Scholar]
- Amador, J.; Hartel, R.; Rankin, S. The Effects of Fat Structures and Ice Cream Mix Viscosity on Physical and Sensory Properties of Ice Cream. J. Food Sci. 2017, 82, 1851–1860. [Google Scholar] [CrossRef]
- Wildmoser, H.; Scheiwiller, J.; Windhab, E.J. Impact of disperse microstructure on rheology and quality aspects of ice cream. LWT Food Sci. Technol. 2004, 37, 881–891. [Google Scholar] [CrossRef]
- Eisner, M.D.; Wildmoser, H.; Windhab, E.J. Air cell microstructuring in a high viscous ice cream matrix. Colloids Surf. A Physicochem. Eng. Asp. 2005, 263, 390–399. [Google Scholar] [CrossRef]
- Tsevdou, M.; Gogou, E.; Dermesonluoglu, E.; Taoukis, P. Modelling the effect of storage temperature on the viscoelastic properties and quality of ice cream. J. Food Eng. 2015, 148, 35–42. [Google Scholar] [CrossRef]
- Drewett, E.M.; Hartel, R.W. Ice crystallization in a scraped surface freezer. J. Food Eng. 2007, 78, 1060–1066. [Google Scholar] [CrossRef]
- Parra, O.D.H.; Ndoye, F.T.; Benkhelifa, H.; Flick, D.; Alvarez, G. Effect of process parameters on ice crystals and air bubbles size distributions of sorbets in a scraped surface heat exchanger. Int. J. Refrig. 2018, 92, 225–234. [Google Scholar] [CrossRef]
- Soukoulis, C.; Rontogianni, E.; Tzia, C. Contribution of thermal, rheological and physical measurements to the determination of sensorially perceived quality of ice cream containing bulk sweeteners. J. Food Eng. 2010, 100, 634–641. [Google Scholar] [CrossRef]
- Cook, K.L.K.; Hartel, R.W. Mechanisms of ice crystallization in ice cream production. Compr. Rev. Food Sci. Food Saf. 2010, 9, 213–222. [Google Scholar] [CrossRef]
- Varela, P.; Pintor, A.; Fiszman, S. How hydrocolloids affect the temporal oral perception of ice cream. Food Hydrocoll. 2014, 36, 220–228. [Google Scholar] [CrossRef]
- Hartel, R.W.; Rankin, S.A.; Bradley, R.L. A 100-Year Review: Milestones in the development of frozen desserts. J. Dairy Sci. 2017, 100, 10014–10025. [Google Scholar] [CrossRef] [PubMed]
- Arellano, M.; Flick, D.; Benkhelifa, H.; Alvarez, G. Rheological characterisation of sorbet using pipe rheometry during the freezing process. J. Food Eng. 2013, 119, 385–394. [Google Scholar] [CrossRef]
- Guo, E.; Kazantsev, D.; Mo, J.; Bent, J.; Van Dalen, G.; Schuetz, P.; Rockett, P.; StJohn, D.; Lee, P.D. Revealing the microstructural stability of a three-phase soft solid (ice cream) by 4D synchrotron X-ray tomography. J. Food Eng. 2018, 237, 204–214. [Google Scholar] [CrossRef]
- Qin, F.; Chen, X.D.; Ramachandra, S.; Free, K. Heat transfer and power consumption in a scraped-surface heat exchanger while freezing aqueous solutions. Sep. Purif. Technol. 2006, 48, 150–158. [Google Scholar] [CrossRef]
- Cerecero, E.R. Etude des écoulements et des transferts thermiques lors de la fabrication d’un sorbet á l’échelle du pilote et du laboratoire. Ph.D. Thesis, L’institut National Agronomique Paris Grignon, Paris, France, 2003. [Google Scholar]
- González-Ramírez, J.E.; Leducq, D.; Arellano, M.; Alvarez, G. Energy consumption optimization of a continuous ice cream process. Energy Convers. Manag. 2013, 70, 230–238. [Google Scholar] [CrossRef]
- Kitanovski, A.; Vuarnoz, D.; Ata-Caesar, D.; Egolf, P.W.; Hansen, T.M.; Doetsch, C. The fluid dynamics of ice slurry. Int. J. Refrig. 2005, 28, 37–50. [Google Scholar] [CrossRef]
- Benkhelifa, H.; Alvarez, G.; Flick, D. Development of a scraper-rheometer for food applications: Rheological calibration. J. Food Eng. 2008, 85, 426–434. [Google Scholar] [CrossRef]
- Skelland, A.H.P.; Leung, L.S. Power consumption in scraped heat exchage. Br. Chem. Eng. 1962, 7, 264–267. [Google Scholar]
- Trommelen, A.M.; Beek, W.J. The mechanism of power consumption in a Votator†-type scraped-surface heat exchanger. Chem. Eng. Sci. 1971, 26, 1977–1986. [Google Scholar] [CrossRef]
- Trommelen, A.M.; Boerema, S. Power consumption in a scraped-surface heat exchager. Trans. Instin. Chem. Eng. 1966, 44, T329–T334. [Google Scholar]
- Läuger, J. Rheological Characterization of Ice Cream; Anton Paar Germany GmbH: Ostfildern, Germany, 2003; Available online: https://www.anton-paar.com/mx-es/servicios-y-soporte/documentos/reometro-de-la-serie-mcr/ (accessed on 31 January 2020).
- Hernández-Parra, O.D.; Plana-Fattori, A.; Alvarez, G.; Ndoye, F.T.; Benkhelifa, H.; Flick, D. Modeling flow and heat transfer in a scraped surface heat exchanger during the production of sorbet. J. Food Eng. 2018, 221, 54–69. [Google Scholar] [CrossRef]
- Liu, S.; Hao, L.; Rao, Z.; Zhang, X. Experimental study on crystallization process and prediction for the latent heat of ice slurry generation based sodium chloride solution. Appl. Energy 2017, 185, 1948–1953. [Google Scholar] [CrossRef]
- Qin, F.G.; Premathilaka, S.; Chen, X.D.; Free, K.W. The shaft torque change in a laboratory scraped surface heat exchanger used for making ice slurries. Asia Pacific J. Chem. Eng. 2007, 2, 618–630. [Google Scholar] [CrossRef]
- Ali, S.; Baccar, M. Numerical study of hydrodynamic and thermal behaviors in a scraped surface heat exchanger with helical ribbons. Appl. Therm. Eng. 2017, 111, 1069–1082. [Google Scholar] [CrossRef]
- Ndoye, F.T.; Hernandez-Parra, O.; Benkhelifa, H.; Alvarez, G.; Flick, D. Influence of operating conditions on residence time distributions in a scraped surface heat exchanger during aerated sorbet production. J. Food Eng. 2018, 222, 126–138. [Google Scholar] [CrossRef]
- Guo, E.; Zeng, G.; Kazantsev, D.; Rockett, P.; Bent, J.; Kirkland, M.; Van Dalen, G.; Eastwood, D.S.; StJohn, D.; Lee, P.D. Synchrotron X-ray tomographic quantification of microstructural evolution in ice cream-a multi-phase soft solid. RSC Adv. 2017, 7, 15561–15573. [Google Scholar] [CrossRef]
- Mo, J.; Groot, R.D.; McCartney, G.; Guo, E.; Bent, J.; van Dalen, G.; Schuetz, P.; Rockett, P.; Lee, P.D. Ice crystal coarsening in ice cream during cooling: A comparison of theory and experiment. Crystals 2019, 9, 321. [Google Scholar] [CrossRef]
- Zhu, Z.; Zhou, Q.; Sun, D.W. Measuring and controlling ice crystallization in frozen foods: A review of recent developments. Trends Food Sci. Technol. 2019, 90, 13–25. [Google Scholar] [CrossRef]
- Mo, J.; Guo, E.; McCartney, D.G.; Eastwood, D.S.; Bent, J.; Van Dalen, G.; Schuetz, P.; Rockett, P.; Lee, P.D. Time-resolved tomographic quantification of the microstructural evolution of ice cream. Materials 2018, 11, 2031. [Google Scholar] [CrossRef]
- Dehkordi, K.S.; Fazilati, M.A.; Hajatzadeh, A. Surface Scraped Heat Exchanger for cooling Newtonian fluids and enhancing its heat transfer characteristics, a review and a numerical approach. Appl. Therm. Eng. 2015, 87, 56–65. [Google Scholar] [CrossRef]
- Yataghene, M.; Pruvost, J.; Fayolle, F.; Legrand, J. CFD analysis of the flow pattern and local shear rate in a scraped surface heat exchanger. Chem. Eng. Process. Process Intensif. 2008, 47, 1550–1561. [Google Scholar] [CrossRef]
- Steffe, J.F. Rheological Methods in Foods Proccess Engineering; Freeman Press: Eats Lansing, MI, USA, 1996. [Google Scholar]
- Mabit, J.; Fayolle, F.; Legrand, J. Shear rates investigation in a scraped surface heat exchanger. Chem. Eng. Sci. 2003, 58, 4667–4679. [Google Scholar] [CrossRef]
- Chen, J.; Ma, C.; Ji, X.; Lu, X.; Wang, C. Mechanism Study of Waste Heat Recovery from Slurry by Surface Scraped Heat Exchanger. Energy Procedia 2017, 105, 1109–1115. [Google Scholar] [CrossRef]


© 2020 by the authors. Licensee MDPI, Basel, Switzerland. This article is an open access article distributed under the terms and conditions of the Creative Commons Attribution (CC BY) license (http://creativecommons.org/licenses/by/4.0/).