Article

Development and Permeability Testing of Self-Emulsifying Atorvastatin Calcium Pellets and Tablets of Compressed Pellets

1
Faculty of Pharmacy, Department of Pharmaceutical Technology, Ege University, Izmir 35100, Turkey
2
School of Pharmacy, Department of Pharmaceutical Technology, Aristotle University of Thessaloniki, Thessaloniki 54124, Greece
*
Author to whom correspondence should be addressed.
Processes 2019, 7(6), 365; https://doi.org/10.3390/pr7060365
Submission received: 26 April 2019 / Revised: 5 June 2019 / Accepted: 7 June 2019 / Published: 12 June 2019
(This article belongs to the Section Advanced Digital and Other Processes)

Abstract

:
Self-emulsifying pellets (SEPs) of Atorvastatin Calcium (AtrCa) were developed and processed into tablets (SETs). Self-emulsifying drug delivery system (SEDDS) composed of oleic acid, Tween 20, Span 80 and N-Methyl-2-pyrolidone gave great solubility improvement and was used as oil in water emulsion for the preparation of SEPs. Due to the high 60% w/w SEDDS content required to achieve a therapeutic dose in the final tablet form, sonication was necessary to improve fluidity and stability. Colloidal silicon dioxide (CSD) and microcrystalline cellulose (MCC) were the solids in the pellet formulation employed at a ratio 7:3, which enabled production of pellets with high SEDDS content and acceptable friability as well. Emulsions were characterized physico-chemically, SEPs for physical properties and reconstitution, and tablets of compressed pellets for mechanical strength, disintegration into pellets and drug release. SEPs compressed with 30% MCC at 60 MPa gave tablets of adequate strength that disintegrated rapidly into pellets within 1 min. Emulsion reconstitution took longer than drug release due to adsorption of SEDDS on CSD, implying dissolution at the pellet surface in parallel to that from the dispersed droplets. Compared to the commercial tablet, drug release from the self-emulsifying forms was faster at pH 1.2 where the drug solubility is poor, but slower at pH 6.8 where the solubility is higher. Permeability and cytotoxicity were also studied using Caco-2 cells. The results showed that drug transport from the apical to basolateral compartment of the test well was 1.27 times greater for SEPs than commercial tablets, but 0.86 times lower in the opposite direction. Statistical analysis confirmed the significance of these results. Toxicity was slightly reduced. Therefore, the increased permeability in conjunction with the protection of the drug being dissolved in the SEDDS droplets, may reduce the overall effect of presystemic metabolism and enhance bioavailability.

1. Introduction

Hypercholesterolemia is a condition characterized by very high levels of cholesterol in the blood. Hypercholesterolemic patients have a high risk of developing a form of heart disease known as coronary artery disease [1]. Atorvastatin is indicated for the reduction of total cholesterol, low density lipoprotein (LDL) cholesterol, and apolipoprotein B in adult patients with familial hypercholesterolemia, in cases where response to diets and other methods is inadequate [2]. It is used as atorvastatin calcium trihydrate (AtrCa) which according to the Biopharmaceutics Classification System (BCS) is a class 2 drug with low solubility, which together with its high (above 80%) presystemic clearance are the main reasons for its low oral bioavailability (12% after a 40 mg oral dose) [3]. Therefore, there is scope for increasing the bioavailability of ATrCa by increasing both dissolution and permeability, since reduction of the residence time in the gut and intestine will reduce the effect of presystemic metabolism [4,5].
Among other approaches, formulations based on self-emulsifying drug delivery systems (SEDDS) have been shown to be promising formulations for the improvement of oral bioavailability of poorly water-soluble drugs [6,7,8]. They have many desired attributes such as relatively easy preparation, reduced impact of food, and reduced interpatient plasma levels variation. They have the ability to emulsify spontaneously in contact with water and present the poorly water-soluble drug in the gastrointestinal tract (GI) dissolved in the lipid droplets, thus, resulting in minimum deposition and increased stability which is particularly important for AtrCa due to its chemical instability [9].
Liquid SEDDS can be transformed into solid dosage forms by various methods for easier packing, better stability, and lower production cost [10,11,12]. Incorporation into self-emulsifying pellets (SEP) provides a combined presentation having the advantages of a multiple-unit dosage form such as reduction in the variation of gastric emptying time and low risk of dose dumping, besides the advantages of self-emulsification such as absorption improvement and better stability in the gastric fluids [9,12]. All these conduce to minimization of the variability in plasma levels. For the transformation of SEDDS into pellets extrusion/spheronization is often employed due to the resulting narrow size distribution and high sphericity of the product, improved bioavailability, and the potential for expansion on an industrial scale [12,13].
The aim of this study was to develop self-emulsifying pellet and tablet formulations with high SEDDS content, and hence drug in the final dry pellet, added as oil in water emulsion. A number of potential oils and surfactants employed in SEDDS formulations were tested and the combination that gave greater drug solubility was used to develop the solid forms. Since the intention was to incorporate the highest possible SEEDS concentration, ultrasonication was used to homogenize and improve texture and fluidity of the high SEDDS concentration nanoemulsion, enabling efficient mixing with the powder pellet ingredients and formation of extrudable paste. Sonication has been previously applied effectively for stabilization of microemulsions [14,15]. CSD was used as adsorbent to assist the loading of large amounts of SEDDS and MCC as pellet former to improve mechanical strength. Since SEPs are not themselves a dosage form, they were compressed into tablets using Avicel 101 as compression aid which has been reported to assist uniform pellet distribution in high speed industrial scale tablets production [16]. The developed self-emulsifying formulations were evaluated for disintegration (redispersibility) into pellets and were compared with a commercial tablet formulation for in vitro release, permeability of drug through Caco-2 cell monolayers and cytotoxicity.

2. Materials and Methods

2.1. Materials

Atorvastatin calcium (AtrCa) was gift from Zentiva (Istanbul, Turkey) and colloidal silica dioxide (Aerosil 200) gift from Evonik Industries AG (Darmstadt, Germany). The excipients of SEDDS oleic acid, Tween 20, Span 80 and N-Methyl-2-pyrrolidone were purchased from Sigma Aldrich (Steinheim, Germany) and microcrystalline cellulose (Avicel 101) from FCM (Cork, Ireland). Deionized water was the external phase of SEDDS emulsions that were used as liquid binders for the preparation of pellets. All other chemicals and solvents used were of analytical grade.

2.2. Methods

2.2.1. Screening Tests

Screening tests of AtrCa in various oils, surfactants, and co-surfactants were performed using the shake flask method. Excess AtrCa was added in 2 mL of each of the tested SEDDS ingredients (Table 1). Oleic acid, corn oil, and refined castor oil were the tested oils; Labrafil M 2125, Labrafil 1944, Tween 20, Tween 80, Span 80, PEG 200, PEG 400, Transcutol, Labrasol, Brij 30 V, Brij 92 V and Brij 96 V the surfactants; ethanol, isopropyl alcohol, N-methylpyrrolidone the cosurfactants. Solubility of AtrCa in the above excipients as well as in deionized water that was the aqueous phase of the SEDDS emulsions was determined. Each ingredient was mixed with excess drug in a shaker (Cat S20, M. Zipperer GmbH, Ballrechten-Dottingen, Germany) at 200 rpm/72 h/22 ± 1 °C and subsequently centrifuged (Eppendorf 3414-Germany) at 3000 rpm/15 min. Clear solutions were removed from the supernatant and analyzed for drug. Three measurement were taken. The results of analysis are given in Table 1.

2.2.2. HPLC Analysis

The solubility was determined by analyzing clear supernatant liquid by HPLC (HP Agilent 1100 Series-Germany) using ACE C18 analytical column and UV detector, after suitable dilution with the mobile phase and injection into the sampling port. The mobile phase was a mixture of acetonitrile and 0.1 M sodium dihydrogen phosphate at a ratio of 55:45 (% v/v) and adjusted to pH 3 with trifluoroacetic acid. The flow rate was 1 mL/min, the injected volume 20 μL and the UV wavelength was set at 238 nm. The method was validated in terms of linearity, accuracy, precision and specificity according to the criteria recommended by the ICH guidelines (ICH Topic Q 2 (R1). The calibration curve (R2  =  0.9996) was
y  =  61.428 x  +  15.33
where x is the concentration (µg/mL) and y the corresponding peak area and was linear in the concentration range of 0.065–20 µg/mL. The limit of detection was 0.429 µg/mL and the limit of quantitation 1.30 µg/mL.

2.2.3. Preparation of Nanoemulsion-Ultrasonication

On the basis of the results of the screening studies, olive oil, the surfactants Tween 20 and Span 80 (at a ratio 2:1) and cosurfactant N-methylpyrrolidone (10% of surfactant mixture) that gave higher AtrCa solubility were selected for further development of self-emulsifying pellets and tablets. The oil/(surfactant-cosurfactant) ratio used was 6:4 because it has been found previously to give stable emulsions with droplets in the nanosize range [17]. SEDDS ingredients were first mixed until clear liquid formed. AtrCa was then dissolved at concentration 5.0 mg/mL and the solution was kept at 40 °C. Then, deionized water was added to give emulsions with 60% SEDDS, above which stability became an issue.
To refine its texture, increase fluidity and enable easier incorporation of the emulsion in the pellets, it was homogenized by sonication (Ultrasonics Ltd, Sileby, UK). The principle is to direct the coarse emulsion under pressure of about 150–250 psi against sharp-edged blades. This causes vibration of the blades and generation of intense ultrasonic field that breaks up the droplets by a combination of cavitation, shear, and turbulence [18]. About 150 mL emulsion was recycled 5 times, resulting in considerable improvement of smoothness and fluidity. It was subsequently used as a binder liquid for the preparation of pellets by extrusion/spheronization.

2.2.4. Characterization of Emulsion

Viscosity: It was measured using a cup-and-bob viscometer (HAAKE Viscotester VT24, Thermo Fisher Scientific, Karlsruhe, Germany) by adding 20 mL in the gap between the cup and bob and measuring the torque at increasing rotation speeds corresponding to different strain rates from 4 to 122 s−1. Shear stress F (Pa) and shear rate G (s−1) were calculated from Equations (2) and (3). Viscosity was estimated as the slope of the linear portions of the graphs
F = 0.029 × S (Pa)
G = 122/U
where S scale reading and U the selected speed setting.
Zeta Potential (ζ) and Droplet Size: Zeta potential of the SEDDS emulsions and droplet size distribution (hydrodynamic diameter) were analyzed by Dynamic Light Scattering [19] at 25 °C after dilution of SEDDS with deionized water at 1:100 SEDDS dilution unless otherwise stated. Nanoemulsions were placed in the electrophoretic cell of the instrument and ζ, which represents the charge on the droplet surface was obtained from the electrophoretic mobility using the M3-PALS technique. The mean diameter was a hydrodynamic diameter (instrument ‘z-average’). Μeasurements were made in triplicate and means and standard deviations were calculated.

2.2.5. Emulsion stability

Robustness to dilution: The sonicated emulsions were diluted in water of pH 1.2, pH 6.8 and in deionized water at dilutions 1:10, 1:100 and 1:1000 and droplet size and polydispersity index were measured after 24 h at 25 ± 2 °C using Dynamic Light Scattering (Zetasizer, ZEN3600 Malvern Instruments, Worcestershire, UK).
Turbidimetry: Stability of SEDDS emulsion is essential during mixing/massing with the powdered pellet ingredients to ensure successful distribution and formation of extrudable paste. Although this is not an issue for emulsions with medium SEDDS concentration, it may be a problem at the high 60% w/v SEDDS used in the present work. Stability was evaluated using an optical analyzer (Turbiscan® MA Classic 2000, Formulaction, Toulouse, France) (850 nm light, scattered at 135°) calibrated for back scattering with teflon. The test tube sitting vertically was filled with emulsion to 70 mm height and scanned bottom to top at 40 μm height intervals. Profiles of back scattering (BS%) with distance of the resting emulsion were recorded every 5 min.

2.2.6. Preparation of Self Emulsifying Pellets (SEPs)

For the preparation of pellets, 20 g of Aerosil 200 (CSD) and Avicel 101 (MCC) at 7:3 ratio were mixed for 15 min in a Turbula mixer (Banchofen, Switzerland) and transferred to a 800 mL cylindrical vessel. Emulsion (40 mL) was added dropwise for about 6 min to the powders and the resulting paste was extruded in a radial extruder (Model 20, Caleva Process Solution, Dorset, UK) operated at 25 rpm and fitted with a 1 mm circular orifice and 1.75 mm thickness screen. The extrudate was immediately processed for 5 min at 1.360 rpm corresponding to a linear peripheral speed of 8.55 m/s in a spheronizer (Model 120, Caleva Process Solution, Dorset, UK) fitted with a cross-hatch friction plate. The produced SEPs were dried overnight at 37 °C in an air-circulation tray oven (UT6, Heraeus Instruments, Hanau, Germany). The composition of the final dry pellets is given in Table 2.

2.2.7. Chemical Stability

Chemical stability was examined in terms of drug content after storage for six months at two temperature/relative humidity (RH) conditions: 25 ± 2 °C/60 ± 5 RH% and at 40 ± 2 °C/75 ± 5 RH%. For the analysis, suitable quantity of SEPs was dispersed in 100 mL methanol in a volumetric flask, sonicated to extract AtrCa completely, and centrifuged to separate undissolved excipients. The supernatant was filtered through 0.45 µm membrane filter, diluted suitably and analyzed for drug using HPLC as described above.

2.2.8. Characterization of Self Emulsifying Pellets

Pycnometric and tap densities

Pellet density was determined with helium pycnometry (Ultrapycnometer 1000, Quantachrome Instruments, Boynton, FL, USA). Bulk and tap densities of the pellet bed were determined according to USP II using a tester fitted with a 50 mL cylinder (Erweka, Germany). The volume of the pellets was recorded after pouring into the cylinder 50 g samples and applying 300 taps. Values of bulk density (weight/initial volume), tapped density (=weight/tapped volume), Hausner ratio (=final/initial density), and Carr index (=%difference of final and initial density relative to final) were calculated as indices of packing ability.

Particle Size and Shape Analysis

Size distribution and shape analysis of the pellets were performed using an image processing and analysis system comprised of stereomicroscope, top cold light source (Olympus SZX9, Olympus Corporation, Tokyo, Japan and Highlight 3100, Olympus Optical, Tokyo, Japan), video camera (VC-2512, Sanyo Electric, Osaka, Japan), and appropriate software (Quantimet 500, Leica Microsystems, Cambridge, UK). About 100 pellets were examined in 3–4 optical fields, at a 6.5 × 5 = 32.5 magnification. Mean pellet diameter was expressed as equivalent diameter of a sphere having the same projected area. Pellet shape was expressed as circularity (= 4 × π × perimeter2) which is sensitive to perimeter length or surface irregularity [20] combined with the shape index eR (Equation (4)) which is more sensitive to deviations from sphericity. Their value increases as the shape approaches that of a perfect sphere.
e R =   2 × π × r a d i u s p e r i m e t e r     1   ( W i d t h L e n g t h ) 2  
Pellet friability: This was determined with an apparatus (Copley Scientific, type FRV 2000, Nottingham, UK) fitted with abrasion drum, and rotated at 25 rpm for 10 min. 2-gram SEPs in the size fraction 850–1200 µm were placed in the drum together with 6 g/4 mm diameter glass beads. The fines produced due to the shocks and abrasion of the falling pellets on the baffles of the drum were separated by sieving through a 600 µm sieve for 5 min at 2 mm vibration amplitude (Fritsch Analysette, Oberstein, Germany). Friability was calculated from the weight difference of the pellets before and after testing, expressed as %initial weight.

2.2.9. Reconstitution of Emulsions from Pellets

The ability of SEDDS to re-emulsify from the pellets was evaluated using a USPII rotating paddle dissolution apparatus (Pharma-Test, Hainburg, Germany) in conjunction with a turbidimeter (TURBISCAN Classic, MA2000 Formulaction, Toulouse, France) operated in transmission mode. 1-g pellets corresponding to 0.55 g SEDDS were placed in 200 mL distilled water of 37 °C and agitated at 100 rpm [17]. Samples of 5 mL were withdrawn at 2, 15, 30, 60, 120, and 180 min intervals and analyzed for transmittance (T%, λ = 850 nm). Transmittance was measured directly or after centrifugation of the samples for 3 min at 1000 rpm (Labofuge 400R, Heraeus, Fisher Scientific, Leicestershire, UK) to remove any disintegrating particles.

2.2.10. Preparation of Self-Emulsifying Tablets (SETs)

Tablets of 177 mg weight were prepared using an instrumented press (8.0 mm flat-edged punches, Gamlen D-Series Press, Nottingham, UK) in the range 40–100 MPa at 3 mm/s compression rate. Force-displacement profiles were recorded during the compression and ejection stages. Ejectability was taken as the maximum ejection force. Since preliminary experiments had shown that SEPs could not form good tablets on their own, they were compressed after mixing with 20%, 30%, and 40% Avicel 101 and compressed at three compressions of 20, 40, and 60 MPa. The tableting experiments were organized in a small experimental design shown in Table 3.

2.2.11. Evaluation of SETs

The weight of SETs before placing in the die for compression and of the ejected tablet after wiping with filter paper were measured with accuracy ±0.01 mg (New Classic MF, Mettler Toledo, Greifensee, Switzerland). No significant weight change was noticed to suggest leakage in the compression range 20 to 60 MPa.
Tablet porosity: The weight (Wt) and dimensions of tablets were measured with accuracy ±0.001 g (UW 220 balance, Shimadzu Corporation, Kyoto, Japan) and ±0.01 mm (Moore & Wright micrometer, Moore & Wright, Sheffield, UK) respectively. From the tablet volume (Vt) and the particle density Ps (g/cc) (taken as the weighted average of components obtained from the Handbook of Pharmaceutical Excipients) the porosity (%) was calculated from Equation (5).
Tablet Porosity = 1 − [(Wt/Vt)/Ps)]
Tensile strength and friability: Tablet tensile strength was determined by diametrical loading with the apparatus that was used for compression (Gamlen D-Series Press, Gamlen Tableting, Nottingham, UK), but operated in fracture mode (10 Kg load cell). Tensile strength (T) was calculated from Equation (6) [21]
T = 2Fπ/Φh
F is the breaking load, Φ the tablet diameter and h its thickness. Friability was determined according to USP 1216 using the apparatus described above for pellets (Copley Scientific, type FRV 2000, Nottingham, UK) but after replacing the abrasion drum with the Roch design drum. Tablets of about 6.5 g total weight were added to the drum and rotated for 5 min at 25 rpm. They were subsequently removed and weighed. Friability was the %weight difference of tablets before and after testing relative to original weight. Three measurements were taken and mean and standard deviations calculated.

2.2.12. In Vitro Release

Drug release studies were carried out using samples of self-emulsifying pellets, self-emulsifying tablets and commercial tablets corresponding to 10 mg AtrCa. The tests were conducted in triplicate in 900 mL of pH 1.2 or pH 6.8 medium at 75 rpm and 37 ± 0.5 °C on a USP II apparatus (Sotax AG, Aesch, Switzerland) (n = 3). Aliquots were removed at: 5, 10, 15, 30, 45, 60, 90, 120, 150, 180, 240 min time intervals, filtered through a 0.45 µm pore size membrane filter, diluted suitably and analyzed by HPLC at 237 nm [22].

2.2.13. Permeability experiments-Caco-2 Cells

Permeability studies were performed with Caco-2 cells prepared by seeding 4 × 10⁵ cells in each of six wells with transwell polycarbonate filters (pore size 0.4 µm, filtration area 4.2 cm2, Millipore, Spain). Transepithelial electrical resistance (TEER) value for the integrity of the monolayer of cells was measured at the beginning and the end of the experiment and was in the range 1500–1800 ohm × cm2. The cell culture was maintained at 37 °C under 90% humidity and 5% CO2 in the incubator (Esco, Singapore) and the cells were used 21 days after seeding [23]. Transition studies were conducted from the apical to the basolateral direction (A-B) and vice versa (B-A) at 37 ± 0.5 °C and 50 rpm stirring rate. Unprocessed drug powder or self-emulsifying pellets dispersed from SETs corresponding to 10 mg drug were suspended in medium of pH 7.4. 200-μL samples were taken at 0, 30, 60, 90 and 120 min. The apparent permeability coefficient (Papp, cm s−1) was determined from the slope (dQ/t) of the linear part of the plots of cumulative amounts of permeated AtrCa (Q) with time (t) using Equation (7) [24].
Papp = dQ/dt/(A × Co)
A is the surface of the membrane and Co the initial concentration of the drug in the apical compartment. The tests were repeated in triplicate and mean Papp values and standard deviations calculated. To test the validity of the method, the amount of drug remaining in the membrane (Am) and in the cell (AOH) was also determined.

2.2.14. Cytotoxicity Test

Cells were plated on 96-well flat-bottom polycarbonate filters (pore size 0.4 µm, filtration area 4.2 cm2, Millipore Iberica, Madrid, Spain), each well at a density of 1 × 10⁻⁴ cells and incubated for 24 h at 37 ± 0.5 °C in a CO2 incubator [23]. To examine cytotoxicity, samples of pure AtrCa powder, SEPs dispersed from SETs and commercial tablet corresponding to 10 mg AtrCa were incubated with Caco-2 cells for 24, 48 and 72 h. At the end of this period, 100 μL MTT (from a 5 mg/mL stock MTT/PBS solution) was added to each well in cell culture and allowed to incubate for 4 h. Media containing the cytotoxicity-tested samples were removed and 100 μL DMSO was added to each one of the 96-well cell culture. In the permeability and cytotoxicity studies, the final concentration of drug was for all formulations 10 mg/mL. To determine viability, absorbance values at 237 nm were read using an ELISA microplate reader UV spectrophotometer (Thermo vario scan-FHA multiplate reader). Cell viability was obtained from Equation (8) where T is the absorbance of the tested samples and R that of the control.
Cell viability (%) = 100 × (T/R)

3. Results and discussion

3.1. Screening Studies

The results of the solubility studies of AtrCa in various oils, surfactants, cosurfactants, and water obtained by HPLC are presented in Table 1. From the examined oils the drug showed highest solubility in oleic acid (27.40 mg/mL). Since this has also been reported to improve the bioavailability of SEDDS formulations, it was used as the oil component [25,26,27]. From the tested surfactants AtrCa showed highest solubility in Tween 20 (263.5 mg/mL) and then in Span 80 (HLB 4.3) (47.4 mg/mL). Therefore, Tween 20 and Span 80 were selected as the surfactants at a ratio 2:1. This provided optimal HLB 12.69 (=0.666 × 16.9 + 0.333 × 4.3 = 12.69) which is within the range of SEDDS formulations that belong to IIIA lipid formulation system [17,28]. Additionally, there is similarity of the hydrophobic part of Span 80 with oleic acid which favors stability [29]. From the tested co-surfactants AtrCa showed higher solubility in N-methylpyrrolidone (110.55 mg/mL) which was added as cosurfactant in the surfactant mixture (10% w/w) to increase further the drug solubility [30]. A ratio 6:4 of oil/(surfactant/cosurfactant) was used, which was previously found to give stable SEDDS emulsions over a wide range of water dilutions [17].

3.2. Preparation

Conventional emulsions usually present stability problems above a 25% w/w oil phase, whereas SEDDS form stable emulsions at much higher concentrations due to the stabilizing crystal like structure of the droplet/medium interface [31,32]. In this work, the maximum SEDDS concentration (dispersed phase) in deionized water that could form o/w emulsion was sought and was estimated visually to be about 60–70% w/w. However, since the emulsion prepared by simple mixing of SEDDS with water had a viscous appearance, sonication was applied to improve texture and fluidity before its use as a binder in the preparation of SEPs [14,33].

3.3. Characterization of Microemulsions

3.3.1. Rheology

The results of viscosity, average droplet size and zeta potential of the sonicated and non-sonicated emulsions with 60% w/w SEDDS are presented in Figure 1, Figure 2 and Figure 3 and Table 4.
Figure 1 presents shear stress vs shear rate plots (rheograms) for non-sonicated and sonicated SEDDS 60% w/w emulsions with or without added drug. It can be seen that above a shear rate of about 20 s−1 the rheograms exhibit mostly Newtonian rheology. The rheograms of the sonicated inert or drug loaded emulsions lie below those of the non-sonicated emulsions and the respective slopes of the linear parts expressing viscosity are also smaller. From Table 4 it can be seen that the viscosity of the drug-loaded sonicated emulsion is much lower than the non-sonicated (68.5 cP compared to 249.5 cP). This indicates efficiency of the applied sonication, resulting in smooth texture and greater fluidity, which is important for efficient mixing with the solid pellet components and formation of extrudable paste [34].

3.3.2. Droplet Size and Zeta Potential

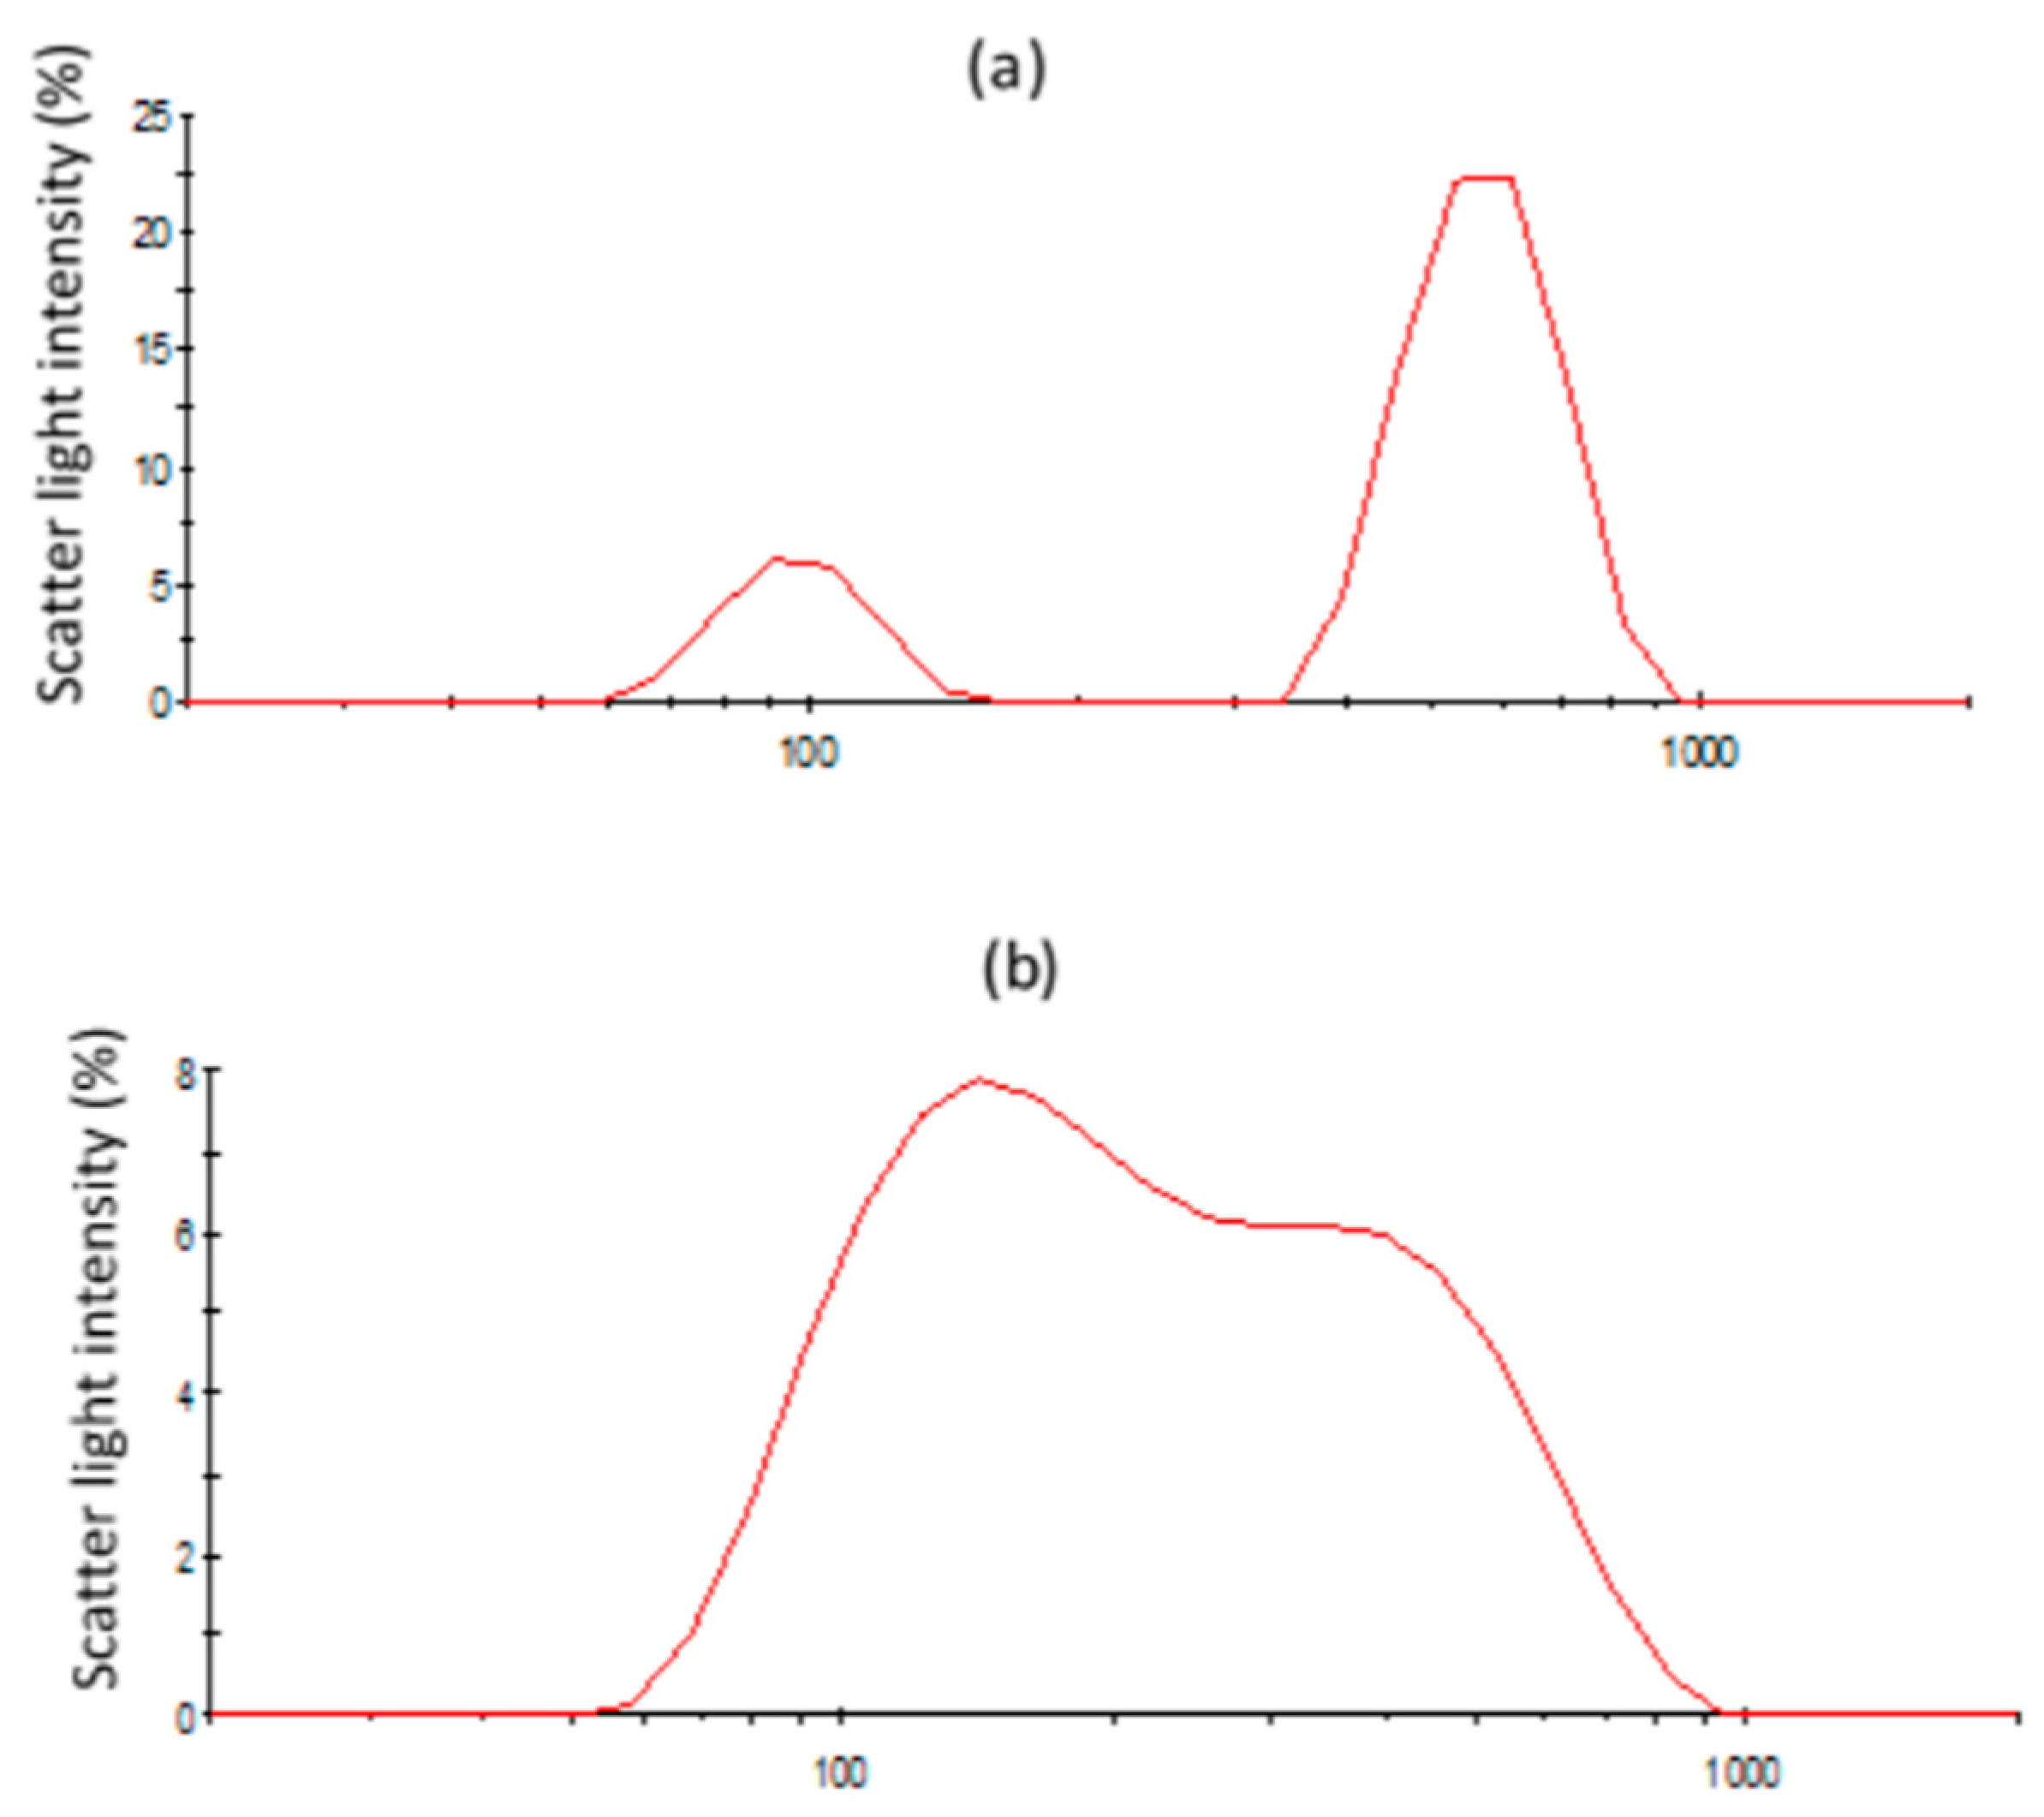
Figure 2 presents the distributions of hydrodynamic diameter for sonicated and non-sonicated nanoemulsions. The ultrasonic homogenizer creates high-intensity waves which generate intense shear and pressure gradients in the liquid resulting in cavitational effect and size reduction [18]. This can be seen in Figure 2 as a change in the distribution of the sonicated emulsions from a bimodal to a monomodal broad droplet size distribution, tailing to larger droplets. Overall, the size distribution of the sonicated emulsion is shifted to smaller sizes which is evidenced by the lower average hydrodynamic diameter of 321 nm compared to 1370 nm (Table 4). The tailing to the right of the distribution (Figure 2b), has been associated with instability [14]. However, light scattering experiments that were conducted (see below) did not show significant changes in the structure of the emulsion for over 1 h period, which is sufficient for the preparation of SEPs. Therefore, sonication effectively reduced droplet size and homogenized the high SEDDS content emulsion.
The zeta potential value in the optimized formulations provides information about the stability of a dispersion. The values of the untreated and sonicated emulsions were found to be negative –7.98 mV and –7.05 mV, respectively (Table 4), which may be ascribed to the presence of free fatty acids. However, this value is rather low to contribute significantly to the stability of the emulsion [19,34].

3.3.3. Structural Changes of Emulsions Followed by Light Scattering

Figure 3 presents profiles of back scattering (%) vs distance for emulsions at rest. They were recorded every 5 up to 105 min (curves correspond to recording times increasing top to bottom). Pictures of the respective emulsions taken at the end of the experiments are also shown. From Figure 3a it can be seen that the profiles of the non-sonicated emulsions have waveform appearance indicating non-homogeneity. This is due to stratification of the emulsion in zones of cracked emulsion alternating with zones of separated oil, indicating that simple mixing or emulsion phases is not enough for homogeneous, stable dispersion (Figure 3b).
On the contrary, the profiles of the sonicated emulsions shown in Figure 3c are mostly linear and parallel to the horizontal axis, indicating homogenous consistency. In the first hour, peaks facing upwards are seen at a distance of 65–67 mm from the bottom of tube, which correspond to creaming due to droplet migration from the intermediate and higher emulsion layers to the surface. After 1 h, a BS% minimum appears at about 10–15 mm from the bottom (green curves) indicating depletion of droplets from the lower layers migrating to the surface. The downwards facing peaks that precede the creaming peaks are typical of highly concentrated emulsions and are ascribed to the self-assembling of droplets resulting in greater light path and decrease of scattering (Turbisoft Classic MA2000, User Guide, Formulaction, Toulouse, France). The general shifting of the curves towards lower BS% with time imply increase in droplet size. Overall, from the profiles in Figure 3c and the corresponding picture (Figure 3d) it can be said that the sonicated 60% SEDDS emulsions remain stable long enough to be added as binder for the preparation of SEPs. Furthermore, by gentle stirring creaming could be avoided.

3.3.4. Robustness to Dilution

Dynamic light scattering has been used extensively for screening in vitro dilution characteristics of SEDDS [17,35,36]. Following this line of study, the robustness to dilution was estimated from measurements of the mean hydrodynamic diameter of the sonicated emulsion in different media: Deionized water, pH 1.2, and pH 6.8, at different dilutions such as 1:10, 1:100 and 1:1000. The results are presented in Table 5 where it can be seen that in all cases the droplets remained in the nanosize range. The variability of the measured values within a pH medium expressed as CV% was reasonable and the values were similar between 19.3% and 22.8%, implying robustness and similar behavior of the emulsion in the different regions of the gastrointestinal tract.
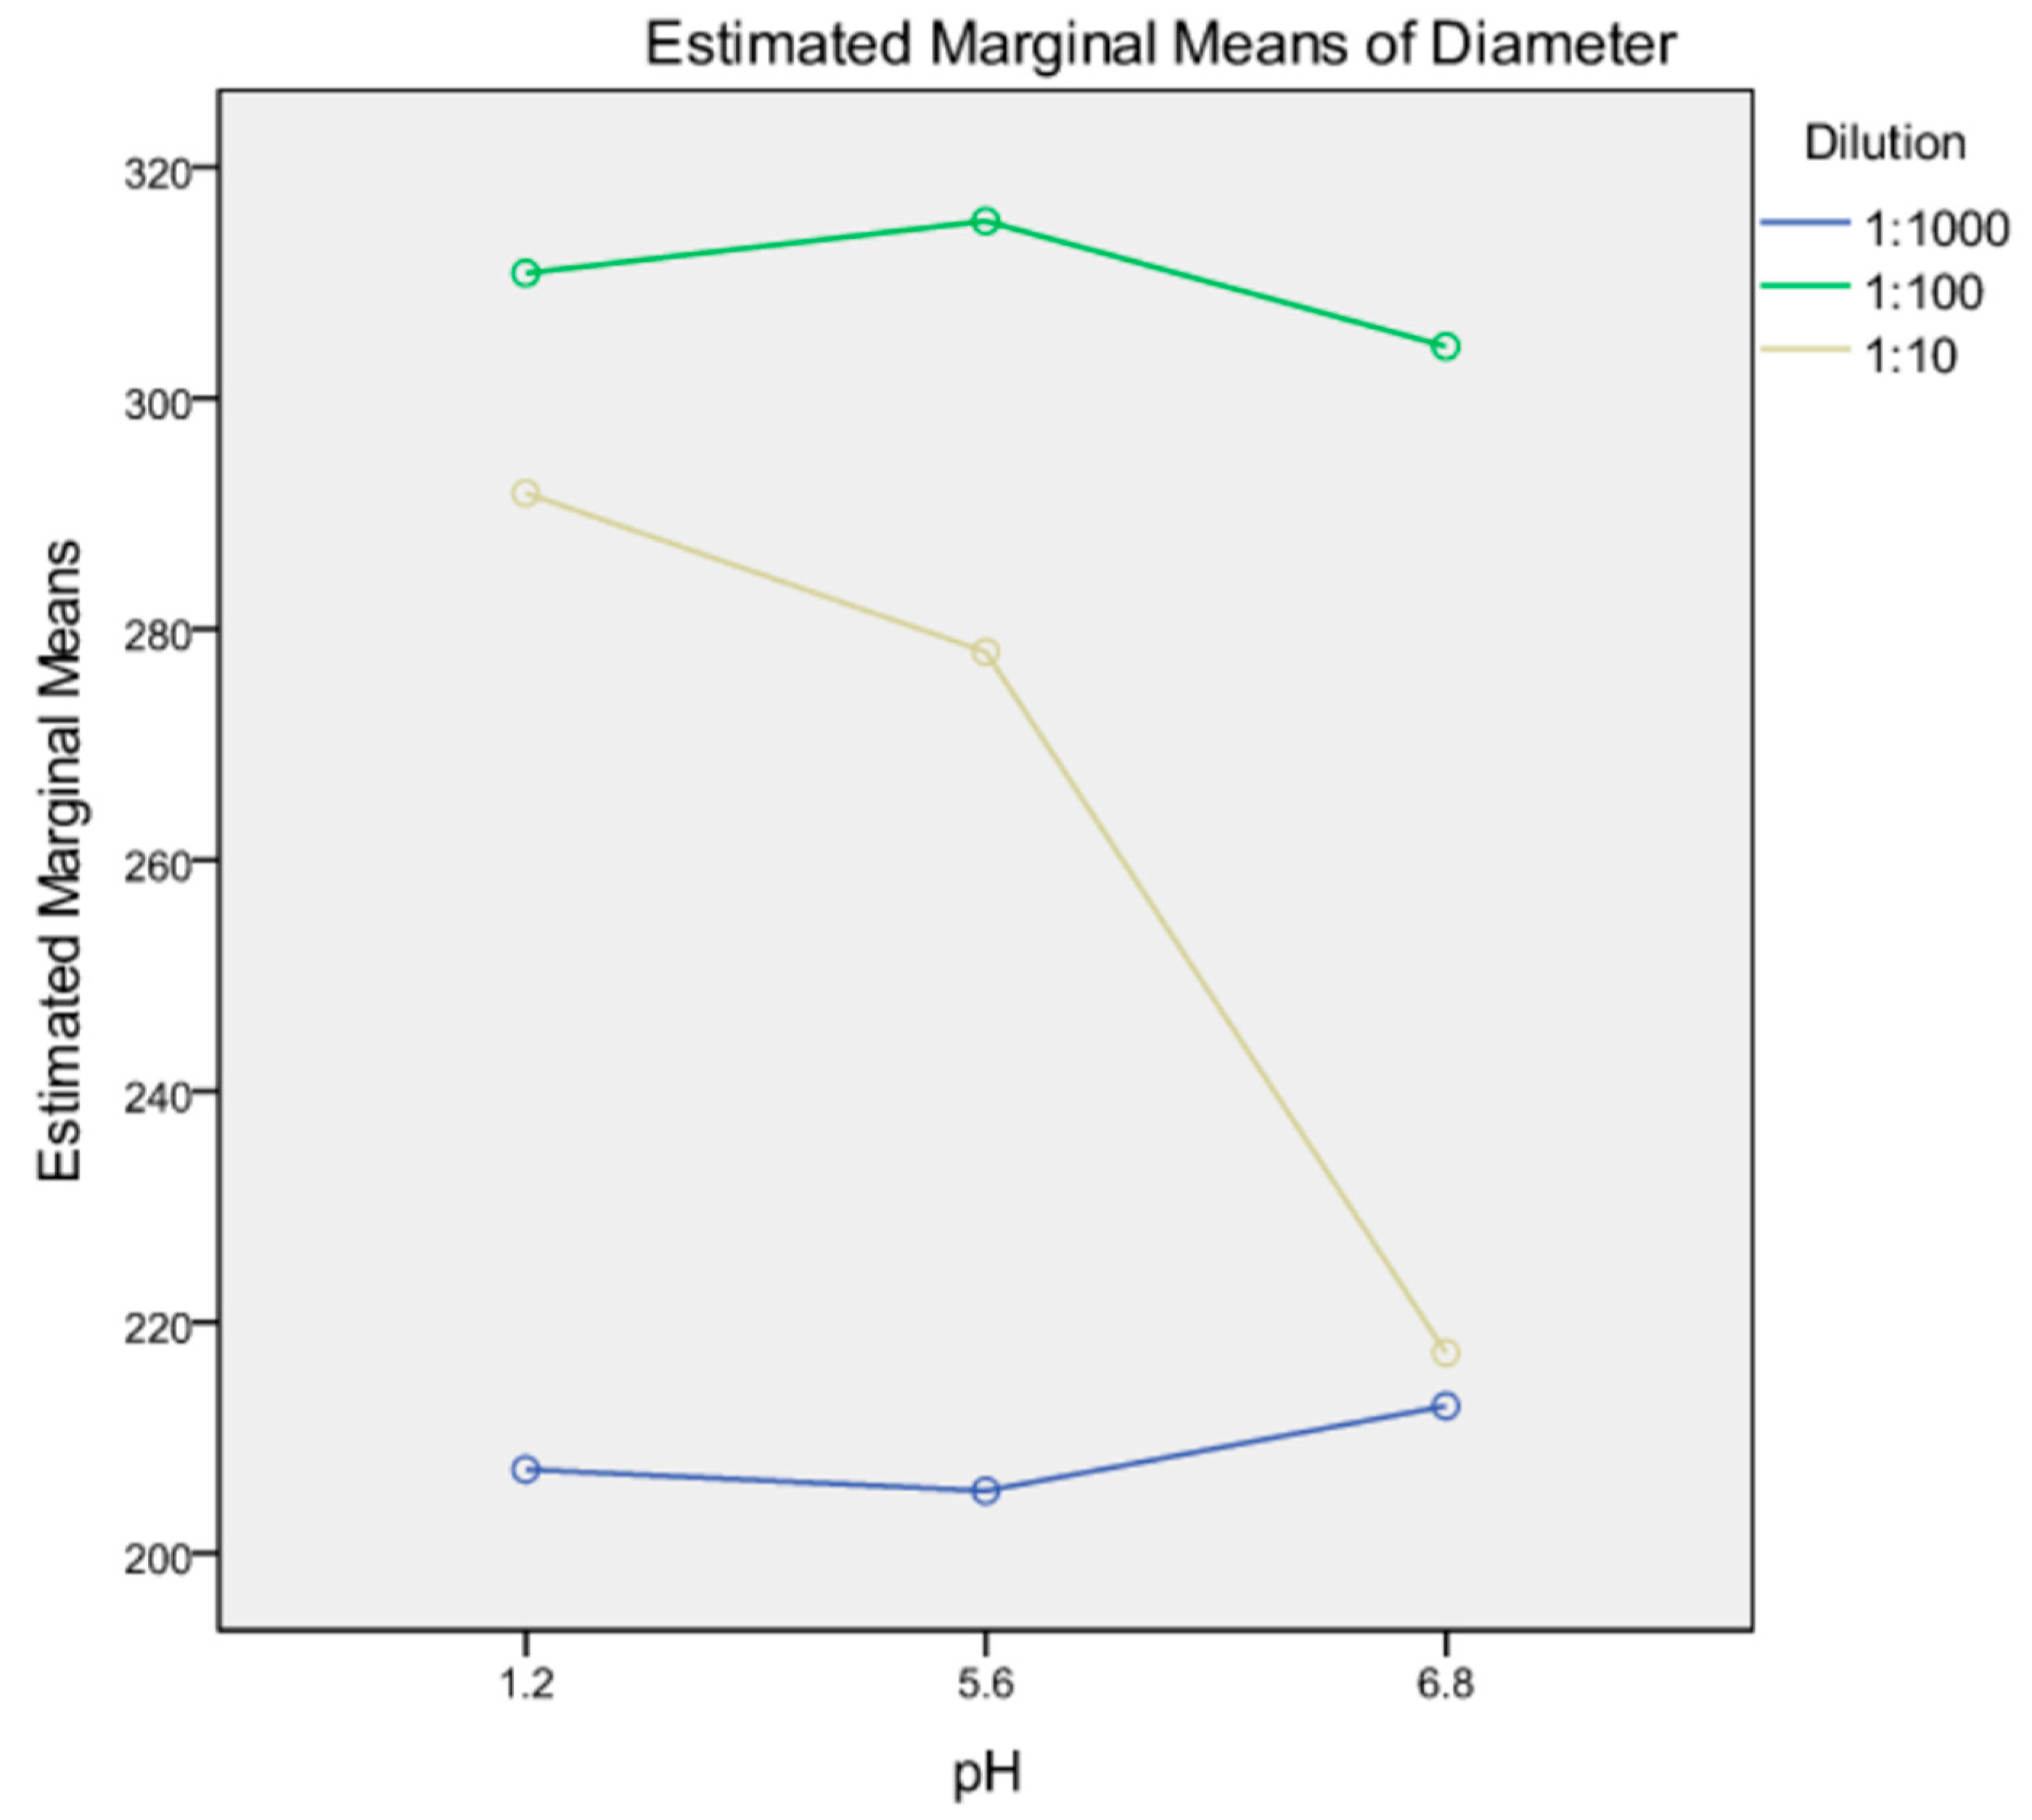
ANOVA was applied to evaluate statistically the results. Significant interaction (p < 0.001) was found between the two factors as demonstrated graphically in Figure 4. It is seen that although the effect of pH on diameter at dilutions 1:100 (CV% 2.5%) and 1:1000 (CV% 3.3%) was negligible, it was significant at 1:10 (CV% 14.8%) manifested as a diameter drop at pH 6.8. The greater CV% at 1:10 may be associated generally with the multiple scattering effect of light and droplet interaction restricting independent movement, which is affected by the pH. Generally, the present results are in concordance with the manufacturer’s instructions and with the results of Petrochenko et al. (2019) [37] suggesting dilutions 1:100 or above for measurement of droplet diameter by dynamic light scattering.

3.4. Composition of Self-Emulsifying Pellets (SEPs)

For the preparation of self-emulsifying pellets, the sonicated 60% SEDDS nanoemulsion with good fluidity (Figure 1), fine droplet size range (Figure 2), and good stability (Figure 3) was used. The high SEEDS concentration emulsion binder was selected to increase SEDDS content, and hence drug in the pellets. CSD was selected as an adsorbent with high retention capacity to increase consumption of the SEDDS emulsion (binder) and also because of its pellet forming ability with non-ionic systems [38]. MCC at a ratio CSD/MCC 7:3 was added to improve pellet characteristics. This CSD/MCC combination increased SEDDS emulsion consumption twice (14 g CSD and 6 g MCC required 40 mL of SEDDS emulsion), compared to 1.1 times the solids weight when only MCC is used [17], thus, increasing considerably drug content in the pellets. The nominal content of AtrCa (2.7%, Table 2), makes possible the development of a formulation containing the required 10 mg dosage.

3.5. Particle Size, Shape, and Packing of SEPs

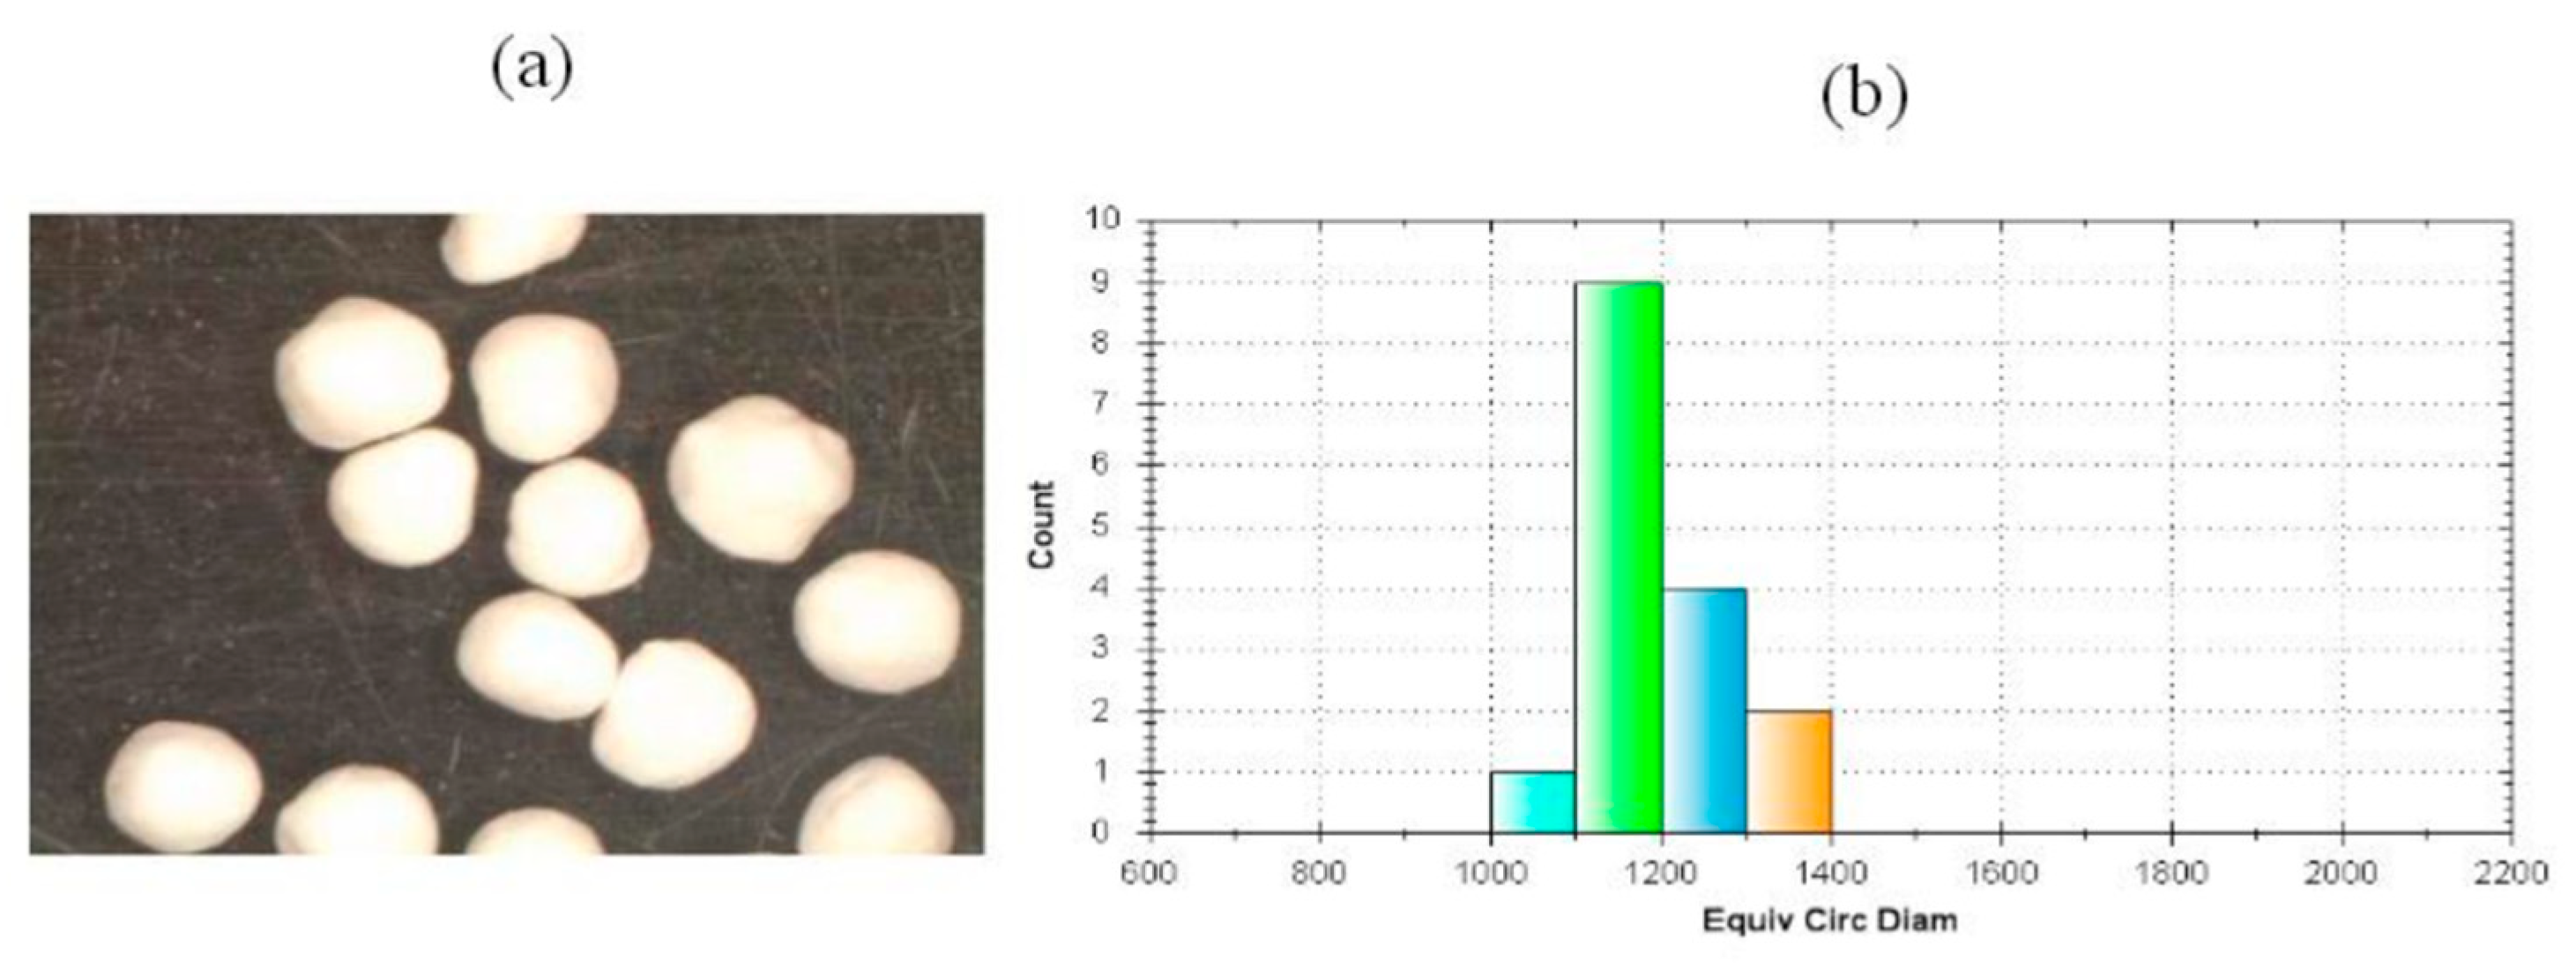
Table 6 presents results of particle size, shape, and density of the prepared pellets as well as their packing characteristics. Complementary, the size distribution of the pellets is presented in Figure 5 as histogram constructed from microscopy data, together with the corresponding image. It can be seen that the pellets follow a normal size distribution with a median diameter 1065 μm. The pellet shape was nearly spherical with reasonably smooth surface having a value of circularity 0.832 and shape index eR 0.469 (Table 6). The last value is only slightly lower than for SEPs prepared with SEDDS emulsions using only MCC as pellet former [39] and can be attributed to the good fluidity of the SEDDS emulsion (Figure 1) and to the presence of surfactants in the SEDDS facilitating spreading and distribution to the solid pellet ingredients [40].
Furthermore, from Table 6 it is seen that SEPs have a low Carr’s index value (6.49%) indicating good packing ability. This is due to the absence of frictional forces, as manifested by the low value of Hausner’s ratio (1.07). The low friction is attributed to the spherical pellet shape and to the lubricating effect of some oil present on the surface [39]. These two enable easy slippage, rearrangement, and settlement during tapping.

3.6. Friability of SEPs

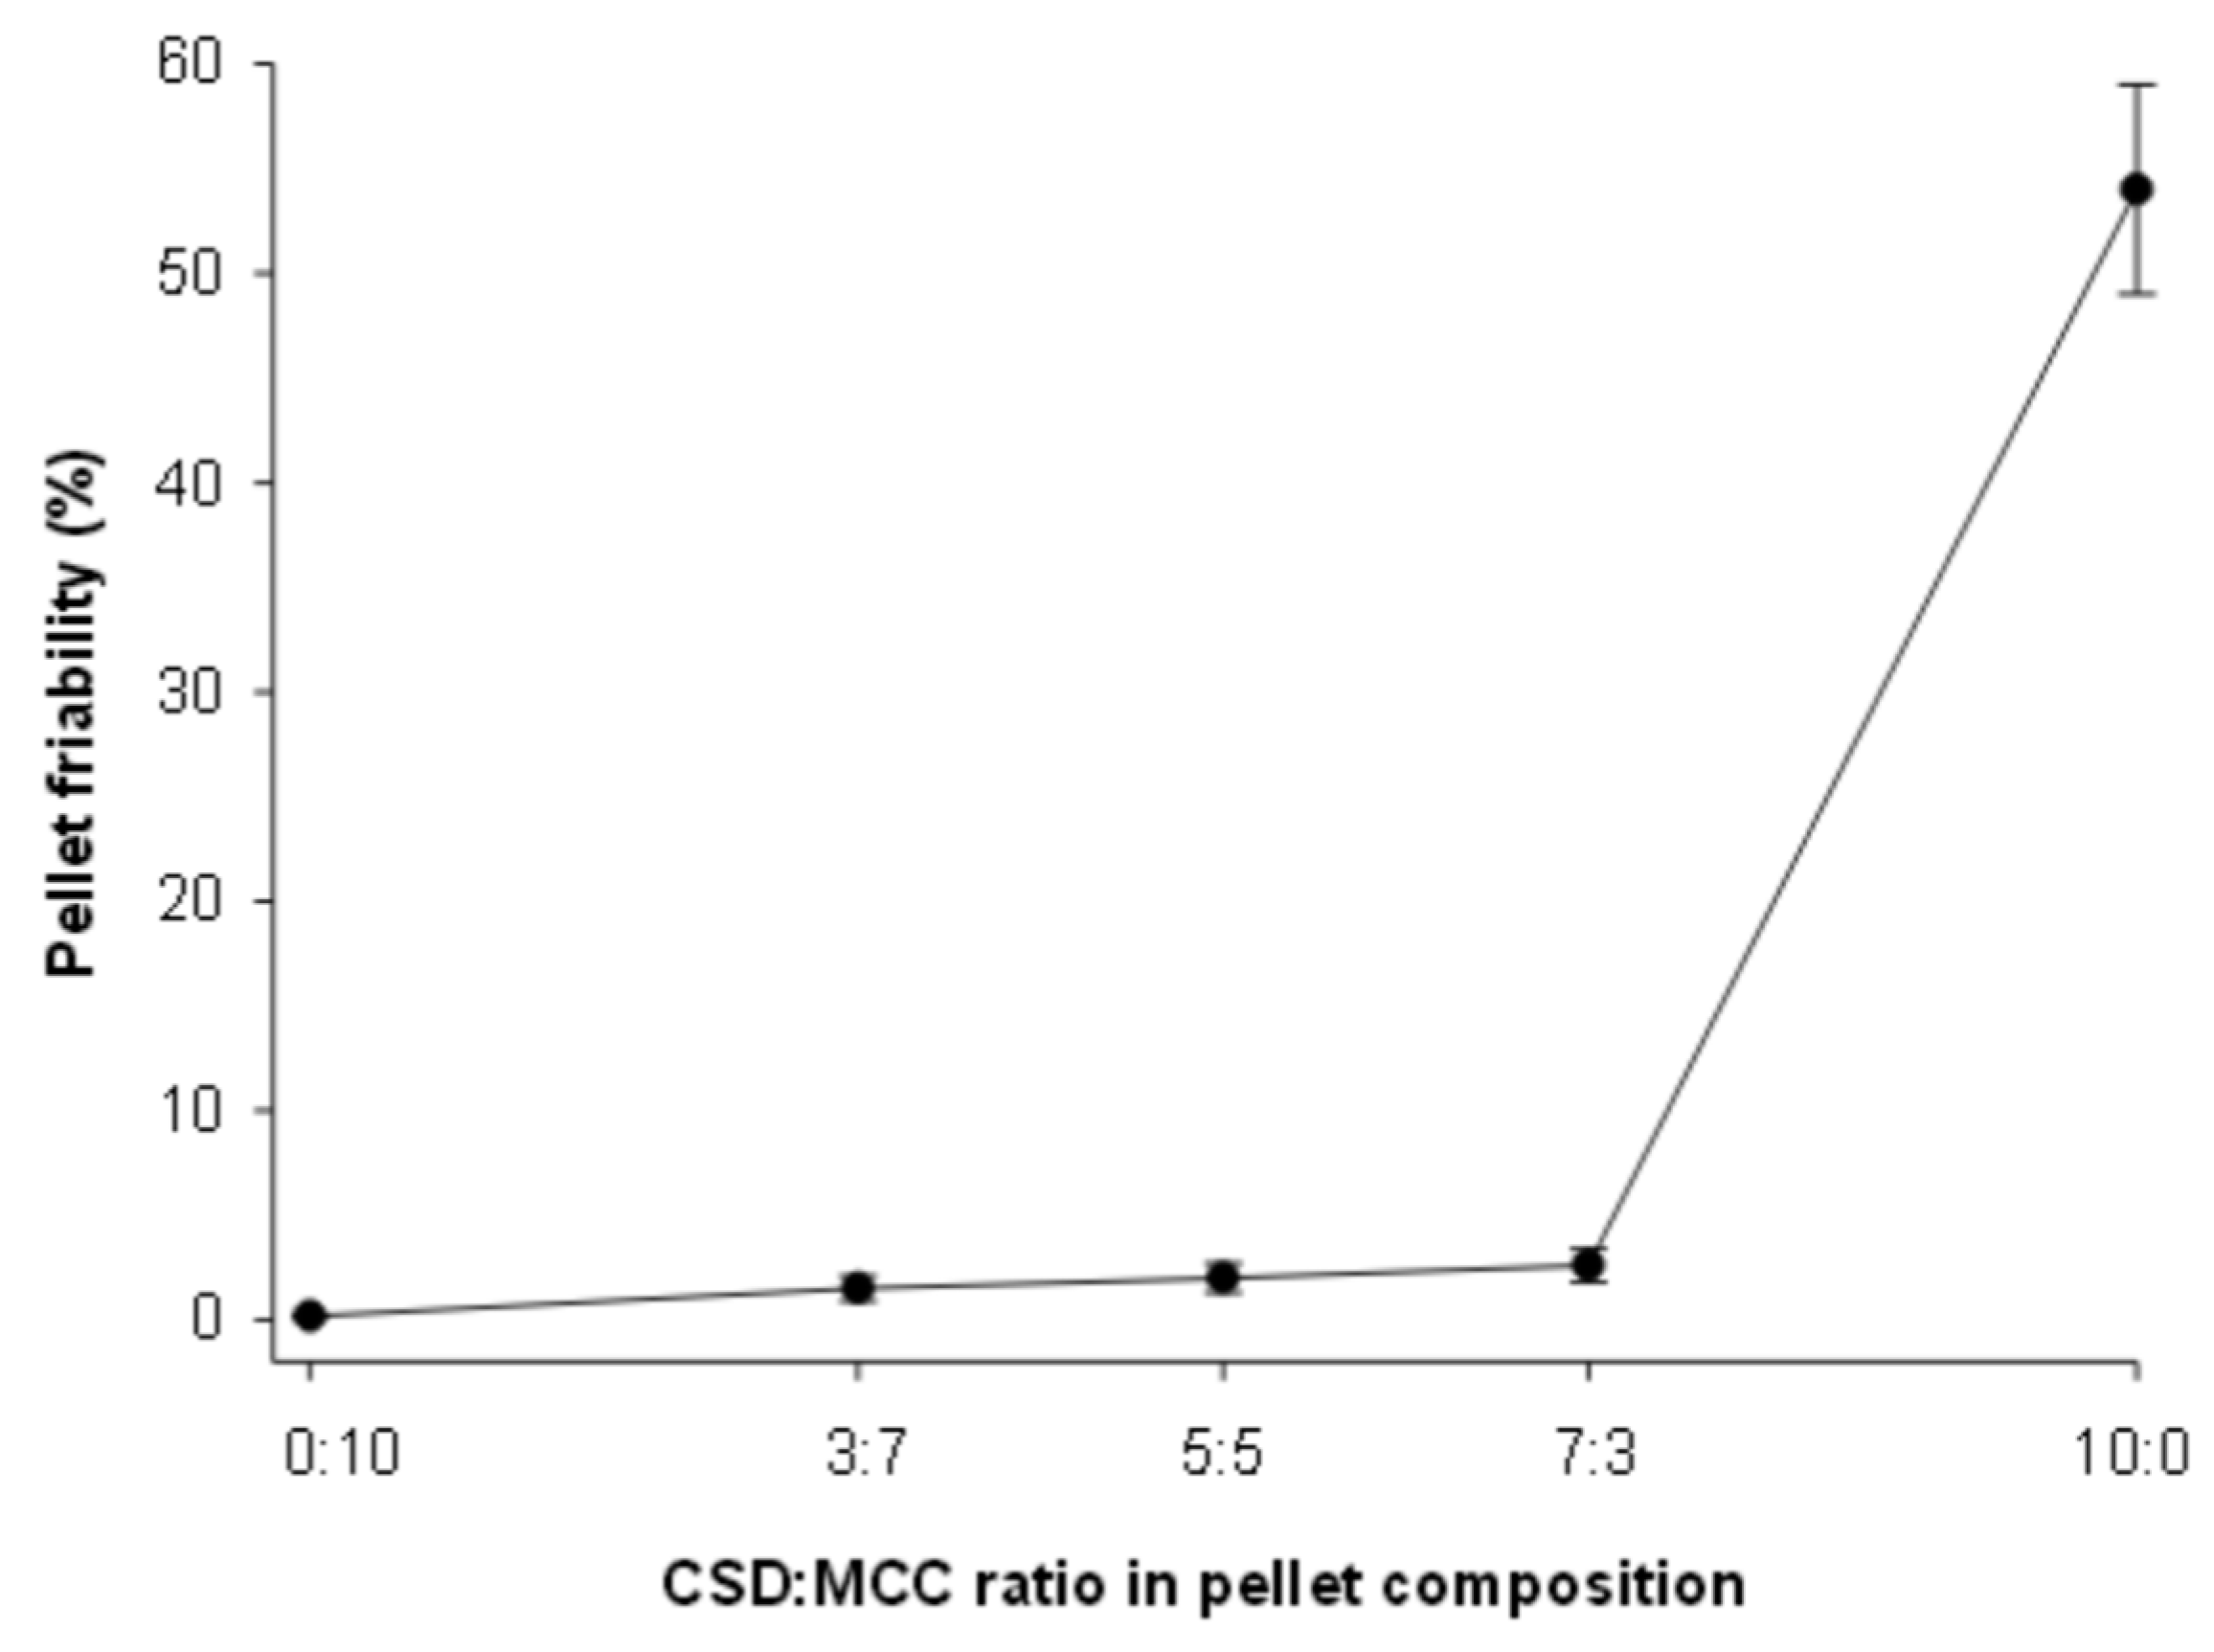
Figure 6 presents plots of pellet friability (%) against CSD/MCC ratio. Although CSD forms pellets with non-ionic SEDDS these are too weak for further processing [38]. This is associated with the state of water in the CSD particles, being chemically bound to SiO2 forming silanol (—Si—OH) and siloxan (—Si—O— Si—) groups [41]. On the contrary, the water in MCC is bound by hydrogen bonding to the MCC hydroxyl groups rendering elasto-plasticity and strength to the wet mass. From Figure 6 it appears that when MCC is added at a CSD/MCC 7:3 ratio friability remained low enabling further processing. Therefore, the 3:7 CSD/MCC ratio with acceptable friability (1.3%, Table 6) and large SEDDS emulsion consumption (Section 3.4) was used for the preparation of SEPs.

3.7. Reconstitution of Emulsions from SEPs

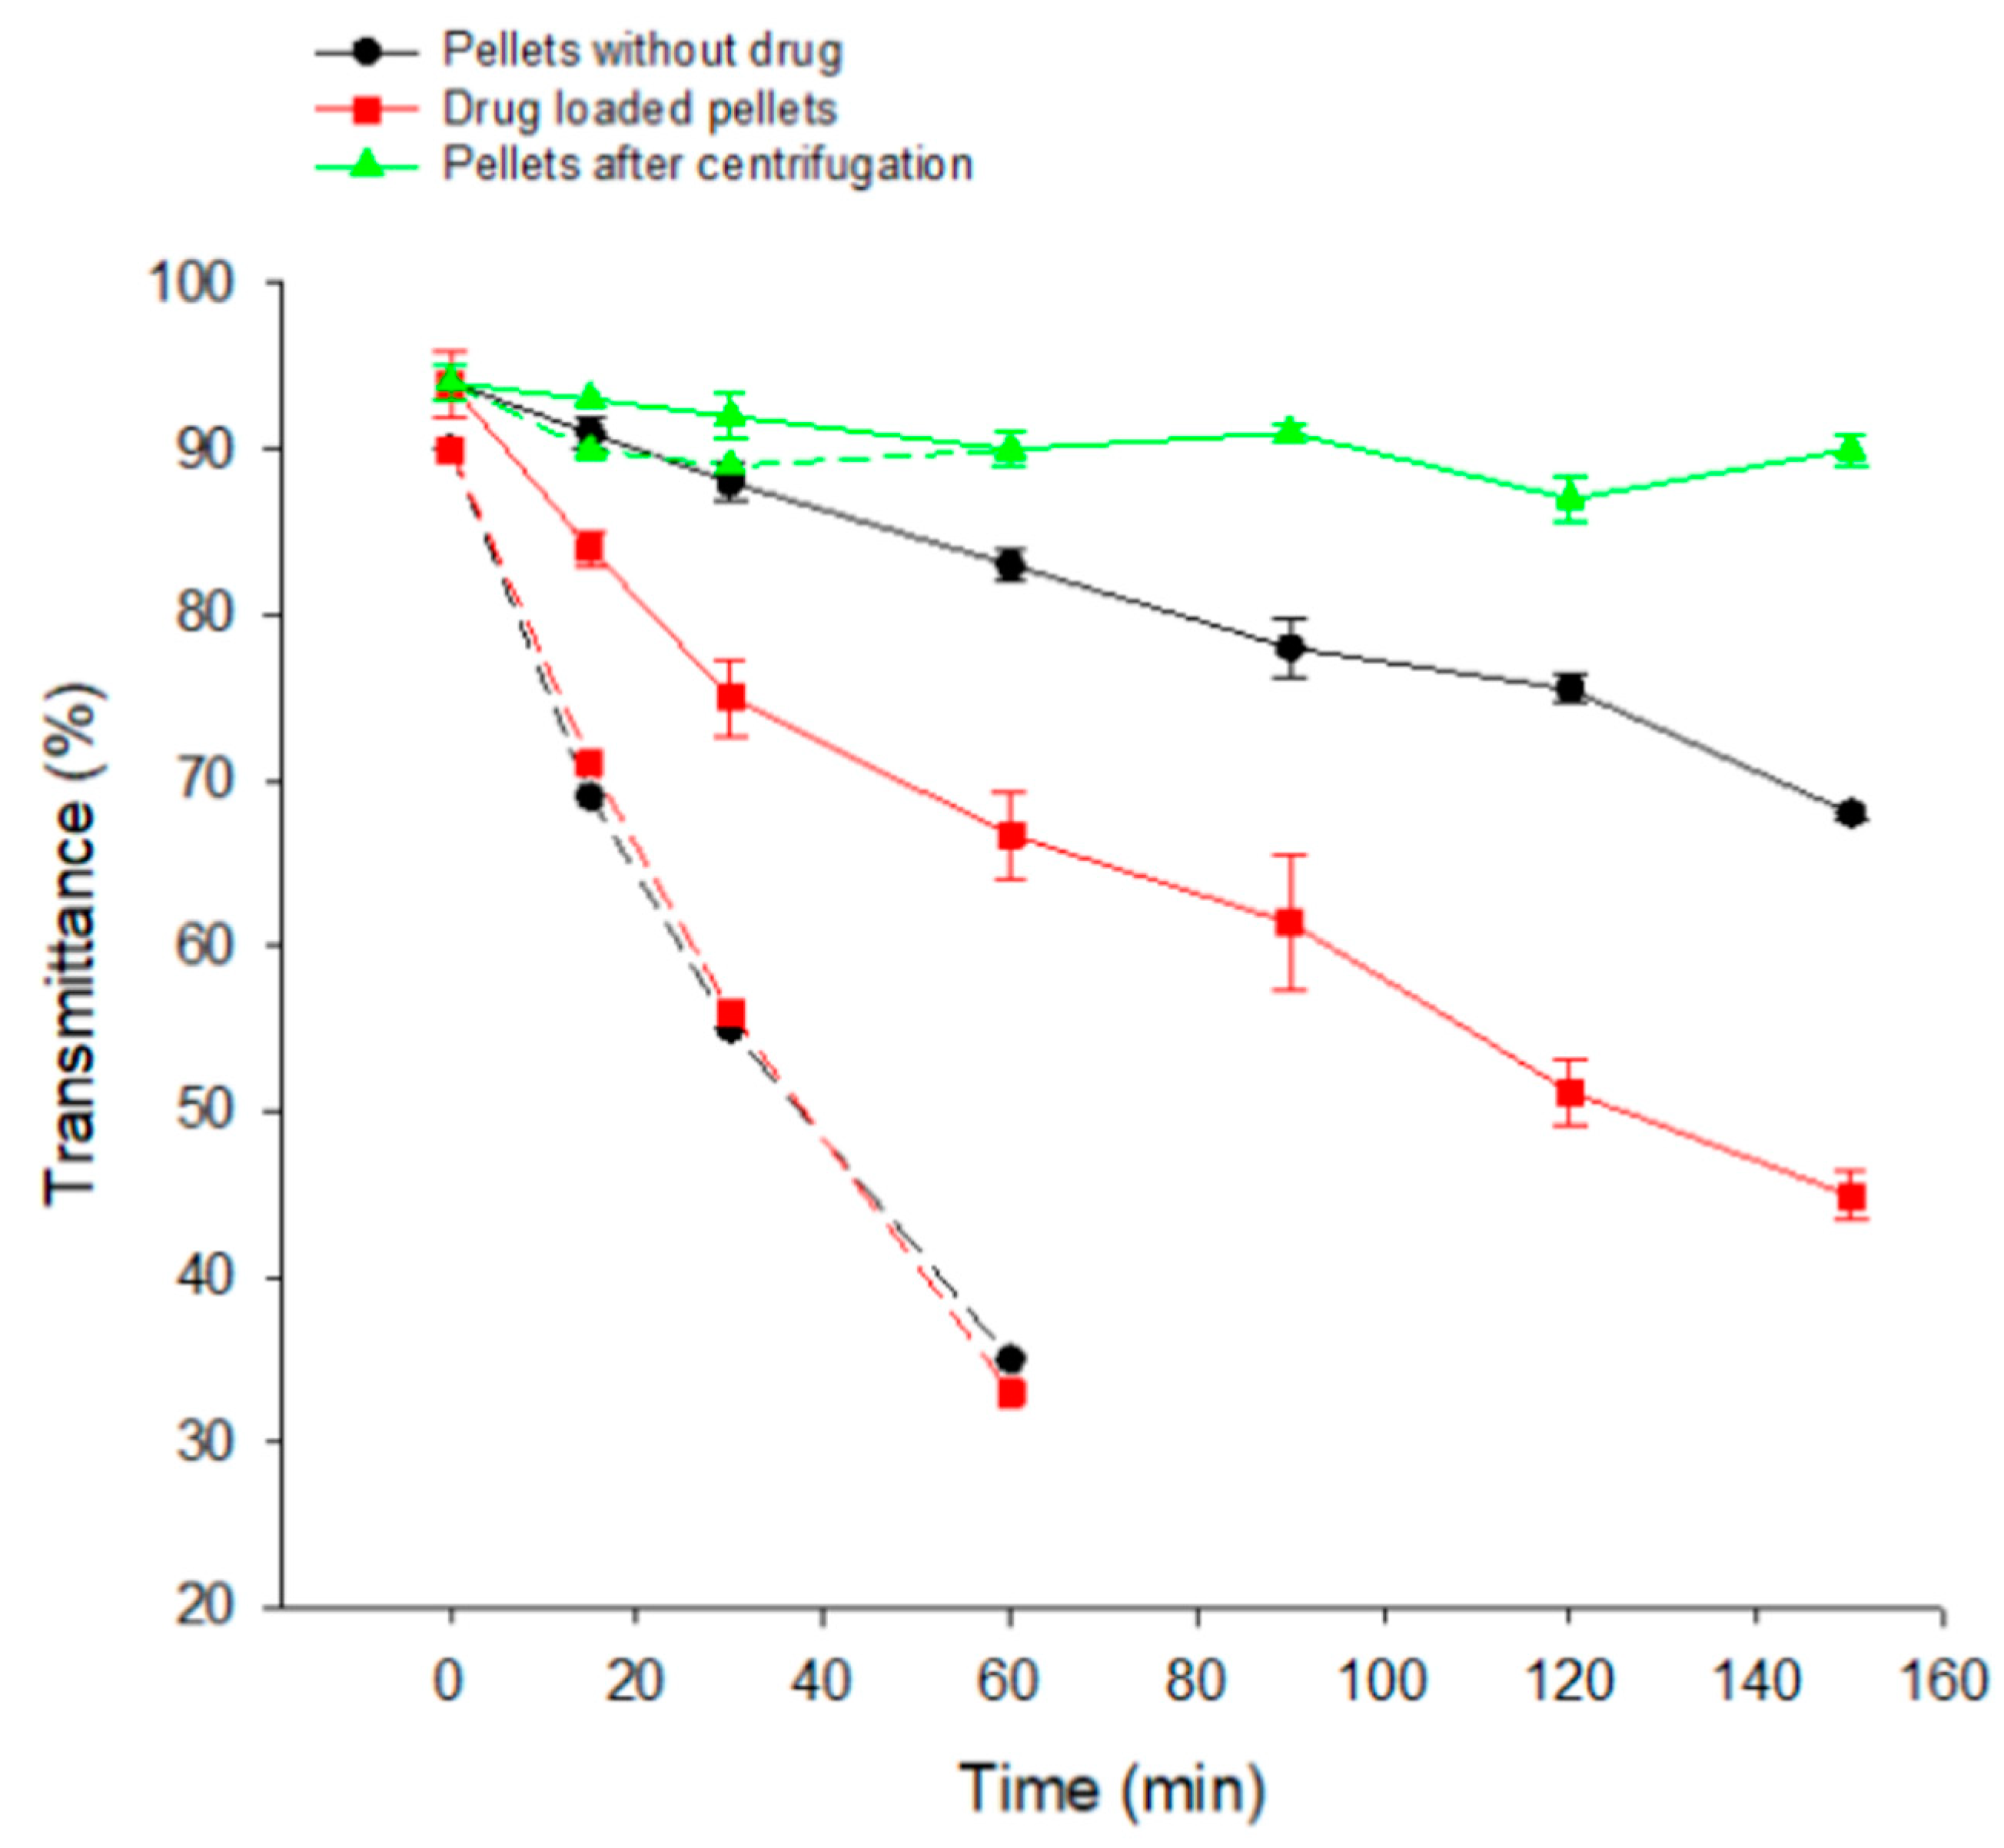
Rapid reconstitution of SEDDS emulsion from the pellets is desired to redisperse the droplets with dissolved drug in the gastrointestinal fluids and has been associated with the in vitro drug release and bioavailability [39,42]. Figure 7 presents plots of transmittance (T%) (reconstitution medium pH 6.8 solid lines and pH 1.2 broken lines) with time for inert (without drug) SEPS, for drug loaded SEPs and for drug loaded SEPs after centrifugation. At pH 6.8, the inert SEPs show a nearly linear decrease due to redispersion of pellet ingredients after immersion, whereas drug loaded SEPS show a rapid T% decrease in the first 20–30 min from 93% to about 75%, followed by a decrease of similar rate with the inert SEPs. The rapid initial decrease may be ascribed to the presence of drug particles on the surface where they have migrated during drying. At pH 1.2 reconstitution is seen to proceed considerably faster than at pH 6.8. A possible reason is formation of a water layer around CSD particles in acidic environment, acting as steric repulsion and prompting detachment of CSD particles with attached SEEDS [43].
Furthermore, from Figure 7 it is noticed that the T% of centrifuged liquid, i.e. after removal of any suspended solid particles, shows only marginal change with time. This has not been the case for SEPs prepared with MCC only (without CSD) [34], where the decrease of T% with time was not influenced by centrifugation. Therefore, in the present SEPs composition the redispersed matter contains some CSD, probably positioned in the SEDDS liquid crystal structure. When this composite particle settles during centrifugation, carries along the SEDDS, resulting in clear liquid and high T%.

3.8. Self-Emulsifying Tablets

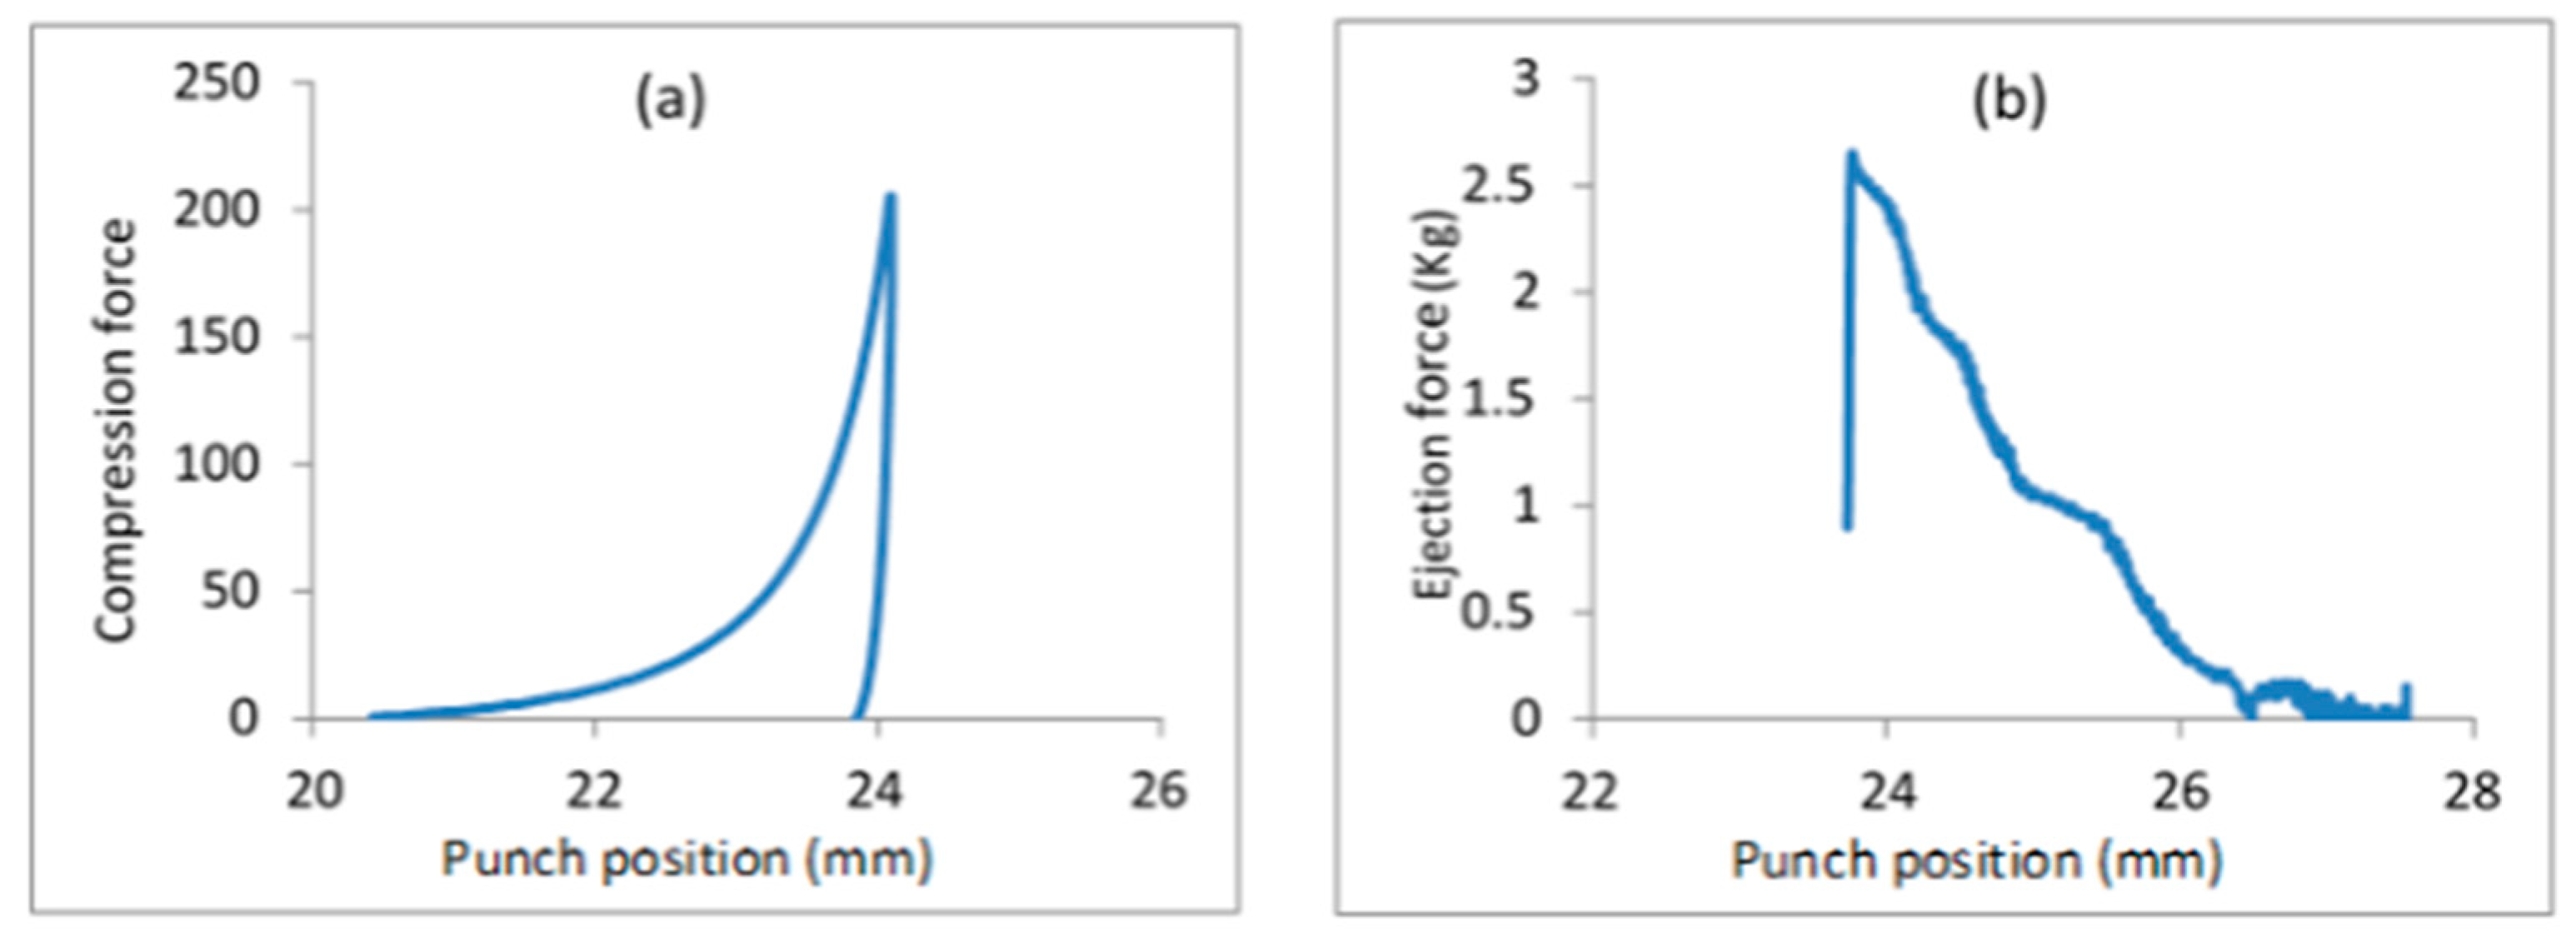
Since pellets do not present a dosage form themselves, they have to be processed into a final form such as tablet. However, their large size and hence small contact area require very high compression forces for bonding that may inflict damage to their structure and alter release. Therefore, tableting aids are used to make tablets that provide intact pellets after disintegration. Avicel 101 has been reported to be useful for this purpose, by assisting uniform distribution of pellets in the tablets and good tablet strength [16]. For tablet characterization, the FDA has provided guidance for testing and terminology (USP Chapter<1062 >). This was followed in the present work and the results are presented in Figure 8 as tabletability (tensile strength vs compression pressure), compactibility (tensile strength vs porosity), ejectability (ejection force vs compression pressure), and friability plots. The applied compressions were in the range 20–60 MPa. Higher pressures were not applied to avoid damage to the pellets. Maximum compression pressure was measured from force-displacement profiles recorded during the compression stage and maximum ejection force from respective profiles during the ejection stage (Figure 9).
From Figure 8a it appears that tensile strength increased with compression pressure up to 60 MPa for the SEPs/MCC 60/40 and 70/30 ratios but only up to 40 MPa for the 80/20 ratio. Considering 0.5 MPa as the acceptable tensile strength, it appears that a minimum 70/30 ratio at 60 MPa is required to reach this value. Tablets prepared with ratio 80/20 were weak and their tensile strength remained low even at the highest compression applied, despite their low porosity of 0.04 (Figure 8b). This is explained by the limited bonding areas during densification due to insufficient tableting aid, and to the low tabletability of CSD [11].
Furthermore, from Figure 8c it appears that the ejection force increased with pressure and at the maximum compression it was between 2.6 and 3.2 kg. This is lower than the values reported for slightly larger flat tablets (10 instead of 8 mm used in this work) of lubricated MCC produced with industrial machines [44]. The results of the friability plots shown in Figure 8d agree with those for tensile strength. All three ratios gave high friability tablets at 20 MPa. At 60 MPa the friability was low in all cases, but only SEPs/MCC ratios 60/40 and 70/30 gave values <1% which are in compliance with the United States Pharmacopoeia (< USP 1216 >).

3.9. Disintegration of Tablets into Pellets and In Vitro Release

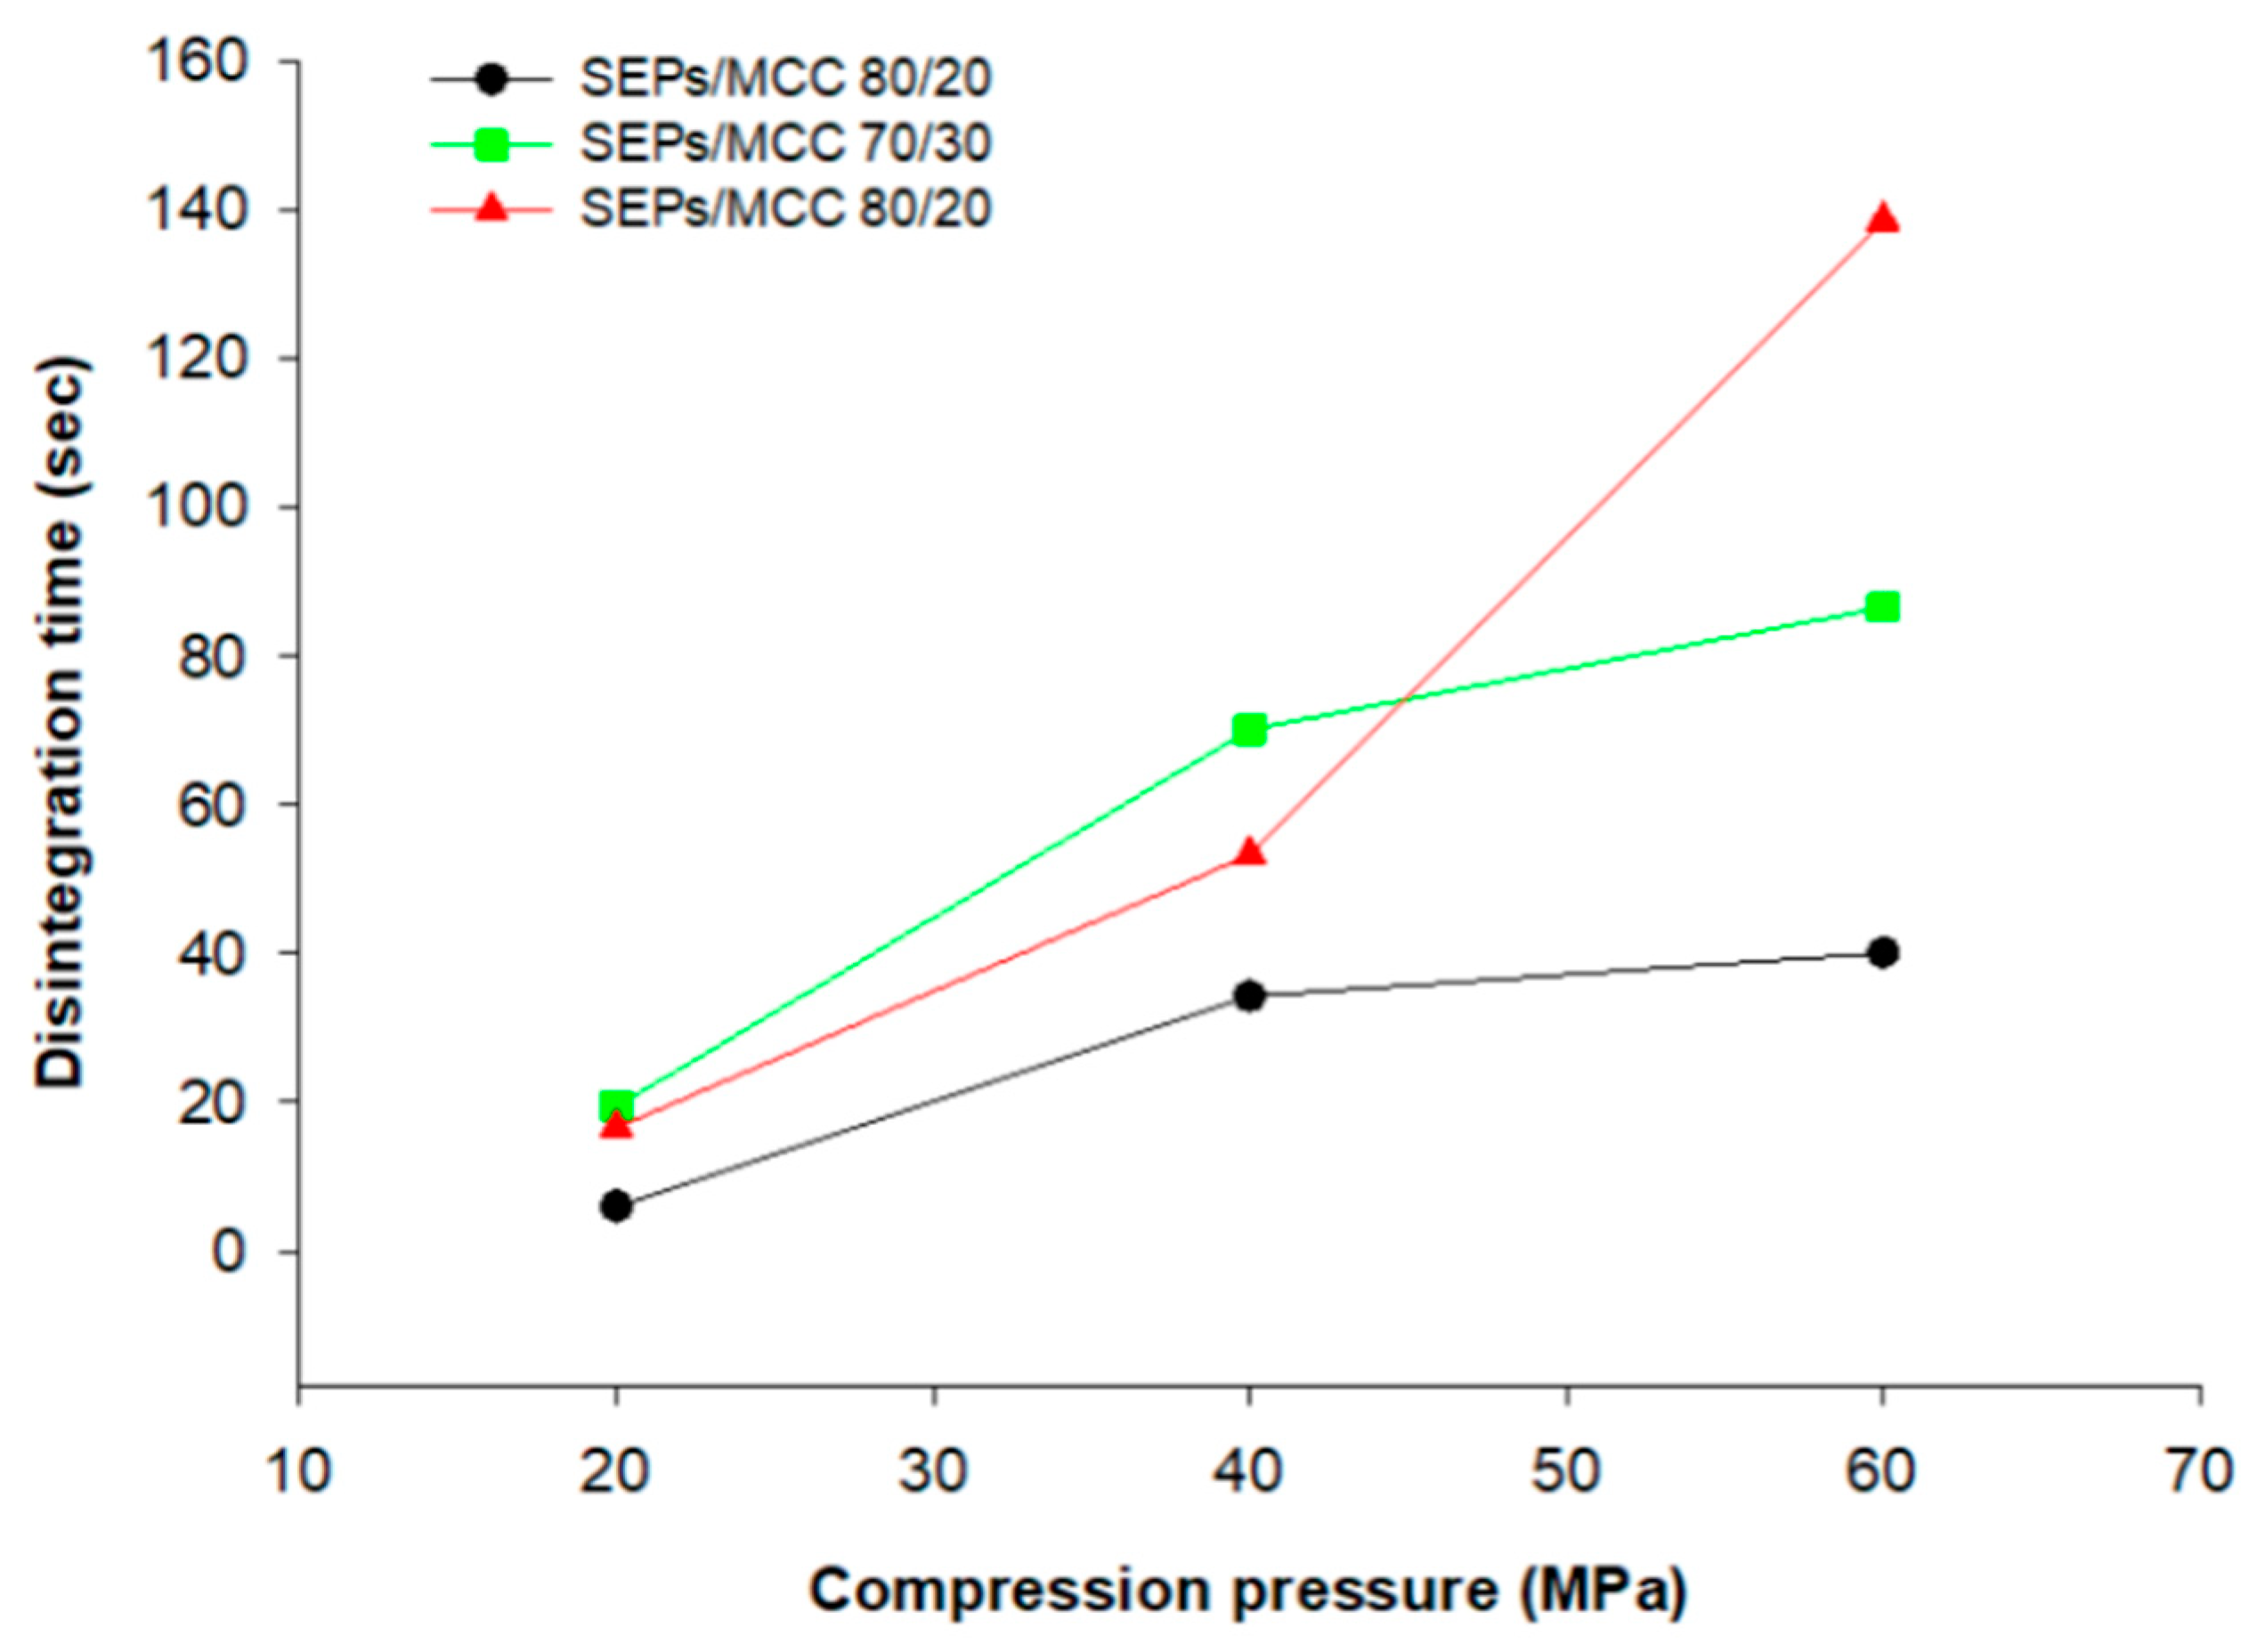
Figure 10 presents plots of disintegration time against compression pressure for the different SEPs/MCC ratios. In all cases tablets disintegrated into pellets in less than 140 sec. Since the 70:30 SEPs/MCC ratio gave tablets with faster disintegration than those with 60:40 and since these also showed good strength and low friability (Figure 8d) they were selected for further development.
Figure 11 presents drug release from unprocessed powder (circles), commercial tablets (square), self-emulsifying pellets (triangles), and self-emulsifying tablets (inverse triangle). The dissolution medium was phosphate buffer of pH 6.8 as recommended by the FDA (Drug Databases/Dissolution Methods 2004) due to the low solubility of AtrCa in acidic media. It can be seen that the release of AtrCA from commercial tablets is rapid reaching plateau after about 45 min, whereas the release from SEPs and SETs is slower reaching plateau after about 60 min. The slower release is ascribed to gel formation by the CSD present in the formulation, delaying passage of the drug from the SEDDS to the dissolution fluid. Assuming a residence time in the stomach and small intestine of about 4–6 h this delay of about 15 min should not affect significantly absorption since permeability of the self-emulsifying forms is greater (see later). However, since for immediate release tablets fast release is important for bioavailbility improvement, in-vivo studies are necessary besides permeability studies to evaluate overall product performance.
Comparing the graphs of T% vs time (Figure 7) with the graphs of drug release (%) vs time (Figure 11) it appears that emulsion reconstitution took longer time to complete than drug release (150 min compared with 70 min). This can be attributed to adsorption of SEDDS ingredients on CSD in the pellets delaying reemulsification [45] and to the fact that dissolution may take place at the pellet surface in parallel to that from dispersed droplets.
From Figure 11 it appears that the release at pH 1.2 is considerably slower than at pH 6.8 and incomplete within the experimental time. This is ascribed to the poor solubility of AtrCA in acidic pH. Nevertheless, some improvement of release is seen from the self-emulsifying formulations.

3.10. Chemical and Physical Stability

The stability study results under different environmental conditions of: 20 °C, 40 °C, and 60%, 75% relative humidity are given in Table 7. At the end of 6 months, there was no significant change of the content of AtrCa under the tested conditions.

3.11. Permeability Study with Caco-2 cell Culture

A number of studies have been conducted on the absorption of drugs in vitro using Caco-2 cells [35,46,47,48]. The tight junctions that the Caco-2 cells possess are similar to the intestinal epithelium, owing to their microvilli-like structure. Transition studies with Caco-2 cells based on similarity to the intestinal epithelium have been conducted in vitro to classify AtrCa in the drug classification system in terms of permeability. The results of these studies are discussed below.
The TEER (trans-epithelial electrical resistance) value in cell studies is a measure of a quality control parameter that indicates that the integrity of the monolayer cells during the test is maintained throughout the experiment. By measuring the TEER value, the development of the tissues produced by cell culture is controlled and information about possible permeability interactions can be obtained. It is desirable that the TEER value be in the range of 1500–1800 ohm × cm2 before starting experiment and at the end of the experiment system and less than 40 percent of the variation of pre-experiment and post-experiment TEER values [47,48,49]. These measured values were 800–1300 ohm × cm2. From apical to basolateral part, the percent changes in TEER values were found to be: 2.86 ± 1.59, 4.85 ± 6.69, and 17.12 ± 1.19 for the AtrCa, SEPs formulation and commercial tablet formulation, respectively. From basolateral to apical part, the percent changes were: 22.12 ± 5.44, 20.67 ± 2.71, and 19.6 ± 1.44 for the AtrCa, SEP-1 formulation, and commercial tablet formulation, respectively.
In the transfection studies of Caco-2 cells in DMEM (Dulbecco’s Modified Eagle’s Medium) containing FBS (fetal bovine serum), the amount of serum (FBS) in the cell culture study medium and composition was found to have a significant effect on cell differentiation, and for this reason DMEM containing FBS was selected as the nutrient medium. A membrane with a pore size of 3 μm was selected for cell culture support in the AtrCa transition studies. Similar membrane was used in studies with Caco-2 cells [50]. In the permeability studies, the pellets were dispersed in the nutrient medium and were compared with pure drug and the commercial tablet formulation. Transition studies from Caco-2 cells were performed in two directions, mimicking movement of the drug through the capillary vessels: (i) from the apical to basolateral direction, mimicking movement from the mucosal to the serosal layer (basolateral membrane) (A→B), and ii) from the basolateral to apical, mimicking the passage of exogenous drugs into the canaliculus lumen (B→A) [51].
The apparent permeability coefficient values (Papp) of AtrCa through Caco-2 cells calculated for A→B direction were found to be lower than the permeability for B→A direction for the commercial tablet and pure drug but not very different for the developed SEPs. Comparing the SEPs with the commercial tablet and pure drug, it appears that higher permeability was obtained from the SEPs in the transition studies from apical to basolateral direction (6.16 × 10⁻⁴ compared with 4.87 × 10⁻⁴ and 8.01 × 10⁻⁵ respectively), whereas the permeability in the direction from the basolateral to apical (Pab) was slightly higher than the pure drug but lower than the commercial tablet.
The Papp value for the pellet formulation is greater than the value 1 × 10⁻⁶ cm/s reported in the literature [52]. Efflux (Peff) calculated as the ratio of Papp from A to B divided by Papp from B to A are also given in Table 8. It can be seen that Pefflux is >1 for the commercial tablet and pure drug but <1 for SEPs.
Therefore, the developed SEPs provide greater AtrCa permeability compared to pure drug or to its commercial tablet formulation. Furthermore, the validity of the applied method was tested by analyzing the diffusion membrane and the parts of the cell at the end of the experiments and no measurable traces of drug were detected.
The results of statistical analysis of Least Square Difference (LSD) post-hoc test for the effects of formulation are given in Table 9 as multiple comparisons (significance p-values). The compared pairs of formulation are listed in the first column. Reading the results of Table 9 in juxtaposition with Table 8 it can be seen that permeability A→B is significantly greater for SEPs than both pure drug and commercial tablet. Permeability B→A is significantly lower for the pure drug than both formulations and marginally significantly lower for SEPs than the commercial tablet. The ratio of permeability A→B over B→A (Pefflux) is significantly higher for SEPs than both pure drug and commercial tablet.

3.12. Cytotoxicity

The cytotoxicity of the AtrCa active agent, the SEP-1 formulation and the commercial tablet formulation were evaluated using the Caco-2 cells and values are presented in Table 8. The values for Caco-2 cells after 72 h was: 72% for the pure drug, 88.9% for the SEPs and 89.9% for the commercial tablet. These results show that both the developed self-emulsifying formulations and the commercial tablet caused greater cytotoxicity than the pure drug due to the presence of excipients. The self-emulsifying formulation showed slightly smaller cytotoxicity compared to the commercial tablet. The difference is within the expected range of variability.

4. Conclusions

Self-emulsifying pellets and tablets were successfully developed. They contain respectively 2.7% and 1.89% nominal drug content which makes possible formulations of dosage forms that could cover the required dosage of administration of 10 g. The self-emulsifying forms released the drug completely in good time and in the permeability tests using Caco-2 cells showed greater permeability of the drug from the apical to basolateral but lower rate of efflux. Although there is a delay in drug release at enteric pH, this is small compared to about 4–6 residence time in the stomach and small intestine and overall it can be concluded that the greater permeability in conjunction with the protective effect of SEDDS may reduce the presystemic metabolism and enhance bioavailability.

Author Contributions

Conceptualization, M.D., Y.K., I.N.; data curation, I.N.; formal analysis, M.D., Y.K. I.N.; funding acquisition, Y.K.; investigation, M.D., M.T.; methodology, M.D., Y.K., I.N.; project administration, Y.K., I.N.; supervision, Y.K., I.N.; writing—original draft, M.D., Y.K., I.N.; writing—review & editing, I.N.

Funding

This work is part of the MSc research project of Mine Diril and was funded by Ege University Scientific Research Projects Coordination (Project No: 14/ECZ/005).

Acknowledgments

Mine Diril is grateful to Ege University Scientific Research Projects Coordination (Project No: 14/ECZ/005).

Conflicts of Interest

The authors declare no conflict of interest.

References

  1. Lea, A.P.; McTavish, D. A Review of its Pharmacology and Therapeutic Potential in the Management of Hyperlipidaemias. Adis Drug 1997, 53, 828–847. [Google Scholar] [CrossRef] [PubMed]
  2. Athyros, V.G.; Papageorgiou, A.A.; Valasia, V.; Athyrou, V.V.; Demitriadis, D.S.; Anthimos, N.; Pehlivanidis, A.N.; Kontopoulos, A.G. Atorvastatin versus Four Statin–Fibrate Combinations in Patients with Familial Combined Hyperlipidaemia. Eur. J. Prev. Cardiol. 2002, 9, 33–39. [Google Scholar] [CrossRef]
  3. Lennernäs, H. Clinical pharmacokinetics of atorvastatin. Clin. Pharm. 2003, 42, 1141–1160. [Google Scholar] [CrossRef] [PubMed]
  4. Lau, Y.Y.; Okochi, H.; Huang, Y.; Benet, L.Z. Pharmacokinetics of atorvastatin and its hydroxy metabolites in rats and the effects of concomitant rifampicin single doses: Relevance of first-pass effect from hepatic uptake transporters, and intestinal and hepatic metabolism. Drug Metab. Dispos. 2006, 34, 1175–1181. [Google Scholar] [CrossRef] [PubMed]
  5. Paidi, S.K.; Jena, S.K.; Ahuja, B.K.; Devasari, N.; Suresh, S. Preparation, in-vitro and in-vivo evaluation of spray-dried ternary solid dispersion of biopharmaceutics classification system class II model drug. J. Pharm. Pharmacol. 2015, 67, 616–629. [Google Scholar] [CrossRef] [PubMed]
  6. Kadu, P.J.; Kushare, S.S.; Thacker, D.D.; Gattani, S.G. Enhancement of oral bioavailability of atorvastatin calcium by self-emulsifying drug delivery systems (SEDDS). Pharm. Dev. Technol. 2011, 16, 65–74. [Google Scholar] [CrossRef] [PubMed]
  7. Karasulu, H.Y.; Gündoğdu, E.; Turgay, T.; Türk, U.Ö.; Apaydın, S.; Şimşir, I.Y.; Yilmaz, C.; Karasulu, E. Development and Optimization of Self-emulsifying Drug Delivery Systems (SEDDS) for Enhanced Dissolution and Permeability of Rosuvastatin. Curr. Drug. Deliv. 2016, 13, 362–370. [Google Scholar] [CrossRef] [PubMed]
  8. Shen, H.; Zhong, M. Preparation and evaluation of self-microemulsifying drug delivery systems (SMEDDS) containing atorvastatin. J. Pharm Pharmacol. 2006, 58, 1183–1191. [Google Scholar] [CrossRef]
  9. Govindarajan, R.; Landis, M.; Hancock, B.; Gatlin, L.A.; Suryanarayanan, R.; Shalaev, E.Y. Surface Acidity and Solid-State Compatibility of Excipients with an Acid-Sensitive API: Case Study of Atorvastatin Calcium. AAPS PharmSciTech 2015, 16, 354–363. [Google Scholar] [CrossRef]
  10. Czajkowska-Kosnik, A.; Szekalska, M.; Amelian, A.; Szymanska, E.; Winnicka, K. Development and Evaluation of Liquid and Solid Self-Emulsifying Drug Delivery Systems for Atorvastatin. Molecules 2015, 20, 21010–21022. [Google Scholar] [CrossRef] [Green Version]
  11. Gumaste, S.G.; Pawlak, S.A.; Dalrymple, D.M.; Nider, C.J.; Trombetta, L.D.; Serajuddin, A.T.M. Development of Solid SEDDS, IV: Effect of Adsorbed Lipid and Surfactant on Tableting Properties and Surface Structures of Different Silicates. Pharm. Res. 2013, 30, 3170–3185. [Google Scholar] [CrossRef] [PubMed] [Green Version]
  12. Nikolakakis, I.; Partheniadis, I. Self-Emulsifying Granules and Pellets: Composition and Formation Mechanisms for Instant or Controlled Release. Pharmaceutics 2017, 9, 50. [Google Scholar] [CrossRef] [PubMed]
  13. Tuleu, C.; Newton, M.; Rose J Euler, D.; Saklatvala, R.; Clarke, A.; Booth, S. Comparative Bioavailability Study in Dogs of a Self-Emulsifying Formulation of Progesterone Presented in a Pellet and Liquid Form Compared with an Aqueous Suspension of Progesterone. J. Pharm. Sci. 2004, 93, 1495–1502. [Google Scholar] [CrossRef] [PubMed]
  14. Jukkola, A.; Partanen, R.; Xiang, W.; Heino, A.; Rojas, O.J. Food emulsifiers based on milk fat globule membranes and their interactions with calcium and casein phosphoproteins. Food Hydrocoll 2019, 94, 30–37. [Google Scholar] [CrossRef] [Green Version]
  15. Yildirim, S.T.; Oztop, M.H.; Soyer, Y. Cinnamon oil nanoemulsions by spontaneous emulsification: Formulation, characterization and antimicrobial activity. LWT Food Sci. Technol. 2017, 84, 122–128. [Google Scholar] [CrossRef]
  16. Wagner, K.G.; Krumme, M.; Schmidt, P.C. Investigation of the pellet-distribution in single tablets via image analysis. Eur. J. Pharm. Biopharm. 1999, 47, 79–85. [Google Scholar] [CrossRef]
  17. Matsaridou, I.; Barmpalexis, P.; Salis, A.; Nikolakakis, I. The influence of surfactant HLB and oil/surfactant ratio on the formation and properties of Self-emulsifying pellets and microemulsion reconstitution. AAPS PharmSciTech 2012, 13, 1319–1330. [Google Scholar] [CrossRef]
  18. Gopal, E.S.R. Emulsion Science; Sherman, P., Ed.; Academic Press: New York, NY, USA, 1968; pp. 43–54. [Google Scholar]
  19. Zetasizer Nanoseries User Mannual MANO 317 Issue 2.2; Malvern Instruments Ltd.: Worcestershire, UK, 2005; p. 16.2.
  20. Almeida-Prieto, S.; Blanco-Méndez, J.; Francisco JOtero-Espinar, F.J. Image Analysis of the Shape of Granulated Powder Grains. J. Pharm. Sci. 2004, 93, 621–634. [Google Scholar] [CrossRef]
  21. Fell, J.T.; Newton, J.M. Determination of Tablet Strength by the Diametral-Compression Test. J. Pharm. Sci. 1970, 59, 688–691. [Google Scholar] [CrossRef]
  22. Choudhary, A.; Rana, A.C.; Aggarwal, G.; Kumar, V.; Zakir, F. Development and characterization of an atorvastatin solid dispersion formulation using skimmed milk for improved oral bioavailability. Acta Pharm. Sin. B 2012, 2, 421–428. [Google Scholar] [CrossRef] [Green Version]
  23. Başpınar, Y.; Gündoğdu, E.; Köksal, C. Pitavastatin-containing nanoemulsions: Preparation, characterization and in vitro cytotoxicity. J. Drug Deliv. Sci. Technol. 2015, 29, 117–124. [Google Scholar] [CrossRef]
  24. Bandivadekar, M.; Pancholi, S.; Kaul-Ghanekar, R.; Choudhari, A.; Koppikar, S. Single non-ionic surfactant based selfnanoemulsifying drug delivery systems: Formulation, characterization, cytotoxicity and permeability enhancement study. Drug Dev. Ind. Pharm. 2013, 39, 696–703. [Google Scholar] [CrossRef] [PubMed]
  25. Dalvadi, H.; Patel, N.; Parmar, K. Systematic development of design of experiments (DoE) optimised self-microemulsifying drug delivery system of Zotepine. J. Microencapsul. 2017, 34, 308–318. [Google Scholar] [CrossRef] [PubMed]
  26. Quan, D.; Xu, G.; Wu, X. Studies on Preparation and Absolute Bioavailability of a Self-Emulsifying System Containing Puerarin. Chem. Pharm. Bull. 2007, 55, 800–803. [Google Scholar] [CrossRef] [Green Version]
  27. Zhu, J.; Tang, D.; Feng, L.; Zheng, Z.; Wang, R.; Wu, A.; Duan, T.; He, B.; Zhu, Q. Development of self-microemulsifying drug delivery system for oral bioavailability enhancement of berberine hydrochloride. Drug Dev. Ind. Pharm. 2013, 39, 499–506. [Google Scholar] [CrossRef]
  28. Pouton, W.C. Formulation of poorly water-soluble drugs for oral administration: Physicochemical and physiological issues and the lipid formulation classification system. Eur. J. Pharm. Sci. 2006, 29, 278–287. [Google Scholar] [CrossRef] [PubMed]
  29. Magdassi, S.M.; Frenkel, M.; Garti, N. Correlation Between Nature of Emulsifier and Multiple Emulsion Stability. Drug Dev. Ind. Pharm. 1985, 11, 791–798. [Google Scholar] [CrossRef]
  30. Agrawal, A.G.; Kumar, A.; Gide, P.S. Formulation of solid self-nanoemulsifying drug delivery systems using N-methyl pyrrolidone as cosolvent. Drug Dev. Ind. Pharmac. 2015, 41, 594–604. [Google Scholar] [CrossRef]
  31. Gershanik, T.; Benita, S. Self-dispersing lipid formulations for improving oral absorption of lipophilic drugs. Eur. J. Pharm. Biopharm. 2000, 50, 179–188. [Google Scholar] [CrossRef]
  32. Patil, S.S.; Venugopal, E.; Bhat, S.; Mahadik, K.R.; Paradkar, A.R. Microstructural Elucidation of Self-Emulsifying System: Effect of Chemical Structure. Pharm Res. 2012, 29, 2180–2188. [Google Scholar] [CrossRef] [Green Version]
  33. Maali, A.; Mosavian, M.H. Preparation and Application of Nanoemulsions in the Last Decade (2000–2010). J. Dispers. Sci. Technolog. 2013, 34, 92–105. [Google Scholar] [CrossRef]
  34. Nikolakakis, I.; Panagopoulou, A.; Salis, A.; Malamataris, S. Relationships between the properties of Self-Emulsifying pellets and of the Emulsions used as massing liquids for their preparation. AAPS PharmSciTech 2015, 16, 129–139. [Google Scholar] [CrossRef] [PubMed]
  35. Bu, P.; Ji, Y.; Narayanan, S.; Dalrymple, D.; Cheng, X.; Serajuddin, A.T.M. Assessment of cell viability and permeation enhancement in presence of lipid-based self-emulsifying drug delivery systems using Caco-2 cell model: Polysorbate 80 as the surfactant. Eur. J. Pharm. Sci. 2017, 99, 350–360. [Google Scholar] [CrossRef] [PubMed]
  36. Ditner, C.; Bravo, R.; Imanidis, G.; Kuentz, M. A Systematic Dilution Study of Self-Microemulsifying Drug Delivery Systems in Artificial Intestinal Fluid Using Dynamic Laser Light Backscattering. Drug Dev. Ind. Pharm. 2009, 35, 199–208. [Google Scholar] [CrossRef] [PubMed]
  37. Petrochenko, P.E.; Pavurala, N.; Wu, Y.; Wong, S.Y.; Parhiz, H.; Chen k Patil, S.M.; Haiou Qu, H.; Buoniconti, P.; Muhammad, A.; Choi, S.; et al. Analytical considerations for measuring the globule size distribution of cyclosporine ophthalmic emulsions. Int. J. Pharm. 2018, 550, 229–239. [Google Scholar]
  38. Podczeck, F. A novel aid for the preparation of pellets by extrusion/spheronization. Pharm. Technol. Eur. 2008, 20, 26–31. [Google Scholar]
  39. Nikolakakis, I.; Malamataris, S. Self-Emulsifying Pellets: Relations Between Kinetic Parameters of Drug Release and Emulsion Reconstitution—Influence of Formulation Variables. J. Pharm. Sci. 2014, 103, 1453–1465. [Google Scholar] [CrossRef]
  40. Kapsidou, T.; Nikolakakis, I.; Malamataris, S. Agglomeration state and migration of drugs in wet granulations during drying. Int. J. Pharm. 2001, 227, 97–112. [Google Scholar] [CrossRef]
  41. Ettlinger, M.; Ferch, H.; Mathias, J. Reviews and Trends: Grundlagen und Anwendungen einer durch Flammenhydrolyse gewonnenen Kieselsäure, 25. Mitt. Zur Adsorption an der Oberfläche einer flammenhydrolytisch gewonnenen Kieselsäure. Arch. Pharm. 1987, 320, 1–15. (In German) [Google Scholar] [CrossRef]
  42. Nasr, A.; Ahmed Gardouh, A.; Ghora, M. Novel Solid Self-Nanoemulsifying Drug Delivery System (S-SNEDDS) for Oral Delivery of Olmesartan Medoxomil: Design, Formulation, Pharmacokinetic and Bioavailability Evaluation. Pharmaceutics 2016, 8, 20. [Google Scholar] [CrossRef]
  43. Amiri, A.; Øye, G.; Sjöblom, J. Influence of pH, high salinity and particle concentration on stability and rheological properties of aqueous suspensions of fumed silica. Colloids Surf. A Physicochem. Eng. Asp. 2009, 349, 43–54. [Google Scholar] [CrossRef]
  44. Sun, C.C. Dependence of ejection force on tableting speed—A compaction simulation study. Powder Technol. 2015, 279, 123–126. [Google Scholar] [CrossRef]
  45. Gumaste, S.G.; Damon, M.; Dalrymple, D.M.; Serajuddin, A.T.M. Development of Solid SEDDS, V: Compaction and Drug Release Properties of Tablets Prepared by Adsorbing Lipid-Based Formulations onto Neusilin® US2. Pharm. Res. 2013, 30, 3186–3199. [Google Scholar] [CrossRef] [PubMed]
  46. Hamman, M.A.; Bruce, M.A.; Haehner-Daniels, B.D.; Hall, S.D. The Effect of Rifampin Administration on the Disposition of Fexofenadine. Clin. Pharm. Ther. 2001, 69, 114–121. [Google Scholar] [CrossRef] [PubMed]
  47. Hauri, H.P.; Sterchi, E.E.; Bienz, D.; Fransen, J.A.; Marxer, A. Expression and Intracellular Transport of Microvillus Membrane Hydrolases in Human Intestinal Epithelial Cells. J. Cell Biol. 1985, 101, 838–851. [Google Scholar] [CrossRef] [PubMed]
  48. Hilers, A.R.; Conradi, R.A.; Burton, P.S. Caco-2 Cell Monolayers as a Model for Drug Transport Across the Intestinal Mucosa. Pharm. Res. 1990, 7, 902–910. [Google Scholar] [CrossRef]
  49. Gundogdu, E.; Mangas-Sanjuan, V.; Gonzalez, A.I.; Bermejo, M.; Karasulu, E. In vitro-in situ permeability and dissolution of fexofenadine with kinetic modeling in presence of sodium dodecyl sulfate. Eur. J. Drug Metab. Pharmacokinet. 2012, 37, 65–75. [Google Scholar] [CrossRef]
  50. González-Alvarez, I.; Fernández-Teruel, C.; Garrigues, T.M.; Casabo, V.G.; Ruiz-García, A.; Bermejo, M. Kinetic Modelling of Passive Transport and Active Efflux of a Fluoroquinolone Across Caco–2 Cell Using a Compartmental Approach In NONMEM. Xenobiotica 2005, 35, 1067–1088. [Google Scholar] [CrossRef]
  51. Okyar, A. P-glikoprotein ve P-glikoproteinin İlaç Farmakokinetiğindeki Rolü. Türk Farm. Derneği Bülteni 2005, 83, 18–22. [Google Scholar]
  52. Arturson, P.; Palm, K.; Luthman, K. Caco-2 Cell Monolayers in Experimental and Theoretical Predictions of Drug Transport. Adv. Drug Del. Rev. 2001, 46, 27–43. [Google Scholar]
Figure 1. Rheology of non-sonicated and sonicated emulsions of SEDDS (60% w/w) without and with drug.
Processes 07 00365 g001
Figure 2. Droplet size distribution of (a) non-sonicated and (b) sonicated 60% w/w SEDDS emulsions.
Processes 07 00365 g002
Figure 3. Back scattering (%) vs distance profiles taken every 5 min (recording time increases top to bottom) for non-sonicated (a1) and sonicated (b1) emulsions with 60% SEDDS and corresponding pictures (a2 and b2) taken at the end of the experiments.
Processes 07 00365 g003
Figure 4. Interaction plots for the effects of pH and dilution factors on the hydrodynamic diameter of sonicated emulsions.
Processes 07 00365 g004
Figure 5. (a) Image of self-emulsified pellets from stereoscope and (b) corresponding pellet size distribution.
Processes 07 00365 g005
Figure 6. Pellet friability (%) against the ratio CSD:MCC.
Processes 07 00365 g006
Figure 7. Transmittance (T%) vs time for pellets without drug (black circles), for drug loaded pellets (red squares) and for pellets after centrifugation (green triangles) at pH 1.2 (broken lines) and pH 6.8 (solid lines).
Processes 07 00365 g007
Figure 8. Plots showing: (a) tabletability, (b) compactibility, (c) ejectability, and (d) friability for different SEPs/MCC ratios (80/20 black circles, 70/30 green squares, 60/40 red triangles).
Processes 07 00365 g008
Figure 9. Force-displacement profiles during (a) the compression and (b) ejection stages of tableting SEPs with Avicel 101 at 70:30 ratio.
Processes 07 00365 g009
Figure 10. Plots of disintegration time against compression pressure for different SEPs/MCC ratios (80/20 black circles, 70/30 green squares, 60/40 red triangles).
Processes 07 00365 g010
Figure 11. Drug release from unprocessed powder (circles), commercial tablets (square), self-emulsifying pellets (triangles), and self-emulsifying tablets (inverse triangles) at pH 1.2 (broken lines) and pH 6.8 (solid lines).
Processes 07 00365 g011
Table 1. Solubility (mean ±SD) of AtrCa in various SEDDS oils, surfactants, and cosurfactants.
IngredientSolubility (mg/mL) (±SD)
Corn oil7.71 ± 0.05
Oleic acid27.40 ± 0.03
Refined castor oil1.53 ± 0.02
Labrofil M 21254.47 ± 0.04
Labrafil 19440.01 ± 0.04
Tween 20263.5 ± 0.09
Tween 8013.50 ± 0.02
Span 8047.47 ± 0.03
PEG 20045.98 ± 0.03
Transcutol6.74 ± 0.04
Labrasol17.30 ± 0.18
Brij 30v44.73 ± 0.21
Brij 92v30.19 ± 0.04
Brij 96v3.38 ± 0.03
Ethanol0.04 ± 0.02
Isopropyl alcohol4.71 ± 0.06
N-methyl pyrrolidone110.55 ± 0.03
Distilled water0.01 ± 0.05
pH: 1.20.004 ± 0.02
pH: 4.60.02 ± 0.01
pH: 6.80.602 ± 0.03
Table 2. Composition of pellets after drying.
IngredientComposition
Drug1.2 (2.7%)
Aerosil 20014.0 (31.1%)
Avicel 1016.0 (13.3%)
Oleic acid14.4 (32.0%)
Tween 205.7 (12.6%)
Span 802.8 (6.2%)
N-methyl pyrrolidone0.96 (2.1%)
Total weight45.0 (100%)
Table 3. Composition (%) of self-emulsifying tablets and compression pressures applied for their preparation.
Self-Emulsifying Pellets (SEPs)Avicel 101Compression (MPa)
208020
208040
208060
307020
307040
307060
406020
406040
406060
Table 4. Properties of non-sonicated and sonicated emulsions with 60% w/w SEDDS as dispersed phase in deionized water (mean ±SD).
PropertyNon-Sonicated Sonicated
Droplet size 1370 ± 23320.7 ± 15
Viscosity (cP)249.568.5
Zeta potential (mV) −7.05 ± 0.48−7.98 ± 0.35
Table 5. Droplet diameter of drug loaded sonicated emulsions at different pH media and dilutions.
Dispersion MediumDilution LevelDiameter (nm)Coefficient of Variation (CV%)
pH 1.21:10288.6 ± 1.519.3
pH 1.21:100306.7 ± 1.0
pH 1.21:1000209.5 ± 1.5
pH 1.21:1000/24 h210.9 ± 1.0
pH 6.81:10215.7 ± 1.521.6
pH 6.81:100307.0 ± 1.3
pH 6.81:1000214.5 ± 1.0
pH 6.81:1000/24 h285.9 ± 1.3
Deionised water1:10273.1 ± 2.622.8
Deionised water1:100320.7 ± 1.5
Deionised water1:1000200.8 ±2.3
Deionised water1:1000/24 h198.4 ± 1.8
Table 6. Properties of experimental self-emulsifying pellets prepared with 60% w/w sonicated SEDDS emulsion.
Median Diameter (μm)1065
Shape index (eR)0.469
Circularity0.832
Pycnometric density1.31 ± 0.01
Bulk density0.72 ± 0.04
Tap density0.77 ± 0.02
Hausner ratio1.07 ± 0.01
Carr’s index6.46 ± 0.61
Friability (%)1.3 ± 0.05
Table 7. Results of six-month stability of drug content (%) at two different temperatures and relative humidities.
Time 0Three MonthsSix Months
25 °C/60%40 °C/75%25 °C/60% 40 °C/75%25 °C/60%40 °C/75%
Drug (%)106 ± 1.53103 ± 1.35104 ± 2.00102 ± 1.87102 ± 1.99101 ± 1.47
Table 8. Apparent permeability coefficient (A→B, B→A), Pefflux and cytotoxicity values of AtCa, commercial tablet and self-emulsified tablet.
Apparent Permeability CoefficientPeffluxCytotoxicity
A→BB→A
AtrCa8.01 × 10−5 ± 5.56 × 10−61.59 × 10−4 ± 4.03 × 10−50.503 0.1272%
Self-emulsifying pellets6.16 × 10−4 ± 1.23 × 10−55.85 × 10−4 ± 5.67 × 10−61.046 0.0288.9%
Commercial Tablet4.87 × 10−4 ± 8.3 × 10−56.79 × 10−4 ± 5.37 × 10−50.718 0.1589.9%
Table 9. Results of the statistical analysis of permeability studies presented as post-hoc multiple comparisons (significance p-values).
Apparent Permeability CoefficientPefflux
A→BB→A
AtrCa - SEP0.0050.0000.002
AtrCa–Comm. tabl.0.0000.0000.096
SEP–Comm. Tabl.0.0260.0510.020