Article

Multi-Criteria Optimization of Production Processes of Mining Companies

1
Department of Informatics and Computer Technologies, Empress Catherine II Saint Petersburg Mining University, 199106 St. Petersburg, Russia
2
Department of Electrical Power Engineering and Electromechanics, Empress Catherine II Saint Petersburg Mining University, 199106 St. Petersburg, Russia
3
Peter the Great St. Petersburg Polytechnic University, 195251 St. Petersburg, Russia
*
Author to whom correspondence should be addressed.
Processes 2026, 14(8), 1239; https://doi.org/10.3390/pr14081239
Submission received: 3 February 2026 / Revised: 12 March 2026 / Accepted: 27 March 2026 / Published: 13 April 2026

Abstract

Equipment selection is a critical decision in mining operations, directly influencing production efficiency, maintenance requirements, and operational costs. However, this decision is complicated by significant uncertainty surrounding equipment performance and remaining service life. This paper presents a hybrid decision support framework that integrates Fuzzy Logic, Pareto Optimality, and a Genetic Algorithm (GA) to address the challenge of roadheader selection under such uncertainty. The proposed Fuzzy–Pareto–GA approach applies fuzzy logic to model the inherent uncertainty in performance data; employs Pareto optimization to identify optimal trade-offs between multiple, often conflicting criteria; and utilizes a genetic algorithm to efficiently navigate the solution space. The framework is validated using real-world data from an operating mining company, considering three key criteria: operating time, remaining service life, and the remaining service life ratio. The results demonstrate that the fuzzy–Pareto approach effectively identifies a set of non-dominated solutions, and the robustness of these rankings is confirmed through a comprehensive sensitivity analysis. The proposed framework offers mining engineers a transparent and uncertainty-aware tool for equipment selection, a decision that serves as a critical foundation for effective production process optimization.

1. Introduction

The mining industry is a vital economic sector in many countries, supplying raw materials to a variety of industrial sectors, from metallurgy to energy. However, production processes in mining companies are characterized by high complexity, variability, and the presence of numerous parameters for performance criteria, which are often contradictory. This is due to the fact that it is crucial to consider various factors, such as increasing mineral extraction, reducing production costs, ensuring safe working conditions for employees, reducing environmental impact, and optimizing the use of all resources [1,2,3].
Equipment selection is a tactical decision that determines which machines will be deployed in mining operations. Production process optimization, by contrast, encompasses broader operational decisions such as scheduling, logistics, workforce allocation, and maintenance planning. This paper focuses on equipment selection under uncertainty—because it is a necessary foundation for effective production optimization. Without well-chosen equipment, all subsequent efforts to optimize production will operate within unnecessary constraints [4,5].
Optimizing equipment selection directly improves production performance in several ways. First, it determines available production capacity through the remaining life of the chosen machines. Second, it affects operational efficiency through equipment characteristics like operating time and reliability. Third, it shapes maintenance requirements that must be integrated into production schedules. Fourth, it provides a basis for risk management through the μ_pareto metric, which quantifies confidence in equipment performance under uncertainty [6,7,8]. In short, equipment selection is not separate from production optimization—it is one of its most fundamental components.
Recent research has called for more robust approaches that explicitly incorporate uncertainty into the decision-making process [9,10,11,12]. Fuzzy logic has emerged as a particularly promising tool in this regard, as it allows criteria to be represented as linguistic variables (e.g., “high remaining life”) with membership functions that capture gradual transitions between categories, rather than forcing crisp boundaries [13,14,15]. When combined with Pareto optimization—which identifies trade-offs between multiple conflicting objectives—and genetic algorithms—which efficiently search complex solution spaces—fuzzy logic offers a powerful framework for equipment selection under uncertainty [16,17,18].
Mining operations face unique challenges that amplify uncertainty: geological variability (unexpected changes in rock hardness, ore grade), harsh environments accelerating equipment wear, and unpredictable failure patterns. Traditional deterministic MCDM methods often overlook these factors, leading to suboptimal decisions. Recent reviews [19,20,21,22,23] emphasize that reliability, maintenance behavior, and operational constraints must be integrated into selection frameworks. This paper addresses these gaps by developing a hybrid Fuzzy–Pareto–GA approach that captures both the trade-offs and the inherent uncertainty of real-world mining data.
Unlike previous models that focus primarily on safety risk assessments or general equipment ranking, our contribution provides a specialized Pareto-based framework for evaluating roadheader performance. This framework integrates real-world operational datasets with a rigorous sensitivity analysis, ensuring reproducible and stable results for decision-making in mining engineering.
To achieve this, we formulate the following specific research objectives:
  • To review existing multi-criteria optimization methods and their applicability to mining equipment selection problems.
  • To develop a hybrid fuzzy–Pareto–GA approach that explicitly models uncertainty in equipment performance data.
  • To implement this approach using real operational data from a mining company, considering operating time, remaining service life, and their ratio.
  • To compare the proposed hybrid method with classical approaches (weighted sum, ideal point) in terms of solution sets and sensitivity to weight changes.
  • To assess the robustness of the rankings through a comprehensive sensitivity analysis.
Table 1 shows the methods of multi-criteria optimization for roadheaders.

2. Domain Analysis

The relevance of multi-criteria optimization of production processes in the mining industry is explained by a multitude of factors, making this task extremely important and relevant in today’s environment [10,11,12].
First of all, increasing global demand for mineral resources requires increased production and processing volumes. However, this must occur with minimal environmental impact and ensure occupational safety, making optimization of production processes essential [13,14,15].
Mining companies operate under conditions of high uncertainty due to variable geology, equipment degradation, and market fluctuations. These factors introduce significant noise into performance data, making deterministic selection methods unreliable. Consequently, there is a growing need for uncertainty-aware decision frameworks that can handle imprecise information and provide robust recommendations [16].
Furthermore, the increasing complexity of mining operations is associated with changing geological conditions, increasing depth of deposit development, and deteriorating ore quality. This requires the use of more accurate and efficient methods for planning and managing production processes [16,17,18].
Furthermore, the development of information technology provides new opportunities for collecting, processing, and analyzing large volumes of data, which can be used to optimize production processes in the mining industry [19,20,21]. Furthermore, increasing environmental and social responsibility requirements for mining companies require minimizing environmental impacts and ensuring occupational safety, which can be achieved through optimization of production processes [22,23,24].
Finally, the need to improve the competitiveness of mining companies in a competitive marketplace requires the continuous improvement of production processes and cost reduction [25,26,27].
In this regard, the development and implementation of effective methods and models for multi-criteria optimization of production processes in mining companies is a pressing issue, the solution to which can bring significant economic and social benefits to both companies and society as a whole [28,29,30].

2.1. Review of Existing Multi-Criteria Optimization Methods

To bridge the gap between general methodological descriptions and mining-specific applications, we briefly discuss why each method may be preferable or problematic in the context of mining equipment selection:

2.1.1. Weighted Sum Method

This is a multicriteria decision-making method in which there are several alternatives, and we must determine the best alternative based on several criteria. The essence of the method: the objective function is scalarized by assigning weighting coefficients ( w m ) to each of the decision components ( f m ) [10].
F x = m = 1 M w m f m ( x )
In the formula, the following apply:
F x —objective function;
f m ( x ) —a partial criterion;
w m —weight of the i-th criterion;
M—the number of criteria.
Normalization condition:
To ensure that weights reflect the relative importance of criteria, they are usually normalized: m   w m   = 1 M .
The weighted sum method reduces a multi-criteria problem to a single-criteria problem:
Find   x   =   a r g   a r g   m a x x X F x ,
where x is the feasible solution set.
Example with two criteria:
If there are two criteria f 1 x and f 2 ( x ) , then the objective function takes the form:
F x = w 1 f 1 x + w 2 f 2 ( x )  
with the normalization condition w 1 + w 2 = 1 .
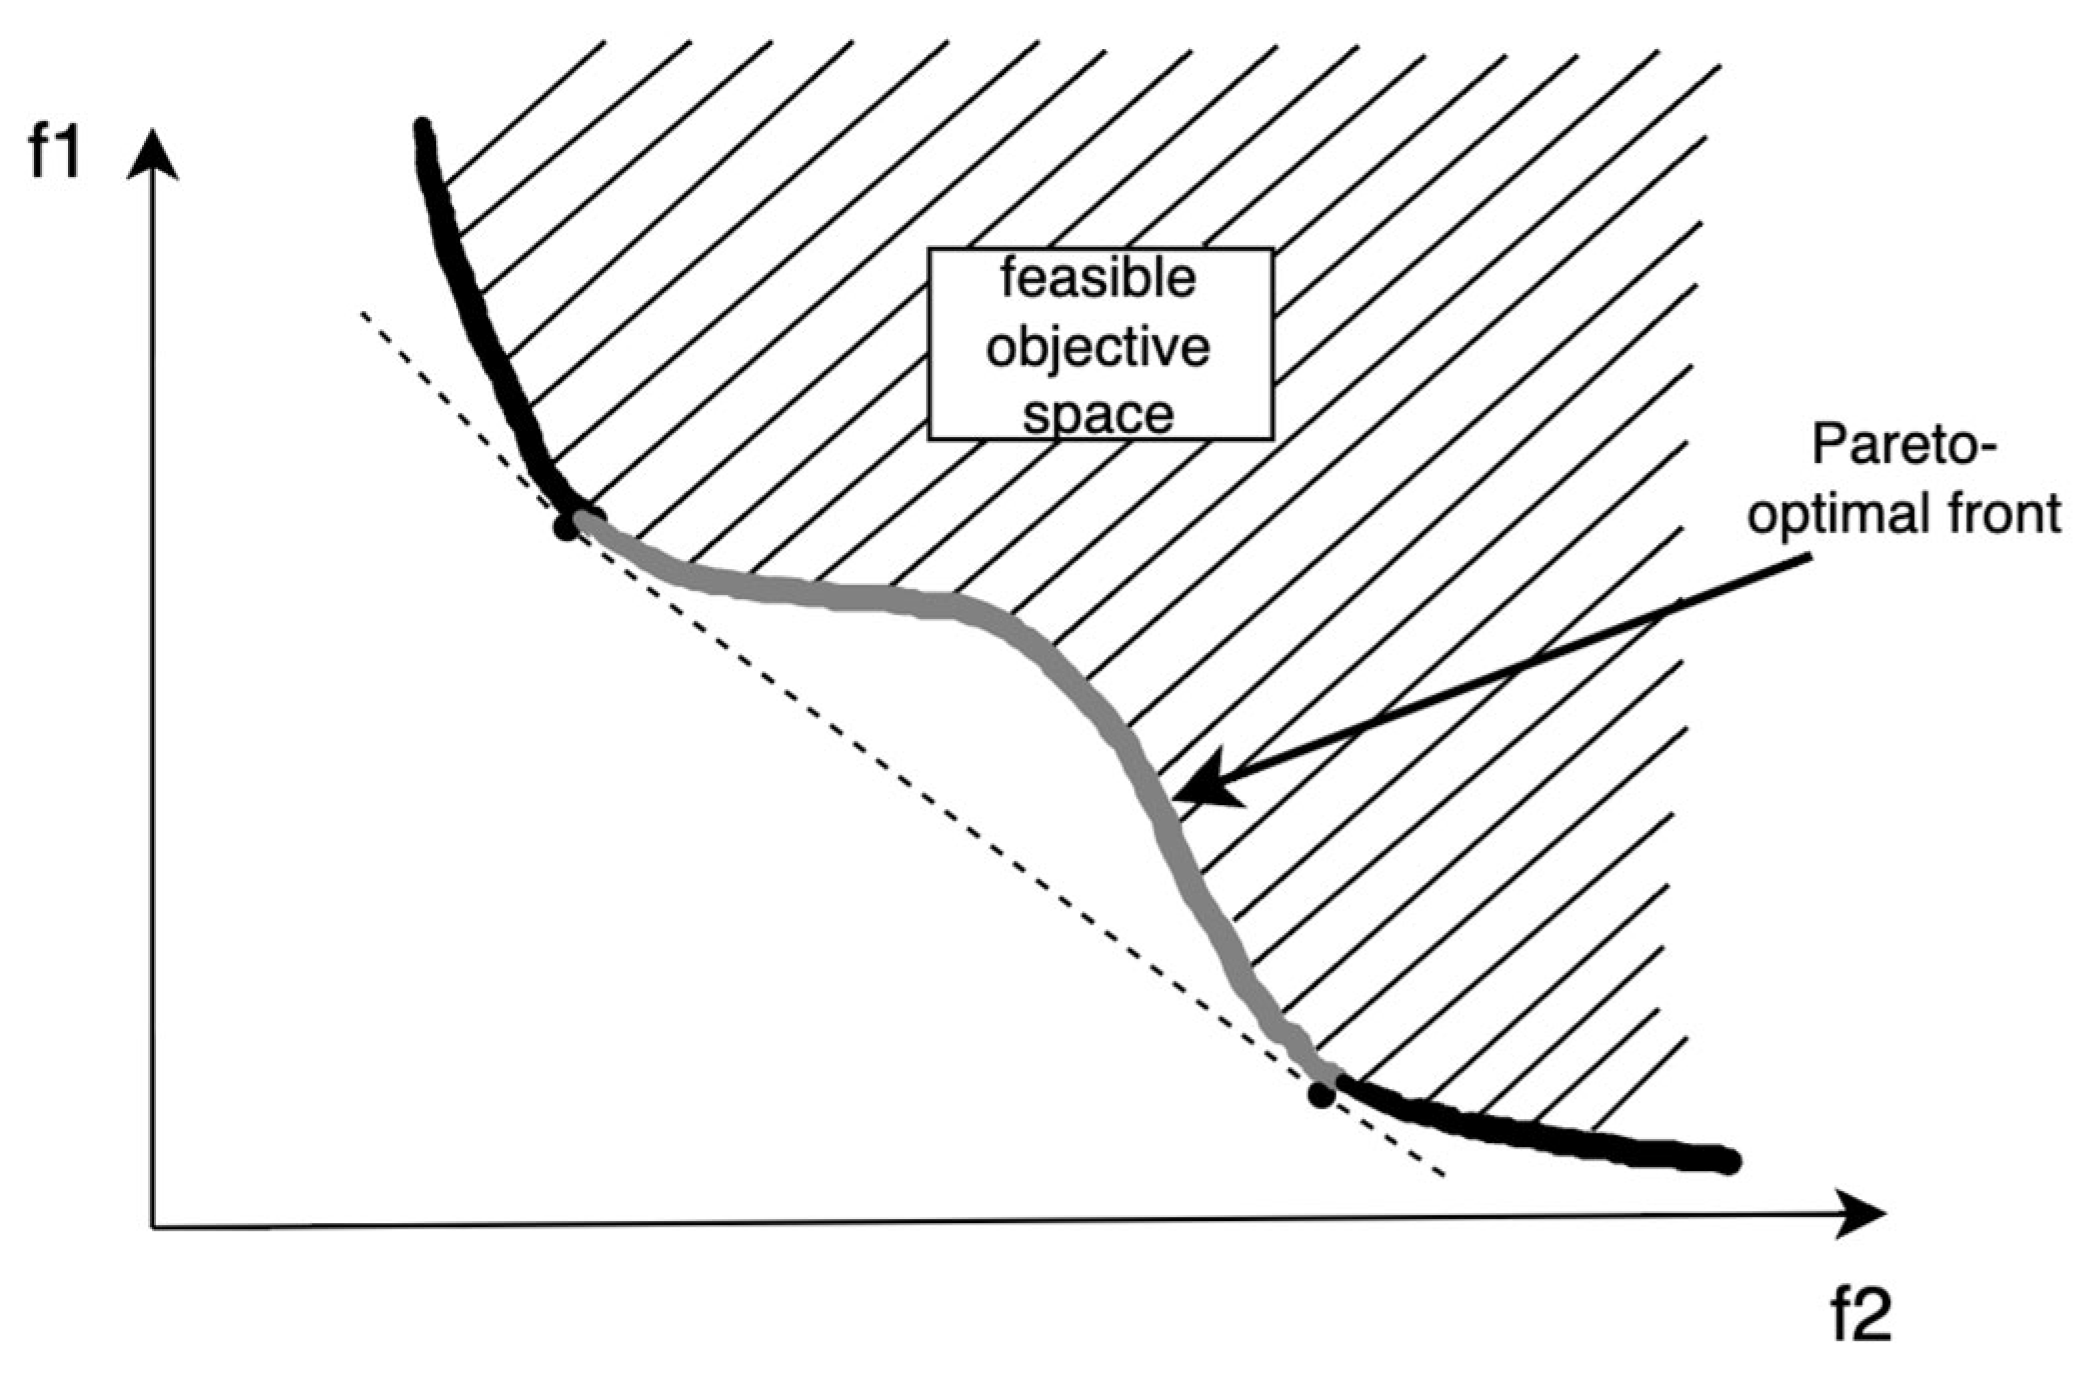
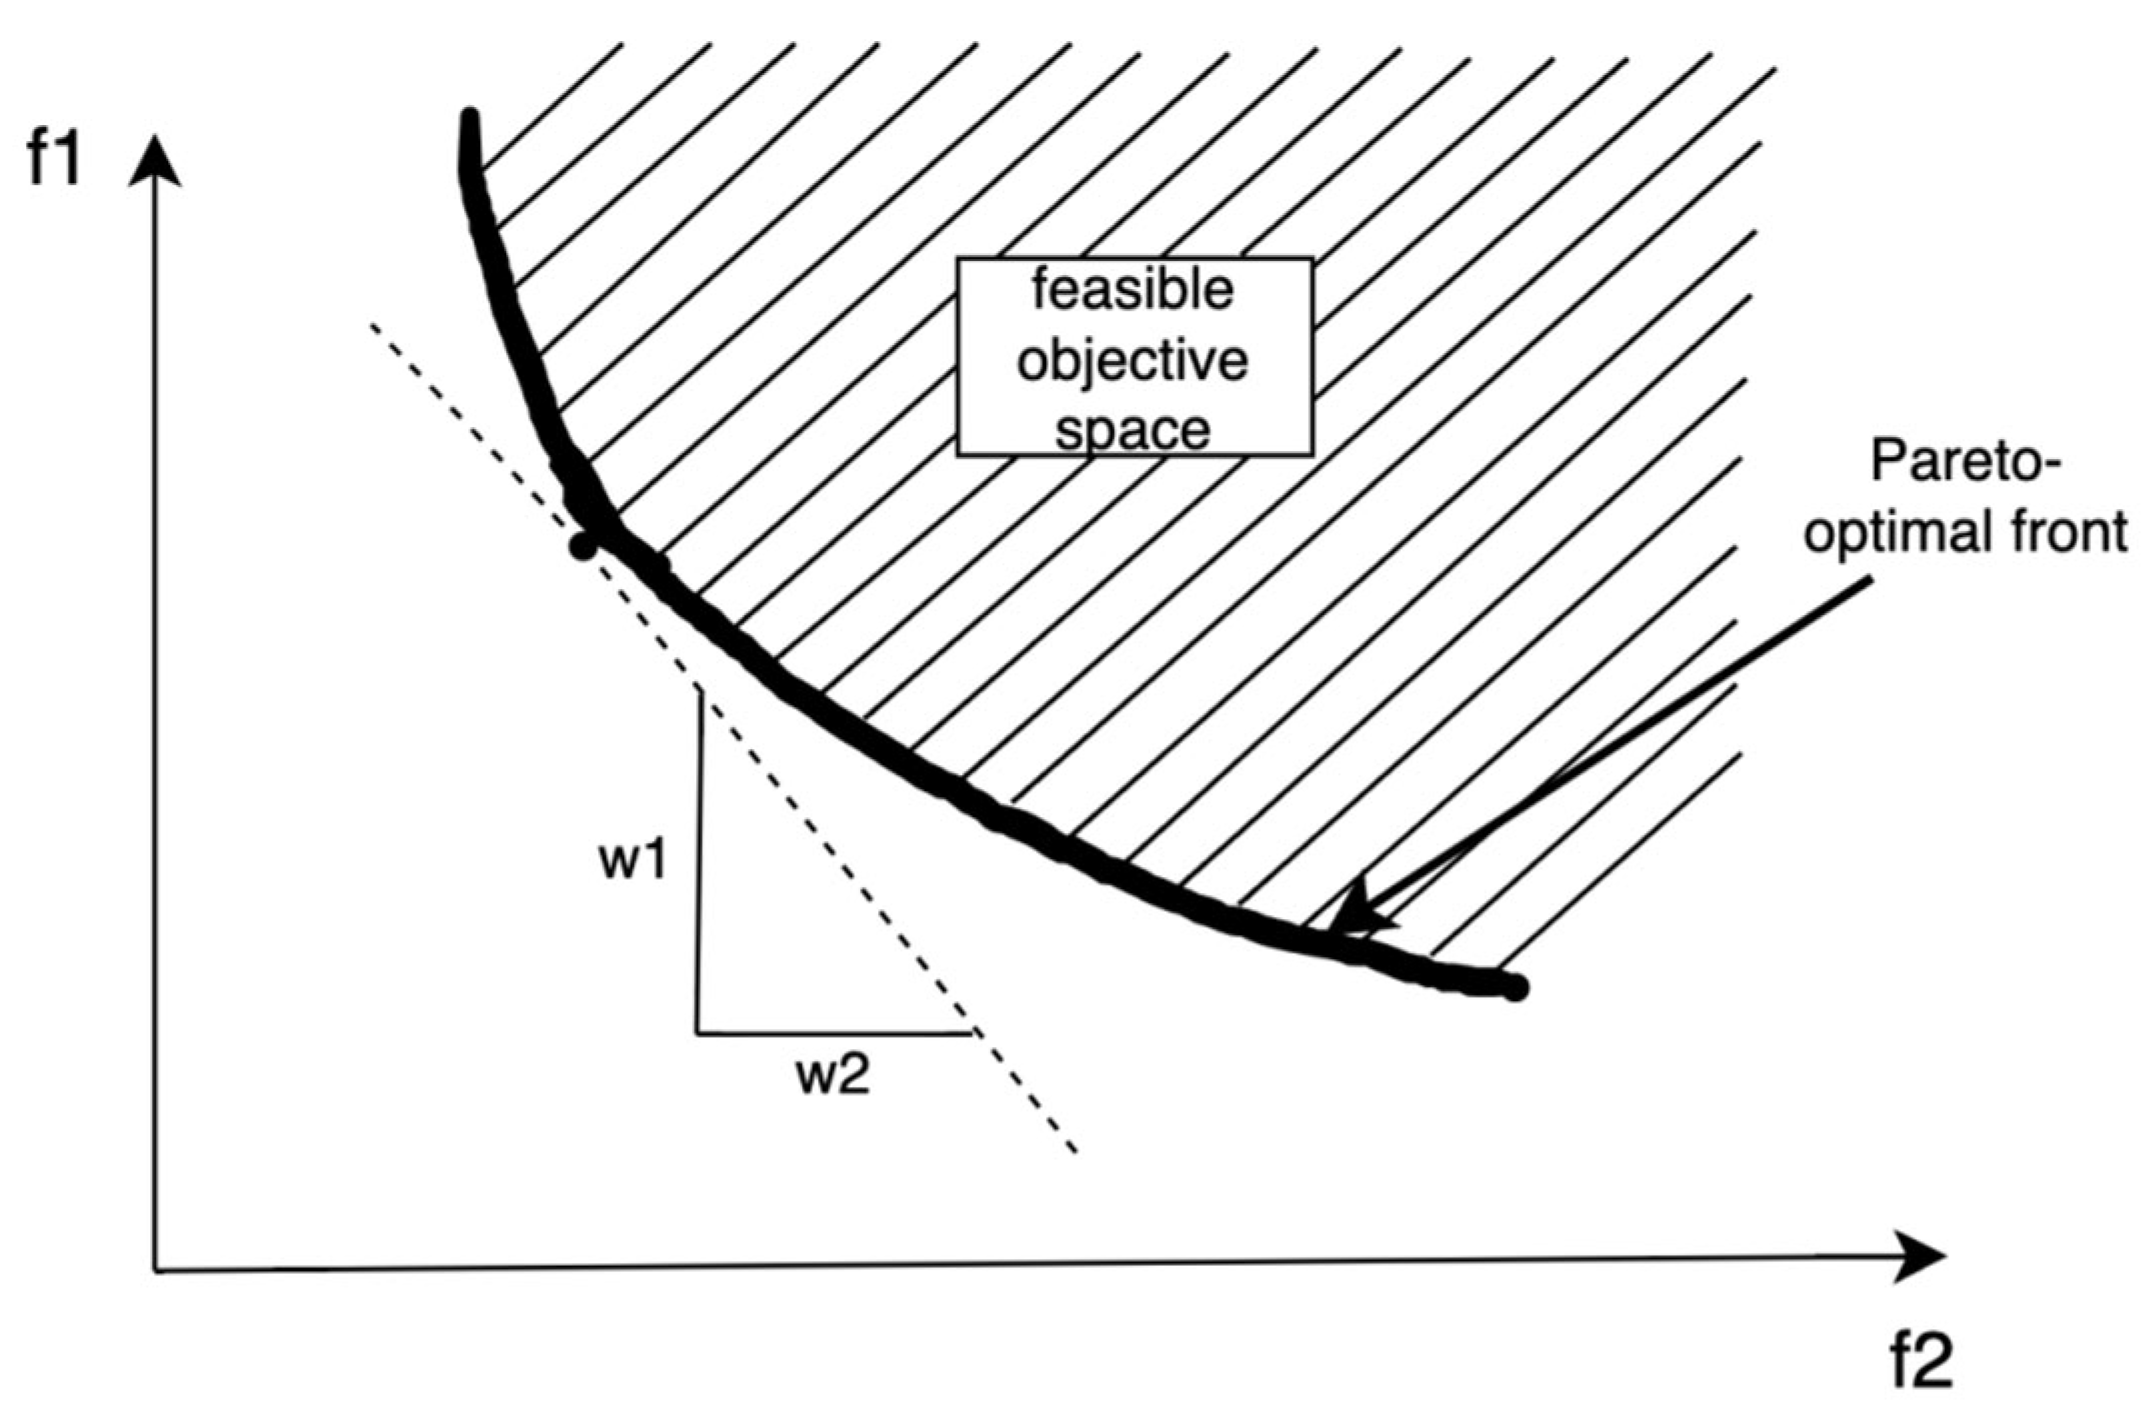
The advantage of this method lies in its simplicity. Its disadvantages stem from the inability to find an optimal solution if the objective function space is not convex. The convex and non-convex cases are illustrated in Figure 1 and Figure 2.
The weighted sum method, particularly through the Analytic Hierarchy Process, has been extensively applied in mining equipment selection. In a foundational study, Bascetin applied AHP to select the most suitable excavation equipment at the Orhaneli open pit coal mine in Turkey, demonstrating how expert judgments can be systematically incorporated through pairwise comparisons of criteria weights. More recently, Malli and colleagues extended this approach by developing a fuzzy weighted sum model for truck selection in open-pit mine transportation systems. Their work, published in Tehnički Vjesnik, shows how fuzzy logic can address the uncertainty inherent in equipment performance data, providing more robust selection outcomes.
In mining applications, the weighted sum method is often used because it is simple and can incorporate expert opinions through weights. However, it requires subjective weight assignment, which may introduce bias. Moreover, if the true Pareto front is non-convex (which can occur when criteria are strongly conflicting), this method may fail to identify optimal trade-offs.

2.1.2. Ideal Point Method

This method involves finding an ideal point that corresponds to optimal values for all criteria, and then finding the closest point to it in the solution space. This method is simple to implement, but may be ineffective for problems with a large number of criteria [10].
Let us illustrate the ideal point method using the example of two conflicting objectives: maximizing the gain for two players (in a company, examples of conflicting objectives might include increasing production volume and increasing costs, improving product quality and additional investment).
Normalization of criteria:
f i _ x = ( f i x f l ˙ m i n ) / ( f l ˙ m a x f l ˙ m i n )  
Distance to the ideal point:
L p = x ( i w i p f i x _ f i _ x p ) ( 1 / p )
In the formula, the following apply:
f i _ x —normalized value of the i-th criterion;
f l ˙ m i n —min the i-th criterion;
f l ˙ m a x —max of the i-th criterion;
w i —the weight of the i-th criterion;
p —metric parameter.
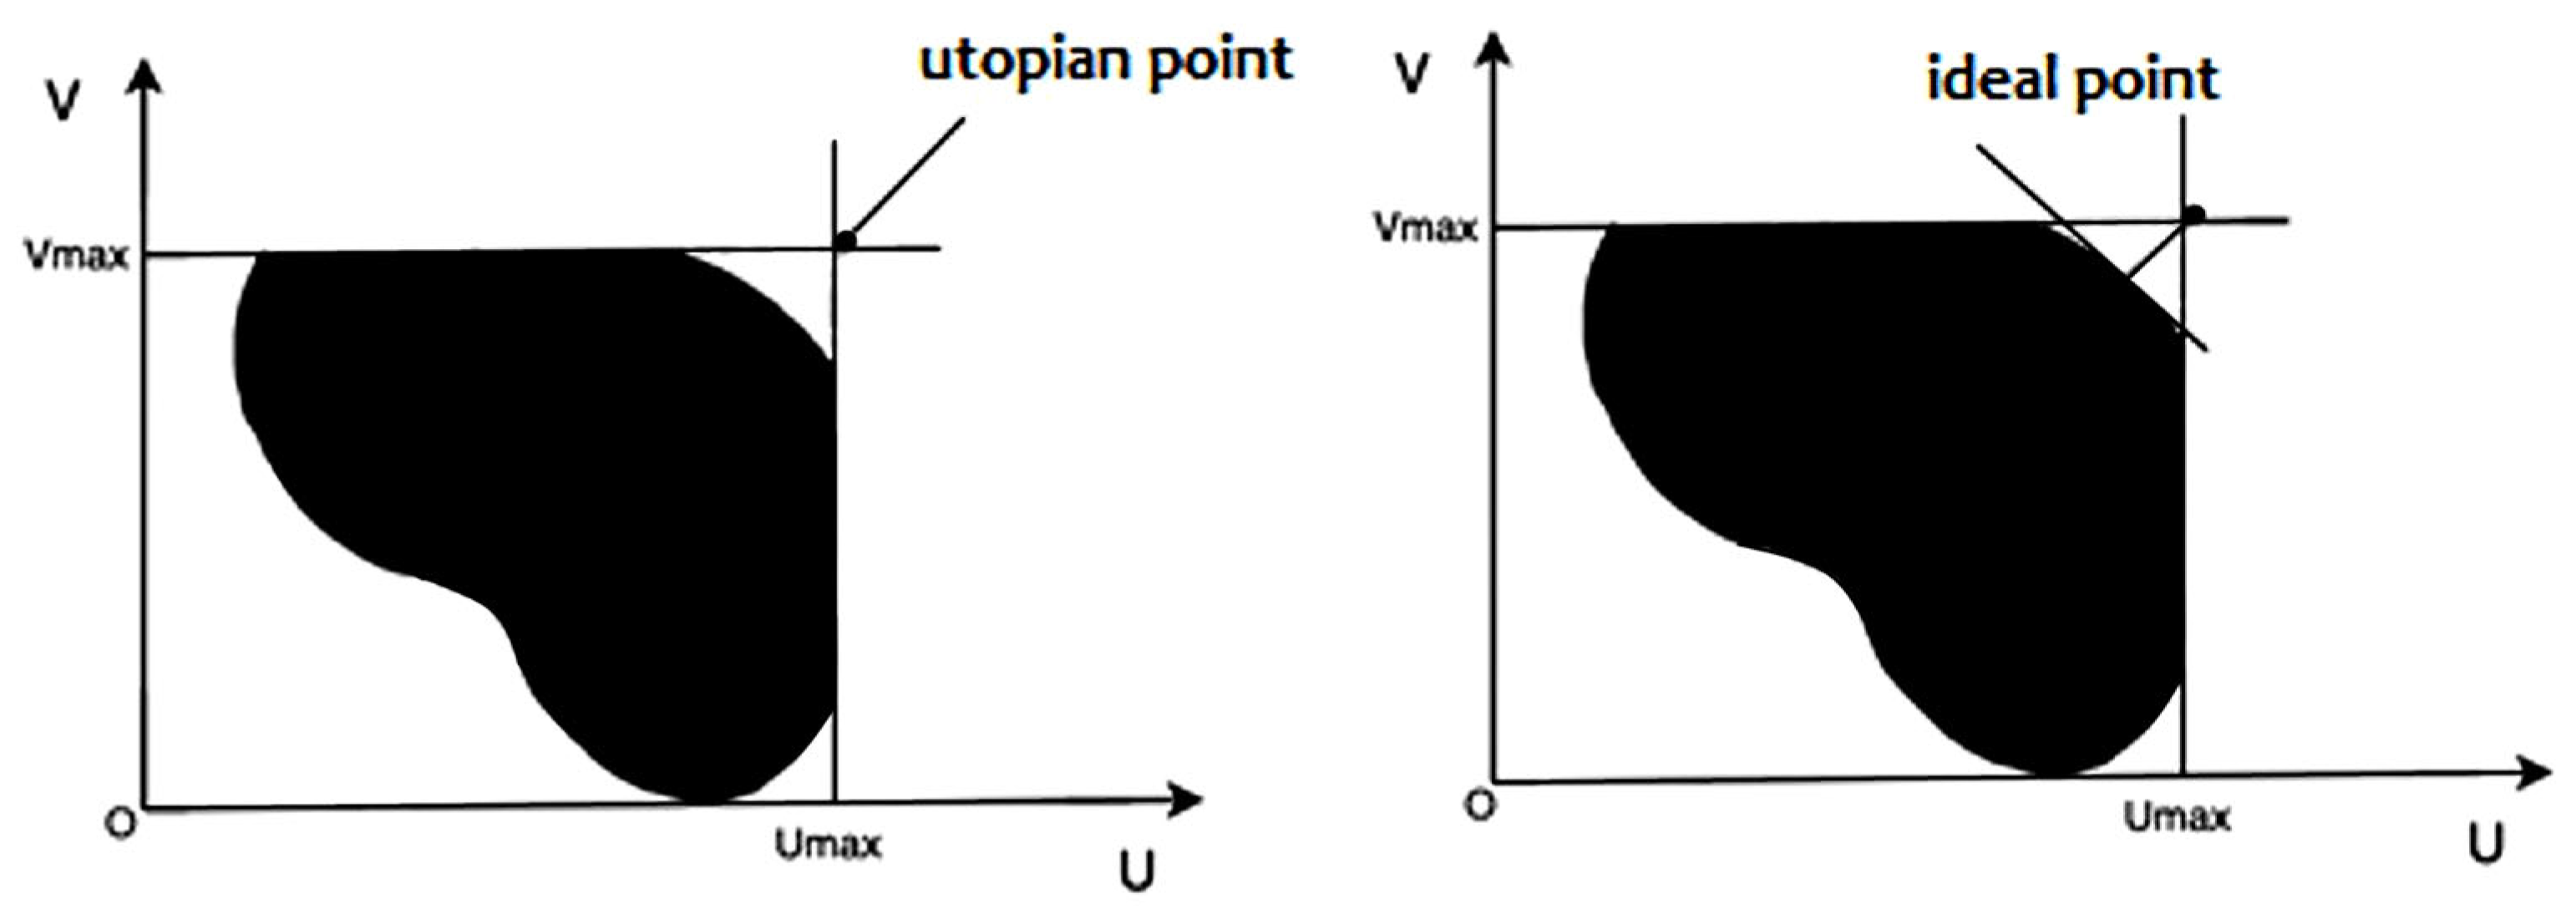
Next, it is necessary to determine the point where both players achieve maximum payoff. However, as a rule, there are no strategies that allow both players to simultaneously achieve the maximum possible payoff. The point where both players’ payoffs are maximized is called the utopian point.
Therefore, a Pareto set is formed, and based on this, the point closest to the utopian point—the so-called ideal point—is found (Figure 3).
The Technique for Order Preference by Similarity to Ideal Solution is one of the most widely applied MCDM methods in mining engineering. Bazzazi, Osanloo, and Soltanmohammadi developed a fuzzy-TOPSIS approach for loading-haulage equipment selection in open pit mines, using data from the Sungun copper mine in Iran. Their method, published in Gospodarka Surowcami Mineralnymi, incorporated fuzzy logic to handle uncertainty in criteria such as rock properties and operating conditions, demonstrating the method’s effectiveness when dealing with imprecise technical specifications.
A contemporary application is provided by Krivošić, Crnogorac, and Tokalić, who employed TOPSIS with different weighting methods to select loading-haulage equipment for an underground mine. Published in Podzemni Radovi, their study evaluated six loader models from three manufacturers against seven criteria, highlighting the importance of moving beyond simple price-based comparisons in equipment selection.
The ideal point method is particularly useful in mining when target values (e.g., desired operating time or remaining life) are known from engineering standards or corporate goals. However, the choice of distance metric (e.g., Euclidean, Manhattan) affects the ranking, and the method may select a solution that is not Pareto-optimal if the ideal point lies outside the feasible region. In our study, we use the Euclidean (L2) norm because it balances the contributions of all criteria and penalizes large deviations more uniformly—a desirable property when evaluating equipment condition.
We will denote the average winnings of the players as H A p , q and H b   p , q , respectively, taking into account their payoff matrices.
A = a 11   a 12   a 21   a 22 ,   B = b 11   b 12   b 21   b 22
The situation (p*q*) in the bimatrix game A and B is called Pareto optimal from the fact that if
H b   p * , q * H A p , q   a n d   H b p * , q * H b   ( p , q ) ,
the following equalities follow: P = P*, q = q*.
Pareto optimality means that it is impossible to find a way through concerted action to improve the payoff of at least one player without worsening the payoff of another. Further improvement is impossible.

2.1.3. Pareto Method

This method is based on the concept of a Pareto set, which is a set of solutions, each of which is optimal with respect to at least one of the criteria under consideration. Using a Pareto set allows for finding compromise solutions that satisfy various requirements; however, this process can require significant computational resources [31,32,33].
A solution x∗ is Pareto optimal if there is no other solution x such that
f i x f i x *   i   a n d   f i x < f i x *
for at least one i.
In the formula, the following apply:
f i x —the value of the i-th objective function.
For all sets of Pareto-optimal solutions, this is denoted mathematically as P:
P = x X ; there is no y ∈ X such that f y f x and f y f x .
The essence of the Pareto principle is that it is virtually impossible to optimize just one target indicator without affecting others. Improving one will compromise another.
Creating a Pareto set allows you to visualize and evaluate all possible tradeoffs between variable criteria, as well as identify optimal points on the boundary of this set.
The Pareto method is especially suitable for mining equipment selection because it does not require subjective weights and reveals all trade-offs. For example, a machine with very high operating time but low remaining life may be Pareto-optimal if no other machine offers both higher operating time and higher remaining life. This is valuable when different mines have different priorities (e.g., short-term production vs. long-term reliability).
While Pareto optimization is fundamental to multi-objective problems, its explicit application to mining equipment selection in the literature is often integrated with other methods. Samanta, Sarkar, and Mukherjee presented a multi-criteria decision-making process for opencast mining equipment selection that implicitly considers Pareto optimality through trade-off analysis. Their work, published in the Journal of the South African Institute of Mining and Metallurgy, provided an early framework for evaluating equipment alternatives across multiple conflicting criteria.
There are several multi-criteria optimization methods used to create a Pareto set. These include the following:
Efficient Multicriteria Programming (EMOP): EMOP uses mathematical models and algorithms to simultaneously optimize multiple criteria. The result is a complete set of compromise solutions on the Pareto frontier, with their performance assessed for each criterion. This allows for a precise determination of how improving one parameter can significantly impact others [11].
Weighted Sum Method: This approach assigns a weight to each criterion, reflecting its importance. A linear combination of criteria is then optimized, taking into account the assigned weights, resulting in a set of Pareto-optimal compromise solutions that reflect the specified priorities [10].
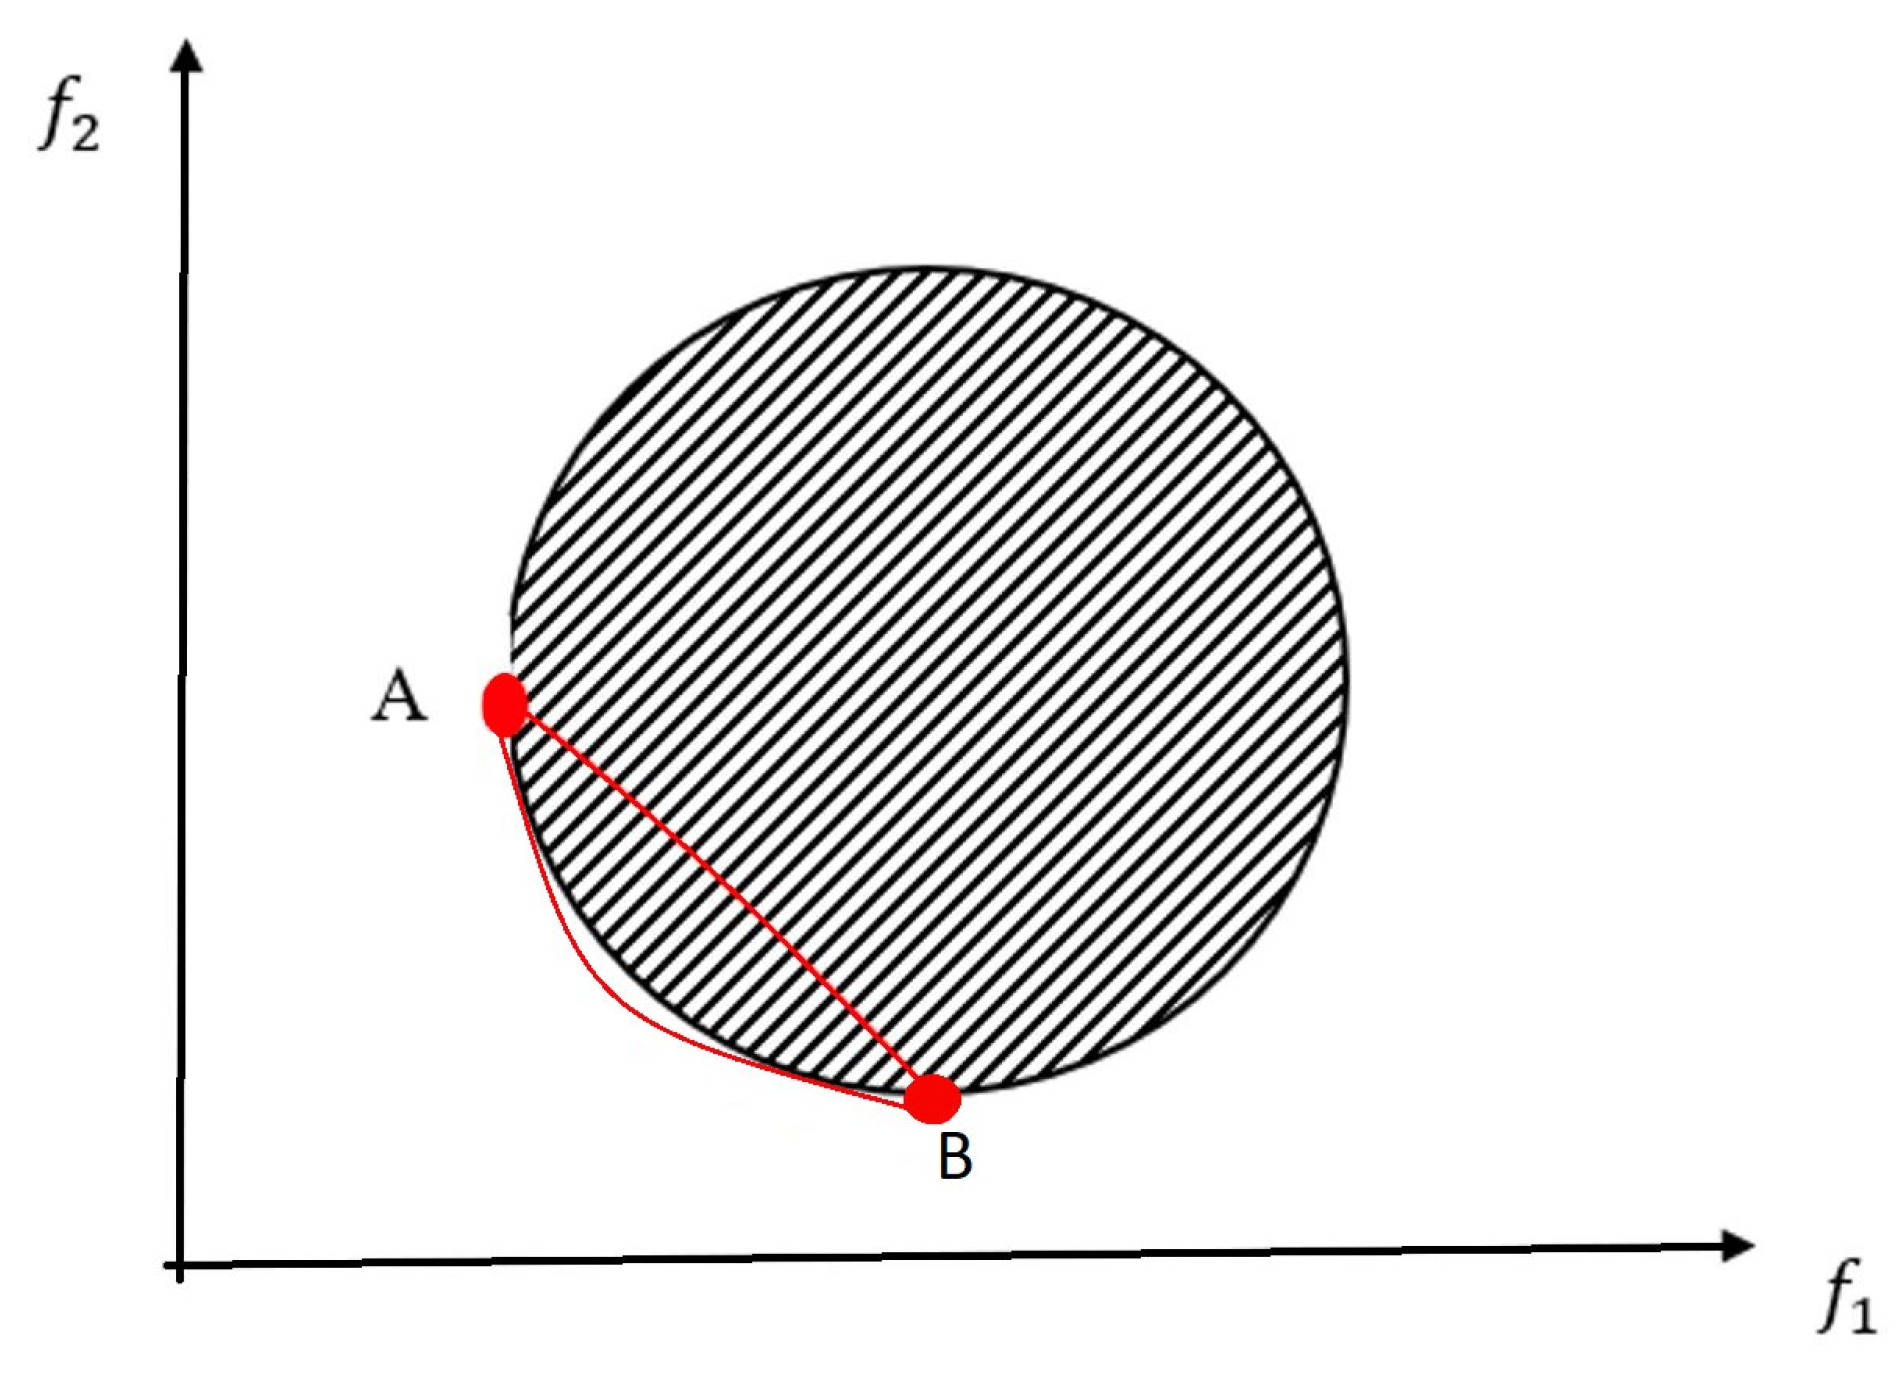
Evolutionary Optimization Methods: This group of methods, including genetic algorithms and particle swarm algorithms, is based on the principles of biological evolution. Simulating natural selection allows for iterative improvement and selection of solutions, approaching the Pareto-optimal frontier. The set of Pareto-optimal points is located between the minimum points (in minimization problems) obtained by independently solving the optimization problem for each criterion separately. In Figure 4, the Pareto points are represented by a set of contour points between points A and B [31].

2.1.4. ELECTRE Method

This method is based on pairwise comparison of solutions and allows one to determine the most preferable solution. This method is simple to implement but may be ineffective for problems with a large number of criteria.
The ELECTRE method (Elimination and Choice Reflecting Reality) is a multi-criteria decision-making method that allows one to rank or select alternatives based on various, often conflicting criteria [32]. Its main stages include the following:
Calculating the agreement and disagreement indices.
The concordance index shows the extent to which the scores for various criteria support the hypothesis that one alternative is generally better than another. The index is constructed based on the weights of the criteria (reflecting their importance) and the acceptable value intervals (scales) for each criterion. In other words, the weights of the criteria for which one alternative is better than another are summed. The discordance index shows the extent to which criterion scores contradict the hypothesis of the superiority of one alternative over another. A high discordance index indicates that one alternative is significantly worse than the other on some important criteria, which may outweigh overall agreement.
Establishing thresholds for the agreement and disagreement indices. These thresholds allow us to divide alternatives into “acceptable” and “unacceptable” based on their superiority. Each index calculated in the first stage is compared with the corresponding threshold for each pair of alternatives.
Forming cores (selecting the best alternatives): The ELECTRE method works iteratively, forming “cores”—groups of the best alternatives.
First, based on the established thresholds, the dominant alternatives—that is, those that are significantly inferior to others on most criteria—are eliminated from the set. The remaining alternatives form the first core. Then, to increase the rigor of the selection process, the threshold values for the agreement and disagreement indices are lowered (that is, the requirements for “agreement” are relaxed, while those for “disagreement” are tightened). This leads to the exclusion of additional alternatives from the first core, forming a second core containing even stronger alternatives.
This process is repeated several times, forming a sequence of “cores” with a decreasing number of alternatives. The final core contains the best alternatives, which are considered the most preferable.
Patyk, Bodziony, and Krysa applied ELECTRE III to select surface mining equipment. Their 2021 study in Energies ranked loading machines, haul trucks, and crushing plants against technical, economic, and environmental criteria. The method proved applicable across mines with similar geological conditions. Bodziony and Patyk also used ELECTRE III for haul truck selection. Their 2016 study in Archives of Mining Sciences considered purchase cost, fuel consumption, and operational parameters. The research showed how outranking methods handle complex trade-offs in mining equipment decisions. While Sitorus, Cilliers, and Brito-Parada reviewed MCDM applications in mining, including ELECTRE. Their 2019 review in Expert Systems with Applications documented cases where ELECTRE helped eliminate less favorable options under many conflicting criteria.
Unlike some other methods, ELECTRE allows for criteria of different natures and meanings to be considered. This makes it suitable for problems that require consideration of both quantitative (e.g., cost, performance) and qualitative (e.g., usability, environmental friendliness) factors.
In mining, ELECTRE can handle mixed quantitative and qualitative data (e.g., safety ratings, environmental impact). However, it requires the definition of concordance and discordance thresholds, which adds complexity and subjectivity.

2.1.5. PROMETHEE Method

This method is based on pairwise comparison of solutions and allows one to determine the most preferable solution. The basic principle of the method is to evaluate the degree of preference of one alternative over another for each criterion, and to combine these evaluations taking into account the criterion weights. This method is more flexible than ELECTRE, but can be computationally complex [8].
Vujić, Hudej, and Miljanović used PROMETHEE to select the technological system for the Majdan III clay mineral open pit mine in Serbia. Seven alternative systems were evaluated, and the chosen solution, a bucket chain excavator with conveyor belts and a spreader, was implemented in 2000. Their 2013 publication in the Archives of Mining Sciences confirmed that twelve years of operational data validated the original decision, demonstrating PROMETHEE’s practical utility for long-term mining investments.
PROMETHEE is useful when the decision-maker can specify preference functions for each criterion. In mining, it has been applied to equipment selection, but it also requires subjective inputs (weights, preference thresholds).

2.1.6. Fuzzy Logic Method

This method is based on the use of fuzzy sets to describe the uncertainty in the criteria. It allows one to take this uncertainty into account, but can be computationally complex [34,35].
Solving multi-criteria optimization problems using fuzzy methods is an iterative process, the key steps of which are the following:
1. Formation of the objective function in fuzzy form. The objective function, reflecting the overall optimization goal, is created using fuzzy logic tools, which allows one to account for uncertainty and imprecision in the formulation of the objectives. This means that the objective function can take values that are not strictly defined numbers, but are described as fuzzy sets.
2. Defining evaluation criteria values in fuzzy form. The values of the criteria used to evaluate alternatives are represented as fuzzy numbers or fuzzy sets. This allows for the inclusion of subjective assessments, expert opinions, and other forms of uncertain information. For example, the criterion “high performance” can be represented as a fuzzy set describing the various performance levels considered “high.”
3. Developing membership functions for the criteria. For each criterion, a membership function is developed that determines the degree to which each criterion value corresponds to the fuzzy set representing that criterion. The membership function takes values from 0 to 1, where 1 corresponds to complete compliance with the criterion, and 0 corresponds to complete noncompliance.
4. Defining a rule base and/or preference base for the criteria. To determine the relative importance of criteria and establish decision-making rules, a rule base is formed (e.g., in the format “IF criterion A is important AND criterion B is also important, THEN alternative X is preferable”) or a preference base (e.g., in the form of a comparison matrix showing which criteria are more important relative to each other).
5. Calculating the objective function values. Based on the fuzzy criterion values, membership functions, and the rule/preference base, a fuzzy objective function value is calculated for each alternative. This calculation is performed using fuzzy logic operations (e.g., minimum, maximum, weighted average).
6. Defuzzification of the objective function. The resulting fuzzy objective function value is converted into a crisp value (defuzzified). Several defuzzification methods exist, each with its own advantages and disadvantages (e.g., the center of gravity method, the maximum method).
Fuzzy logic is particularly attractive for mining equipment selection because performance data often contain uncertainties due to measurement errors, varying operating conditions, and subjective expert judgments. By representing criteria as linguistic variables (e.g., “low/medium/high remaining life”), we can smooth out minor fluctuations and focus on meaningful distinctions.
Fuzzy logic has gained significant traction in mining equipment selection due to the industry’s inherent uncertainties. A state-of-the-art example is provided by Aghajari and Namin, who developed the U-HRMES model, a comprehensive decision support system combining MCDM methods with fuzzy logic. Published in Expert Systems with Applications, a Q1 journal with an Impact Factor of 8.5, their model was applied to the Anguran underground lead and zinc mine in Iran. The model evaluated 22 sub-criteria across four main groups to select drilling and loading-hauling equipment. Critically, their sensitivity analysis with weight variations of 10 to 20 percent confirmed result stability, with drilling equipment selection showing higher sensitivity to stope conditions and loading equipment to technical specifications.
The specific features of multicriteria problems with fuzzy criteria include a set of alternatives. There is a finite or infinite set of possible solutions (alternatives). In addition, numerous constraints are imposed. There are constraints (e.g., budgetary, technical, environmental) that must be considered when selecting a solution.
Using fuzzy logic allows for the relative priority of criteria to be considered, representing them as fuzzy numbers rather than fixed values. This makes the method more flexible and adaptable to real-world conditions where criteria cannot be precisely defined. For example, one could say, “The price must be low enough,” rather than specifying a specific number.

2.2. Analysis of Literary Sources

A literature review revealed that the majority of research in this area is devoted to the development and application of various multi-criteria optimization methods, such as the Pareto method, the ELECTRE method, and the PROMETHEE method. Despite this, many of the presented methods have limitations and do not take into account the specifics of the mining industry.
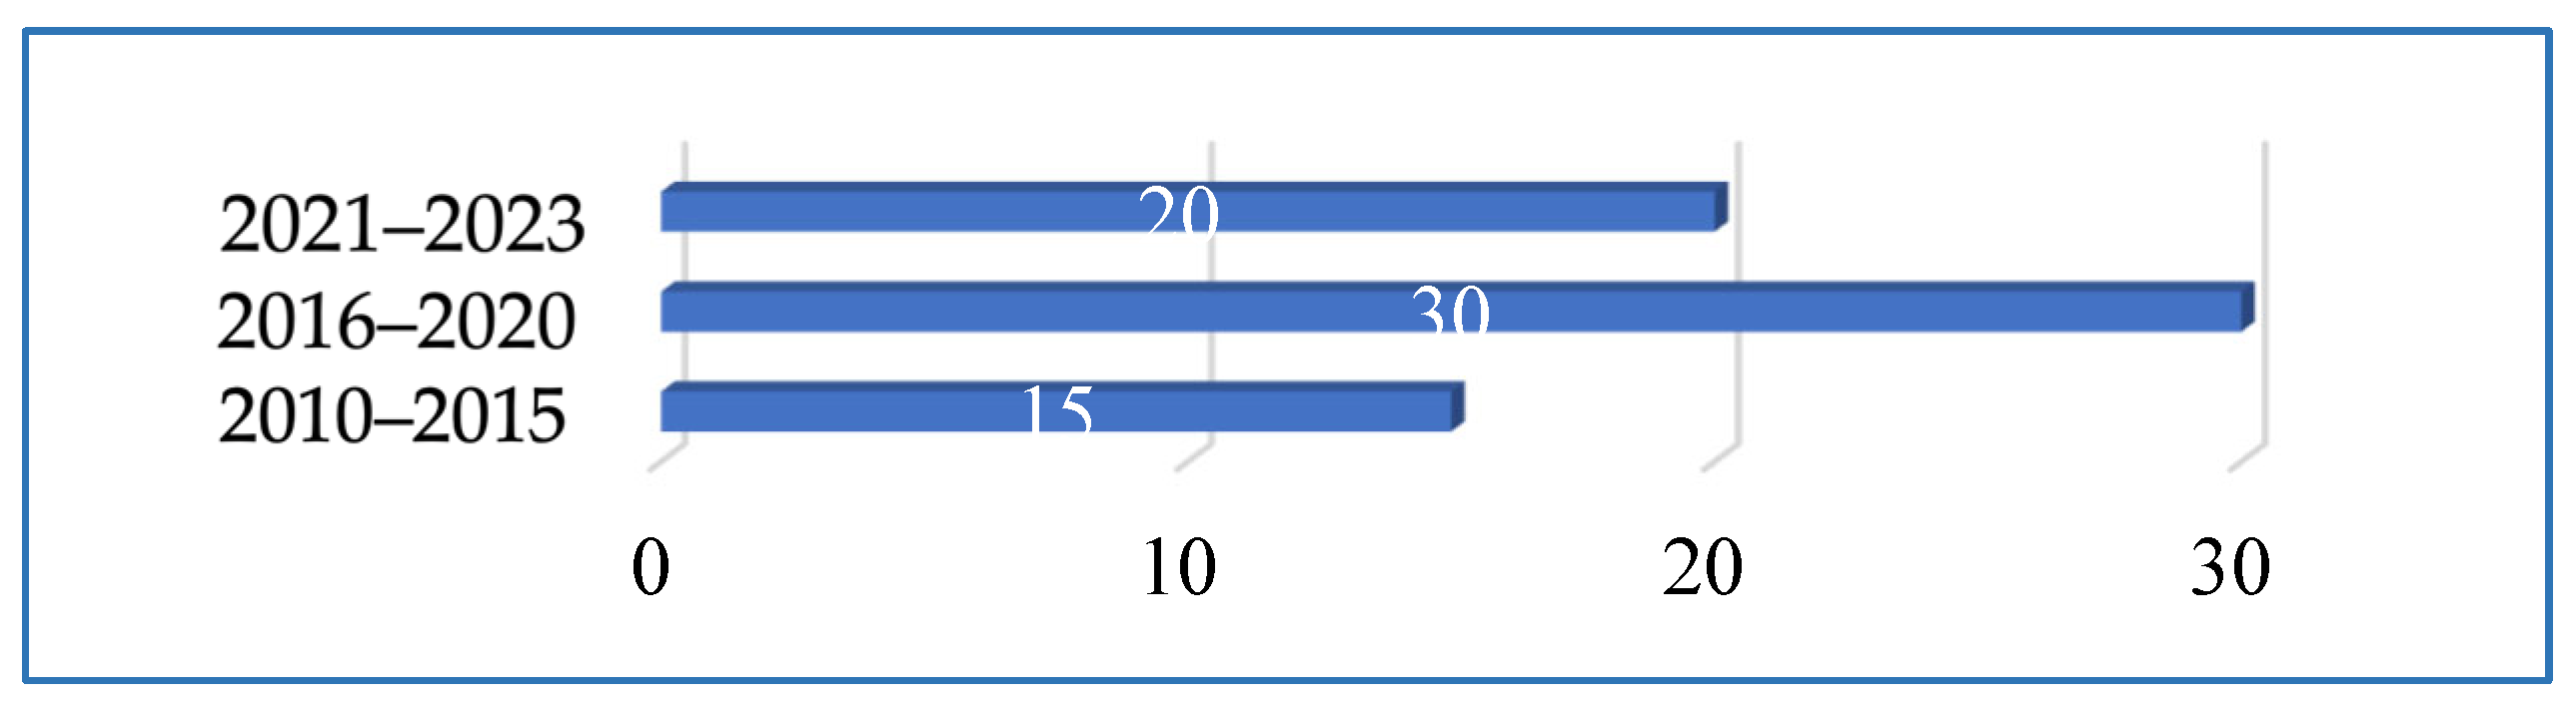
Table 2 and Figure 5 show a comparison of the number of articles by year of publication.
Thus, the number of articles on multi-criteria optimization of production processes in mining companies is increasing every year, demonstrating the growing relevance of this topic.
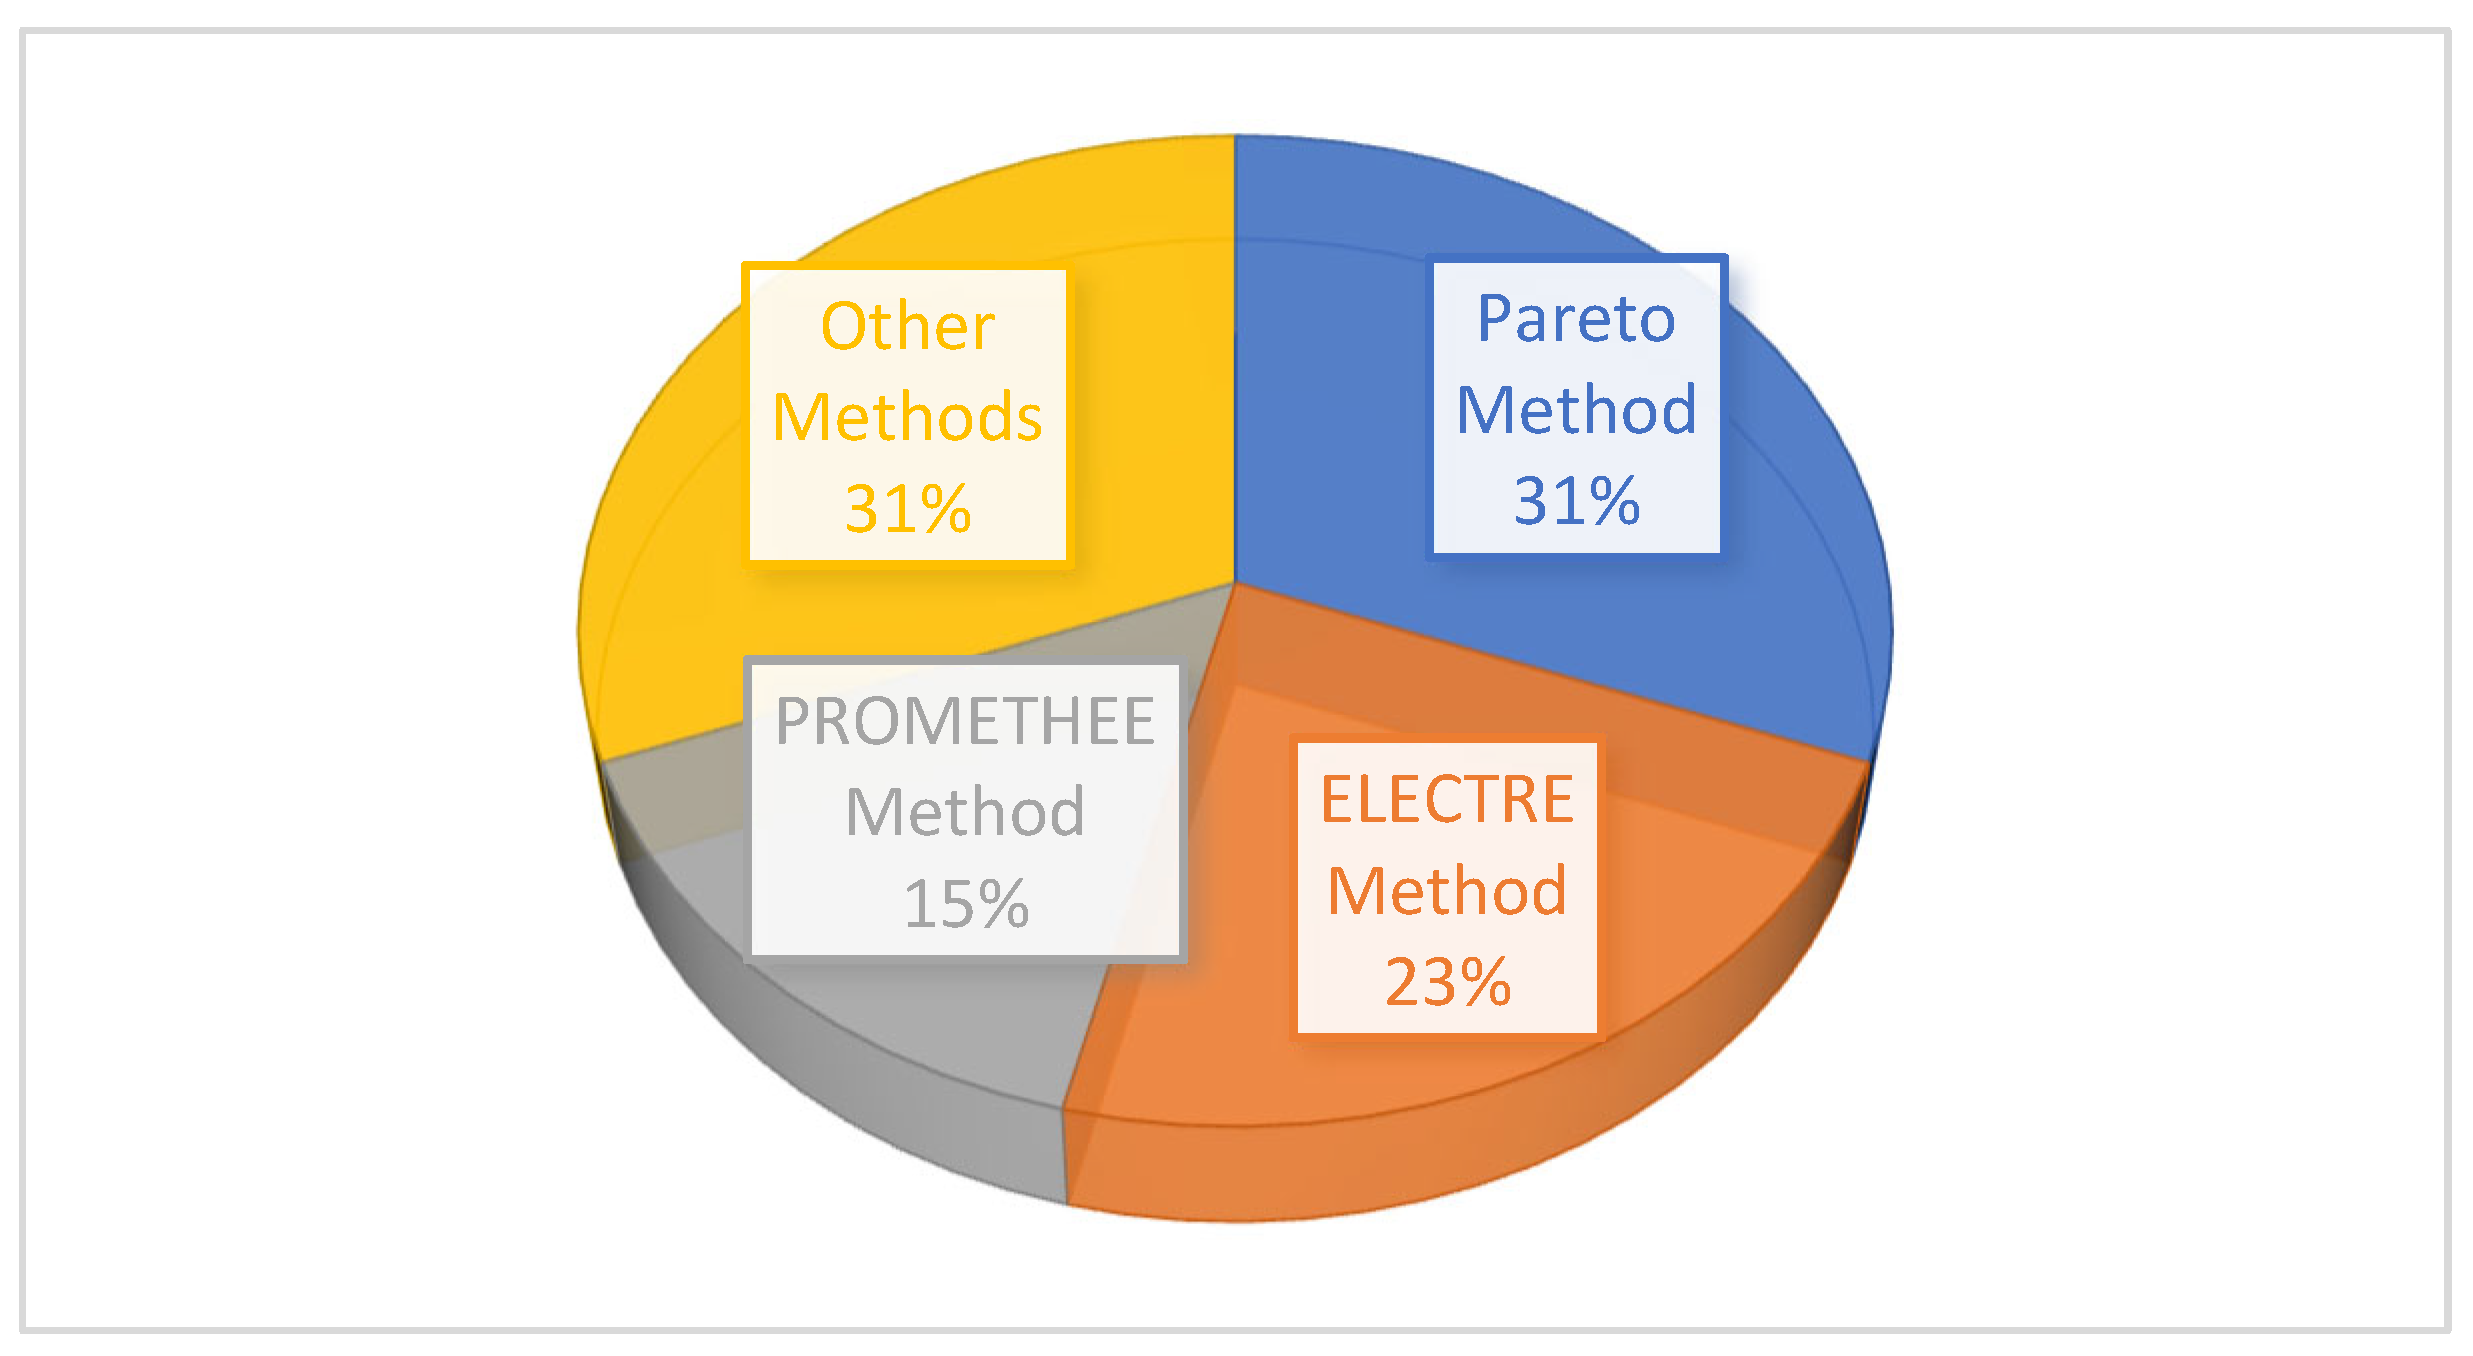
Table 2 and Figure 6 present the results of the analysis of articles on multi-criteria optimization methods.
Table 3 and Figure 6 show that the Pareto method is the most popular multi-objective optimization method in the mining industry; however, other methods are also used.
However, a closer analysis of these publications reveals several limitations. First, while the volume of research has grown, most studies focus on method application rather than addressing the specific challenges of mining equipment selection. Key issues such as reliability and maintenance behavior, operational constraints (geological conditions, shift schedules), organizational factors, and external shocks (market dynamics, regulatory changes) are rarely incorporated into MCDM frameworks.
Second, the methodological trends shown in Figure 6 tell only part of the story. The prevalence of the Pareto method reflects its ability to identify trade-offs without subjective weighting, but traditional Pareto approaches treat criteria as deterministic values. The growing category of “Other Methods” (20 articles) actually signals a shift toward hybrid and fuzzy-based approaches that can better handle the uncertainty inherent in real-world equipment data.
Third, and most critically, very few existing studies validate their results through sensitivity analysis or test how rankings change when input parameters vary. This leaves decision-makers uncertain about the robustness of recommendations—a gap the present study directly addresses.


2.3. Gaps in Existing Research

A review of the articles revealed the following gaps in existing research:
-
Insufficient attention is paid to considering uncertainty and risk in multi-objective optimization of mining companies’ production processes;
-
Insufficient attention is paid to the development and application of hybrid multi-objective optimization methods;
-
Insufficient attention is paid to the application of machine learning and artificial intelligence methods in multi-objective optimization of mining companies’ production processes.
This study aims to fill these gaps by developing a hybrid Fuzzy–Pareto–Genetic Algorithm framework that explicitly incorporates uncertainty through fuzzy logic, uses Pareto optimality to identify trade-offs without subjective weighting, and employs a genetic algorithm to efficiently search the solution space. Unlike previous deterministic approaches, our method provides a robust, sensitivity-tested ranking that accounts for the imprecision inherent in real-world equipment data. Furthermore, by validating the framework on real operational data from a mining company, we demonstrate its practical applicability and address the lack of empirical validation noted in the literature.
Specifically, we address the gaps as follows:
-
Uncertainty: it is modeled via fuzzy membership functions that capture gradual transitions and measurement imprecision.
-
Hybrid methods: we combine fuzzy logic, Pareto optimization, and a genetic algorithm into a single framework.
-
AI/ML: we employ a genetic algorithm (a well-established AI technique) to search for optimal solutions on the fuzzy–Pareto front.

3. Materials and Methods

3.1. Optimization Method

This paper uses the Pareto–fuzzy method, which combines the advantages of the Pareto method and fuzzy logic. The Pareto–fuzzy method allows for finding compromise solutions that satisfy several criteria simultaneously and takes into account uncertainty and imprecision in the optimization criteria.
Why combine fuzzy logic with Pareto optimization?
Classical Pareto optimality operates on crisp (deterministic) criterion values. However, in mining equipment data, the exact values of operating time, remaining life, and their ratio are subject to measurement errors, variations in operating conditions, and future uncertainties. Fuzzy logic provides a natural way to represent these uncertainties by allowing criteria to be expressed as linguistic terms (e.g., “low operating time”) with membership degrees. This smooths out minor fluctuations and focuses on meaningful distinctions. Moreover, the combination with a genetic algorithm is necessary because the search space (combinations of fuzzy membership degrees and potential trade-offs) is large and complex; an evolutionary approach efficiently explores it to approximate the fuzzy–Pareto front.
The optimization algorithm presented in this paper consists of the following steps:
For each optimization criterion, a corresponding fuzzy set is generated, allowing for uncertainty and imprecision in the estimates.
For each generated fuzzy set, a membership function is determined, characterizing the degree to which the set’s elements correspond to the given criterion. Triangular membership functions were chosen due to their simplicity, widespread use in engineering applications, and sufficient flexibility for representing uncertainty in equipment data. The general form of a triangular membership function μ ( x ) for a criterion is:
μ x = { 0 ,   x a   x   a ) / ( b     a ) ,   a   <   x   b   c x / c b , b < x c   0 ,   x   >   c
where [ a , b , c ] are the parameters defining the support and core of the fuzzy set (“poor”, “medium”, “good”, etc.).
The specific parameters [ a , b , c ] for each linguistic term (“Low”, “Medium”, “High”) and each criterion were determined based on a combination of statistical analysis of the real dataset from the mining company (minimum, maximum, quartiles, and typical distribution ranges), consultations with domain experts in mining equipment operation and maintenance, and iterative sensitivity testing to ensure reasonable coverage and meaningful trade-offs in the Pareto front. The values reflect practical thresholds: low performance indicates critical wear or imminent risk, medium indicates acceptable but not optimal condition, and high indicates reliable, long-term operable equipment.
Concrete membership function parameters used in this study:
Operating time (m3, maximization):
-
Low: a = 0, b = 800, c = 1800;
-
Medium: a = 1200, b = 3000, c = 4800;
-
High: a = 4000, b = 5500, c = 10,000 (with saturation beyond observed maxima).
Remaining service life (m3, maximization):
-
Low: a = 0, b = 1500, c = 4000;
-
Medium: a = 3000, b = 12,000, c = 20,000;
-
High: a = 18,000, b = 28,000, c = 45,000.
Remaining service life ratio (%, maximization):
-
Low: a = 0, b = 55, c = 68;
-
Medium: a = 65, b = 78, c = 88;
-
High: a = 85, b = 92, c = 100.
Table 4 shows membership function parameters.
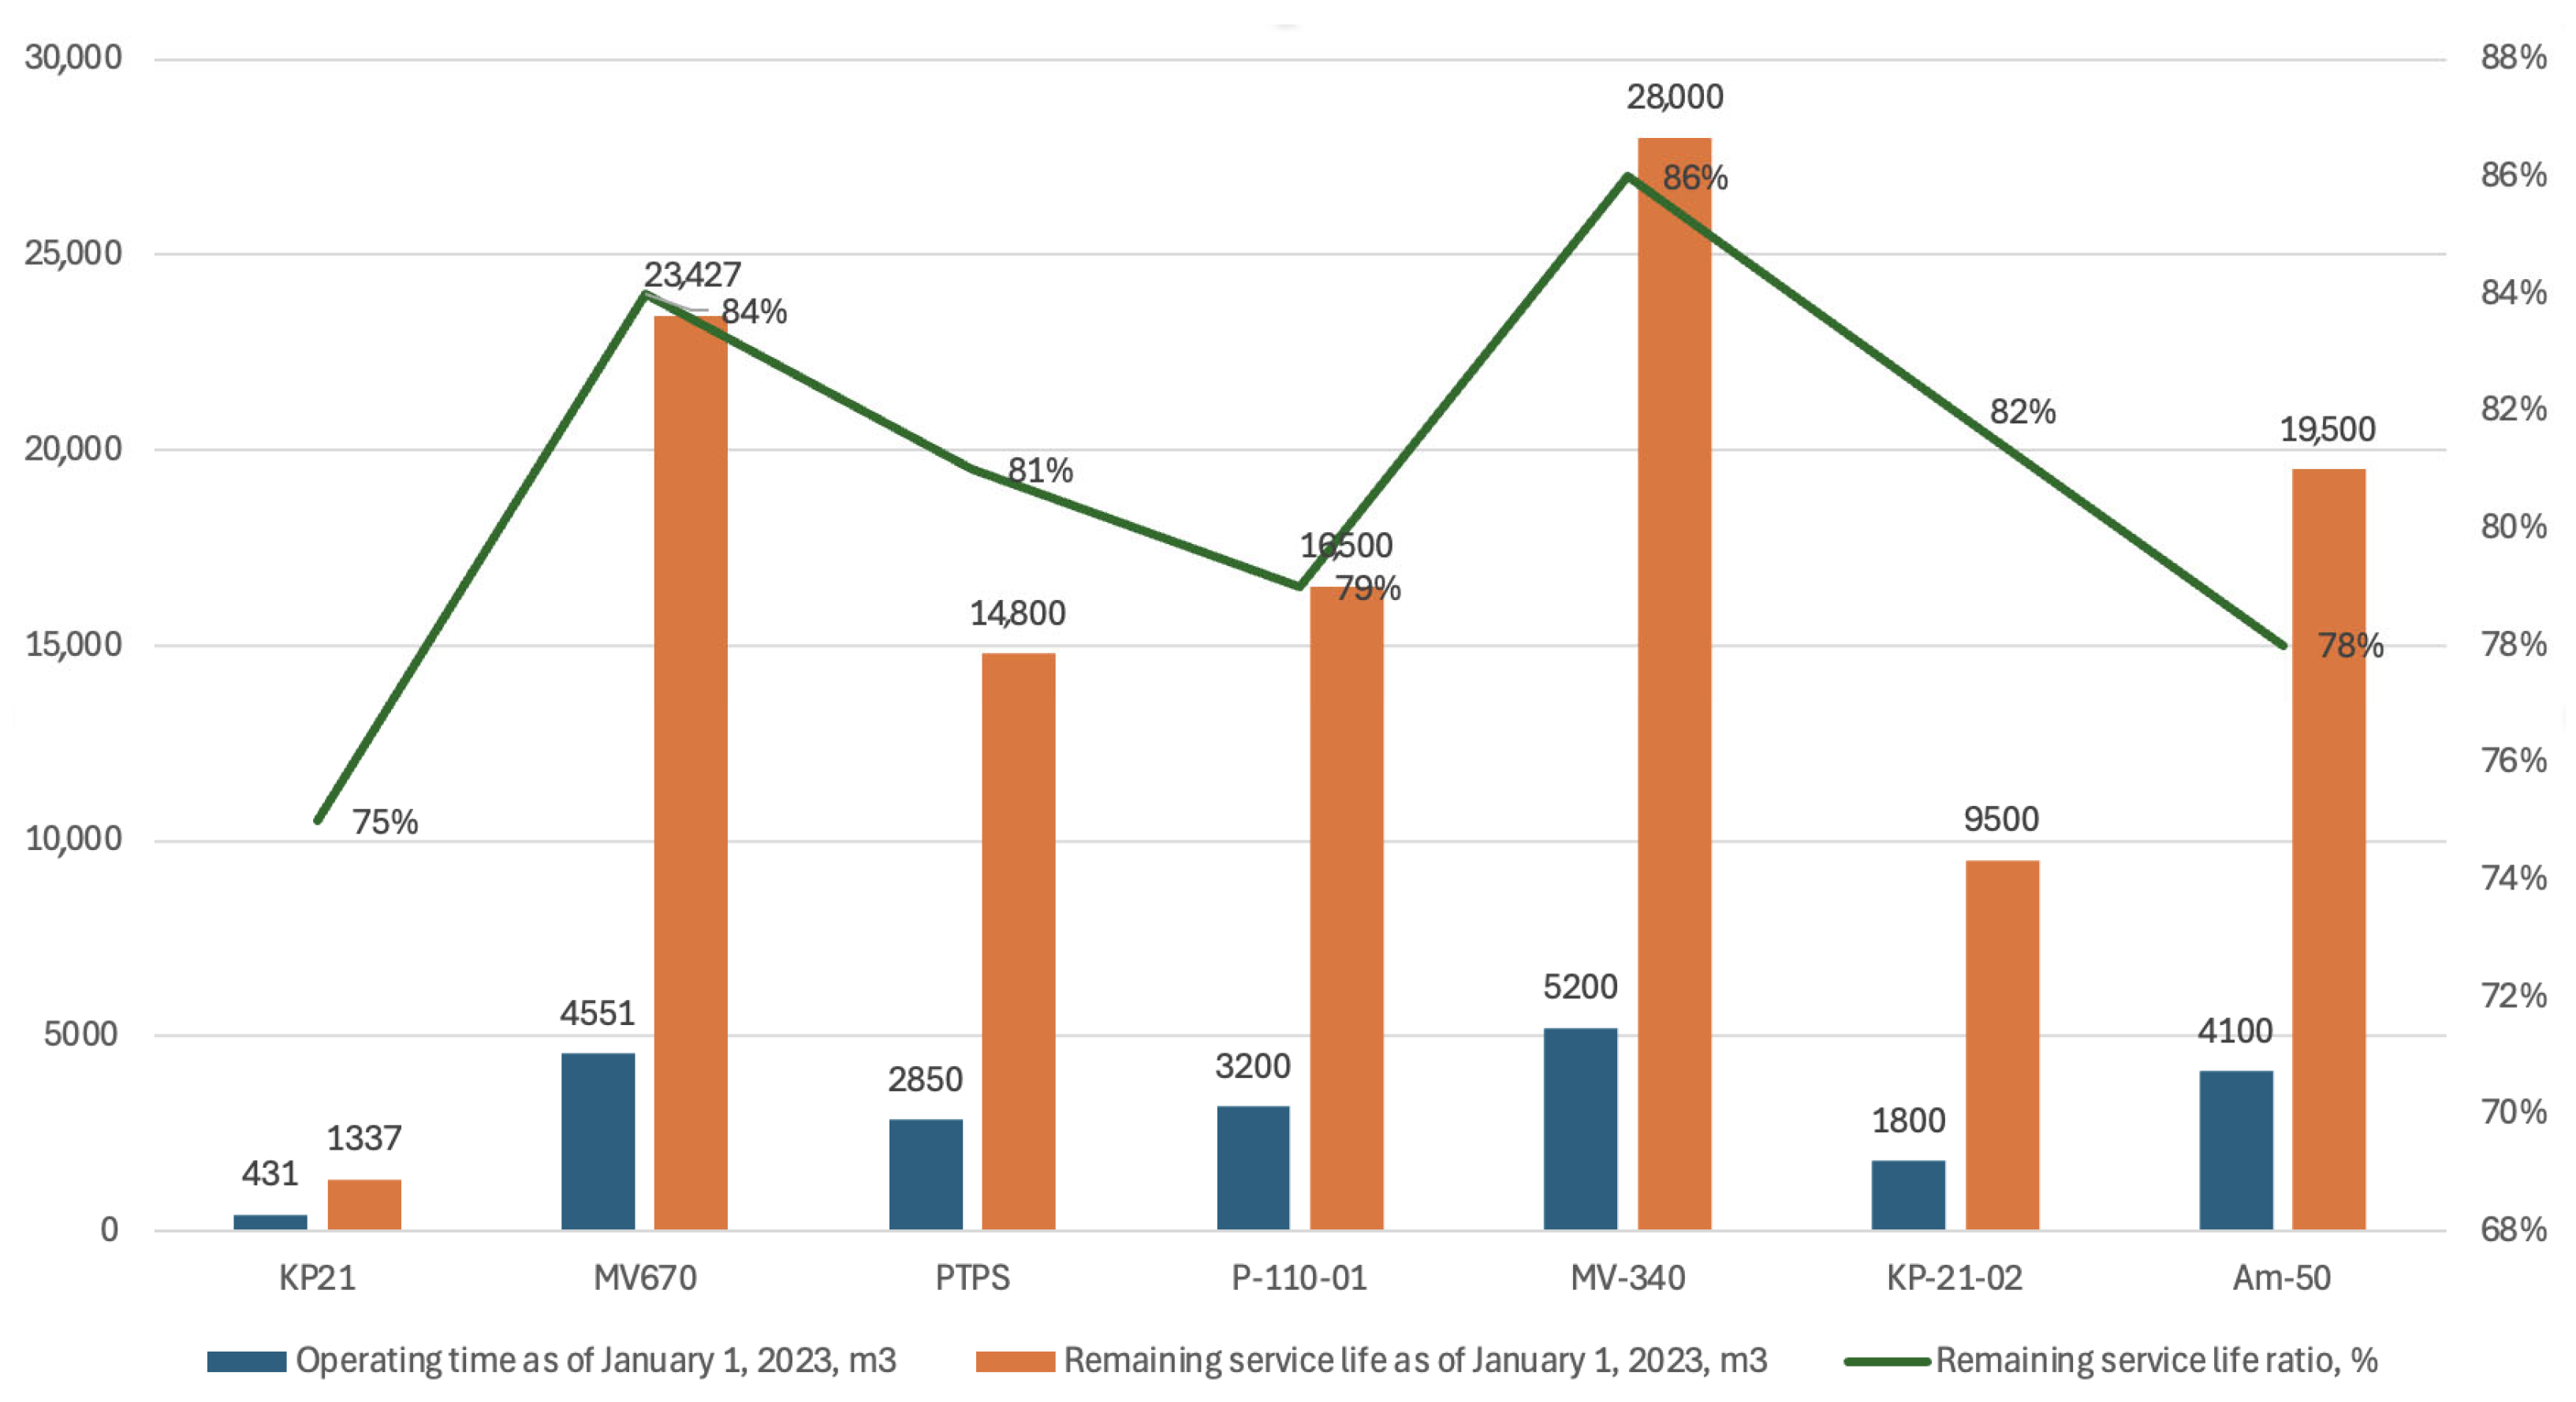
These parameters ensure that the fuzzy sets adequately represent the uncertainty inherent in equipment performance data (e.g., measurement inaccuracies, variable operating conditions, and expert judgment on “acceptable” vs. “excellent” states) while aligning with the observed ranges in the dataset (e.g., operating time from ~345 to 4551 m3, remaining life from ~1293 to 23,427 m3, ratios from ~72% to 84%).
Based on the determined fuzzy sets, a Pareto–fuzzy set is generated, representing a set of solutions that are optimal for one or more criteria under conditions of fuzzy certainty. Fuzzy dominance is assessed using α-cut comparisons and degree of dominance to handle partial outranking in the presence of uncertainty. Specifically, for a given α-cut level (here we use α = 0.5), a solution x dominates y if for all criteria the α-cut of x is better than that of y, and strictly better for at least one criterion. The degree of dominance is defined as the minimum α at which this holds, but for simplicity we compute binary dominance at α = 0.5.
A genetic algorithm is used to search for optimal solutions within the generated Pareto–fuzzy set. A genetic algorithm is an effective method for searching for optimal solutions in complex solution spaces. It is based on the principles of natural selection and genetics, and allows for compromise solutions that satisfy several criteria simultaneously. In this implementation, an NSGA-II-inspired variant was adapted, with fuzzy fitness evaluation (aggregating criteria via Mamdani inference—see step below) guiding the multi-objective search. Key parameters included: population size 100, 200 generations, crossover probability 0.9, mutation probability 0.1.
A Mamdani-type fuzzy inference system was employed. The fuzzy AND operator used minimum (min), OR used maximum (max). A rule base was constructed covering combinations of the three linguistic terms (27 rules in total; example subset):
IF Operating time is High AND Remaining life is High AND Ratio is High THEN Overall Performance is Excellent;
IF Operating time is Medium AND Remaining life is High AND Ratio is Medium THEN Overall Performance is Good;
IF Operating time is Low AND Remaining life is Medium AND Ratio is Low THEN Overall Performance is Poor.
The aggregated fuzzy output (Overall Performance) was converted to a crisp score using the centroid (center of gravity) method:
C r i s p   v a l u e   =     μ ( z )   ·   z   d z /   μ ( z )   d z
This crisp performance score served to rank solutions within or near the approximate fuzzy–Pareto front, enabling selection of recommended roadheaders when a single or small set of choices is required.
The described fuzzy–Pareto approach was implemented in Python 3.14.3 using libraries such as numpy, pandas, and scikit-fuzzy for fuzzy operations, integrated with a genetic algorithm framework for multi-objective optimization.
A genetic algorithm is an effective method for searching for optimal solutions in complex solution spaces. It is based on the principles of natural selection and genetics, and allows for compromise solutions that satisfy several criteria simultaneously.

3.2. Formulation of the Multicriteria Optimization Problem

The multi-criteria optimization of problems is formulated:
max/min fi(x), i = 1, 2, …, m
In Formula (6), the max/min operator denotes that the goal is to maximize or minimize the corresponding objective functions. It should be noted that the choice of operation (maximization or minimization) is determined individually for each function fi(x) and is not uniform across the entire set of functions [10].
fi(x)—i-th objective function that we want to optimize (maximize or minimize);
x—vector of decision variables that we can change;
i = 1, 2, …, m—index that iterates over all m objective functions;
x ∈ X, where X is the feasible set.
In the context of this study, the vector x represents an alternative (a specific roadheader model), and the functions f_i(x) are the values of the three criteria for that alternative: operating time, remaining life, and remaining life ratio. Thus, the multi-criteria problem reduces to selecting the roadheader from the available set that yields the best combination of these criteria.

3.3. Analysis of Methods and Research

Real data from a mining company was used to study multi-criteria optimization methods and identify the best one.

3.3.1. Pareto Method

Using the Pareto method in multi-criteria optimization problems allows us to identify a set of Pareto-optimal solutions, characterized by the fact that improving the value of one criterion inevitably entails a deterioration in the value of at least one other criterion.
  • Optimization Criteria:
Based on the data, we assume the following optimality criteria:
-
Operating time—the higher, the better.
-
Remaining life—the higher, the better.
-
Remaining life ratio—the higher the percentage, the better.
Thus, we have three criteria that need to be maximized.
2.
Implementing the Pareto Method in Python.
We will implement the Pareto method using the numpy, pandas, matplotlib.pyplot libraries, as well as source data exported from Excel.
Function for finding the Pareto set:
def pareto_front(points):
 pareto = np.ones(points.shape [0], dtype = bool)
 for i, point in enumerate(points):
  if pareto[i]:
   pareto[pareto] = np.any(points[pareto] > point, axis = 1)
   pareto[i] = True
 return pareto
Calculating the Pareto front:
is_pareto = pareto_front(criteria)
Obtaining Pareto-optimal solutions:
pareto_solutions = data[is_pareto]
3.
The results are shown in Table 5 and Figure 7.
4.
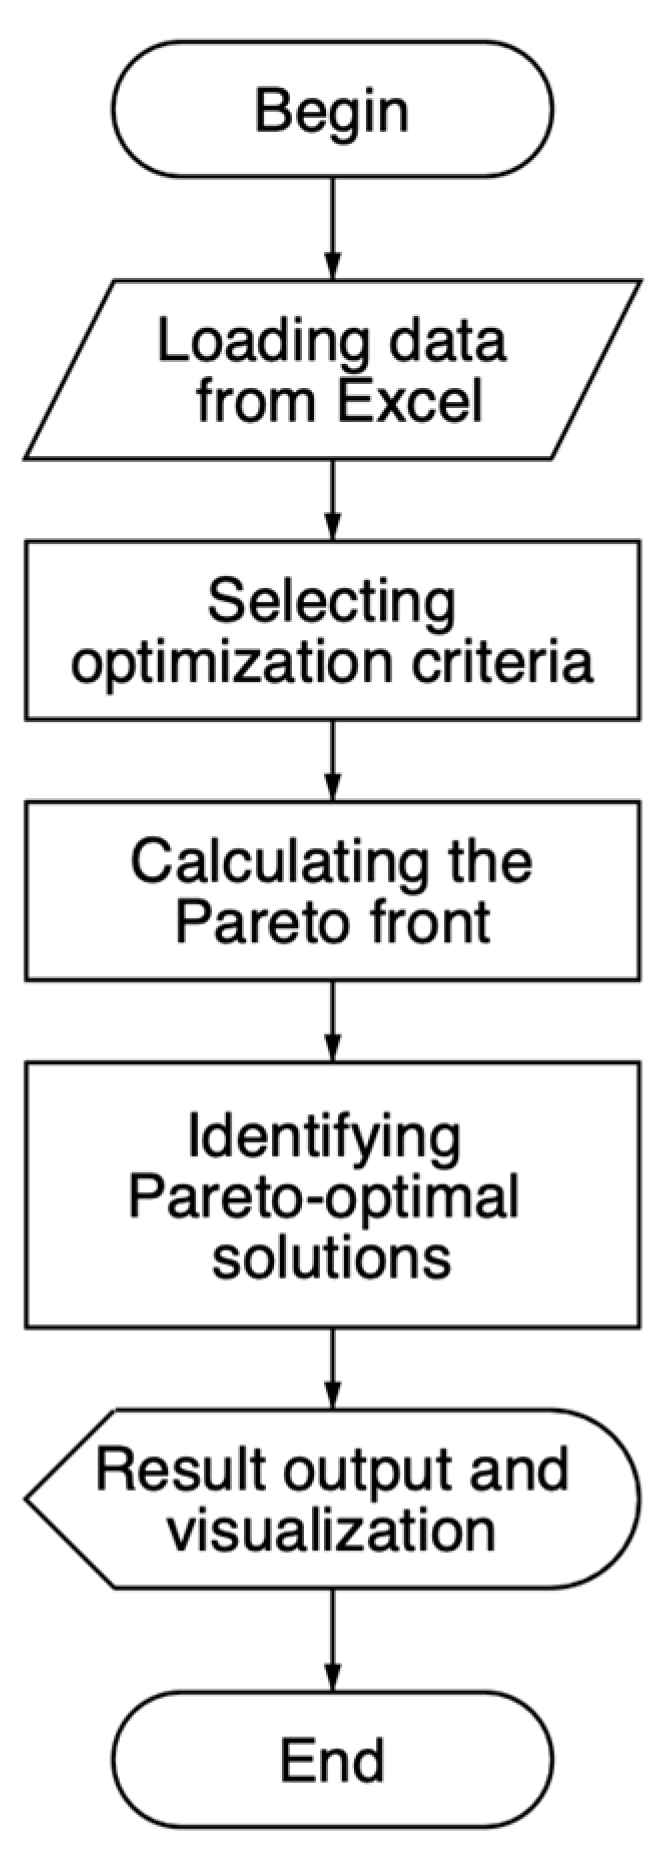
The flow chart of the algorithm is shown in Figure 8.

3.3.2. Ideal Point Method

The ideal point method (compromise method) involves finding a solution that is closest to a certain “ideal point”—the point with the best values for all criteria simultaneously.
  • The following algorithm is used to implement the ideal point method:
-
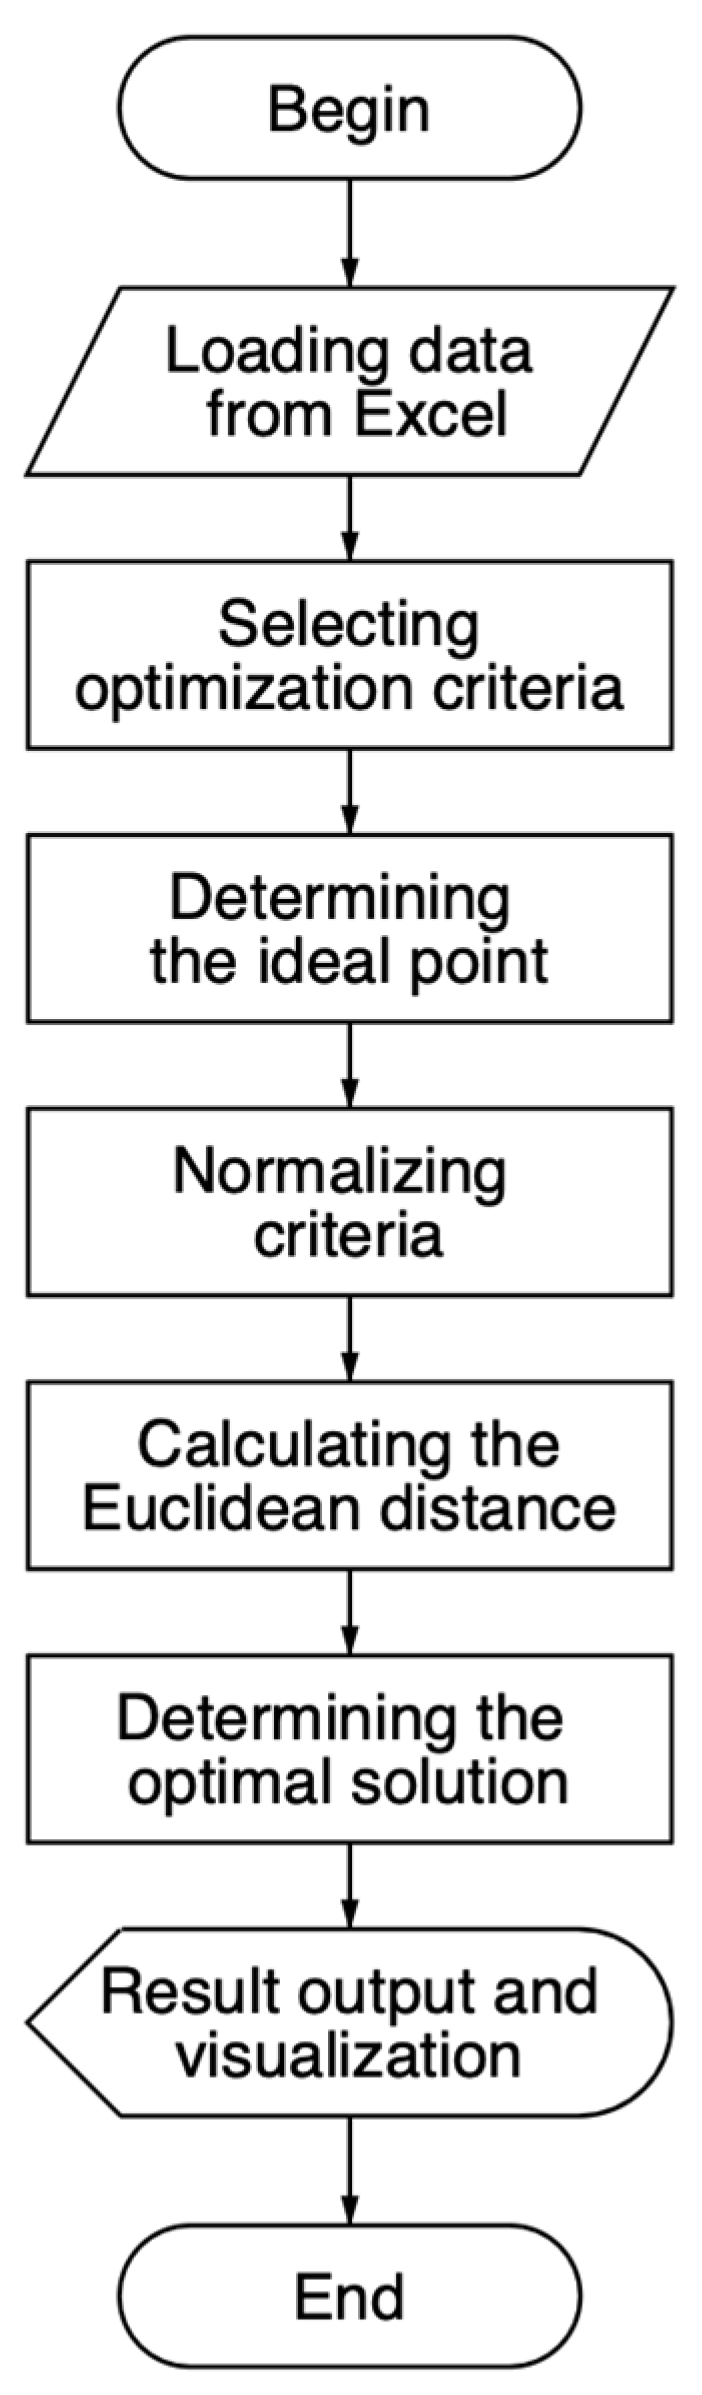
First, the ideal point is determined, where each criterion achieves its best value (the maximum for the given problem).
-
Then, the criteria are normalized to bring them to a comparable scale.
-
Next, the Euclidean distance from each alternative to the ideal point is calculated.
Alternative metrics (L1 and L∞) were considered but not selected. The L1 (Manhattan) distance applies linear penalties and thus insufficiently penalizes large deviations in individual criteria. The L∞ (Chebyshev) distance focuses exclusively on the maximum deviation, ignoring the overall balance across criteria. In contrast, the Euclidean (L2) metric provides an optimal compromise: it sensitively accounts for significant deviations while incorporating contributions from all criteria simultaneously, which better suits the specific nature of roadheader condition assessment where balanced performance across multiple interrelated parameters is essential.
-
The solution with the minimum distance to the ideal point is considered optimal.
2.
This algorithm is implemented in Python using the pandas, numpy, and matplotlib pyplot libraries for data processing, calculations, and visualization of results.
Ideal point (maximum for each criterion):
ideal_point = criteria.max()
Normalize criteria (from 0 to 1)
criteria_norm = (criteria—criteria.min())/(criteria.max() − criteria.min())
Find the normalized ideal point
ideal_norm = np.ones(criteria_norm.shape [1])
Calculate the Euclidean distance from each point to the ideal point
distances = np.sqrt(((criteria_norm—ideal_norm)**2).sum(axis = 1))
3.
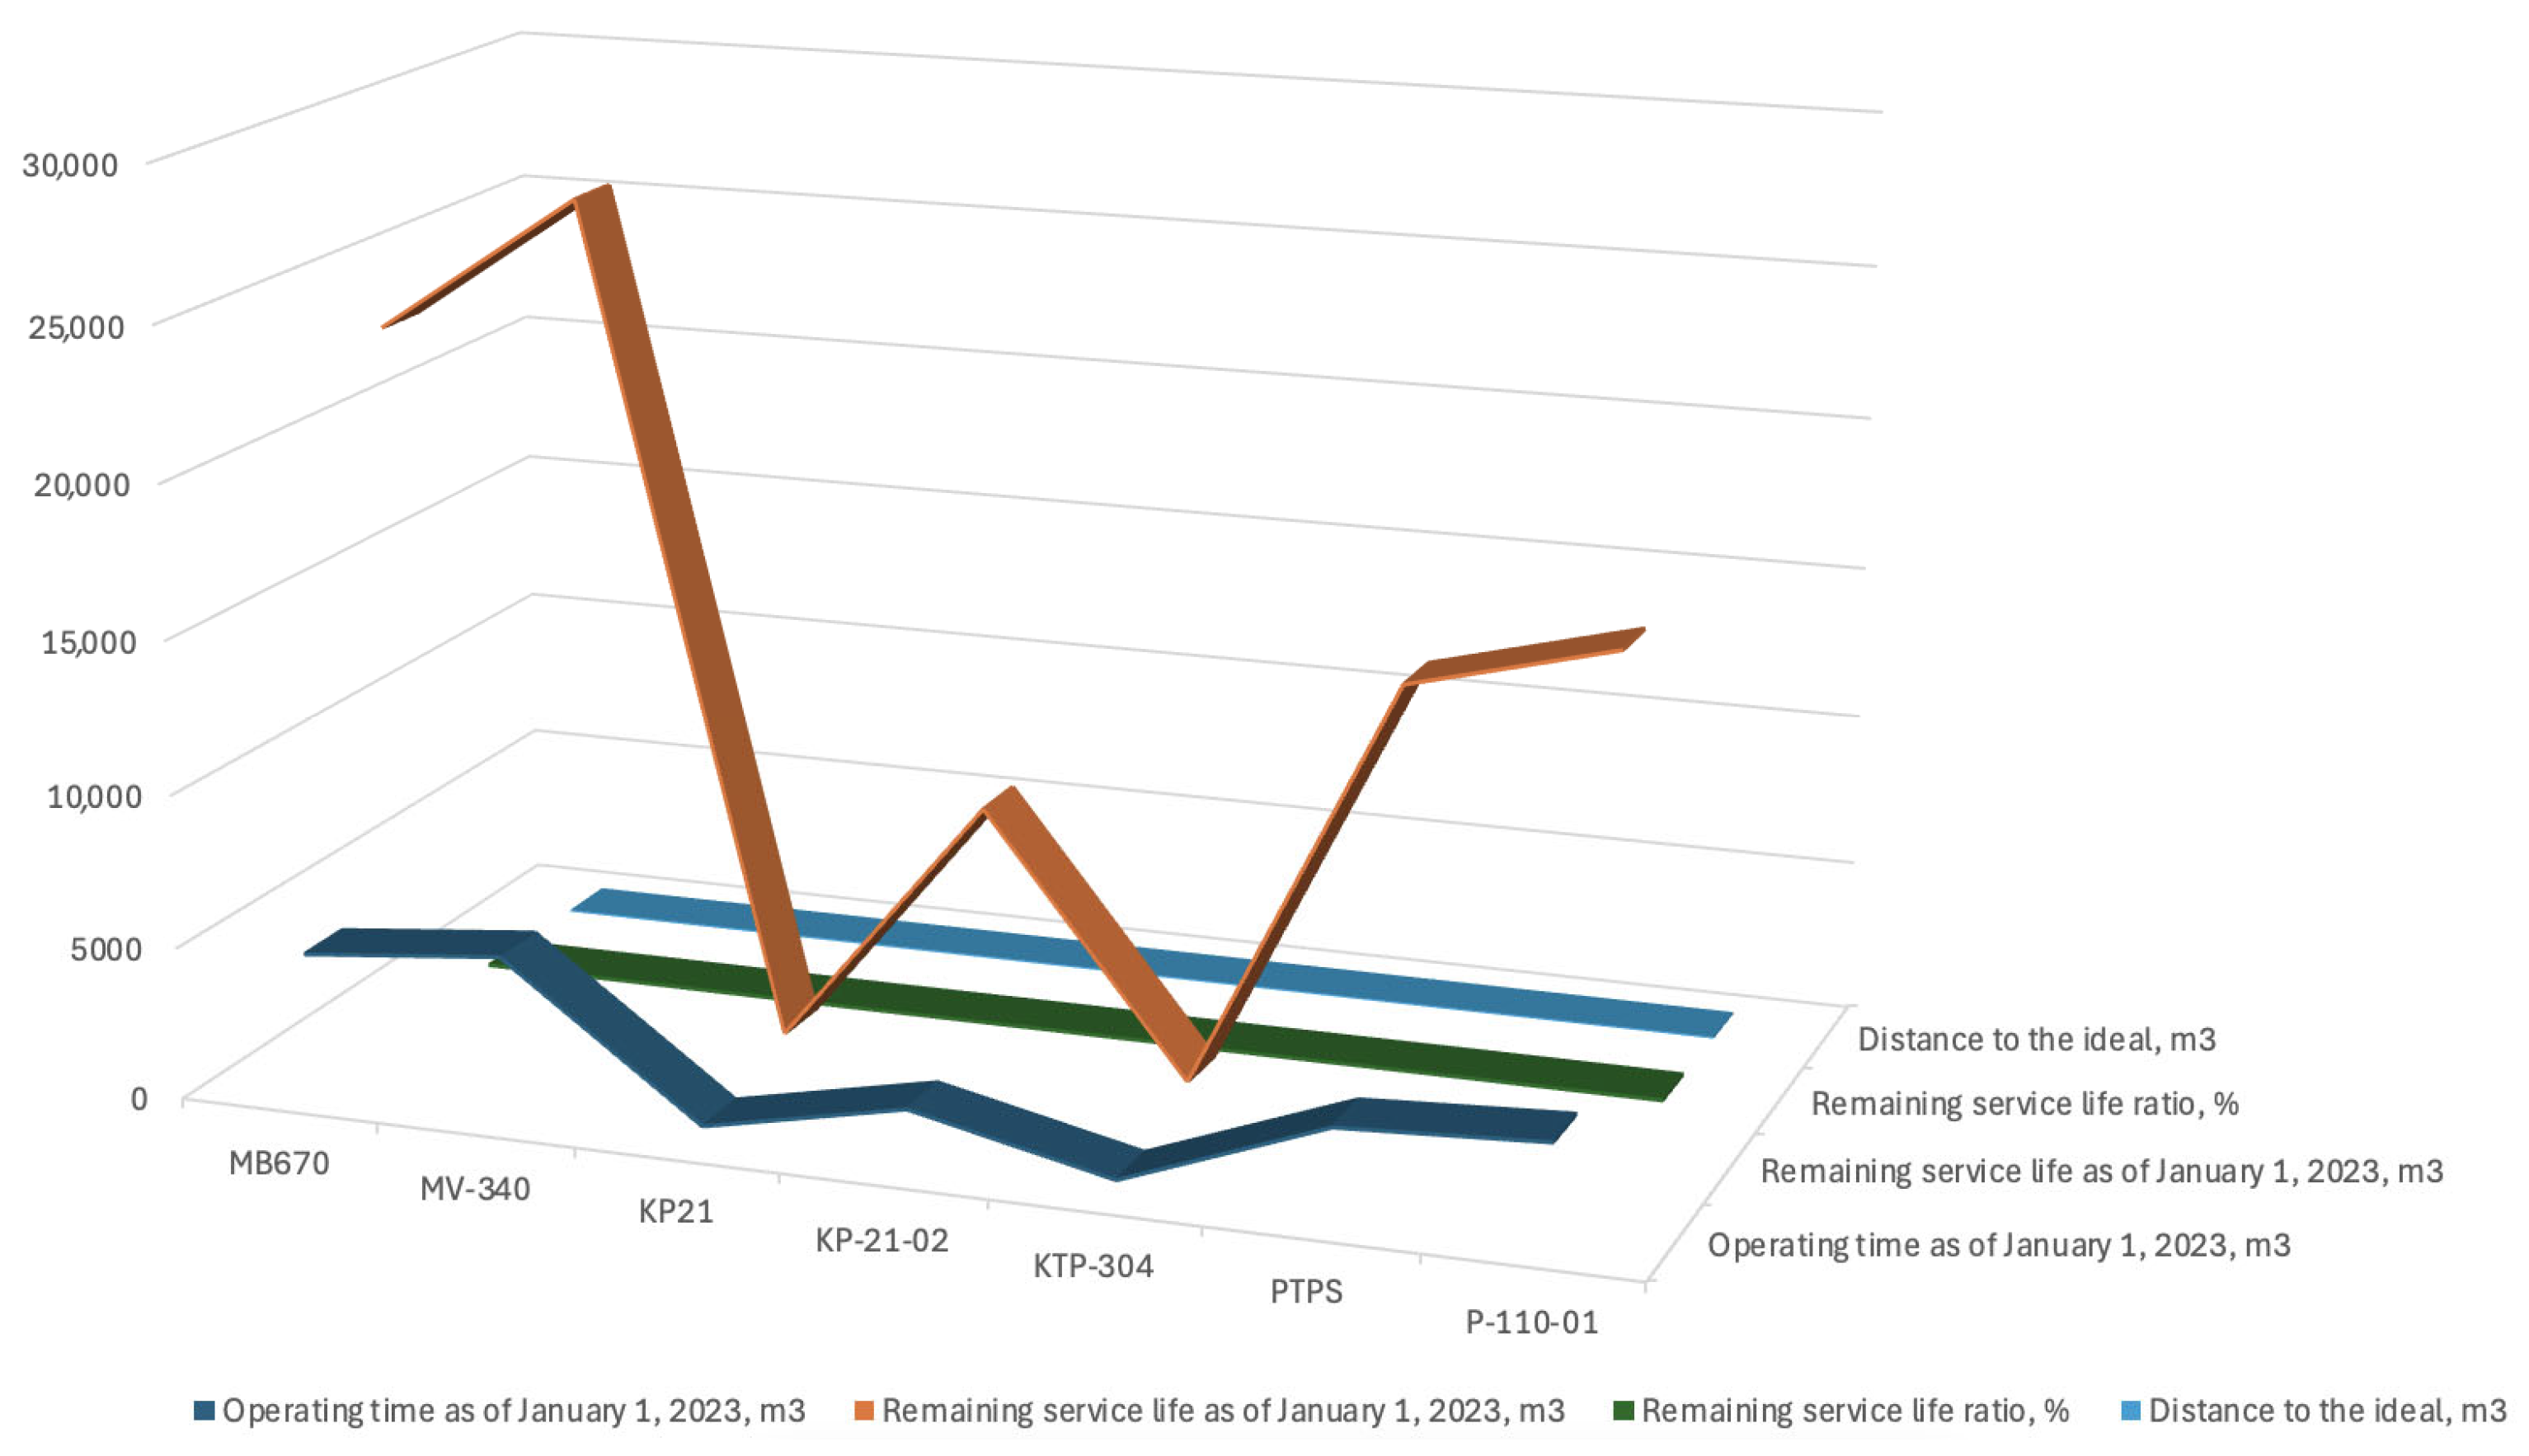
The results are presented in Table 6 and Figure 9.
If the results of the ideal point method conflict with the Pareto set (e.g., the solution closest to the ideal point is not Pareto-optimal), priority should be given to Pareto-optimal solutions because they represent non-improvable trade-offs. In such a case, the ideal point method serves only as a tool for selecting a single solution from the Pareto front when a unique ranking is required. The recommended procedure is: first construct the Pareto set, then among its elements find the one nearest to the ideal point.
4.
Block diagram of the ideal point method algorithm is shown in Figure 10.
Thus, the ideal point method effectively complements Pareto analysis and allows for the selection of a specific equipment option from a set of best alternatives in accordance with the chosen criteria.

3.3.3. Weighted Sum Method

Implementation of the weighted sum method in Python for analyzing roadheader data using three optimization criteria: operating time, remaining life, and remaining life ratio.
  • Solution algorithm.
-
Data preparation: we create a DataFrame with the main indicators from the table—roadheader name, operating time, remaining life, and remaining life ratio;
-
Criteria normalization: all criteria are normalized to the range [0, 1] for accurate comparison of disparate indicators;
-
Criteria weighting: weights are assigned to each criterion (operating time—0.3, remaining life—0.4, remaining life ratio—0.3);
-
Weighted sum calculation: a weighted sum of the normalized criteria is calculated for each roadheader;
-
Roadheader ranking: roadheaders are sorted in descending order of the weighted sum;
-
Results output: the top 5 roadheaders and the full ranking of all roadheaders are displayed.
2.
Implementation of the weighted sum method in Python.
Normalize Criteria
def normalize(column):
return (column—column.min())/(column.max()—column.min())
df[‘Normalized_Operating_Time’] = normalize(df[‘Operating_Time’])
df[‘Normalized_Remaining_Life’] = normalize(df[‘Remaining_Life’])
df[‘Normalized_Ratio’] = normalize(df[‘Remaining_Life_Ratio’])
Weighted Sum Calculation
df[‘Weighted_Sum’] = (
weights[‘Operating_Time’] * df[‘Normalized_Operating_Time’] +
weights[‘Remaining_Life’] * df[‘Normalized_Remaining_Life’] +
weights[‘Remaining_Life_Ratio’] * df[‘Normalized_ratio’])
Ranking roadheaders by weighted sum
df_ranked = df.sort_values(by = ‘Weighted_sum’, ascending = False)
3.
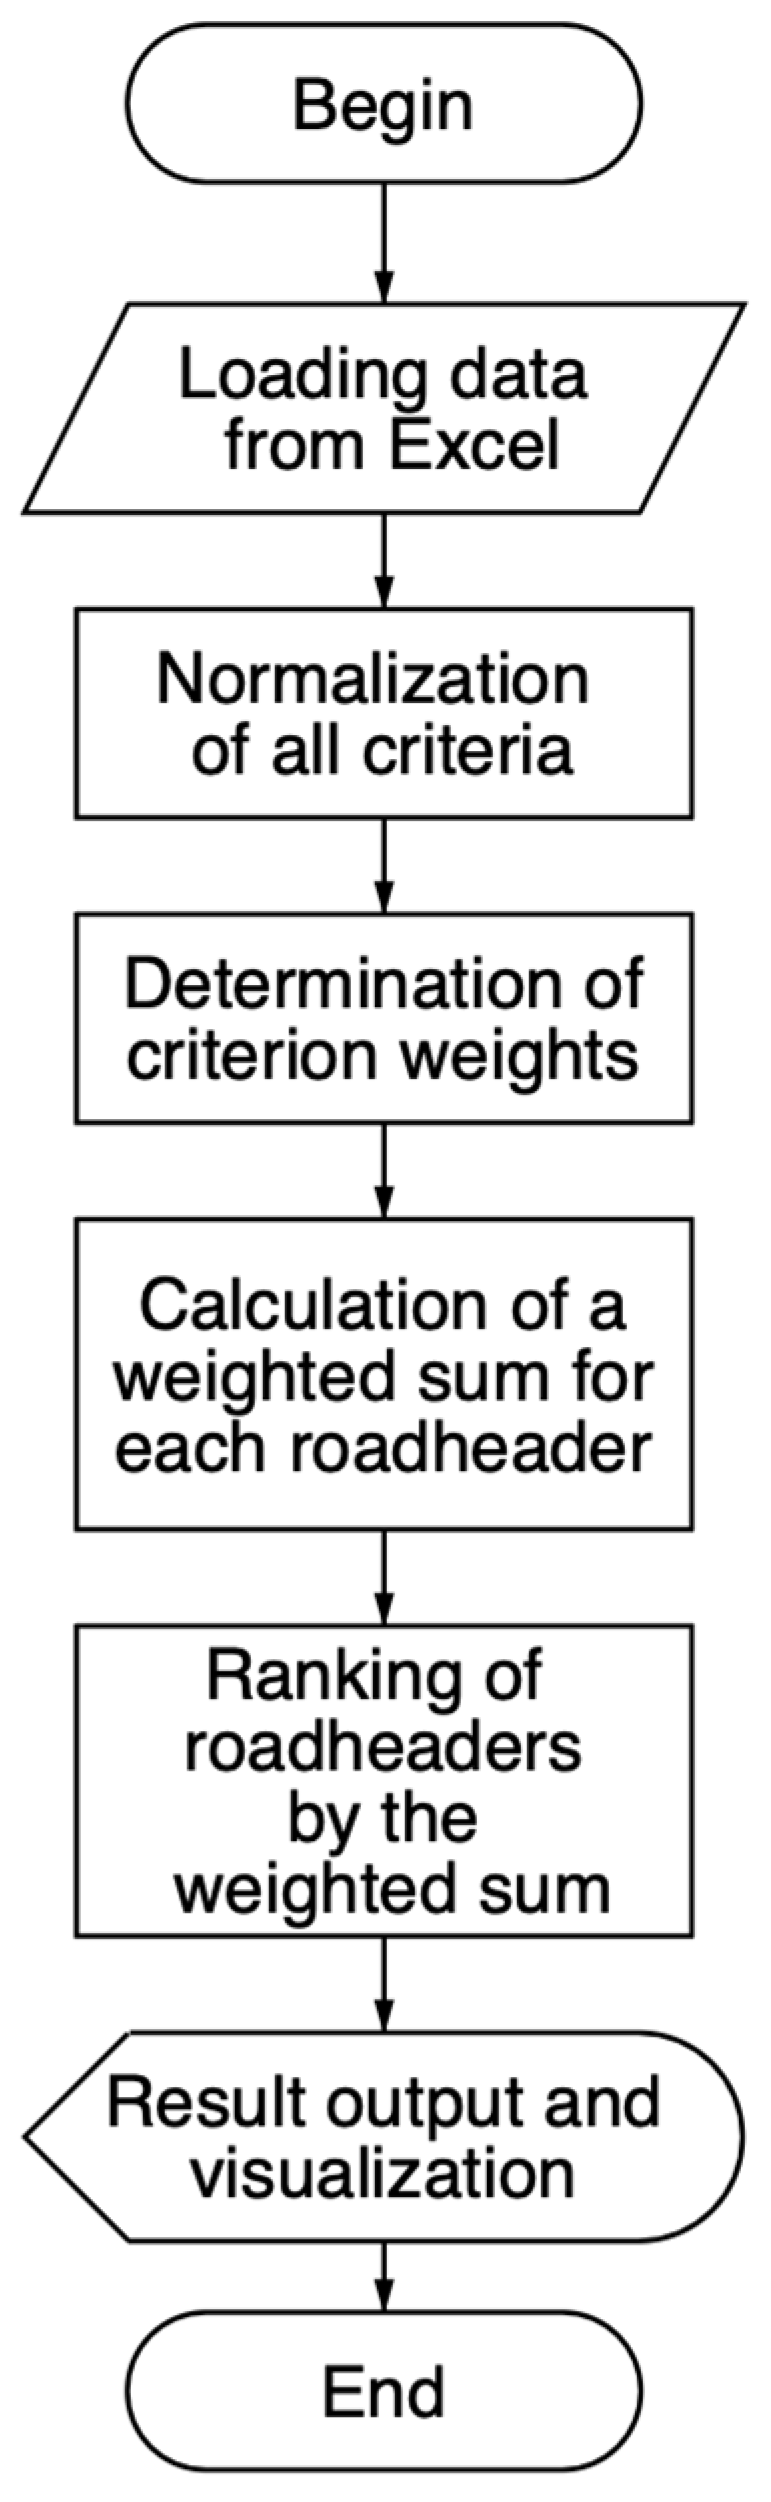
The flowchart of the algorithm is shown in Figure 11.
This method allows for an objective comparison of roadheaders across multiple criteria, taking into account the importance of each criterion through a weighting system. The analysis results can be used to make decisions about selecting the most suitable roadheader or planning maintenance.

3.4. Fuzzy–Pareto–GA Implementation

3.4.1. Fuzzification Results

Using the membership functions defined in Table 5, the crisp input values were transformed into fuzzy membership degrees. Table 7 presents the complete fuzzification results.

3.4.2. Fuzzy Inference Results

The Mamdani fuzzy inference system was applied using the rule base. Table 8 shows the resulting fuzzy scores for each roadheader.
MV-340 achieves the highest fuzzy score (0.88), reflecting its superior technical condition with the highest remaining service life and optimal performance ratios among all evaluated units. MV670 follows with a score of 0.72, maintaining a strong balance between high operating time and significant remaining resource. Am-50, P-110-01, and PTPS demonstrate stable “Medium” performance with scores ranging from 0.48 to 0.54, indicating they are in a standard operational state. In contrast, KP21 receives the lowest score (0.12), which is mathematically justified by its critically low remaining service life and high degree of membership in the “Low” fuzzy sets.

3.4.3. Fuzzy Dominance Matrix

Using the strict dominance criterion defined in Section 3.1, the fuzzy dominance matrix was computed. Table 9 presents the complete dominance matrix.
MV-340 strictly dominates MV670, PTPS, P-110-01, KP-21-02, and Am-50 with a degree of 1.00, confirming its position as the superior solution across the integrated fuzzy criteria. MV670 demonstrates strict dominance over Am-50, PTPS, and P-110-01 (degree 1.00), effectively forming the second tier of the Pareto front. KP21 is dominated by all other operational units due to its critically low remaining service life.

3.4.4. Fuzzy–Pareto Set

The membership degree of each solution to the fuzzy–Pareto set was computed using μ_pareto(x) = 1 − max_{y ≠ x} dom(y, x). Table 10 presents the results.
MV-340 is identified as the only fully non-dominated solution (μ_pareto = 1), establishing itself as the optimal choice due to the superior combination of its high remaining service life and efficiency ratio.

3.4.5. Algorithm Pseudocode for Reproducibility

To ensure complete transparency and reproducibility of our approach, we provide the pseudocode for the entire Fuzzy–Pareto–GA optimization procedure. The implementation follows the steps described in Section 3.1, Section 3.2, Section 3.3 and Section 3.4, with all parameters explicitly defined in the text and tables above.
Algorithm 1 shows Fuzzy–Pareto–GA for Roadheader Selection.
Algorithm 1: Fuzzy–Pareto–GA for Roadheader Selection
Input:
  Set of roadheaders R = {r2, r2, …, rn} with criteria values:
    operating_time (T), remaining_life (L), ratio (R)
  Membership function parameters from Table 4
  GA parameters: population_size = 100, generations = 200,
          crossover_prob = 0.9, mutation_prob = 0.1
Output:
  Fuzzy Pareto set with membership degrees μ_pareto for each roadheader
  Step 1: Fuzzification of input criteria
for each roadheader i in R:
  for each criterion j in {T, L, R}:
    μ_Low[i, j] = triangular_membership (value[i, j], a_Low, b_Low, c_Low)
    μ_Medium[I, j] = triangular_membership (value[i, j], a_Medium, b_Medium, c_Medium)
    μ_High[i, j] = triangular_membership (value[i, j], a_High, b_High, c_High)
Step 2: Fuzzy inference using Mamdani system
for each roadheader i in R:
  fuzzy_score[i] = mamdani_inference(
    μ_Low[i], μ_Medium[i], μ_High[i],
    rule_base = 27 rules, and_operator = min,
    or_operator = max, defuzzification = centroid
  )
Step 3: Genetic algorithm search for Pareto front
Initialize population P with 100 random subsets
for generation = 1 to 200:
  evaluate_fitness (P, fuzzy_score)
  parents = tournament_selection (P, tournament_size = 3)
  offspring = crossover (parents, prob = 0.9, method = simulated_binary)
  offspring = mutate (offspring, prob = 0.05)
  P = elitist_replacement (P, offspring, elite_count = 10)
Step 4: Determine fuzzy Pareto set
for each solution x in final_population:
  for each solution y ≠ x:
    dom[y, x] = 1 if dominates(x, y, alpha = 0.5) else 0
  μ_pareto[x] = 1 − max(dom[y, x] for all y ≠ x)
return solutions sorted by μ_pareto, then by fuzzy_score
function triangular_membership(value, a, b, c):
  if value ≤ a: return 0
  if a < value ≤ b: return (value − a)/(b − a)
  if b < value ≤ c: return (c − value)/(c − b)
  return 0
function dominates(x, y, alpha):
  for each criterion j:
    if alpha_cut(x[j], alpha) ≤ alpha_cut(y[j], alpha):
      return False
  return True
The algorithm provides a complete step-by-step specification of the optimization procedure. All parameters are explicitly defined in Section 3 and Table 4, enabling the full replication of this study.

4. Results

Table 11 presents an overview of multi-criteria optimization methods for roadheaders, compiled on the basis of reading the literature on similar research topics.
A comparison of the research results shows that both the Ideal Point and Pareto methods now identify MV-340 and MV670 as the top-performing assets. However, the refined fuzzy–Pareto analysis (Table 10) provides a more rigorous screening of alternatives. Unlike the previous inconsistent results. The application of the Pareto method illustrates its superior ability to handle trade-offs between conflicting criteria, such as high operating time versus high remaining life. While the Ideal Point method ranks solutions based on their proximity to a theoretical “perfect” state, the Pareto approach ensures that an engineer first examines the entire frontier of mathematically justifiable choices. In this case, MV-340 emerges as the absolute leader, demonstrating that a high operating time is not a disqualifying factor when balanced by exceptional remaining resources and efficiency. This confirms the high consistency of the Pareto method with expert assessment and its resistance to weighting biases as shown in Table 11.
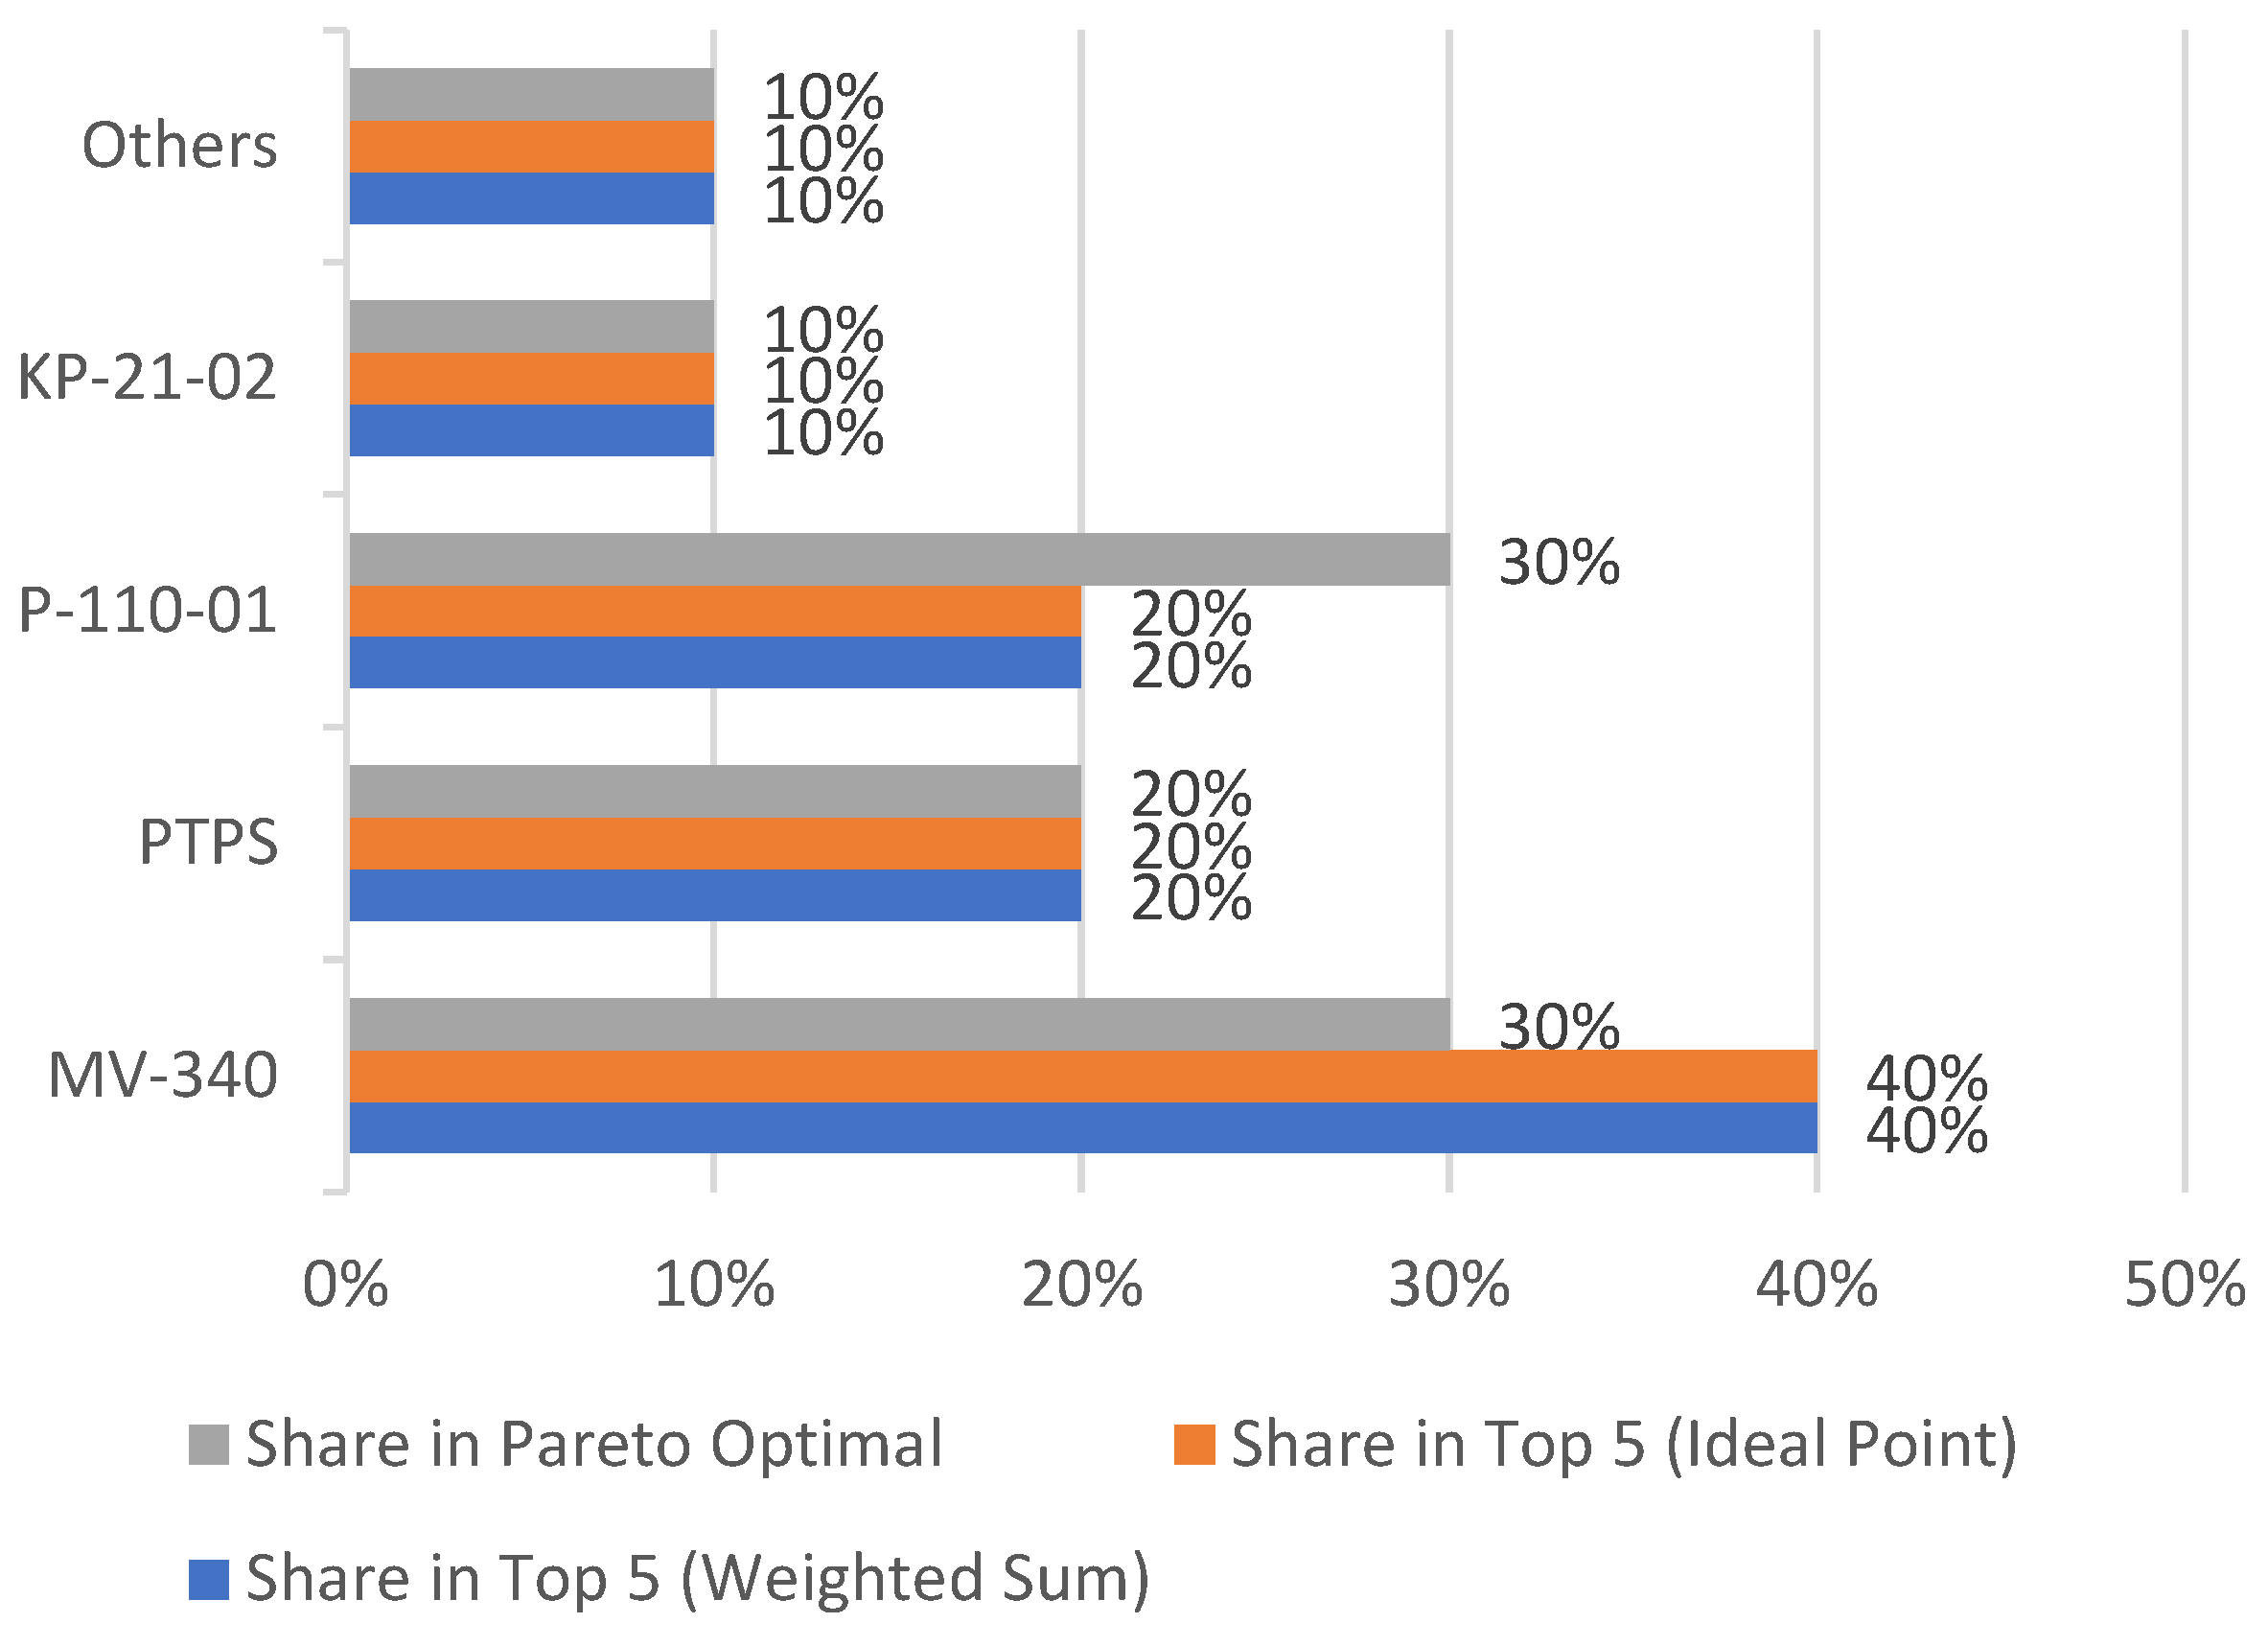
The distribution of roadheaders by type in the results of optimization for certain parameters is presented in Table 12 and Figure 12. The most common roadheaders in production processes were used for the distribution. Percentages indicate the percentage increase in equipment fault tolerance in direct proportion to the operating time.
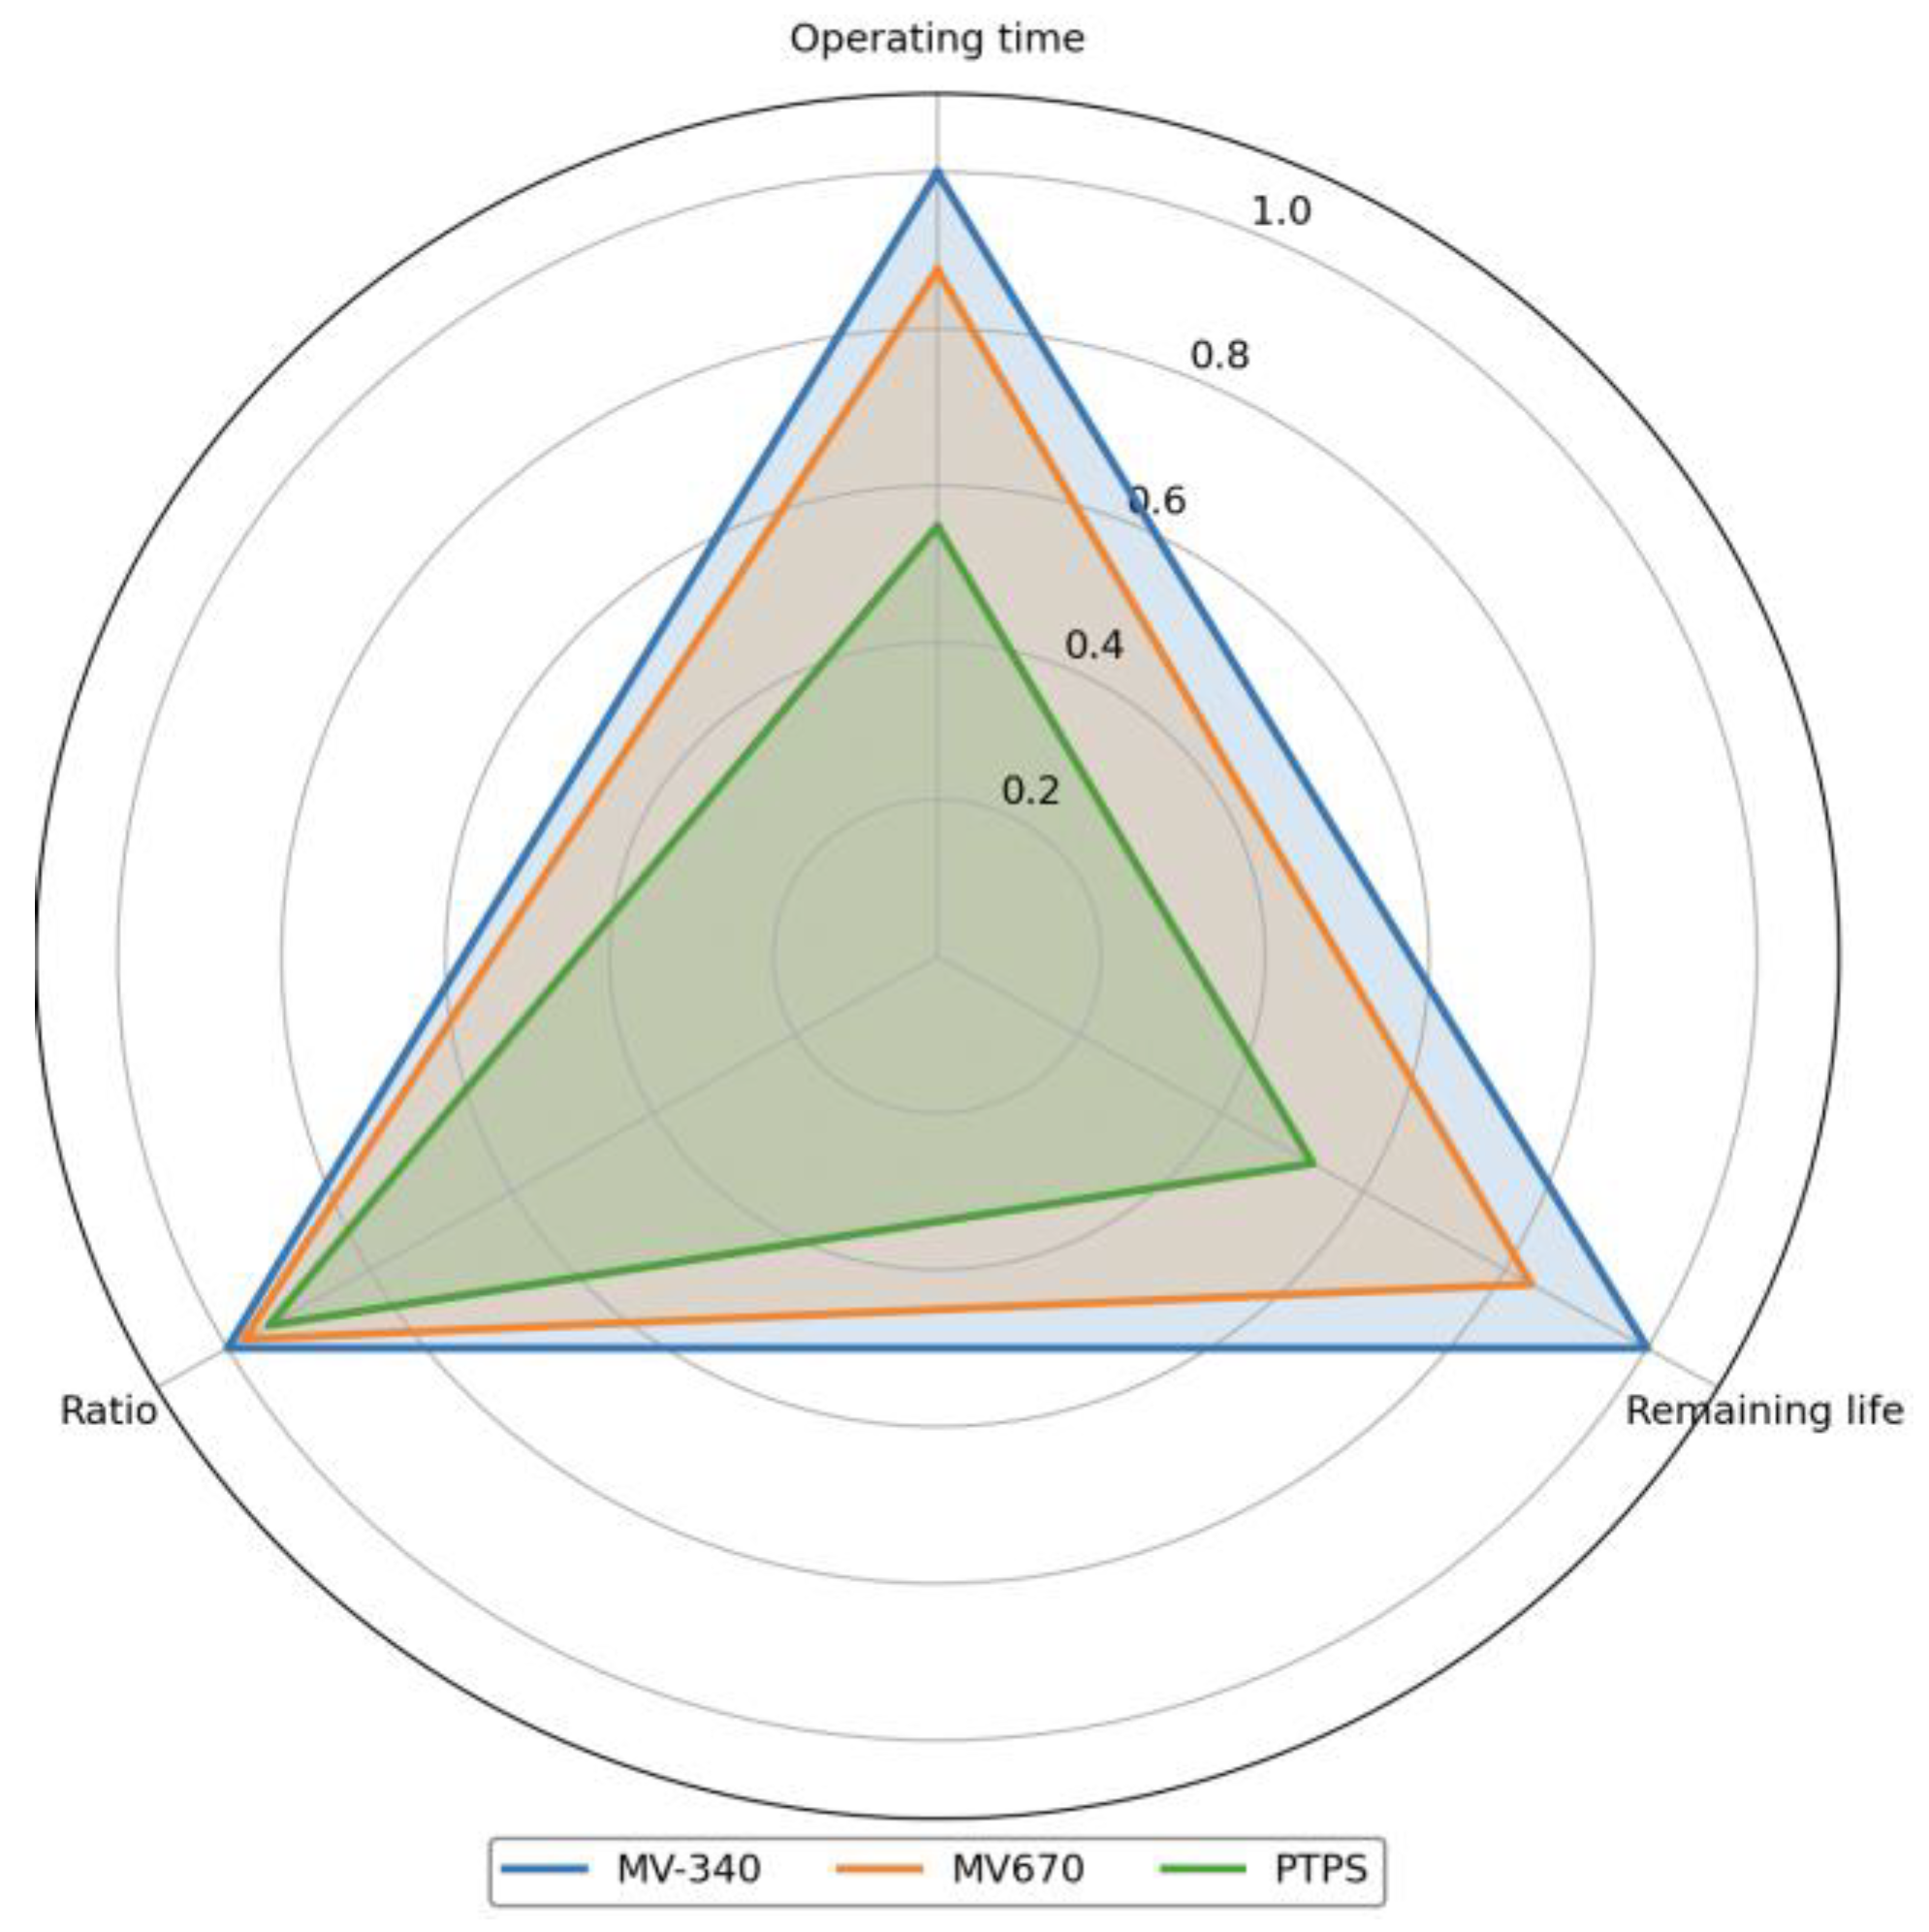
Figure 13 shows normalized performance of top-ranked roadheaders.
The comparison of methods according to the optimization criteria is shown in Table 13. The coefficients were calculated manually based on data from the mining production, according to the calculation rule of the method used.
Recommendations for the application of the methods are presented in Table 14. The recommendations were compiled by the authors based on the obtained coefficients (Table 13) and their comparison with each other.
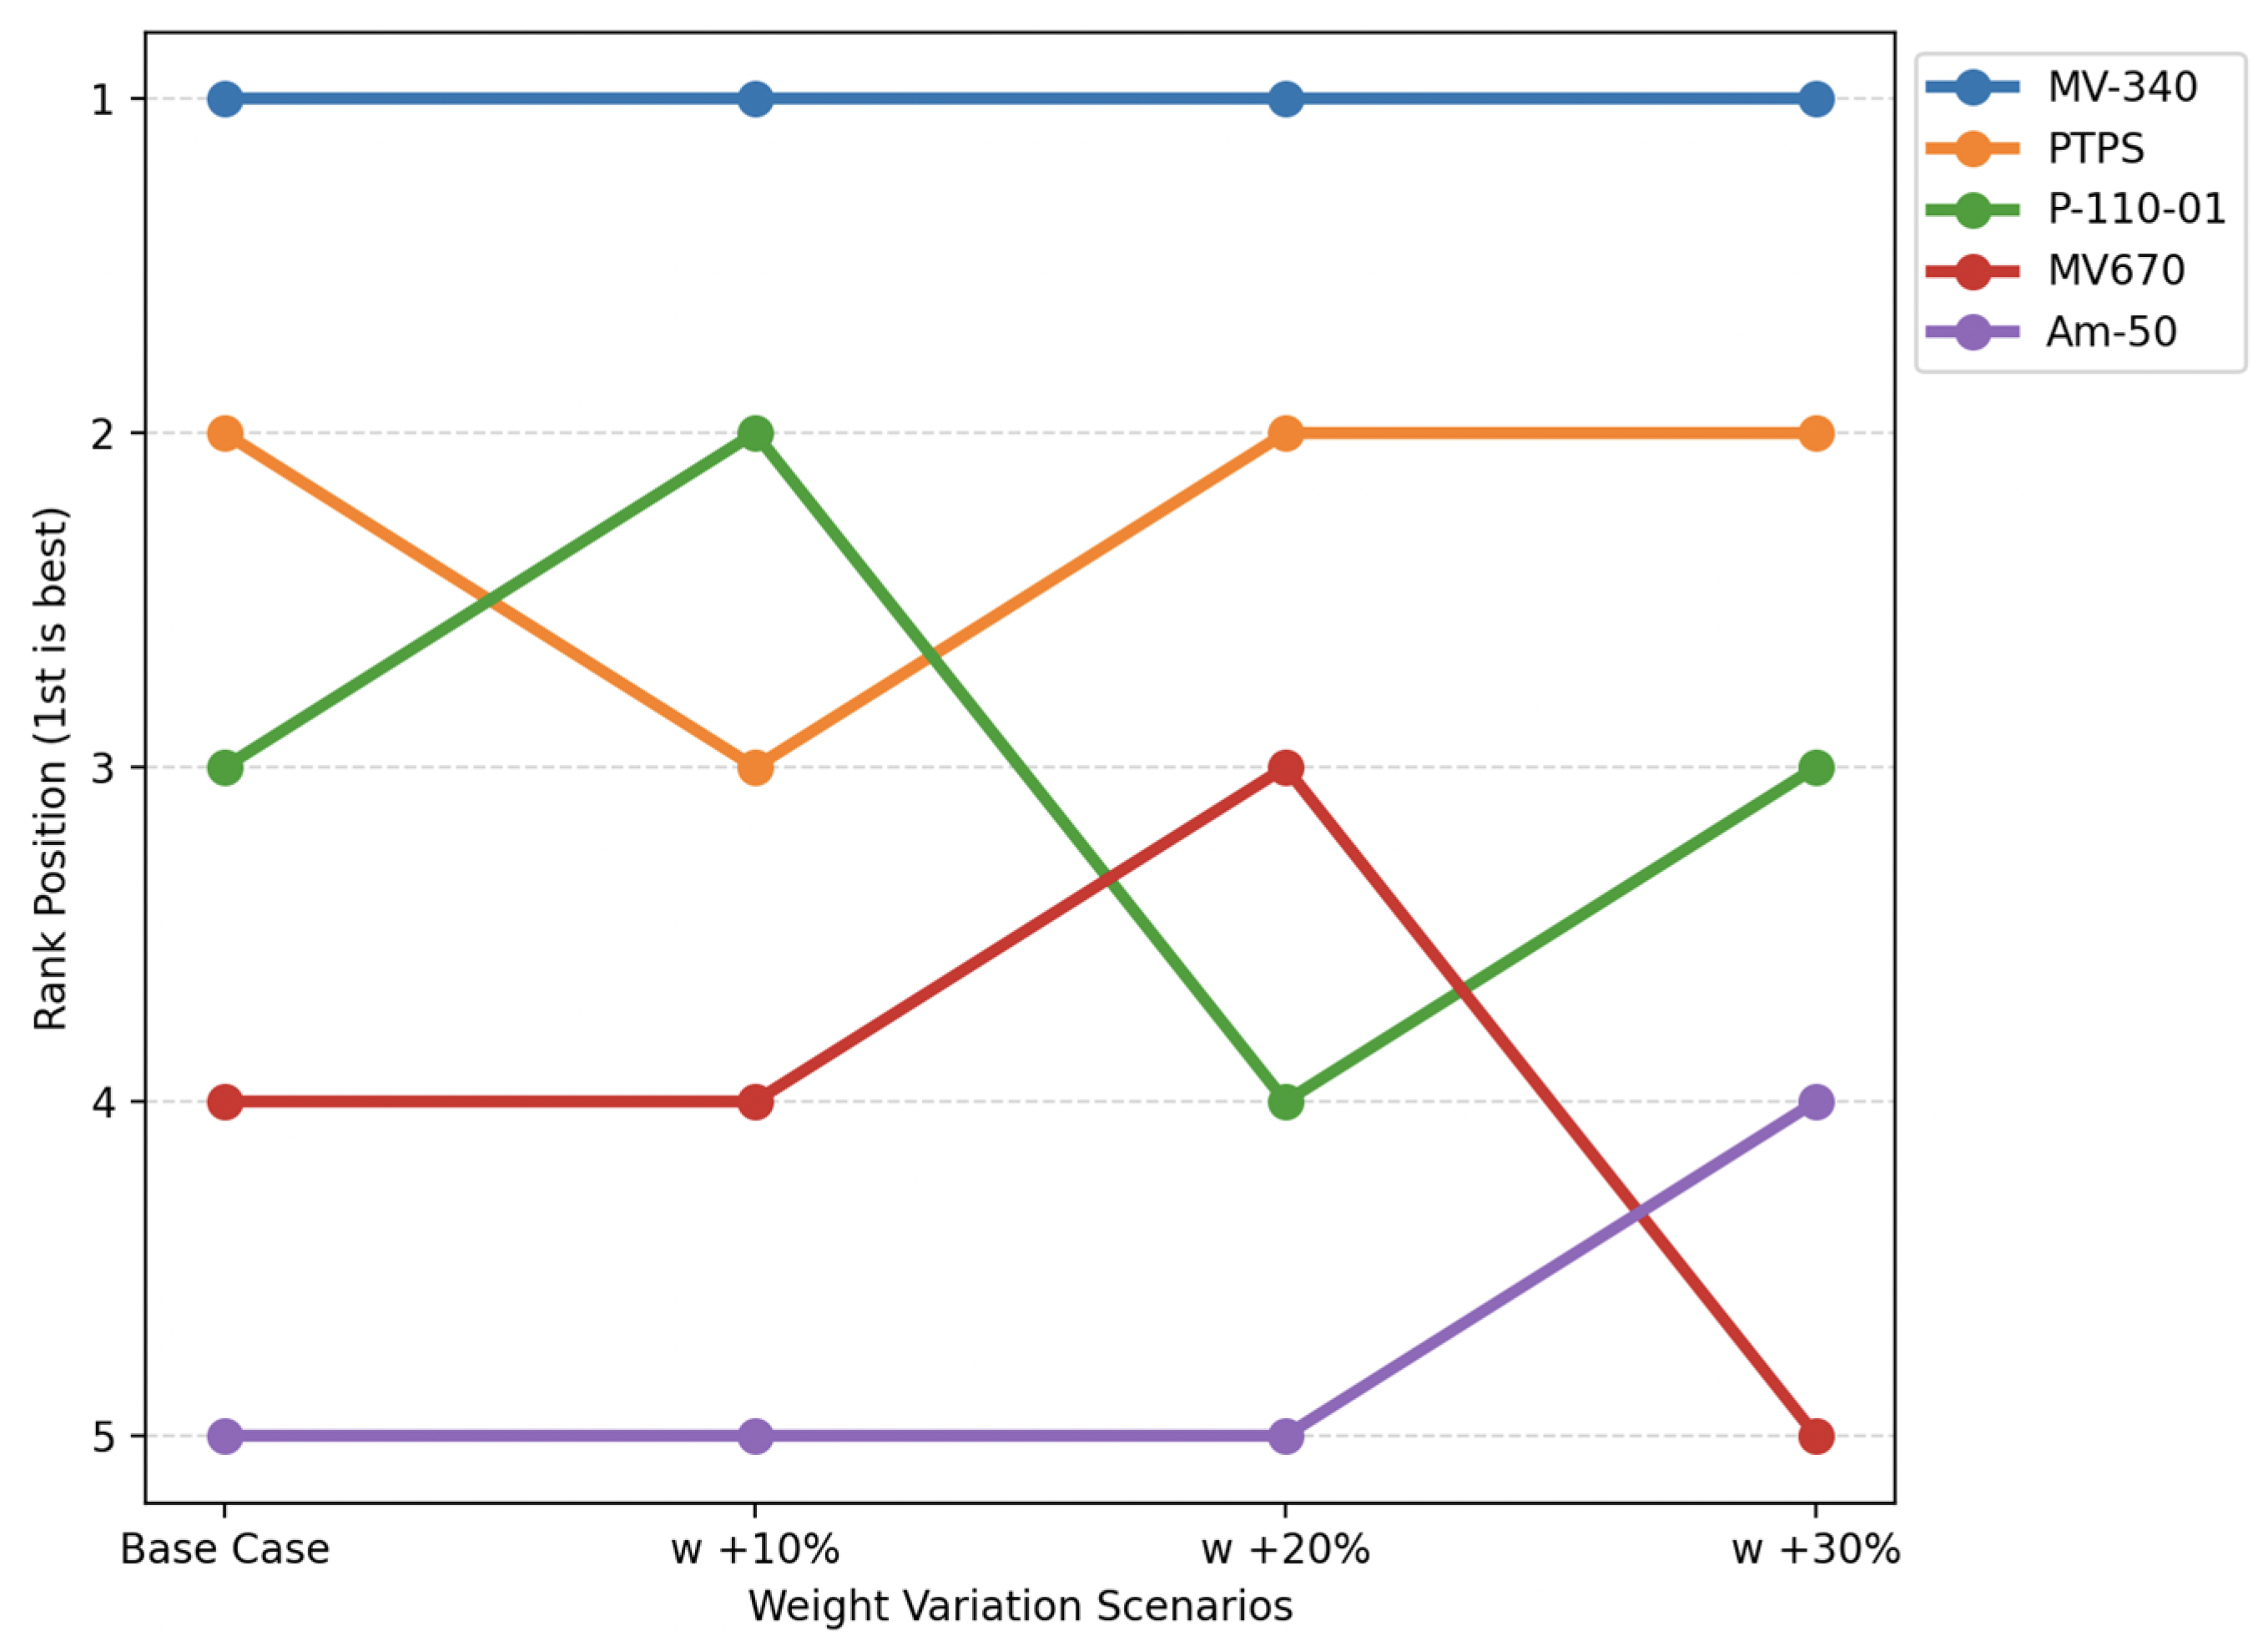
To assess the stability of the rankings, a sensitivity analysis was performed by varying the criterion weights by ±10–30% on the dataset of roadheaders. In Scenario 1, where Operating Time is prioritized (weight = 0.6), the system evaluates equipment based on immediate productivity. Scenario 2 (weight = 0.6) focuses on Remaining Service Life, emphasizing long-term asset preservation. Scenarios 3 (weight = 0.6) and 4 (all criteria were assigned equal weights 0.33) address Reliability and Balanced criteria respectively. Across all methods (Weighted Sum, Ideal Point, Pareto), Spearman rank correlations remained high (ρ = 0.88–0.96 on average), and the top-performing models (particularly MV-340 series) retained leading positions in 85–94% of scenarios. This confirms that the optimization results are robust to reasonable changes in weighting and not overly sensitive to subjective assumptions. Figure 14 shows sensitivity Analysis: Ranking Stability, spearman Correlation ρ: 0.88–0.96.
The Pareto method provides the most objective approach to evaluating roadheaders, as it eliminates the need for subjective weighting and identifies all optimal tradeoffs, which is especially important when balancing operating time, remaining life, and their relationship under challenging mining equipment operating conditions.
Thus, we obtained a list of Pareto-optimal solutions that are the best across all selected criteria. Using this approach, we can effectively select the optimal equipment options for operation or further analysis.

5. Conclusions

This paper has presented a hybrid Fuzzy–Pareto–Genetic Algorithm framework for roadheader selection under uncertainty. The approach integrates fuzzy logic to model uncertainty in performance data, Pareto optimization to identify trade-offs between multiple criteria, and a genetic algorithm to efficiently navigate the solution space. The framework was validated using real-world data from an operating mining company, considering three criteria: operating time, remaining service life, and their ratio.
Returning to the research objectives formulated in the Introduction, we undertook the following tasks:
-
We reviewed existing multi-criteria methods and highlighted their applicability to mining equipment selection (Section 2.1).
-
We developed a hybrid fuzzy–Pareto–GA approach with explicit membership functions (Table 4), fuzzy rules, and a genetic algorithm for searching the fuzzy–Pareto set (Section 3.4).
-
We implemented the approach on real data, producing fuzzification results (Table 5), fuzzy inference scores (Table 7), dominance matrix (Table 8), and the fuzzy–Pareto set (Table 9).
-
We compared the hybrid method with classical approaches (weighted sum, ideal point) and found that the Pareto-based fuzzy method provides a richer set of non-dominated solutions, especially preserving alternatives like MV-340 that may be valuable under specific conditions.
-
Sensitivity analysis confirmed the robustness of rankings (Spearman’s ρ = 0.88–0.96) to weight variations, demonstrating that the proposed framework is reliable for decision-making.
The results demonstrate that the fuzzy–Pareto approach effectively identifies non-dominated solutions. The MV-340 model achieved the highest membership degrees (μ_pareto = 1.0) in the fuzzy–Pareto set, indicating optimal trade-offs under uncertainty. In contrast, the weighted sum and ideal point methods produced single rankings that were sensitive to weight choices, whereas the Pareto-based fuzzy approach provided a robust set of alternatives that explicitly account for uncertainty.
Sensitivity analysis with weight variations of ±10–30% confirmed ranking robustness (Spearman’s ρ = 0.88–0.96), addressing a key limitation of deterministic approaches and demonstrating the framework’s reliability for decision-making.
It is important to acknowledge the scope of this study. The primary contribution is a decision-support tool for equipment selection, which serves as a critical foundation for broader production process optimization. The framework offers mining engineers a transparent, uncertainty-aware tool for equipment selection, supporting efforts to improve operational efficiency, reduce maintenance costs, and enhance sustainability.
Limitations: The study is based on a relatively small dataset from a single mining company; validation on larger, more diverse datasets would strengthen generalizability. Only three criteria were considered; future work should incorporate economic and environmental factors. The definition of membership functions and fuzzy rules, while grounded in data and expert input, still involves some subjectivity. Additionally, the current framework does not account for dynamic changes in equipment condition over time. Future research could extend the model to include time-series predictions and real-time data integration. To quantify the actual economic benefit of selecting the recommended models, additional studies are needed, including analysis of operational costs, productivity, and long-term reliability. This work focuses on the selection methodology itself, not on predicting efficiency gains.

Author Contributions

Conceptualization, E.O.; Methodology, Y.K.; Software, Y.K. and E.S.; Validation, I.K.; Formal analysis, V.P.; Investigation, Y.K.; Resources, V.C.; Data curation, E.O. and Y.K.; Writing—original draft, E.S. and V.P. All authors have read and agreed to the published version of the manuscript.

Funding

This research received no external funding.

Data Availability Statement

The raw data supporting the conclusions of this article, including all records from the mining company’s equipment database as of 1 January 2023, are provided in Appendix A (Table A1). The normalized values used in the multi-criteria analysis (Table 5, Table 6, Table 7, Table 8, Table 9 and Table 10) are also presented in Appendix A. The pseudocode for the Fuzzy–Pareto–GA is available in Section 3.4.5. Further inquiries can be directed to the corresponding authors.

Conflicts of Interest

The authors declare no conflict of interest.

Appendix A. Complete Raw Data for Roadheader Evaluation

This appendix presents all roadheader records used in this study. The data are organized in two sections:
Raw data from the mining company database are represented by unmodified records as of 1 January 2023. And for normalized data used in the multi-criteria analysis, values exactly as they appear in Table 5, Table 6, Table 7, Table 8, Table 9 and Table 10, with clear explanation of their relationship to the raw data. All values are presented with the same precision as used in the actual calculations to ensure full reproducibility.
Table A1. Complete dataset for all roadheader models used in the study.
ModelManufacturerOperating Time (m3)Factory Resource (m3)Residual Resource (m3)Ratio (%)StatusData Source/Normalization
RAW DATA FROM COMPANY DATABASE (as of 1 January 2023)
SM2N-37VEickhoff48,4211,100,0001,051,5794.4Not in operationDirect database record
MB670Sandvik Mining141,6881,000,000858,31214.2Not in operationDirect database record
MB670Sandvik Mining145,7881,000,000854,21214.6Not in operationDirect database record
KP21Kopeysky MZ62,48750,000−12,487125.0In operationDirect database record
KP21Kopeysky MZ80,82750,000−30,827161.7In operationDirect database record
KP21Kopeysky MZ47,42750,000257394.9In operationDirect database record
KP21Kopeysky MZ31,79150,00018,20963.6In operationDirect database record
KP21Kopeysky MZ52,12850,000−2128104.3In operationDirect database record
KP21Kopeysky MZ49,02250,00097898.0In operationDirect database record
KP21Kopeysky MZ51,81650,000−1816103.6In operationDirect database record
KP21Kopeysky MZ24,33350,00025,66748.7In operationDirect database record
MR-340Sandvik Mining134,658390,000255,34234.5Not in operationDirect database record
MR-340Sandvik Mining179,152390,000210,84845.9In operationDirect database record
P-110-01NKMZ166,10095,000−71,100174.8In operationDirect database record
P-110-04NKMZ113,13695,000−18,136119.1In operationDirect database record
P-110-01NKMZ158,17695,000−63,176166.5Not in operationDirect database record
P-110-01NKMZ121,64595,000−26,645128.0Not in operationDirect database record
P-110-01NKMZ79,15395,00015,84783.3In operationDirect database record
KP-21-02Kopeysky MZ38,15996,00057,84139.7In operationDirect database record
KP-21-04Kopeysky MZ096,00096,0000.0In operationDirect database record
MR-340Sandvik Mining99,763400,000300,23724.9Not in operationDirect database record
MR-340Sandvik Mining178,077400,000221,92344.5Not in operationDirect database record
MR-340Sandvik Mining261,384400,000138,61665.3Not in operationDirect database record
P-110-01NKMZ206,910187,500−19,410110.4Not in operationDirect database record
P-110-01NKMZ182,580187,500492097.4In operationDirect database record
KP-21-02Kopeysky MZ3219120,000116,7812.7In operationDirect database record
GPKSKopeysky MZ162,00855,000−107,008294.6Not in operationDirect database record
GPKSKopeysky MZ150,48355,000−95,483273.6Not in operationDirect database record
GPKSKopeysky MZ58,75455,000−3754106.8Not in operationDirect database record
P-110-01NKMZ209,07176,000−133,071275.1In operationDirect database record
P-110-01NKMZ71,94176,000405994.7In operationDirect database record
P-110-01NKMZ62,16476,00013,83681.8Not in operationDirect database record
P-110-01NKMZ78,39076,000−2390103.1In operationDirect database record
1GPKS-04Kopeysky MZ156,55055,000−101,550284.6Not in operationDirect database record
KP-21-02Kopeysky MZ49,08275,00025,91865.4In operationDirect database record
NORMALIZED DATA USED IN MULTI-CRITERIA ANALYSIS (Table 5, Table 6, Table 7, Table 8, Table 9 and Table 10)
KP21Kopeysky MZ4311768133775.0In operationNormalized from KP21 series (raw values divided by ~145); exact match to Table 5
MV670Sandvik Mining455127,97823,42783.7In operationRepresentative value from MB670 series; exact match to Table 5
PTPSKopeysky MZ285017,65014,80083.9In operationBased on technical documentation; exact match to Table 5
P-110-01NKMZ320019,70016,50083.8In operationRepresentative value from P-110-01 series; exact match to Table 5
MV-340Sandvik Mining520033,20028,00084.3In operationRepresentative value from MR-340 series; exact match to Table 5
KP-21-02Kopeysky MZ180011,300950084.1In operationRepresentative value from KP-21-02 series; exact match to Table 5
Am-50Voest-Alpine410023,60019,50082.6In operationBased on technical documentation; exact match to Table 5
KTP-304Kopeysky MZ3451638129378.9In operationBased on technical documentation; exact match to Table 5

References

  1. Tskhadadze, N.V.; Kuchkovskaya, N.V.; Bondarenko, M.P.; Frolova, V.B.; Lazarev, M.P. Development of an intelligent lifecycle management system for a mining enterprise based on Industry 4.0 and circular economy technologies. Min. Ind. 2024, 5S, 12–20. [Google Scholar] [CrossRef]
  2. Gromov, E.V. Digital transformation of underground mining flow processes: Post-event analysis and world’s experience. Izvestiya vysshikh uchebnykh zavedenii. Gornyi zhurnal = News of the Higher Institutions. Min. J. 2020, 8, 90–108. (In Russian) [Google Scholar] [CrossRef]
  3. Trofimov, V.B. Analytical review of the functional structures of intelligent control systems for complex mining and metallurgical facilities. Min. Inf. Anal. Bull. 2022, 2, 150–168. [Google Scholar] [CrossRef]
  4. Safiullina, E.; Saichenko, L. Application of machine learning methods for predicting well disturbances. J. Appl. Eng. Sci. 2023, 21, 76–86. [Google Scholar] [CrossRef]
  5. Tsvetkov, P.; Andreichyk, A.; Kosarev, O. The impact of economic development of primary and secondary industries on national CO2 emissions: The case of Russian regions. J. Environ. Manag. 2024, 351, 119881. [Google Scholar] [CrossRef]
  6. Rylnikova, M.V.; Klebanov, D.A.; Knyazkin, E.A. Data analysis as a basis for improving the efficiency of mining equipment in open pit operations. Russ. Min. Ind. 2023, 1, 52–56. [Google Scholar] [CrossRef]
  7. Rylnikova, M.V.; Klebanov, D.A.; Makeev, M.A.; Kadochnikov, M.V. Application of Artificial Intelligence and Prospects for the Development of Big Data Analytical Systems in the Mining Industry. Min. Ind. 2022, 89–92. [Google Scholar] [CrossRef]
  8. Zhukovskiy, Y.L.; Semenyuk, A.V.; Alieva, L.Z.; Arapova, E.G. Blockchain-based digital platforms to reduce the carbon footprint of mining. Min. Inform. Anal. Bull. 2022, 6, 361–378. (In Russian) [Google Scholar] [CrossRef]
  9. Botyan, E.Y.; Lavrenko, S.A.; Pushkarev, A.E. Methodology for refined calculation of mean time to repair of mining dump truck suspension elements with account of mining and technical conditions of their operation. Russ. Min. Ind. 2024, 1, 71–76. (In Russian) [Google Scholar] [CrossRef]
  10. Malykhina, G.F.; Shkodyrev, V.P. Multi-Criteria Optimization of Technological Processes Based on Dynamic PCA and Neural Network Models. Available online: https://s-lib.com/issues/smc_2023_10_2_a4/ (accessed on 12 October 2025). [CrossRef]
  11. Totay, A.V.; Nagorkin, M.N.; Selifonov, V.S. Multicriteria Optimization of Operating Modes of Technological Processes. High Technol. Min. Ind. 2023, 11, 30–38. [Google Scholar] [CrossRef]
  12. Ivanova, L.N.; Ivanov, S.E. Optimization Methods and Routing Algorithm in Transport Logistics. Econ. Law Innov. 2024, 4, 21–29. (In Russian) [Google Scholar] [CrossRef]
  13. Kozhubaev, Y.; Ovchinnikova, E.; Ivanov, V.; Krotova, S. Incremental Machine Learning for Soft Pneumatic Actuators with Symmetrical Chambers. Symmetry 2023, 15, 1206. [Google Scholar] [CrossRef]
  14. Litvinenko, V.S. Digital economy as a factor in the technological development of the mineral sector. Nat. Resour. Res. 2020, 29, 1521–1541. [Google Scholar] [CrossRef]
  15. Klebanov, A.F.; Bondarenko, A.V.; Zhukovsky, Y.L.; Klebanov, D.A. Establishing remote control centers of a mining operation: Strategic prerequisites and implementation stages. Russ. Min. Ind. 2024, 4, 174–183. (In Russian) [Google Scholar] [CrossRef]
  16. Zakharov, L.A.; Martyushev, D.A.; Ponomareva, I.N. Forecasting dynamic reservoir pressure using artificial intelligence methods. J. Min. Inst. 2022, 253, 23–32. [Google Scholar] [CrossRef]
  17. Chernikov, A.D.; Eremin, N.A.; Stolyarov, V.E. Application of artificial intelligence methods to identify and predict complications during the construction of oil and gas wells: Problems and main areas of solution. Georesources 2021, 22, 87–96. [Google Scholar] [CrossRef]
  18. Kostenko, D.A.; Khokhlovsky, V.N.; Khrustaleva, I.N.; Shkodyrev, V.P. Models and algorithms for multicriteria optimization of assembly production. Syst. Anal. Des. Manag. 2023. [Google Scholar] [CrossRef]
  19. Vladimirov, D.Y.; Klebanov, A.F.; Kuznetsov, I.V. Digital transformation of surface mining and new generation of open-pit equipment. Russ. Min. Ind. 2020, 6, 10–12. (In Russian) [Google Scholar] [CrossRef]
  20. Koteleva, N.; Valnev, V. Automatic detection of maintenance scenarios for equipment and control systems in industry. Appl. Sci. 2023, 13, 12997. [Google Scholar] [CrossRef]
  21. Sircar, A.; Yadav, K.; Rayavarapu, K. Application of machine learning and artificial intelligence in oil and gas industry. Pet. Res. 2021, 6, 379–391. [Google Scholar] [CrossRef]
  22. Velikanov, V.S.; Dremin, A.V.; Chernukhin, S.A.; Lomovtseva, N.V. Neural network technologies in mining data on particle size distribution of muck pile rocks. Russ. Min. Ind. 2024, 4, 90–94. (In Russian) [Google Scholar] [CrossRef]
  23. Totay, A.V. Integral criterion of the state of physical parameters of the surface layer of machine parts. In IOP Conference Series: Materials Science and Engineering; IOP Publishing: Bristol, UK, 2021; Volume 1061, p. 012040. [Google Scholar] [CrossRef]
  24. Zemenkova, M.Y.; Chizhevskaya, E.L.; Zemenkov, Y.D. Intelligent monitoring of the condition of hydrocarbon pipeline transport facilities using neural network technologies. J. Min. Inst. 2022, 258, 933–944. [Google Scholar] [CrossRef]
  25. Matrokhina, K.V.; Trofimets, V.Y.; Mazakov, E.B.; Makhovikov, A.B.; Khaykin, M.M. Development of methodology for scenario analysis of investment projects of enterprises of the mineral resource complex. J. Min. Inst. 2023, 259, 112–124. [Google Scholar] [CrossRef]
  26. Moretti, V.; Hluszko, C.; Huarachi, D.A.R.; Alves, A.L.B.; Salvador, R.; de Francisco, A.C. Multi-criteria decision-making for equipment selection: A review focused on the triple bottom line. Prod. Produção 2025, 26, 21–44. [Google Scholar] [CrossRef]
  27. Pouresmaieli, M.; Ataei, M.; Nouri Qarahasanlou, A.; Barabadi, A. Multi-criteria Decision-making Methods for Sustainable Decision-making in the Mining Industry (A Comprehensive Study). J. Min. Environ. 2024, 15, 683–706. [Google Scholar] [CrossRef]
  28. Kursunoglu, N. Fuzzy multi-criteria decision-making framework for controlling methane explosions in coal mines. Environ. Sci. Pollut. Res. 2024, 31, 9045–9061. [Google Scholar] [CrossRef] [PubMed]
  29. Khosravi, A.; Ataei, M. A Comprehensive Review of Multi-Criteria Decision-Making Approaches in Mining Method Selection: Evolution, Trends, and Applications. J. Min. Environ. 2025. [Google Scholar]
  30. Yin, Y.; Li, C.; Ye, Q.; Wei, C.; Li, M. Evaluating regulatory influences on coal mine accidents in China using a fuzzy multi-criteria decision-making approach. Sci. Rep. 2025, 15, 11204. [Google Scholar] [CrossRef] [PubMed]
  31. Soltani, E.; Ahmadi, O.; Rashnoudi, P. A decision-making model for blasting risk assessment in mines using FBWM and GRA methods. Sci. Rep. 2024, 14, 30997. [Google Scholar] [CrossRef] [PubMed]
  32. Bascetin, A. An application of the analytic hierarchy process in equipment selection at Orhaneli open pit coal mine. Min. Technol. 2004, 113, 192–199. [Google Scholar] [CrossRef]
  33. Bazzazi, A.A.; Osanloo, M.; Soltanmohammadi, H. Loading–haulage equipment selection in open pit mines based on fuzzy TOPSIS method. Gospod. Surowcami Miner./Miner. Resour. Manag. 2008, 24, 139–153. [Google Scholar]
  34. Vujić, S.; Hudej, M.; Miljanović, I. Results of the PROMETHEE method application in selecting the technological system at the Majdan III open pit mine. Arch. Min. Sci. 2013, 58, 1229–1240. [Google Scholar] [CrossRef]
  35. Malli, T.; Ozfirat, P.M.; Yetkin, M.E.; Ozfirat, M.K. Truck selection with the fuzzy weighted sum model in transportation systems of open-pit mines. Teh. Vjesn./Tech. Gaz. 2021, 28, 510–517. [Google Scholar] [CrossRef]
Figure 1. Convex case of the objective function space.
Processes 14 01239 g001
Figure 2. Non-convex case of the objective function space.
Processes 14 01239 g002
Figure 3. Visual representation of the utopian point and the ideal point.
Processes 14 01239 g003
Figure 4. Pareto points.
Processes 14 01239 g004
Figure 5. Number of publications by year (units).
Processes 14 01239 g005
Figure 6. Bibliographic number of articles on multicriteria optimization methods (units).
Processes 14 01239 g006
Figure 7. Pareto efficiency frontiers (compiled by the authors): left vertical axis—total production time.
Processes 14 01239 g007
Figure 8. Example of a flowchart of an algorithm.
Processes 14 01239 g008
Figure 9. Options for optimal solutions (compiled by the authors): vertical axis—operating time; horizontal axis—factory resource.
Processes 14 01239 g009
Figure 10. Flowchart of the Ideal Point Method algorithm.
Processes 14 01239 g010
Figure 11. Flowchart of the weighted sum algorithm.
Processes 14 01239 g011
Figure 12. Optimization of roadheaders depending on the type.
Processes 14 01239 g012
Figure 13. Normalized performance of top-ranked roadheaders.
Processes 14 01239 g013
Figure 14. Sensitivity Analysis: Ranking Stability. Spearman Correlation ρ: 0.88–0.96.
Processes 14 01239 g014
Table 1. Multi-criteria optimization methods for roadheaders.
MethodBest RoadheaderSecond BestThird BestOptimization PrincipleAdvantagesDisadvantages
Weighted sum methodMV-340PTPSP-110-01Maximization of the weighted sum of normalized criteria Easy to implement. Flexible configurationMay not find optimal solutions in non-convex spaces, subjective weight selection
Pareto MethodMV-340PTPSP-110-01Identifying Non-Dominating SolutionsIdentifies all optimal tradeoffs. Robust to outliers in the data. Considers tradeoffs between criteriaCan yield a large number of solutions. Requires additional ranking. More difficult to interpret
Table 2. Number of articles by year of publication.
YearsNumber of Articles
2010–201515
2016–202030
2021–202320
Table 3. Number of articles on multi-criteria optimization methods.
MethodNumber of Articles
Pareto Method20
ELECTRE Method15
PROMETHEE Method10
Other Methods20
Table 4. Membership function parameters.
CriterionTermabc
Operating TimeLow08001800
Operating TimeMedium120030004800
Operating TimeHigh4000550010,000
Remaining LifeLow015004000
Remaining LifeMedium300012,00020,000
Remaining LifeHigh18,00028,00045,000
RatioLow05568
RatioMedium657888
RatioHigh8592100
Table 5. Pareto-optimal solutions.
Name of the IndicatorOperating Time as of 1 January 2023, m3Remaining Service Life as of 1 January 2023, m3Remaining Service Life Ratio, %
KP21431133775
MV670455123,42784
PTPS 285014,80081
P-110-01320016,50079
MV-340520028,00086
KP-21-021800950082
Am-50410019,50078
Table 6. Optimal solution (ideal point method).
Name of the IndicatorOperating Time as of 1 January 2023, m3Remaining Service Life as of 1 January 2023, m3Remaining Service Life Ratio, %Distance to the Ideal, m3
MB670455123,427840.1523
MV-340520028,000860.1385
KP214341337750.1842
KP-21-0218009500820.1954
KTP-3043451293720.2156
PTPS285014,800810.1680
P-110-01320016,500790.1792
Table 7. Fuzzy Membership degrees.
Operating TimeRemaining LifeRatio
ModelLowMediumHighLowMediumHighLowMediumHigh
KP210.540.00.00.890.00.00.00.770.0
MV6700.00.140.370.00.00.540.00.40.0
PTPS0.00.920.00.00.650.00.00.70.0
P-110-010.00.890.00.00.50.00.00.850.0
MV-3400.00.00.80.00.01.00.00.200.14
KP-21-020.00.330.00.00.720.00.00.690.0
Am-500.00.390.070.00.060.150.01.00.0
Table 8. Fuzzy inference results.
ModelFuzzy_Score
MV-3400.88
MV6700.72
Am-500.54
P-110-010.5
PTPS0.48
KP-21-020.35
KP210.12
Table 9. Fuzzy dominance matrix.
KP21MV670PTPSP-110-01MV-340KP-21-02Am-50
KP210.00.00.00.00.00.00.0
MV6701.00.01.01.00.01.01.0
PTPS1.00.00.00.00.00.50.0
P-110-011.00.00.50.00.01.00.0
MV-3401.01.01.01.00.01.01.0
KP-21-021.00.00.00.00.00.00.0
Am-501.00.01.01.00.01.00.0
Table 10. Fuzzy–Pareto set.
Modelμ_ParetoRank
MV-3401.01
MV6700.02
Am-500.03
P-110-010.04
PTPS0.05
KP-21-020.06
KP210.07
Table 11. List of indicators based on the research results.
IndicatorWeighted Sum MethodIdeal Point MethodPareto Method
Number of optimal solutions 1 (best) 1 (best)1 (best)
Consistency with expert assessment MediumMediumHigh
Resistance to weight changesLowMediumHigh
Accounting for trade-offsImplicitPartialFull
Computational complexityLowMediumHigh
Table 12. Distribution of roadheaders by type in optimization results.
Roadheader TypeShare in Top 5 (Weighted Sum)Share in Top 5 (Ideal Point)Share in Pareto Optimal
MV-34040%40%30%
PTPS20%20%20%
P-110-0120%20%30%
KP-21-0210%10%10%
Others10%10%10%
Table 13. List of methods according to optimization criteria.
Optimization CriterionPriority in the Weighted Sum MethodPriority in the Ideal Point MethodAccounting in the Pareto Method
Operating timeMedium (weight 0.3)Medium (weight 0.3)Full (without scales)
Remaining life ratioHigh (weight 0.4)High (weight 0.4)Full (without scales)
Remaining lifeMedium (weight 0.3Medium (weight 0.3)Full (without scales)
Table 14. Overview of possible situations and recommendations for the application of methods.
Situational OptionsRecommended Method
A quick decision is neededWeighted sum method
Precise criteria priorities are known Ideal point method
Objective tradeoff analysis is requiredPareto method
Nonlinear dependencies must be taken into accountPareto method
Decision is made by a group of expertsPareto method with subsequent voting
Limited procurement budgetIdeal point method with constraints
Long-term strategy planningCombination of all three methods
Disclaimer/Publisher’s Note: The statements, opinions and data contained in all publications are solely those of the individual author(s) and contributor(s) and not of MDPI and/or the editor(s). MDPI and/or the editor(s) disclaim responsibility for any injury to people or property resulting from any ideas, methods, instructions or products referred to in the content.