1. Introduction
Compared to conventional fossil fuels, natural gas (NG) generates relatively low pollutant emissions and is increasingly regarded as a transitional energy resource capable of supporting future energy demands [
1]. Technologies for NG storage and transportation are generally classified into compressed natural gas (CNG), liquefied natural gas (LNG), pipeline natural gas (PNG), and adsorbed natural gas (ANG) systems [
2]. CNG requires multi-stage compression and robust pressure vessels capable of withstanding 200–250 bar, whereas LNG relies on complex and energy-intensive cryogenic infrastructure operating near −161 °C [
3]. PNG fundamentally depends on extensive pipeline networks connecting production and consumption sites, which may be limited by infrastructure constraints and land-use conditions, particularly in distributed or domestic environments [
4].
ANG has attracted considerable attention because it can achieve competitive storage efficiency without extreme compression or cryogenic operation. However, the development of suitable adsorbent structures remains an important step for improving ANG storage systems [
5]. However, the performance of ANG systems is strongly governed by the physicochemical characteristics of the adsorbent. While advanced non-carbon materials, such as metal–organic frameworks (MOFs) and zeolites, exhibit exceptional theoretical gas uptake, their practical deployment is often hindered by high production costs, poor moisture stability, and complex scale-up processes [
6]. Therefore, low-cost, hydrophobic, and physically robust carbon-based adsorbents are preferred for practical deployment [
7]. Representative carbon-based adsorbents include biomass-derived carbons, carbon nanotubes, graphene, inorganic–organic hybrids, activated carbon (AC), and activated carbon fibers [
8]. Among these candidates, AC is widely applied in gas separation, sensing, and energy-related fields due to its high specific surface area and favorable transport properties [
9]. Moreover, the tunability of its surface chemistry and pore structure enables maximization of methane uptake, establishing AC as a core material platform for ANG applications [
10].
Activated carbon is typically supplied in granular (GAC) or powdered (PAC) forms depending on process and device requirements [
11]. GAC is relatively easy to handle and produces limited dust; however, its comparatively low bulk density restricts volumetric performance, which is a critical metric in ANG storage systems [
12]. PAC can provide rapid adsorption kinetics due to shortened diffusion pathways, but its direct use in gas-phase packed beds is limited by dusting, handling difficulties, and pressure-drop issues [
13]. Consequently, significant effort has been devoted to developing shaped and structured carbon bodies that combine the kinetic advantages of fine particles with practical operability in adsorption systems [
14].
In this context, particle size distribution (PSD) is a key structural parameter because it directly influences packing density, mechanical integrity, and adsorption behavior in molded carbon composites [
15]. Reducing particle size generally enhances packing efficiency and mechanical stability; however, excessive fines may reduce accessible porosity by pore blockage or restricted transport pathways, thereby decreasing adsorption performance [
16]. Conversely, larger particles can preserve pore accessibility and facilitate gas transport but often lead to lower packing density and weaker mechanical strength [
17]. Therefore, optimization of PSD is essential to achieve a balance between structural stability and functional adsorption performance [
18].
The incorporation of binders is indispensable for fabricating shaped carbon structures, and the type and content of binder critically determine mechanical strength, porosity retention, and structural stability [
19]. Binders are typically categorized into liquid and solid types according to their physical state [
20]. Liquid binders enable uniform dispersion and rapid molding stability but may coat particle surfaces and clog micropores, resulting in reduced adsorption capacity [
21]. Common examples include styrene–butyl acrylate (SBA), vinyl acetate (VA), and acrylonitrile [
22]. Solid binders, in contrast, enhance particle bonding through viscosity control and improved dispersion stability; however, they require longer dissolution times and may induce brittleness after molding [
23,
24]. Representative solid binders include carboxymethyl cellulose (CMC), polyvinylidene fluoride (PVDF), and polyacrylic acid (PAA) [
25].
To mitigate the limitations associated with individual binder types, hybrid binder systems combining liquid and solid components are frequently employed [
26]. Particularly for hard and irregular biomass precursors, selecting an appropriate binder combination is crucial to prevent severe micropore blockage while ensuring sufficient inter-particle cohesion. A representative example is the SBA/CMC mixed binder system [
27]. Specifically, the liquid SBA provides necessary flexibility and strong adhesion for the rigid particles, while the solid CMC acts as a rheological modifier that maintains molding stability and restricts the excessive penetration of SBA into the deep micropore network [
28]. Such hybrid strategies improve mechanical strength and structural cohesion, thereby broadening applicability across industrial adsorption systems [
29]. Nevertheless, conventional GAC and PAC materials inherently exhibit structural limitations. During packing, inter-particle voids, commonly referred to as dead space, reduce effective volumetric storage capacity [
30]. These voids also hinder heat transfer pathways, amplifying thermal fluctuations during adsorption–desorption cycles [
31]. In contrast, monolithic carbon structures can reduce unnecessary void volume and improve packing density of the adsorbent body, which is an important factor in adsorption-based storage systems. The continuous carbon framework further enhances thermal conductivity and mechanical stability, overcoming the structural deficiencies of conventional particulate adsorbents [
32,
33].
Although particle size distribution and binder composition are known to influence the structural properties of carbon monoliths, systematic studies investigating their combined effects remain limited. In ANG systems, storage performance depends not only on microporosity but also on the packing structure and mechanical stability of the adsorbent body. Achieving high packing density while minimizing pore blockage by binders therefore represents an important design challenge.
In this study, coconut shell-based activated carbon monoliths were fabricated to investigate the combined influence of particle size blending and hybrid binder (SBA/CMC) content on structural and adsorption properties. Particle size distribution and binder content were treated as key structural variables to examine their effects on packing density, mechanical strength, and methane adsorption behavior under ambient conditions. In particular, this study aims to resolve the structural trade-off between packing density, micropore preservation, and mechanical stability in activated carbon monoliths through the combined optimization of particle size blending and hybrid binder composition. The methane adsorption results are presented as a screening-level evaluation to examine the structural influence of fabrication parameters. These findings provide a basis for future high-pressure ANG studies.
2. Materials and Methods
2.1. Materials
In this study, coconut shell-derived granular activated carbon (PKD2000, POSCO Future M, Republic of Korea) with a specific surface area of approximately 2000 m2/g was used as the carbon precursor. This material is a commercial-grade activated carbon produced from coconut shell. Styrene–butyl acrylate (SBA, Unisol Chemicals, Republic of Korea) and carboxymethyl cellulose (CMC, Unisol Chemicals, Republic of Korea) were used as binders. Although detailed parameters such as the degree of substitution of CMC and the exact composition of the SBA binder are not publicly available, the commercial product names and suppliers are specified to ensure reproducibility.
2.2. Activated Carbon Manufacturing to Fit the Particle Size
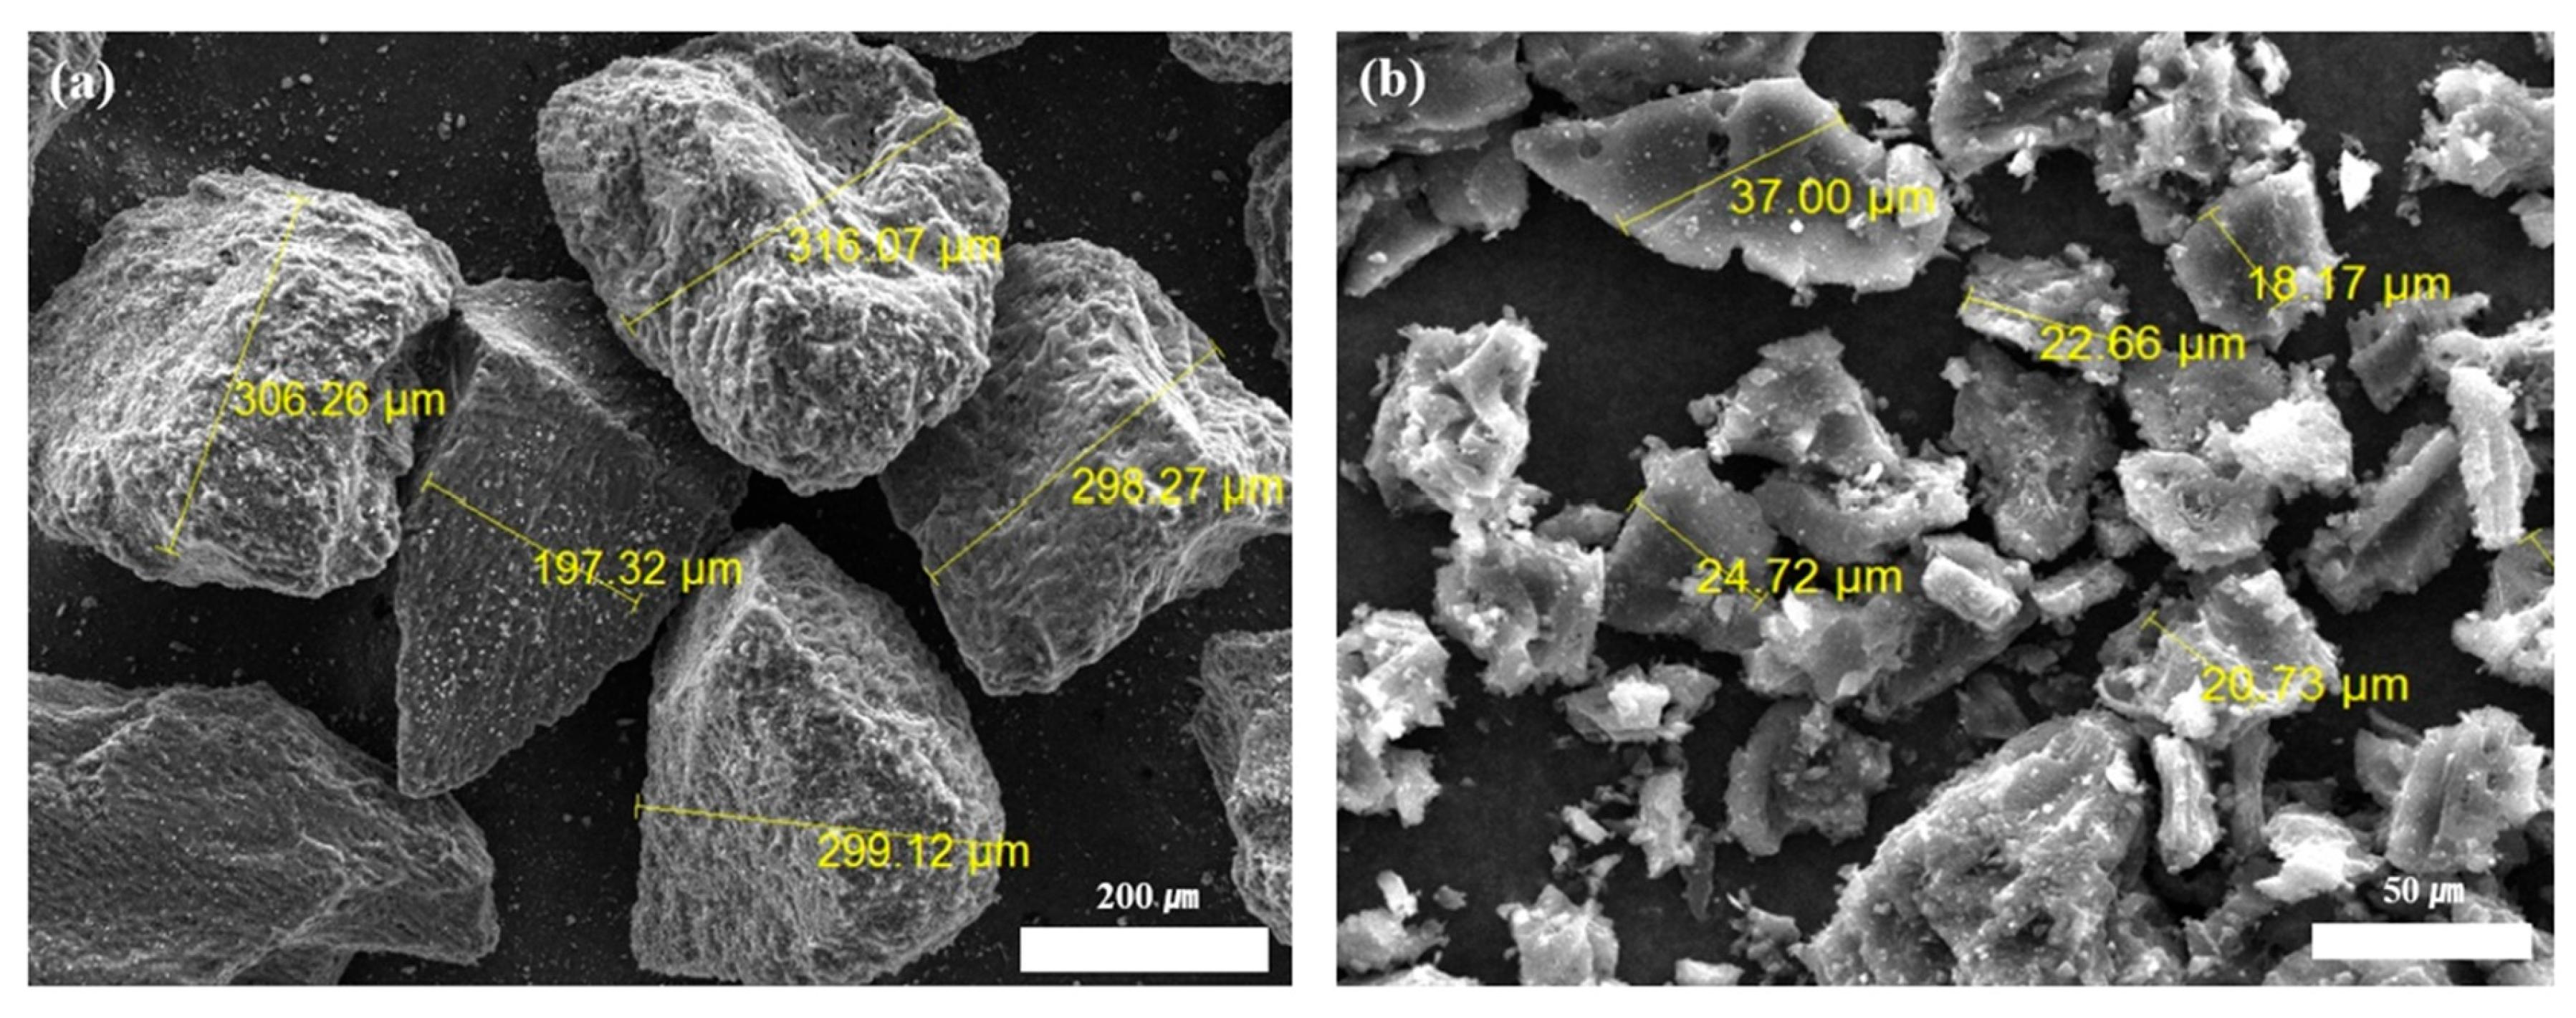
Prior to monolith fabrication, coconut shell-based GAC was crushed using a blade milling process in a high-capacity mixer (SMX-4500EL, Shinil, Republic of Korea). The resulting powder was sieved into four particle size fractions (212–250 µm, 75–212 µm, 53–75 µm, and 26–53 µm) using a sieve shaker (CG-211-8, Chung Gye Sieve, Republic of Korea) equipped with standard sieves (Sae Hwa Testing, Republic of Korea). To investigate the influence of particle size distribution on packing characteristics and the resulting structural density of the molded monoliths, two representative size ranges, 212–250 µm (Coarse) and 26–53 µm (Fine), as shown in
Figure 1, were selected and blended at specific weight ratios. For packing characterization, 20 g of each blended sample was poured into a graduated cylinder to determine the apparent density under as-poured conditions. The cylinder was then tapped against a flat surface at a constant rate for 2 min, and the tap density was recorded once the volume reached a steady state. Specifically, the physical forms were designated as P (powder) and M (monolith). Coarse and fine particles were labeled as C and F, respectively, while mixed samples were denoted as followed by the weight percentage (wt%) of the coarse fraction.
2.3. Monolith Manufacturing
To prepare a homogeneous paste, distilled water, SBA, and CMC were blended with 20 g of powdered activated carbon according to the weight ratios listed in
Table 1. Ap-proximately 3 g of the resulting mixture was loaded into a cylindrical mold (2.5 cm in diameter) coated with a urethane release agent. A uniaxial pressure of 10 MPa was applied and maintained for 2 min to fabricate the monolith. After demolding, the monoliths were dried at room temperature for 24 h to minimize pore structure damage caused by rapid moisture evaporation. Subsequently, additional thermal drying was performed in an oven at 80 °C for at least 24 h to ensure complete removal of residual moisture and structural stabilization. Binder content was classified into three levels: H (high, 1:0.3:0.03), M (medium, 1:0.2:0.02), and L (low, 1:0.1:0.01), based on the AC:SBA:CMC weight ratio. The selection of these binder ratios was made through prior research [
34].
It should be noted that the experimental design did not employ a full factorial design or response surface methodology (RSM). Instead, the two variables were examined separately to clarify their individual effects. The binder ratio (H/M/L) was evaluated at a fixed particle size condition, while the particle size blending ratio was investigated under the low binder condition. This design allowed the influence of binder content and particle size distribution on monolith structure to be analyzed without interference from the other variable. Detailed sample nomenclature and binder compositions are compiled in
Table 2, categorized by physical forms and blending ratios.
2.4. Methane Adsorption
Before methane adsorption measurements, N2 gas was introduced into the gas line at 100 cc/min for approximately 10 min to remove residual impurities and stabilize the system. A methane/N2 gas mixture with a concentration of 10,043 ppm was then supplied at a flow rate of 10 cc/min. For adsorption measurements, the dried monolith samples were pulverized and packed into a column (1 cm inner diameter, packing height 5 cm). This was intended to evaluate the effect of material composition, including particle size blending and binder content, on methane adsorption behavior while excluding the structural effect of the intact monolith body. The outlet methane concentration was continuously recorded every second using an IR-based gas analyzer. After completion of adsorption, N2 gas was introduced again to purge residual methane from the system. Therefore, the methane uptake values obtained in this test represent composition-based material adsorption behavior and should not be regarded as the adsorption performance of the intact monolith itself. The methane adsorption test was conducted as a preliminary single-run screening test without replicates.
2.5. Characteristic Analysis
Particle size distribution was analyzed using a laser diffraction particle size analyzer (Bettersize2000, Bettersize Instruments, China). The surface and internal morphology, along with elemental composition of the monoliths, were characterized by scanning electron microscopy (SEM) coupled with energy dispersive spectroscopy (EDS, VEGA3 system, Tescan, Czech). The specific surface area and pore structure were determined by the Brunauer–Emmett–Teller (BET) method based on N2 adsorption–desorption isotherms measured at 77 K (BELSORP-max, Microtrac MRB, Japan). Surface chemical properties were evaluated using X-ray photoelectron spectroscopy (XPS, Nexsa, Thermo Fisher Scientific, Brno, Czech). The structural density of the monoliths was calculated from their measured mass and geometrical dimensions obtained using a vernier caliper. Mechanical stability was assessed by compressive strength testing with a universal testing machine (UTM-5569, Instron, USA). Finally, methane adsorption capacity was measured using a stationary methane adsorption system (FIX-800, Shenzhen Wandi Technology, China).
3. Results and Discussion
3.1. Activated Carbon Particle Size
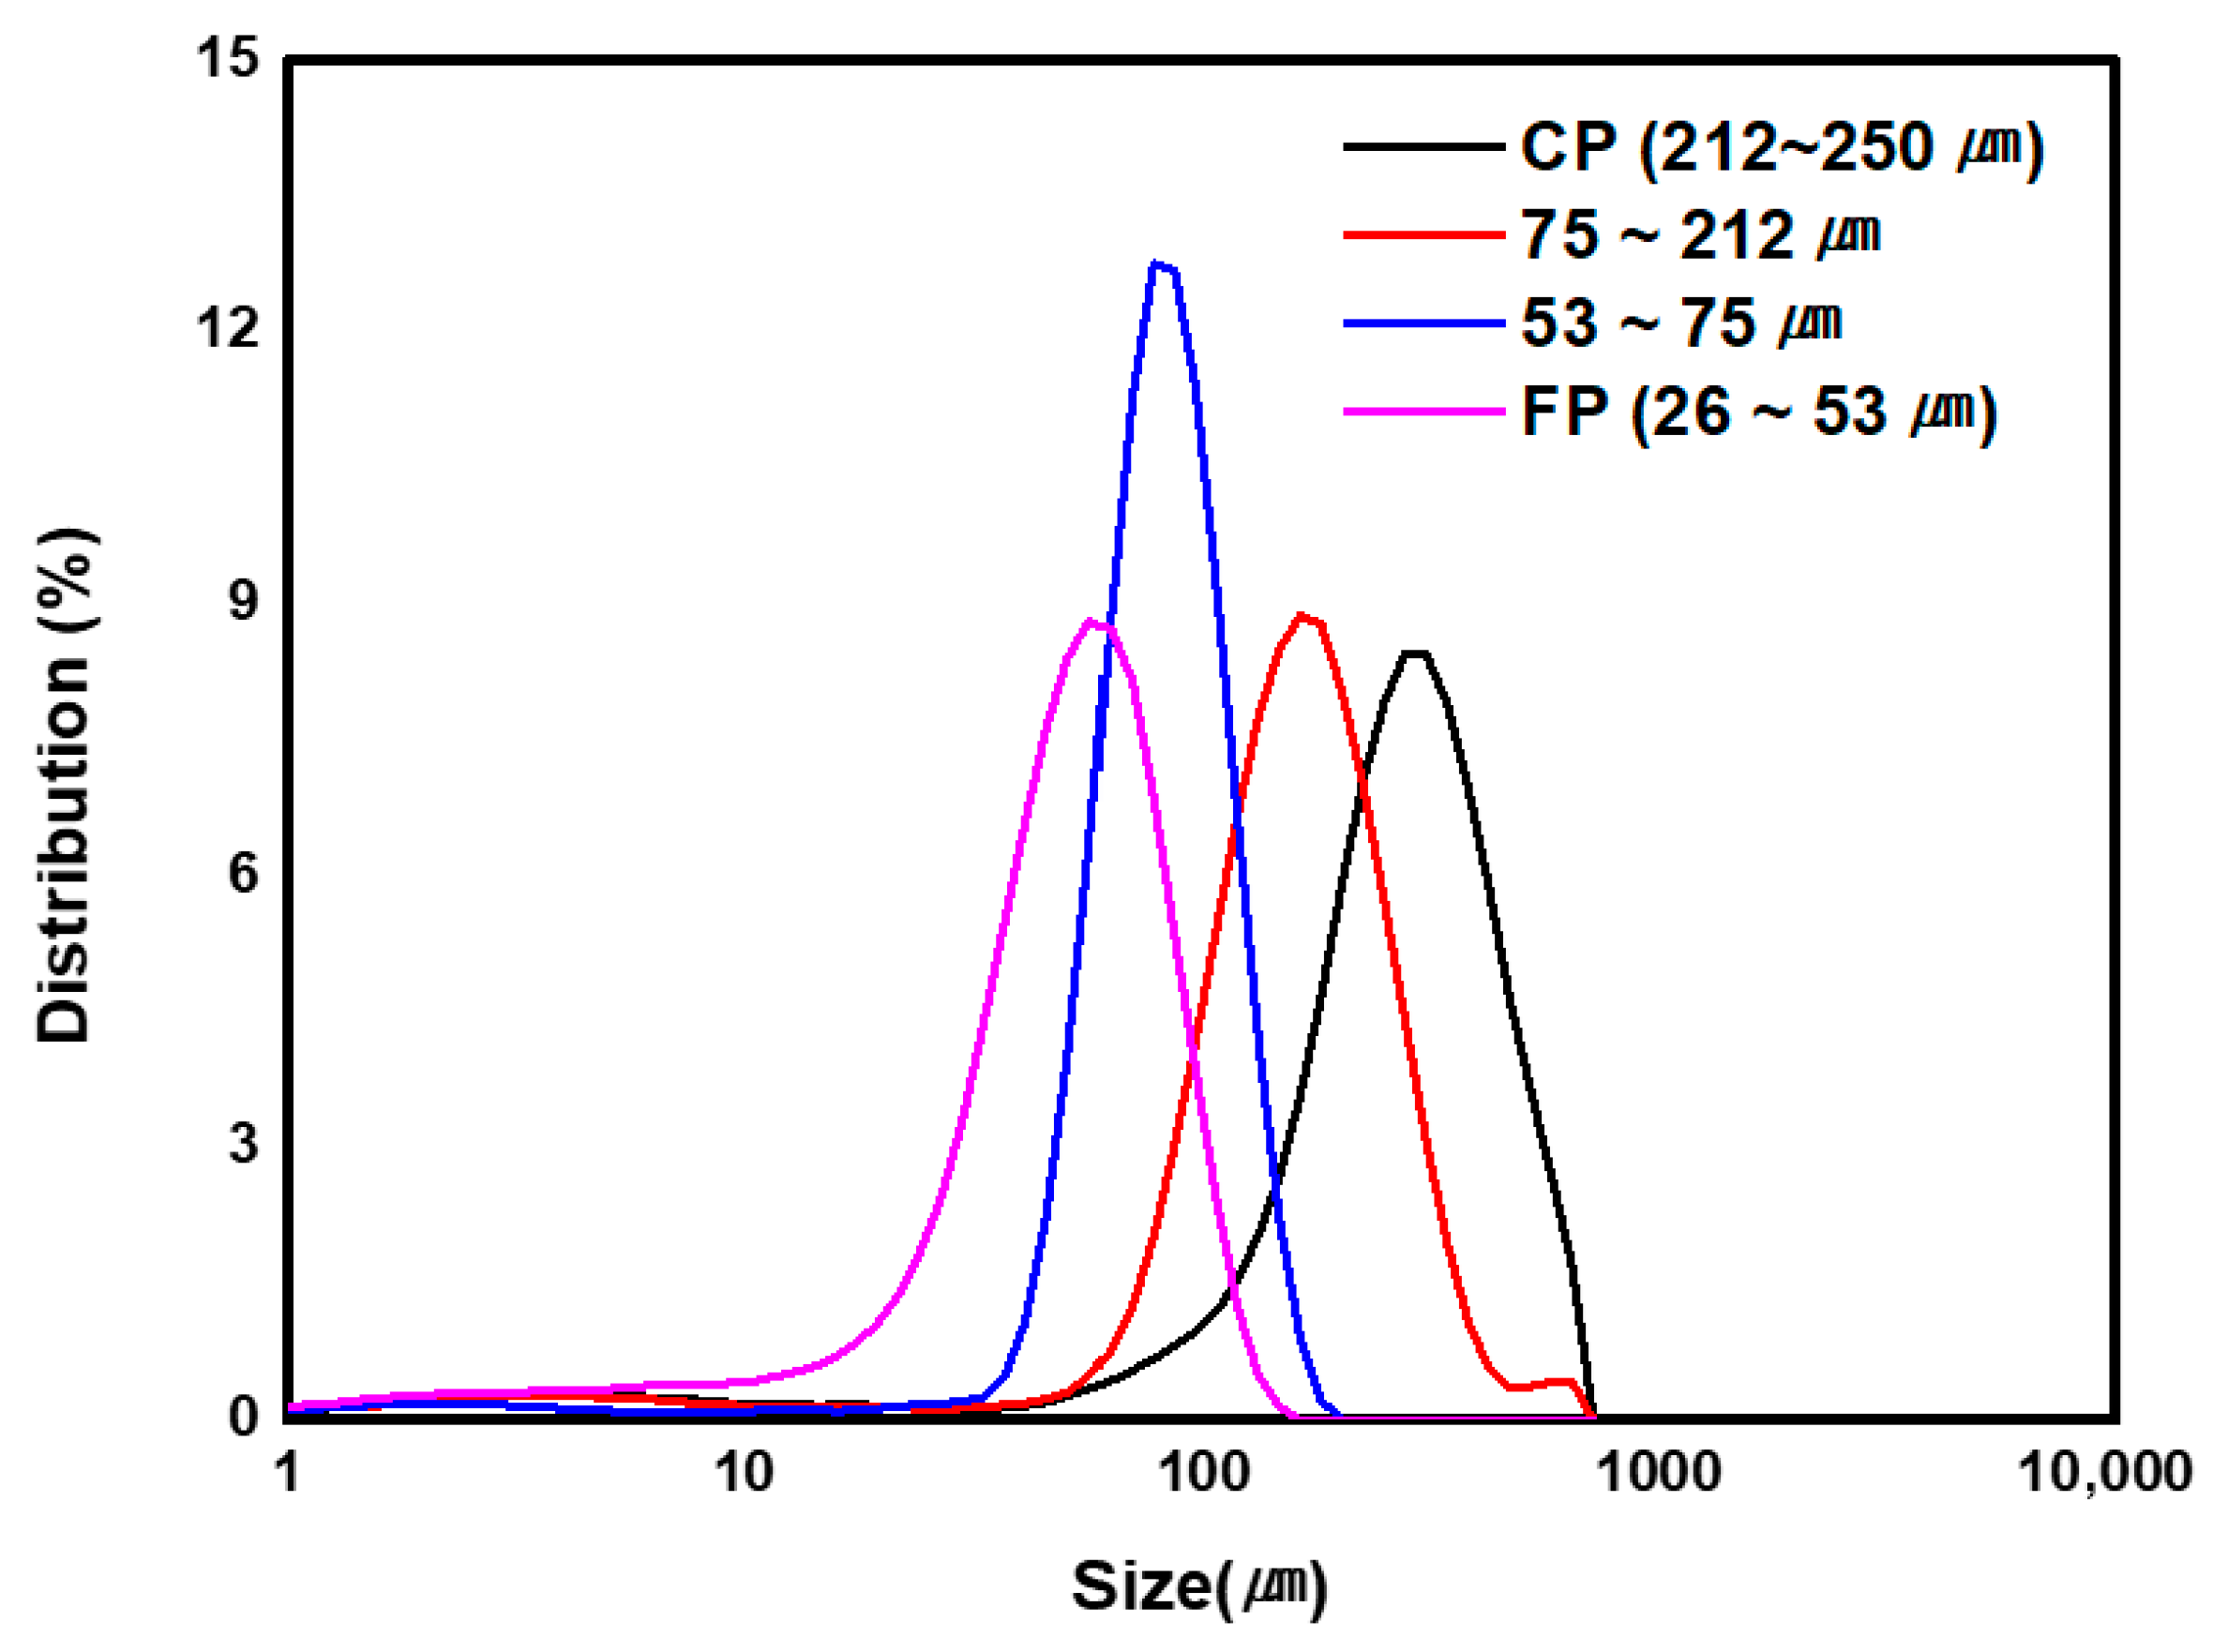
The crushed activated carbon was classified into four distinct size ranges: CP (212–250 µm), 75–212 µm, 53–75 µm, and FP (26–53 µm), based on previous particle size classification approaches [
35]. The PSD profiles for each fraction are presented in
Figure 2. Representative diameter values (D10, D50, and D90) were calculated for each size range and are summarized in
Table 3. The results show that the D50 values shifted consistently according to the targeted sieve ranges, indicating high classification accuracy and successful preparation of well-defined particle size fractions.
3.2. Activated Carbon Density
To quantitatively evaluate the influence of particle size distribution on packing characteristics, filled and tapped density analyses were conducted.
Table 4 summarizes the density values for both the single-component fractions (CP and FP) and their blended samples. Under single-component conditions, the CP exhibited higher filled and tapped densities than the FP. The lower density observed for FP may be attributed to increased inter-particle friction and air entrapment commonly observed in fine powder beds.
When CP and FP particles were blended at specific weight ratios, the mixtures exhibited higher density values than the individual fractions. For example, the tapped density of the M50P blend reached a maximum value of 0.471 g/mL. This behavior can be explained by an interstitial packing mechanism in which CP particles form a skeletal framework while FP particles fill the interparticle voids, leading to improved packing efficiency.
Conversely, at extreme blending ratios such as M10P and M90P, the packing efficiency decreased. The M10P blend exhibited the lowest tapped density among all samples. This behavior is associated with the loosening effect, where the introduction of a small fraction of different-sized particles disrupts the packing arrangement and increases interparticle voids. Similarly, although M90P showed improved density compared with single fractions, the packing efficiency remained lower than that of the M50P blend due to insufficient fine particles to fill the void spaces between coarse particles.
Accordingly, the blending ratio that produced the highest density was considered an important parameter for selecting particle size combinations in subsequent monolith fabrication.
3.3. Monolith SEM Analysis
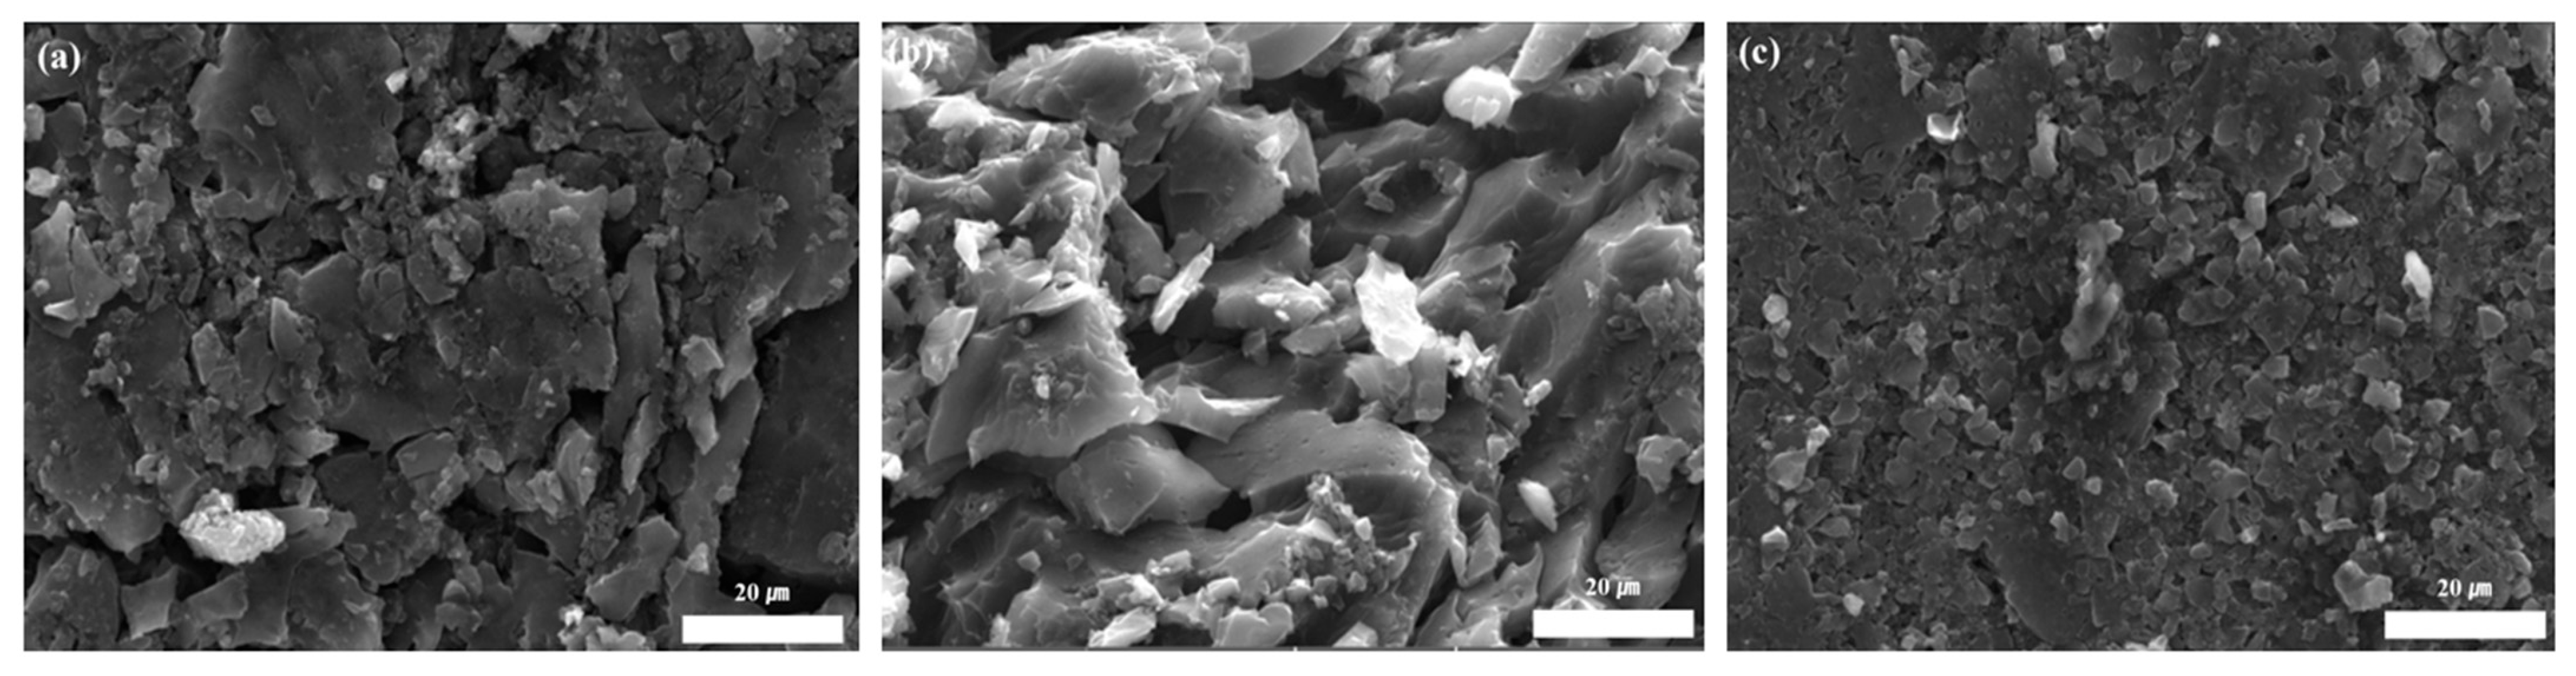
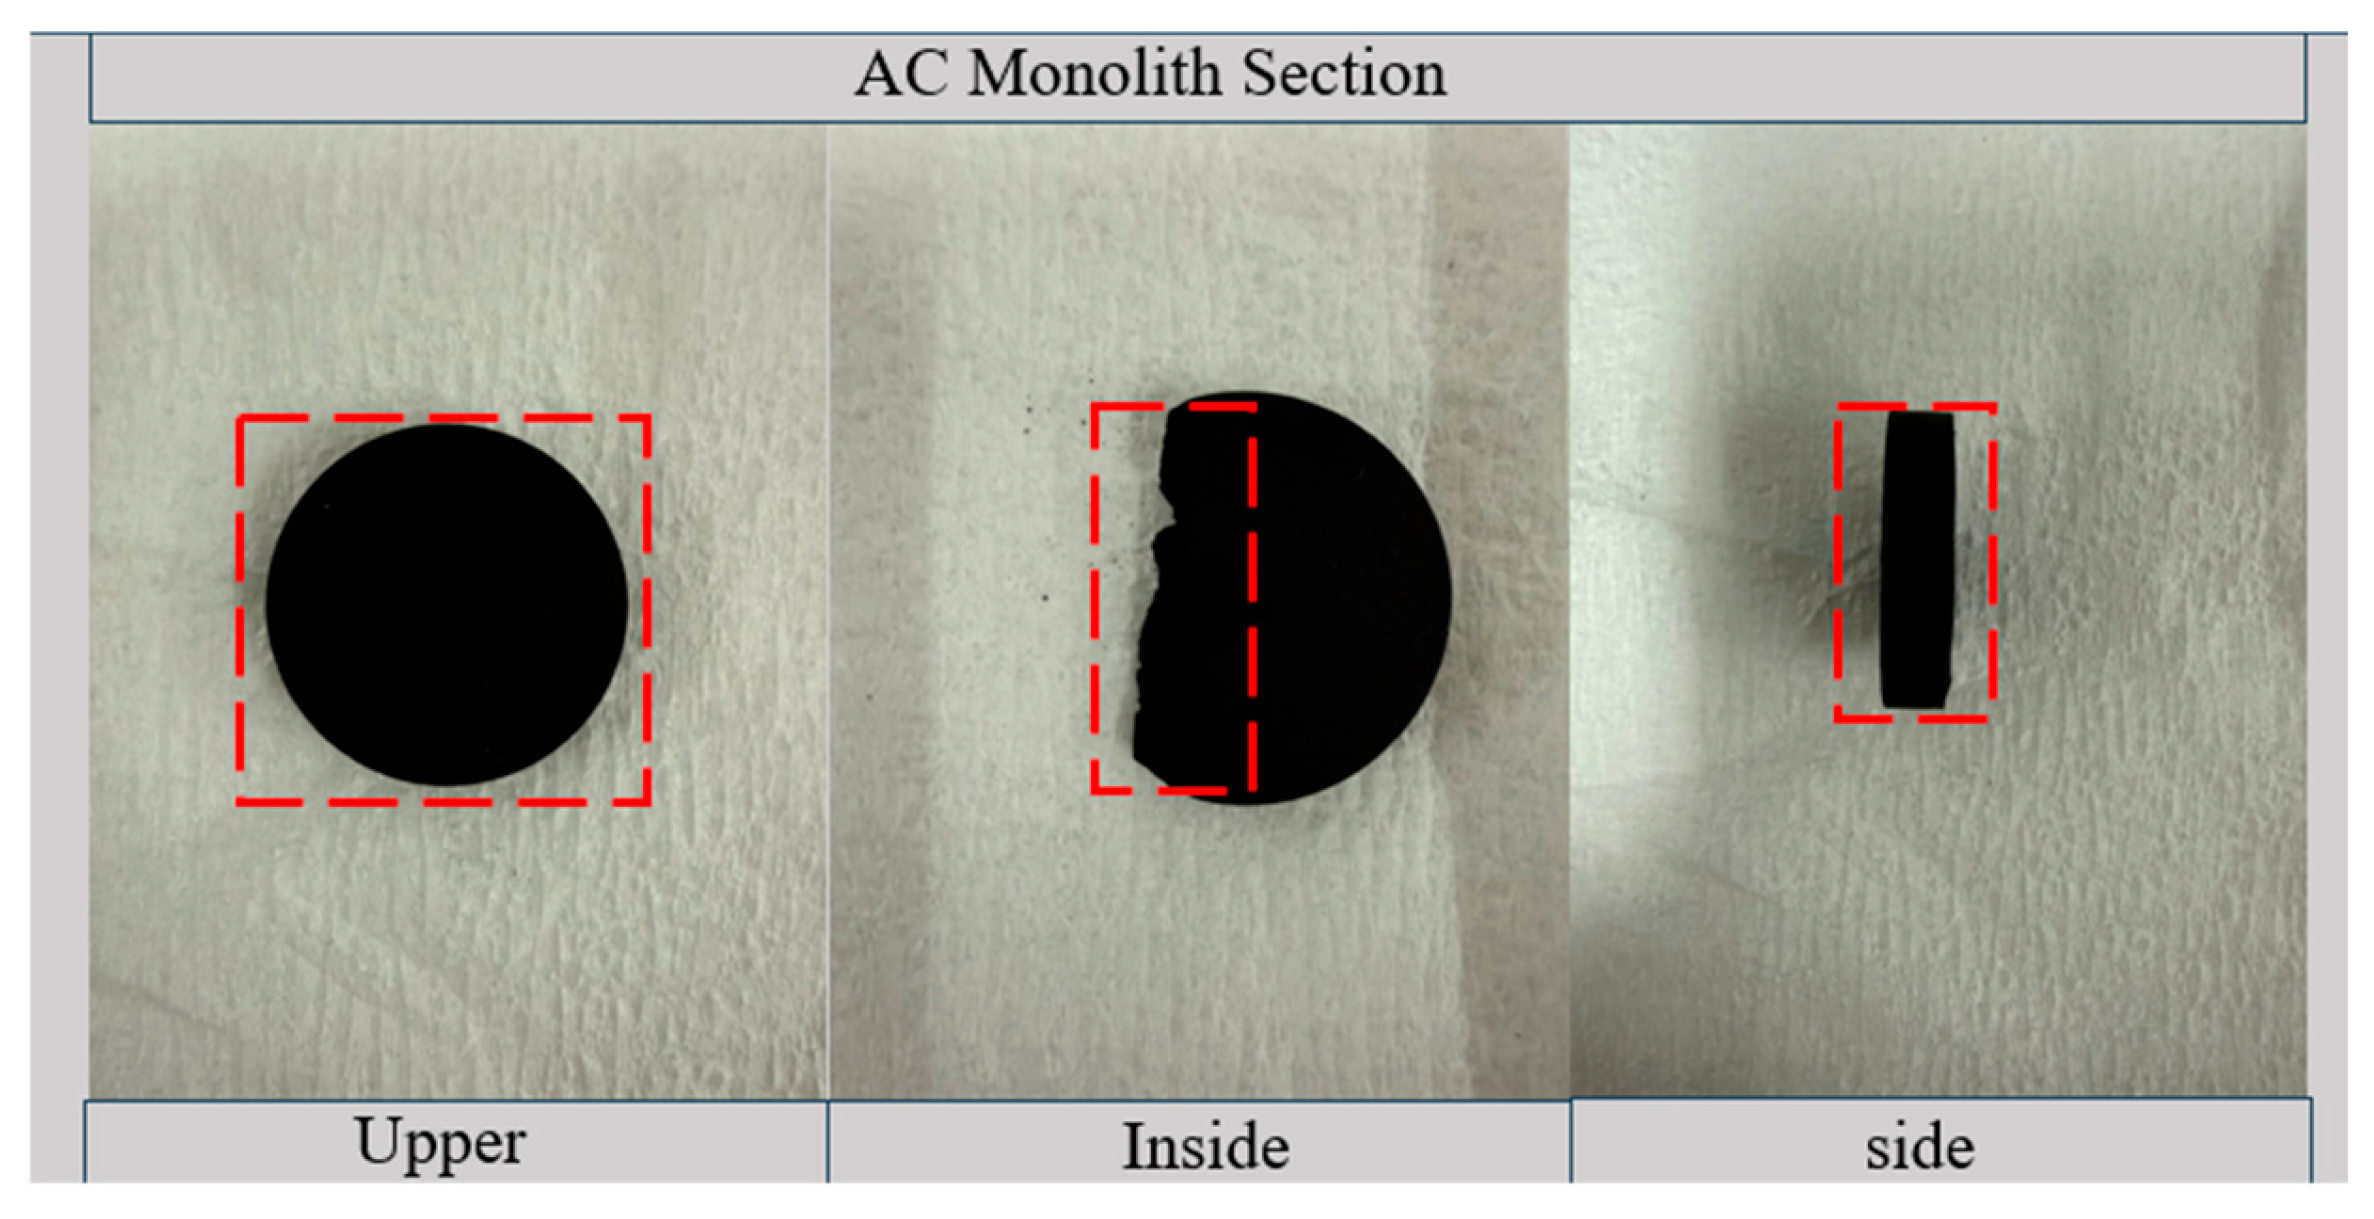
Figure 3 presents the monolith divided into upper, side, and inside sections to examine the surface and internal microstructure of the activated carbon, along with the distribution of elemental composition. This analysis was used to evaluate structural uniformity and elemental distribution within the monolith. The results provide insight into whether the molding and binder distribution processes produced consistent internal architecture, which is critical for ensuring uniform mechanical stability and adsorption performance.
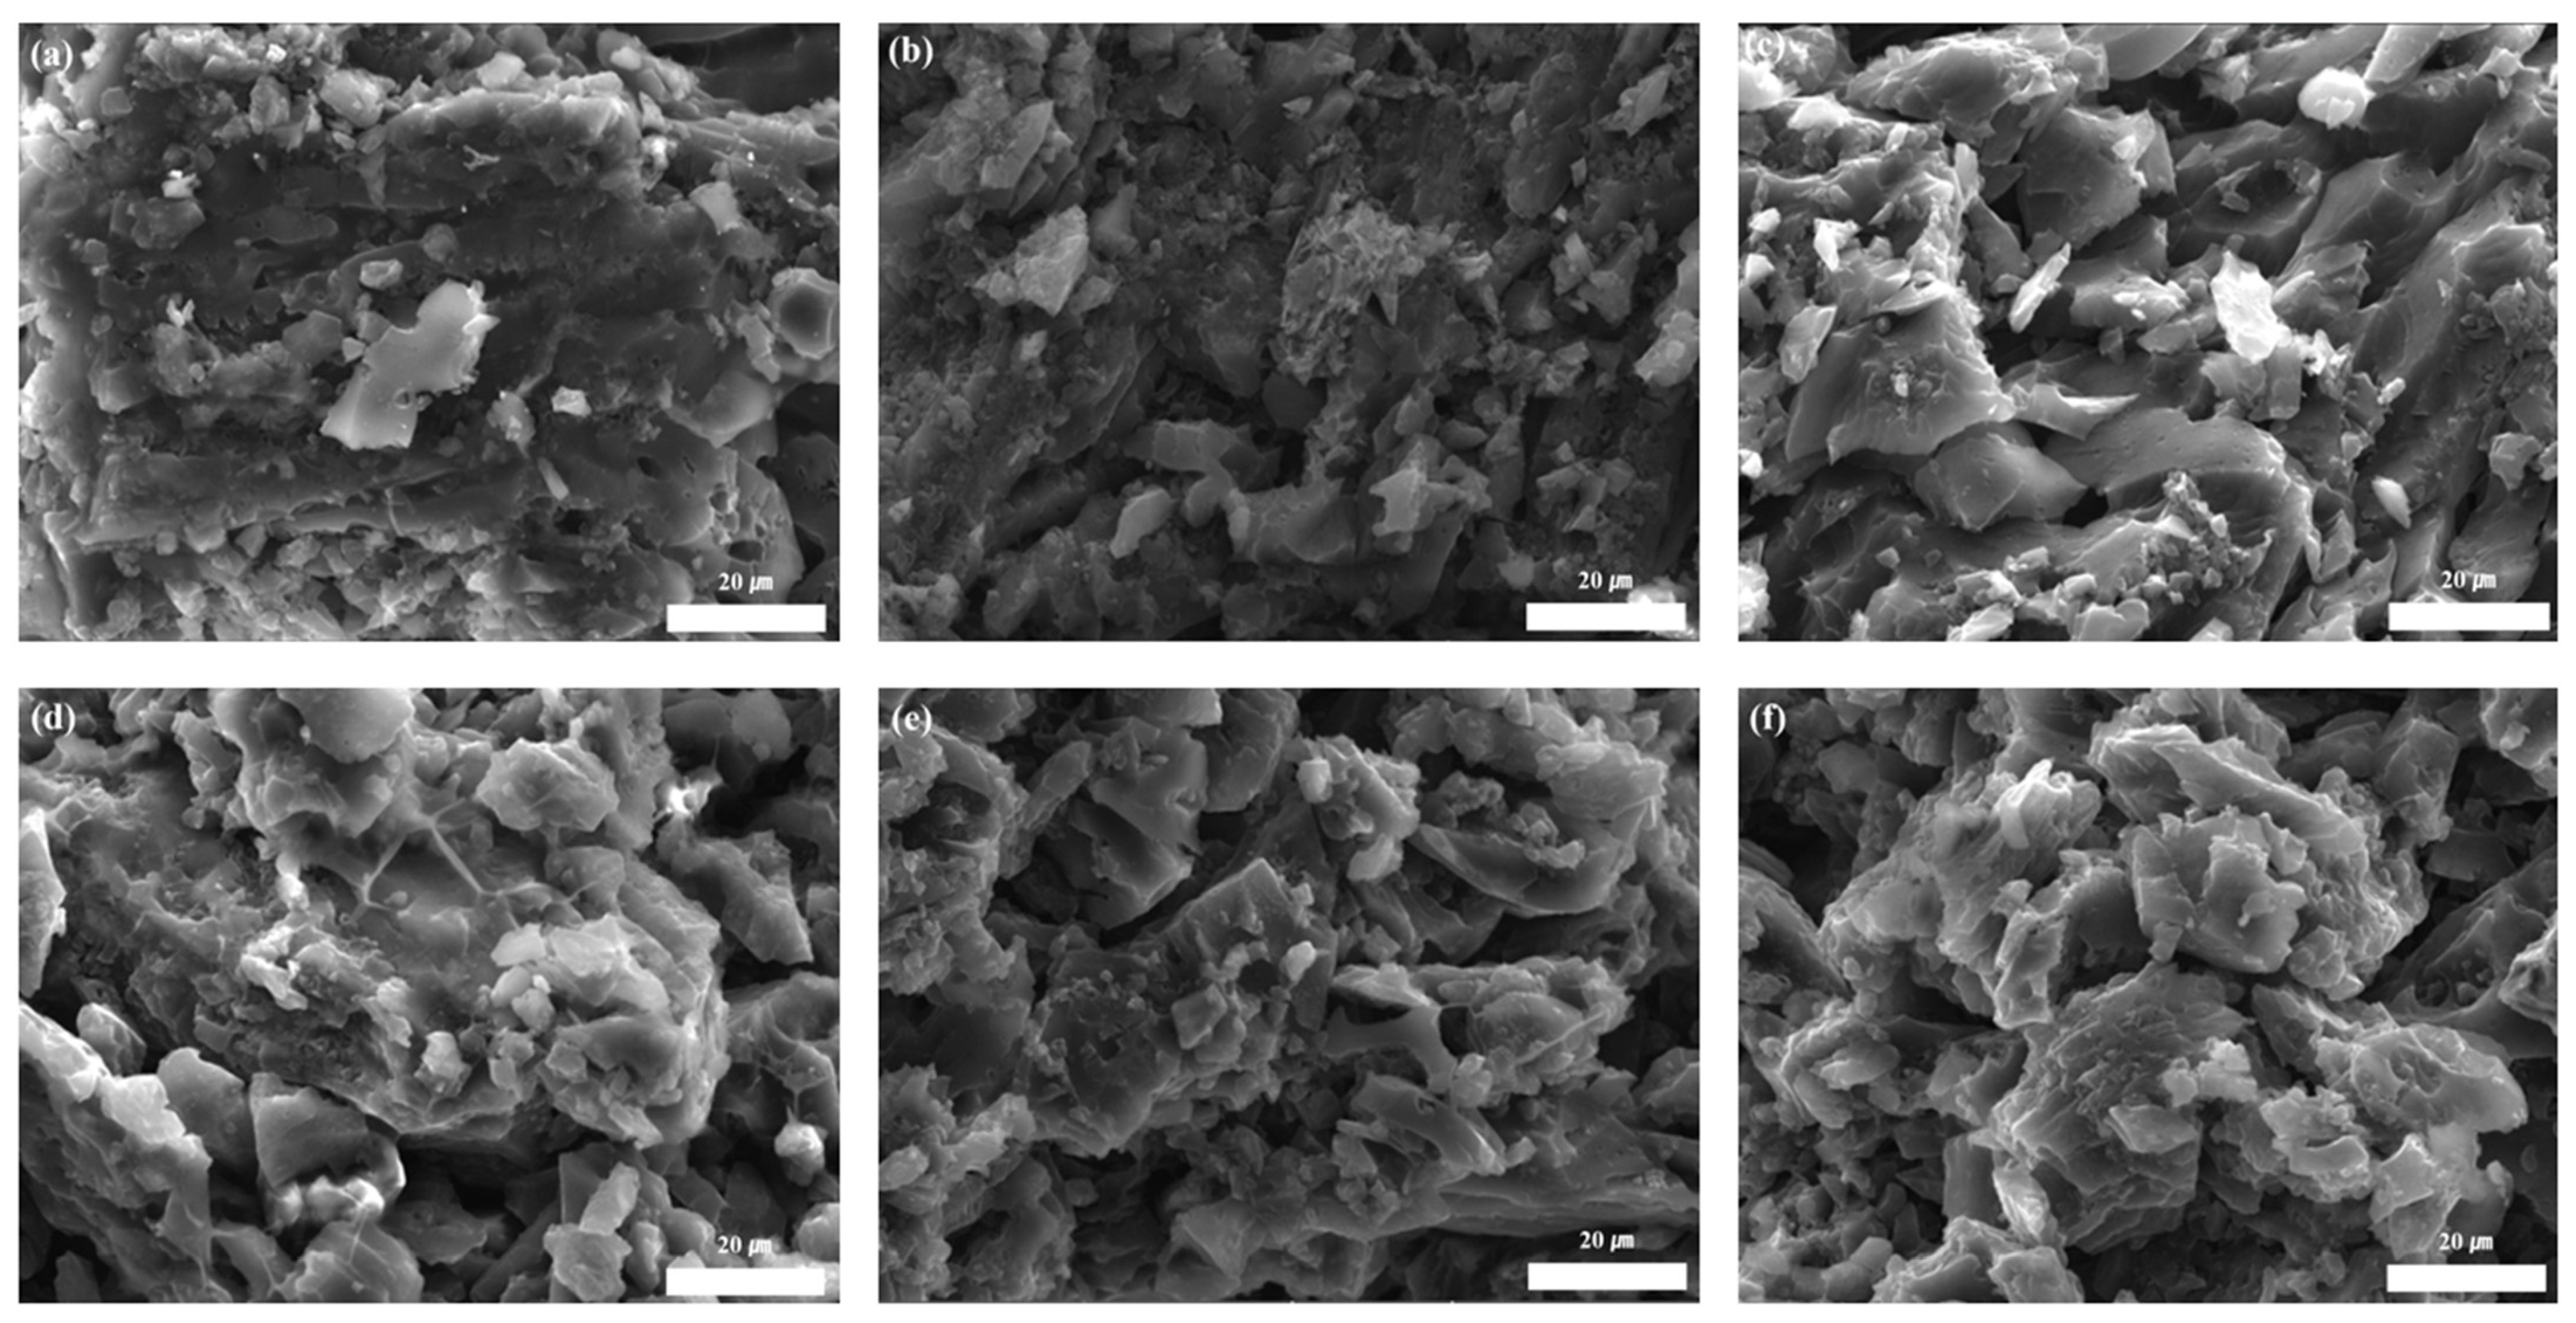
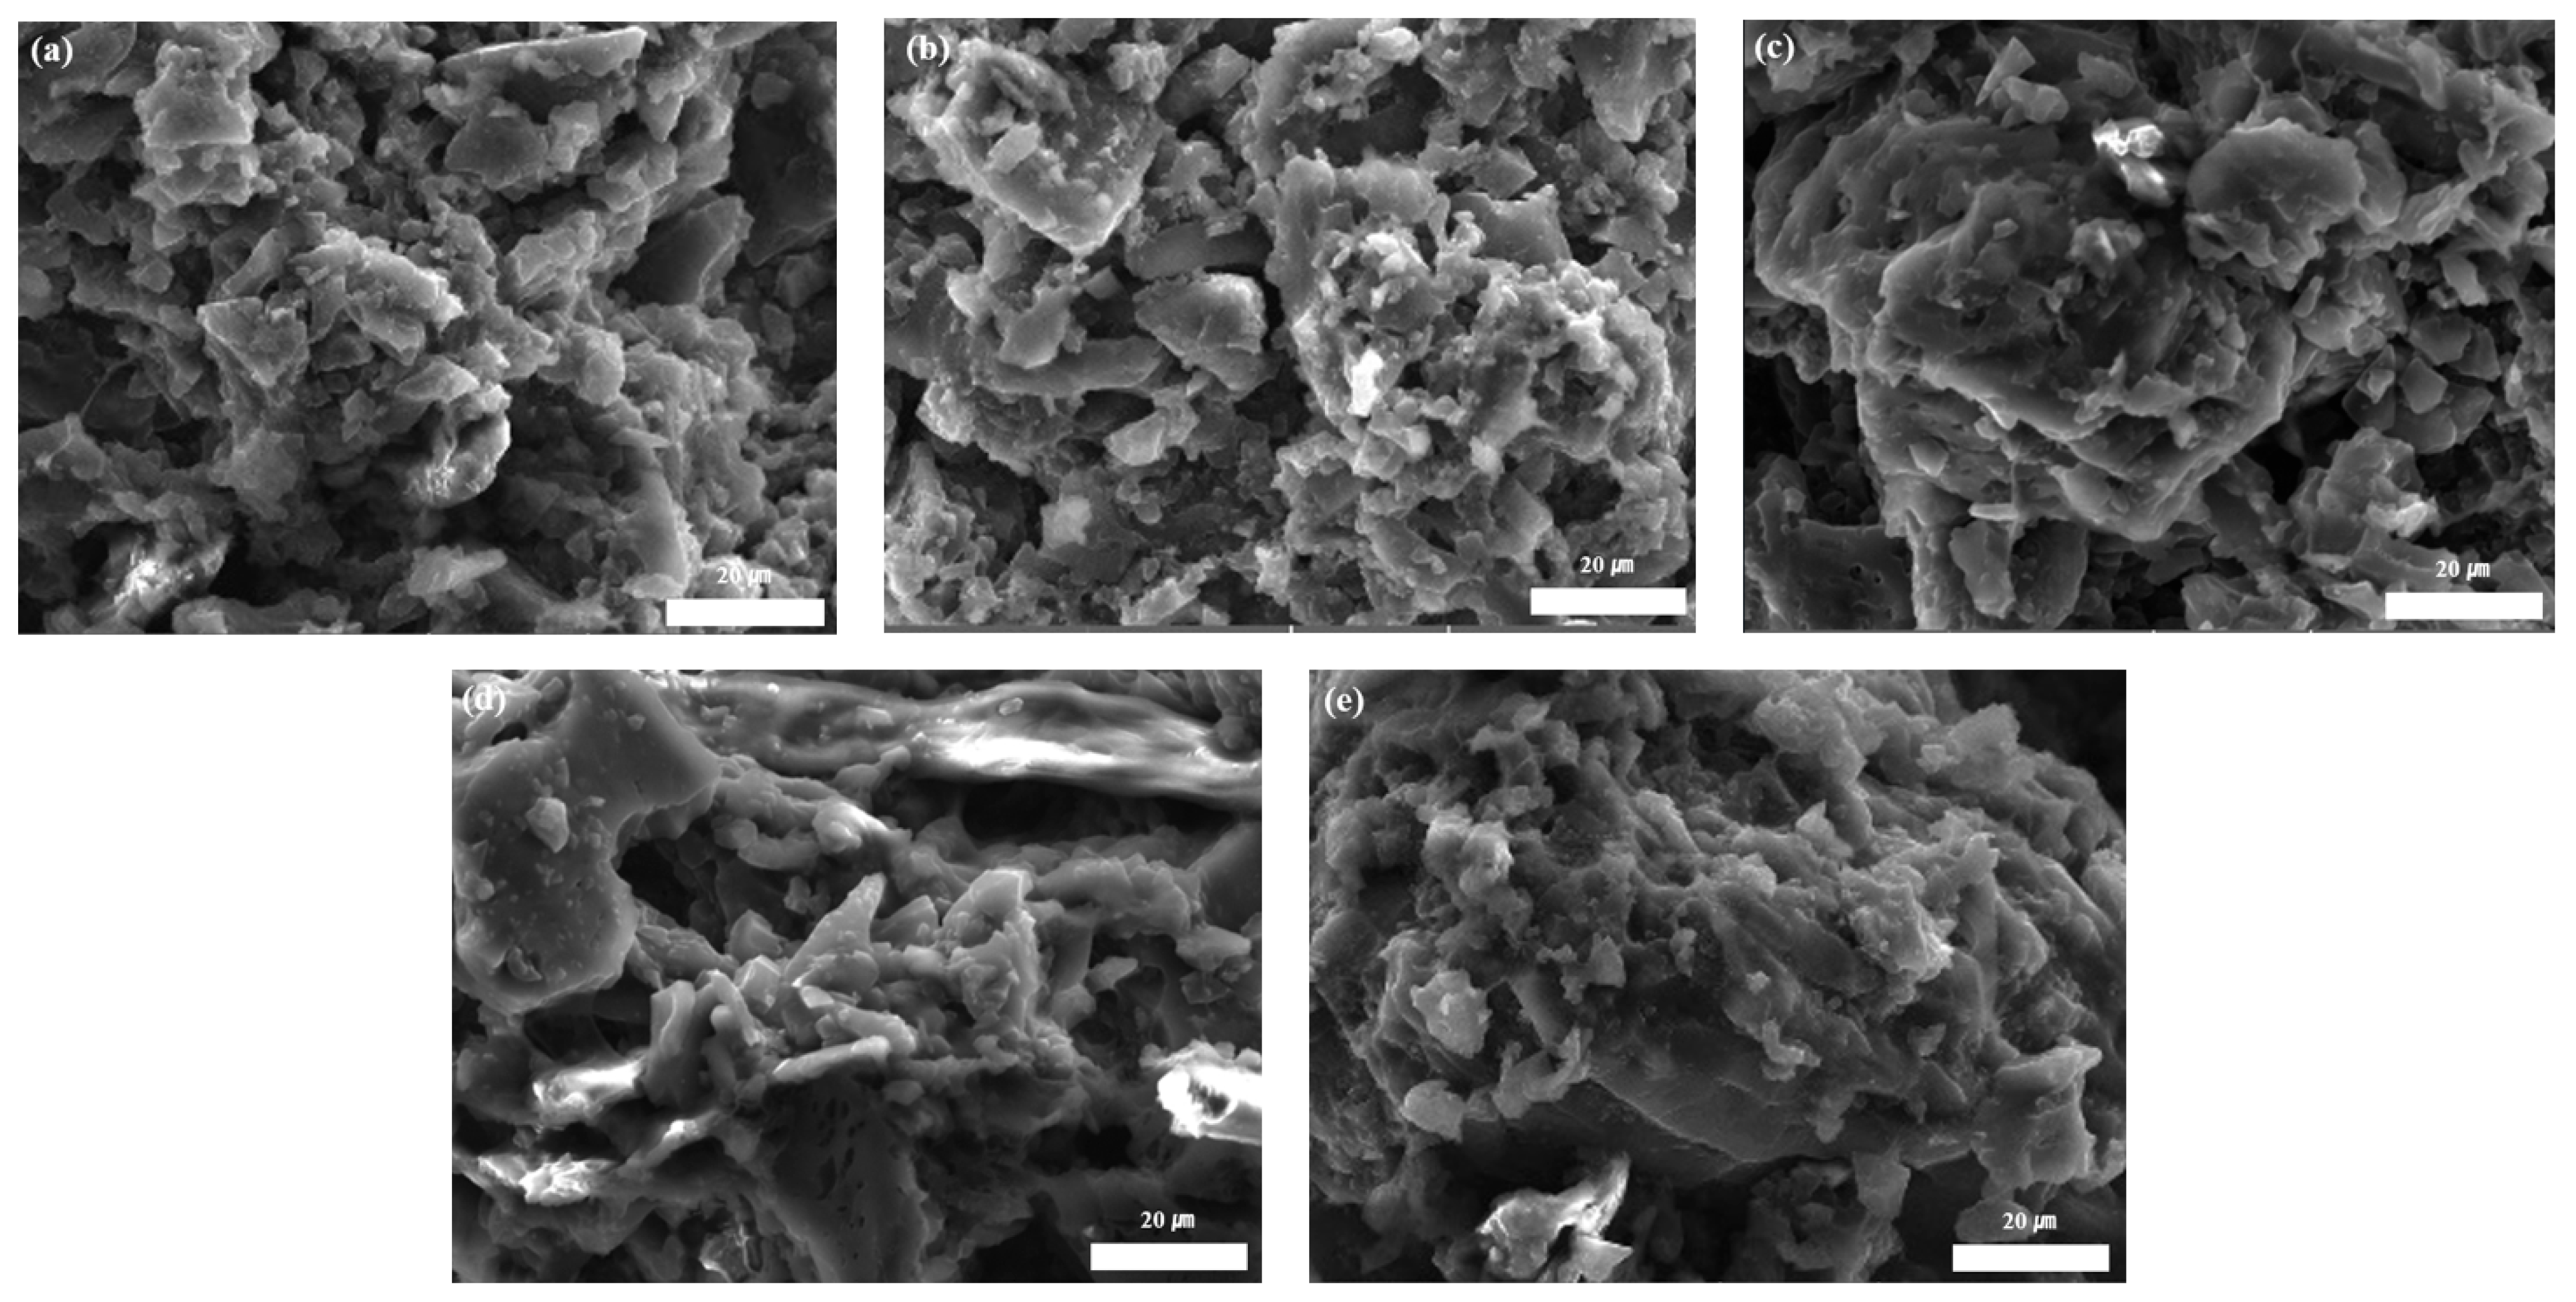
To evaluate microstructural variations among the fabricated monoliths, the inside sections were compared as shown in
Figure 4. The central region was selected as the representative observation area because it experiences relatively uniform pressure transfer during the molding process. This minimizes edge-induced structural artifacts and enables a more reliable comparison of the effects of particle size blending and binder content on internal architecture.
Figure 5 illustrates the microstructural variations in the monoliths as a function of binder-to-AC ratio (H, M, and L). In the case of the H binder condition, excessive binder loading partially occluded the pore network, thereby hindering gas diffusion and reducing the accessible surface area available for adsorption. In contrast, the L binder condition, identified as the optimized formulation for monolith fabrication, preserved a more open and interconnected porous structure. Despite the reduced binder content, sufficient inter-particle cohesion was maintained to ensure structural integrity without significantly sacrificing effective surface area. This balance between structural cohesion and pore accessibility is critical for achieving enhanced adsorption kinetics while retaining the mechanical stability required for practical ANG applications.
Figure 6 depicts the microstructural evolution of the mixed monoliths as a function of particle size blending ratio. The M50ML sample, and to a lesser extent M30ML and M70ML, exhibited relatively homogeneous pore distributions due to effective synergistic packing between coarse and fine particles. In contrast, the asymmetrical blending ratios M10ML and M90ML displayed highly heterogeneous internal structures, characterized by uneven interstitial filling and localized void formation. This structural non-uniformity reduced packing coherence and ultimately compromised the mechanical stability of these extreme compositions.
3.4. Monolith EDS Analysis
Table 5 summarizes the elemental compositions of the monoliths obtained from EDS analysis, highlighting variations in carbon and oxygen content as a function of binder loading and particle size blending ratio. The results show that the atomic ratios were strongly influenced by binder content. As the binder level decreased from H to L, the carbon fraction increased, whereas the oxygen fraction correspondingly decreased. This trend can be attributed to the chemical characteristics of the organic binder, which contains abundant oxygen-bearing functional groups. Therefore, reducing the binder content led to a lower oxygen contribution and a higher relative proportion of the carbonaceous framework derived from the activated carbon. These compositional trends confirm that binder loading was effectively controlled during fabrication and that the elemental distribution reflects the intended formulation design.
However, EDS has limitations as a semi-quantitative and localized surface analysis technique. Because EDS measures elemental composition only at specific points, it cannot completely analyze the uniform composition of the entire monolith. This limitation is evident in the M70ML sample, which exhibited an unusually high oxygen content (29.80 atomic%). This significant deviation is likely due to binder accumulation or structural heterogeneity at specific measurement points, rather than a uniform distribution throughout the material.
3.5. Monolith XPS Analysis
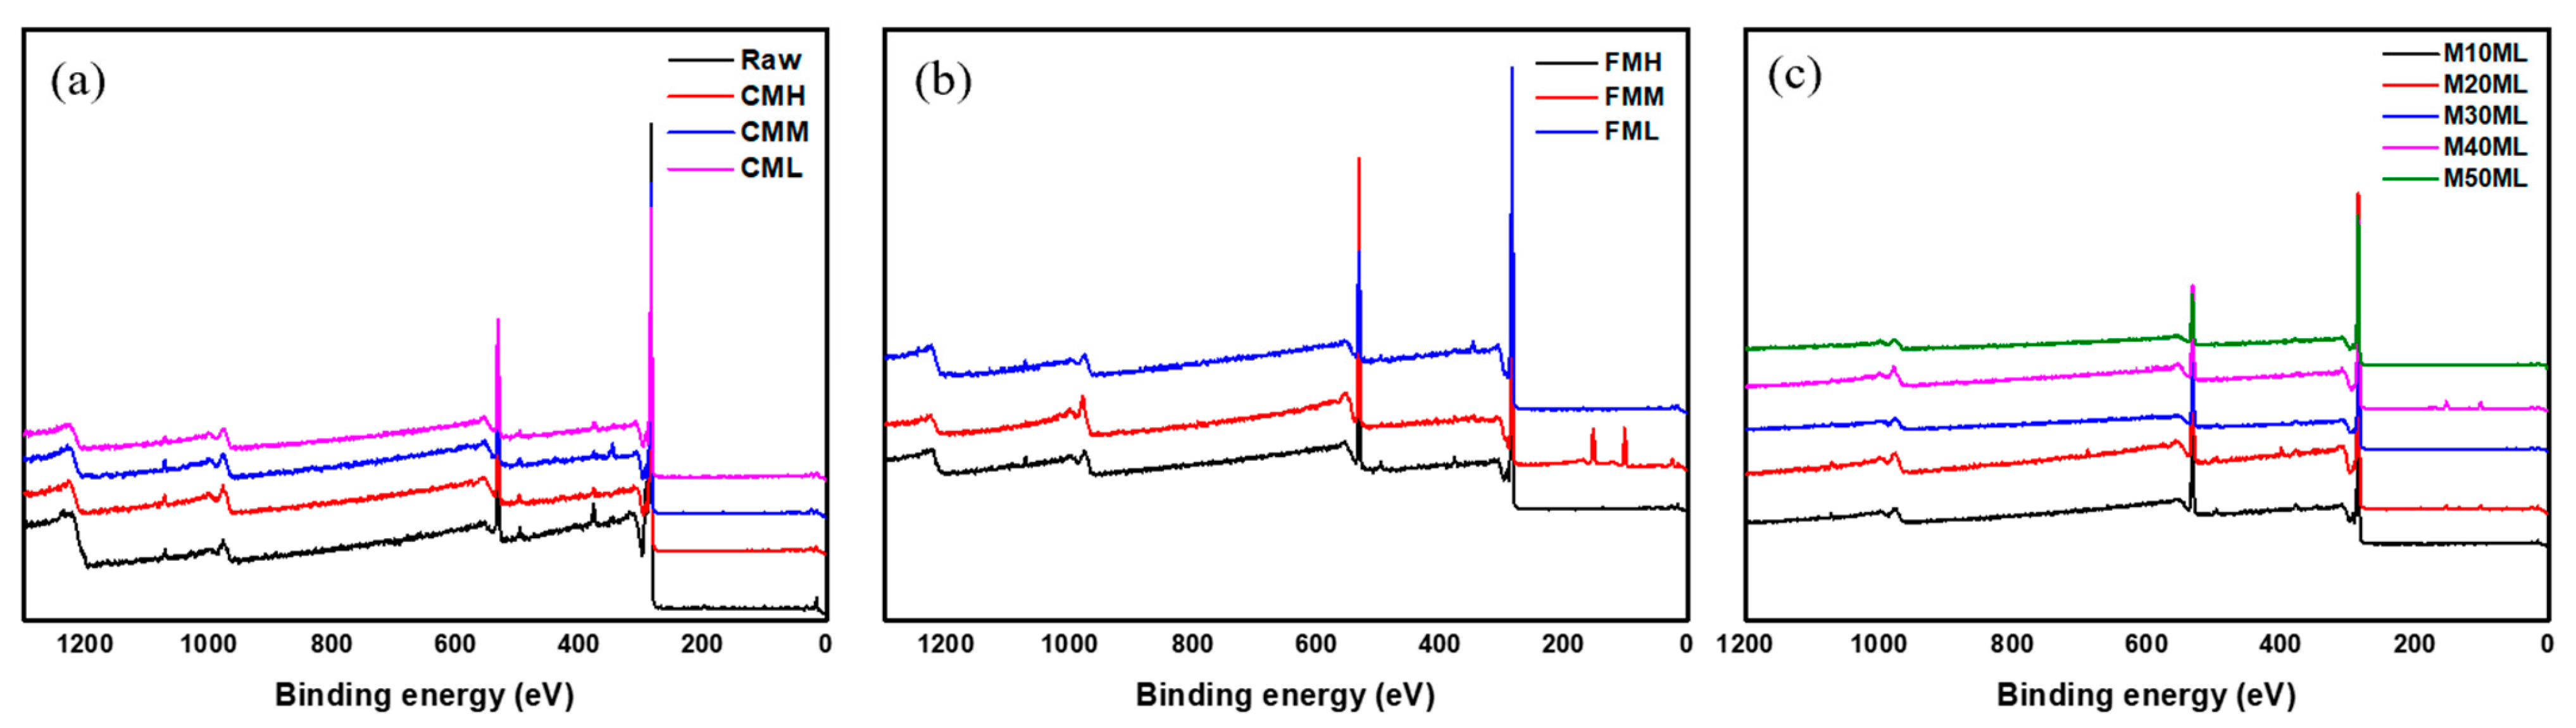
Figure 7 and
Table 6 present the XPS analysis results of monoliths fabricated with varying binder contents under identical particle size conditions, as well as those prepared with different particle size blending ratios. The XPS analysis presented in this study is primarily based on survey spectra to examine compositional variations associated with binder content and particle size blending. Therefore, the interpretation focuses on relative atomic percentage changes rather than detailed functional group assignments. In all samples, distinct peaks corresponding to C1s (≈284.8 eV) calibrated to the C-C/C=C adventitious carbon peak and O1s (≈532.0 eV) were clearly observed, confirming the presence of carbonaceous species and an oxygen-rich surface layer [
36]. The O1s peak intensity exhibited a positive correlation with binder content, which can be attributed to the increased incorporation of the oxygen-rich liquid binder onto the monolith surface during fabrication. Conversely, samples with lower binder loading showed relatively higher C1s peak intensity, indicating that the intrinsic carbon framework of the activated carbon was more effectively preserved. Surface composition was also influenced by the particle size blending ratio. An increased proportion of fine particles resulted in a higher O1s fraction and a corresponding decrease in C1s content. This suggests that the larger external surface area of fine particles enhances the exposure of oxygen species. In contrast, increasing the coarse particle fraction generally led to a higher C1s ratio and reduced O1s concentration. However, certain compositions deviated from these overall trends, exhibiting anomalously high O1s and low C1s values. This deviation is attributed to localized binder accumulation during the molding process. These results are consistent with the EDS findings and demonstrate that uniform binder distribution during fabrication is a critical factor governing the final physicochemical properties of the monolith.
3.6. Monolith BET Analysis
The specific surface area and pore size distribution, which are key parameters governing gas adsorption capacity, were evaluated using N
2 adsorption–desorption isotherms measured at 77 K.
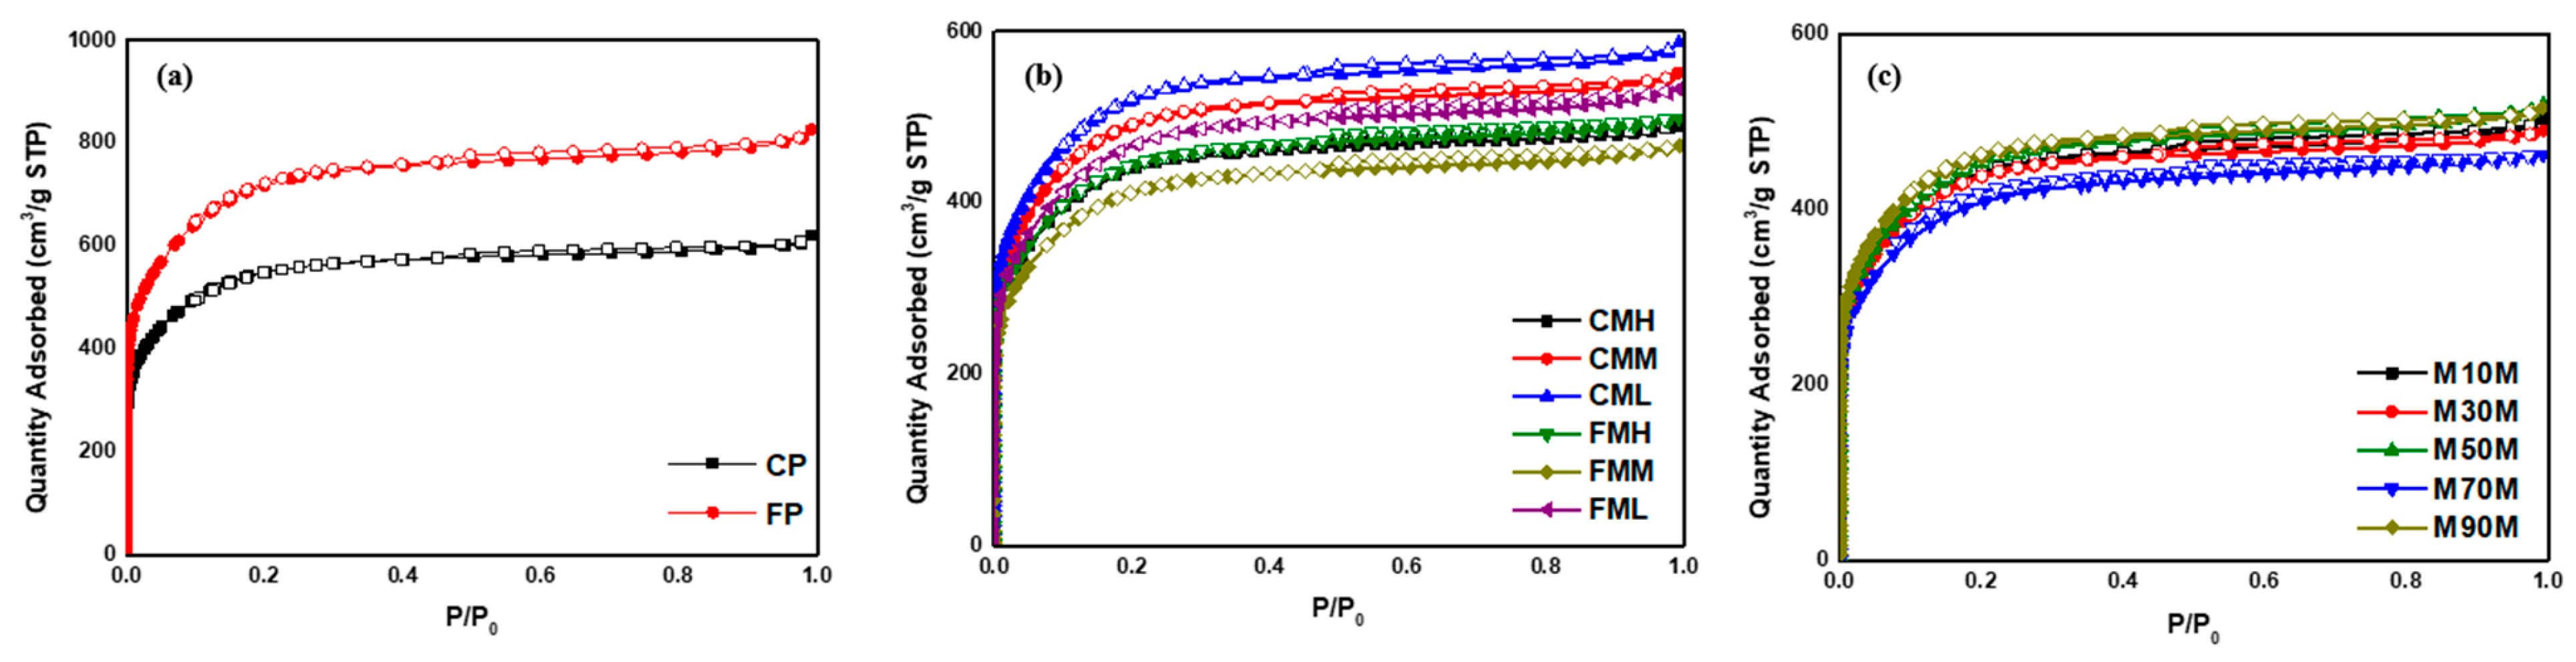
Figure 8 presents the isotherms of the samples as a function of particle size, binder content, and blending ratio. All samples exhibited Type I isotherms according to the International Union of Pure and Applied Chemistry (IUPAC) classification, indicating predominantly microporous structures [
37]. The BET specific surface areas are summarized in
Table 7. For powdered activated carbon, the fine fraction exhibited higher specific surface area than the coarse fraction. This behavior is attributed to the increased external surface area and enhanced accessibility of micropores in the smaller particle fraction. For the monolithic samples, both specific surface area and total pore volume generally decreased with increasing binder content. This reduction can be explained by partial pore occlusion, where the binder blocks micropore entrances and reduces the effective adsorption surface area [
38]. Notably, the L binder condition maintained the highest specific surface area, whereas the H binder condition showed the lowest, demonstrating that minimizing binder loading is essential for preserving microporosity and optimizing adsorption performance. Interestingly, the mixed monoliths did not exhibit substantial differences in specific surface area compared to single-size monoliths. This result suggests that particle size blending primarily influences macroscopic packing density rather than intrinsic micropore architecture.
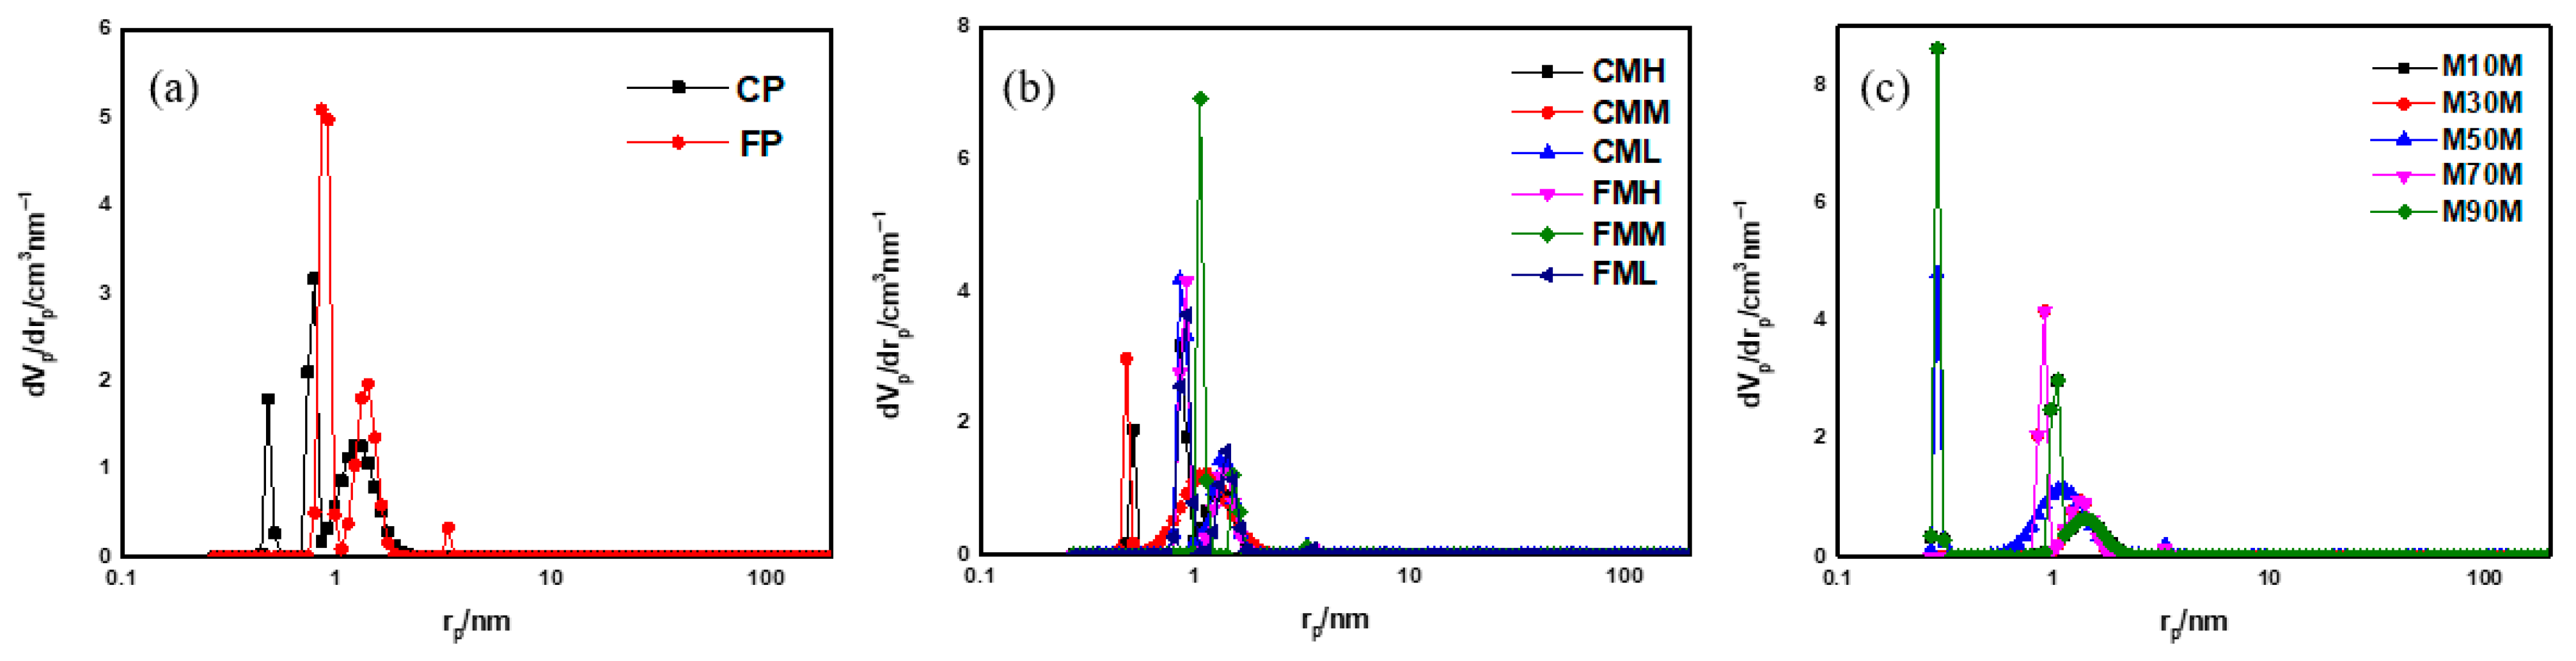
Figure 9 further confirms the dominance of microporosity in all samples, with negligible pore volume contribution in the mesopore and macropore ranges. These findings are consistent with the Type I isotherm characteristics observed in
Figure 8.
3.7. Monolith Density Analysis
The mass of each monolith was measured, and its radius and height were determined in five replicates using a Vernier caliper to ensure measurement reproducibility. The density of each sample was subsequently calculated based on the cylindrical volume, and the results are summarized in
Table 8.
Comparison of the calculated densities revealed that the mixed-particle monoliths, particularly M30ML, M50ML, and M70ML, exhibited higher packing densities than the single-particle monoliths. This enhancement is attributed to improved packing efficiency, in which fine particles effectively occupy the interstitial voids formed between coarse particles [
39]. At these intermediate blending ratios, the particle fractions act synergistically to maximize structural density. In contrast, the extreme blending ratios M10ML and M90ML did not show comparable density improvements and displayed relatively lower packing efficiency. These results suggest that an excessive proportion of either fine or coarse particles disrupts uniform interstitial filling, increases structural heterogeneity, and ultimately limits the formation of a high-density framework.
3.8. Monolith Compressive Strength Analysis
Mechanical strength is critical for the practical application of carbon monoliths in ANG systems, where repeated adsorption and desorption occur within confined storage environments [
40]. In real operational conditions, the adsorbent bed is continuously exposed to external mechanical stresses such as vibration and shock, as well as internal stresses induced by cyclic pressure variations during charging and discharging. If the monolith lacks sufficient mechanical stability, it may undergo pulverization and gradual fragmentation into fine particles. Such structural degradation not only reduces packing density but may also cause operational failures, including clogging of filters, valves, and pipelines, thereby compromising system safety and long-term reliability. Therefore, high structural integrity must be maintained to withstand these mechanical stresses while preserving the designed porous architecture.
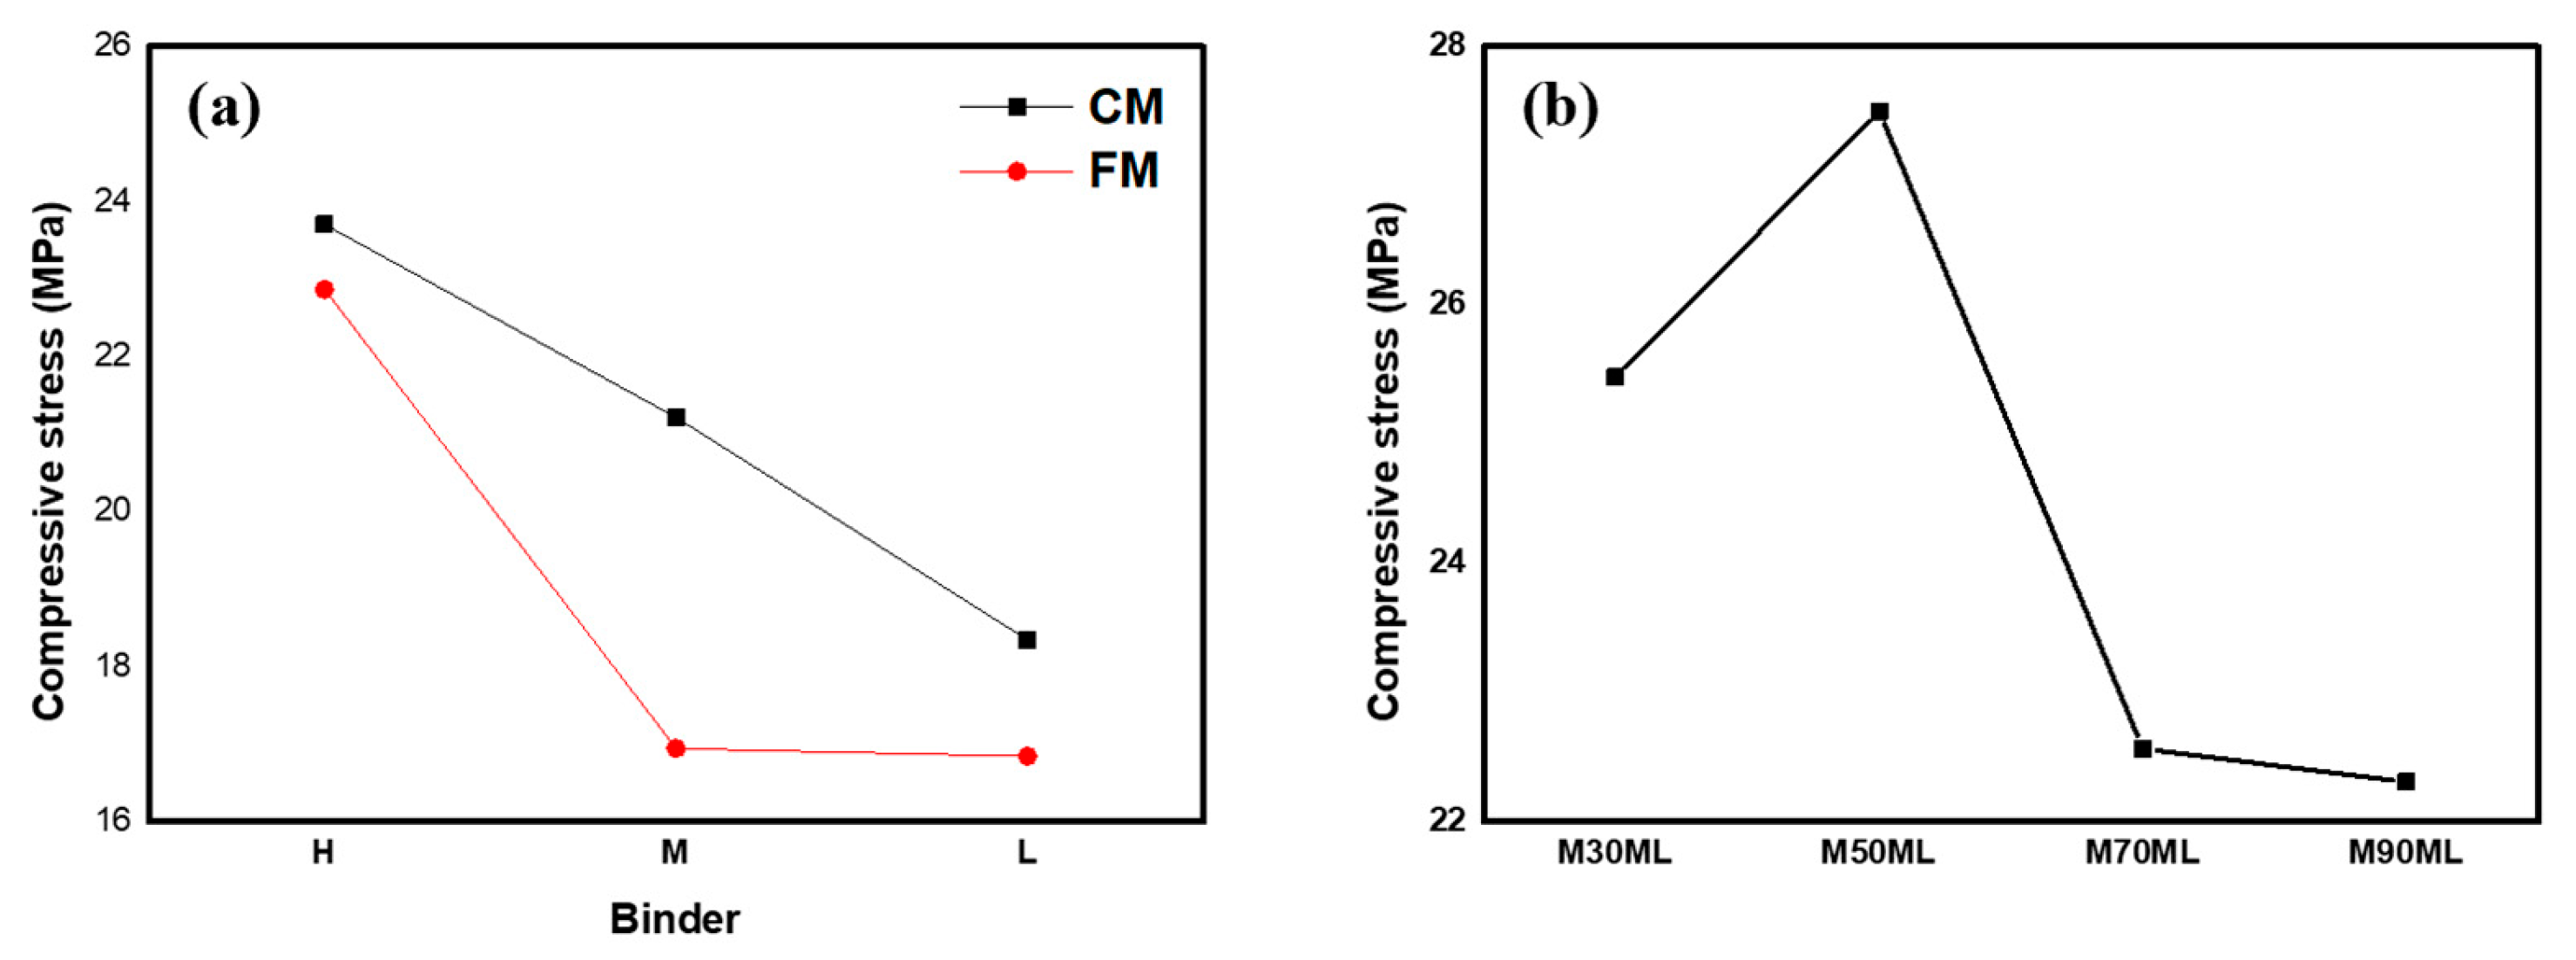
Figure 10 and
Table 9 present the compressive strength of the monoliths as a function of binder ratio (L, M, and H) and particle size blending ratio. As shown in
Figure 10a, under identical particle size conditions, compressive strength increased progressively with increasing binder content from L to H. This trend reflects the role of the binder in strengthening inter-particle cohesion, where the H binder ratio provided the greatest structural reinforcement, while the L binder ratio exhibited the lowest mechanical resistance. Notably, despite this general dependence on binder content, optimized mixed-particle samples with low binder loading exhibited significantly higher compressive strength than single-particle samples formulated with the highest binder content.
Figure 10b illustrates the influence of particle size blending ratio at a fixed binder level to further explain this structural advantage. To ensure the reproducibility of the results, compressive strength measurements were repeated multiple times. The highest compressive strength was observed for M50ML, which is attributed to optimized packing efficiency in which fine particles effectively fill the interstitial voids between coarse particles.
In contrast, extreme blending ratios exhibited reduced strength and highly unstable molding behavior. The extreme blending ratio samples (M10ML and M90ML) exhibited unstable molding behavior, and consistent measurements were difficult to obtain. Nevertheless, compressive strength values were obtained from several successfully prepared specimens, and these results are reported in
Table 9. While M90ML maintained a measurable, albeit reduced, mechanical resistance, M10ML consistently yielded an extremely low, nearly negligible compressive strength (0.472 MPa). Due to the nature of compressive strength, which relies on dense internal structures to withstand pressure, this near-complete structural failure of M10ML is attributed to the fact that its specific particle size distribution failed to effectively fill the interstitial voids. This led to insufficient inter-particle contact and immediate structural collapse under even minimal compression. A comparison between single-particle and mixed-particle monoliths further indicates that mixed systems generally exhibit superior mechanical robustness. These results demonstrate that optimization of particle size distribution is not only essential for maximizing packing density but also plays a decisive role in enhancing mechanical stability, effectively compensating for reduced binder loading under L or M conditions.
3.9. Methane Adsorption Analysis
Based on the physicochemical characterization results, the M50ML sample showed the most balanced structural properties among the prepared samples. It maintained relatively high specific surface area and micropore volume while also showing high structural density and compressive strength. This indicates that M50ML provided the most favorable balance between packing density and pore preservation among the samples examined in this study. The methane adsorption behavior of the prepared samples is presented in
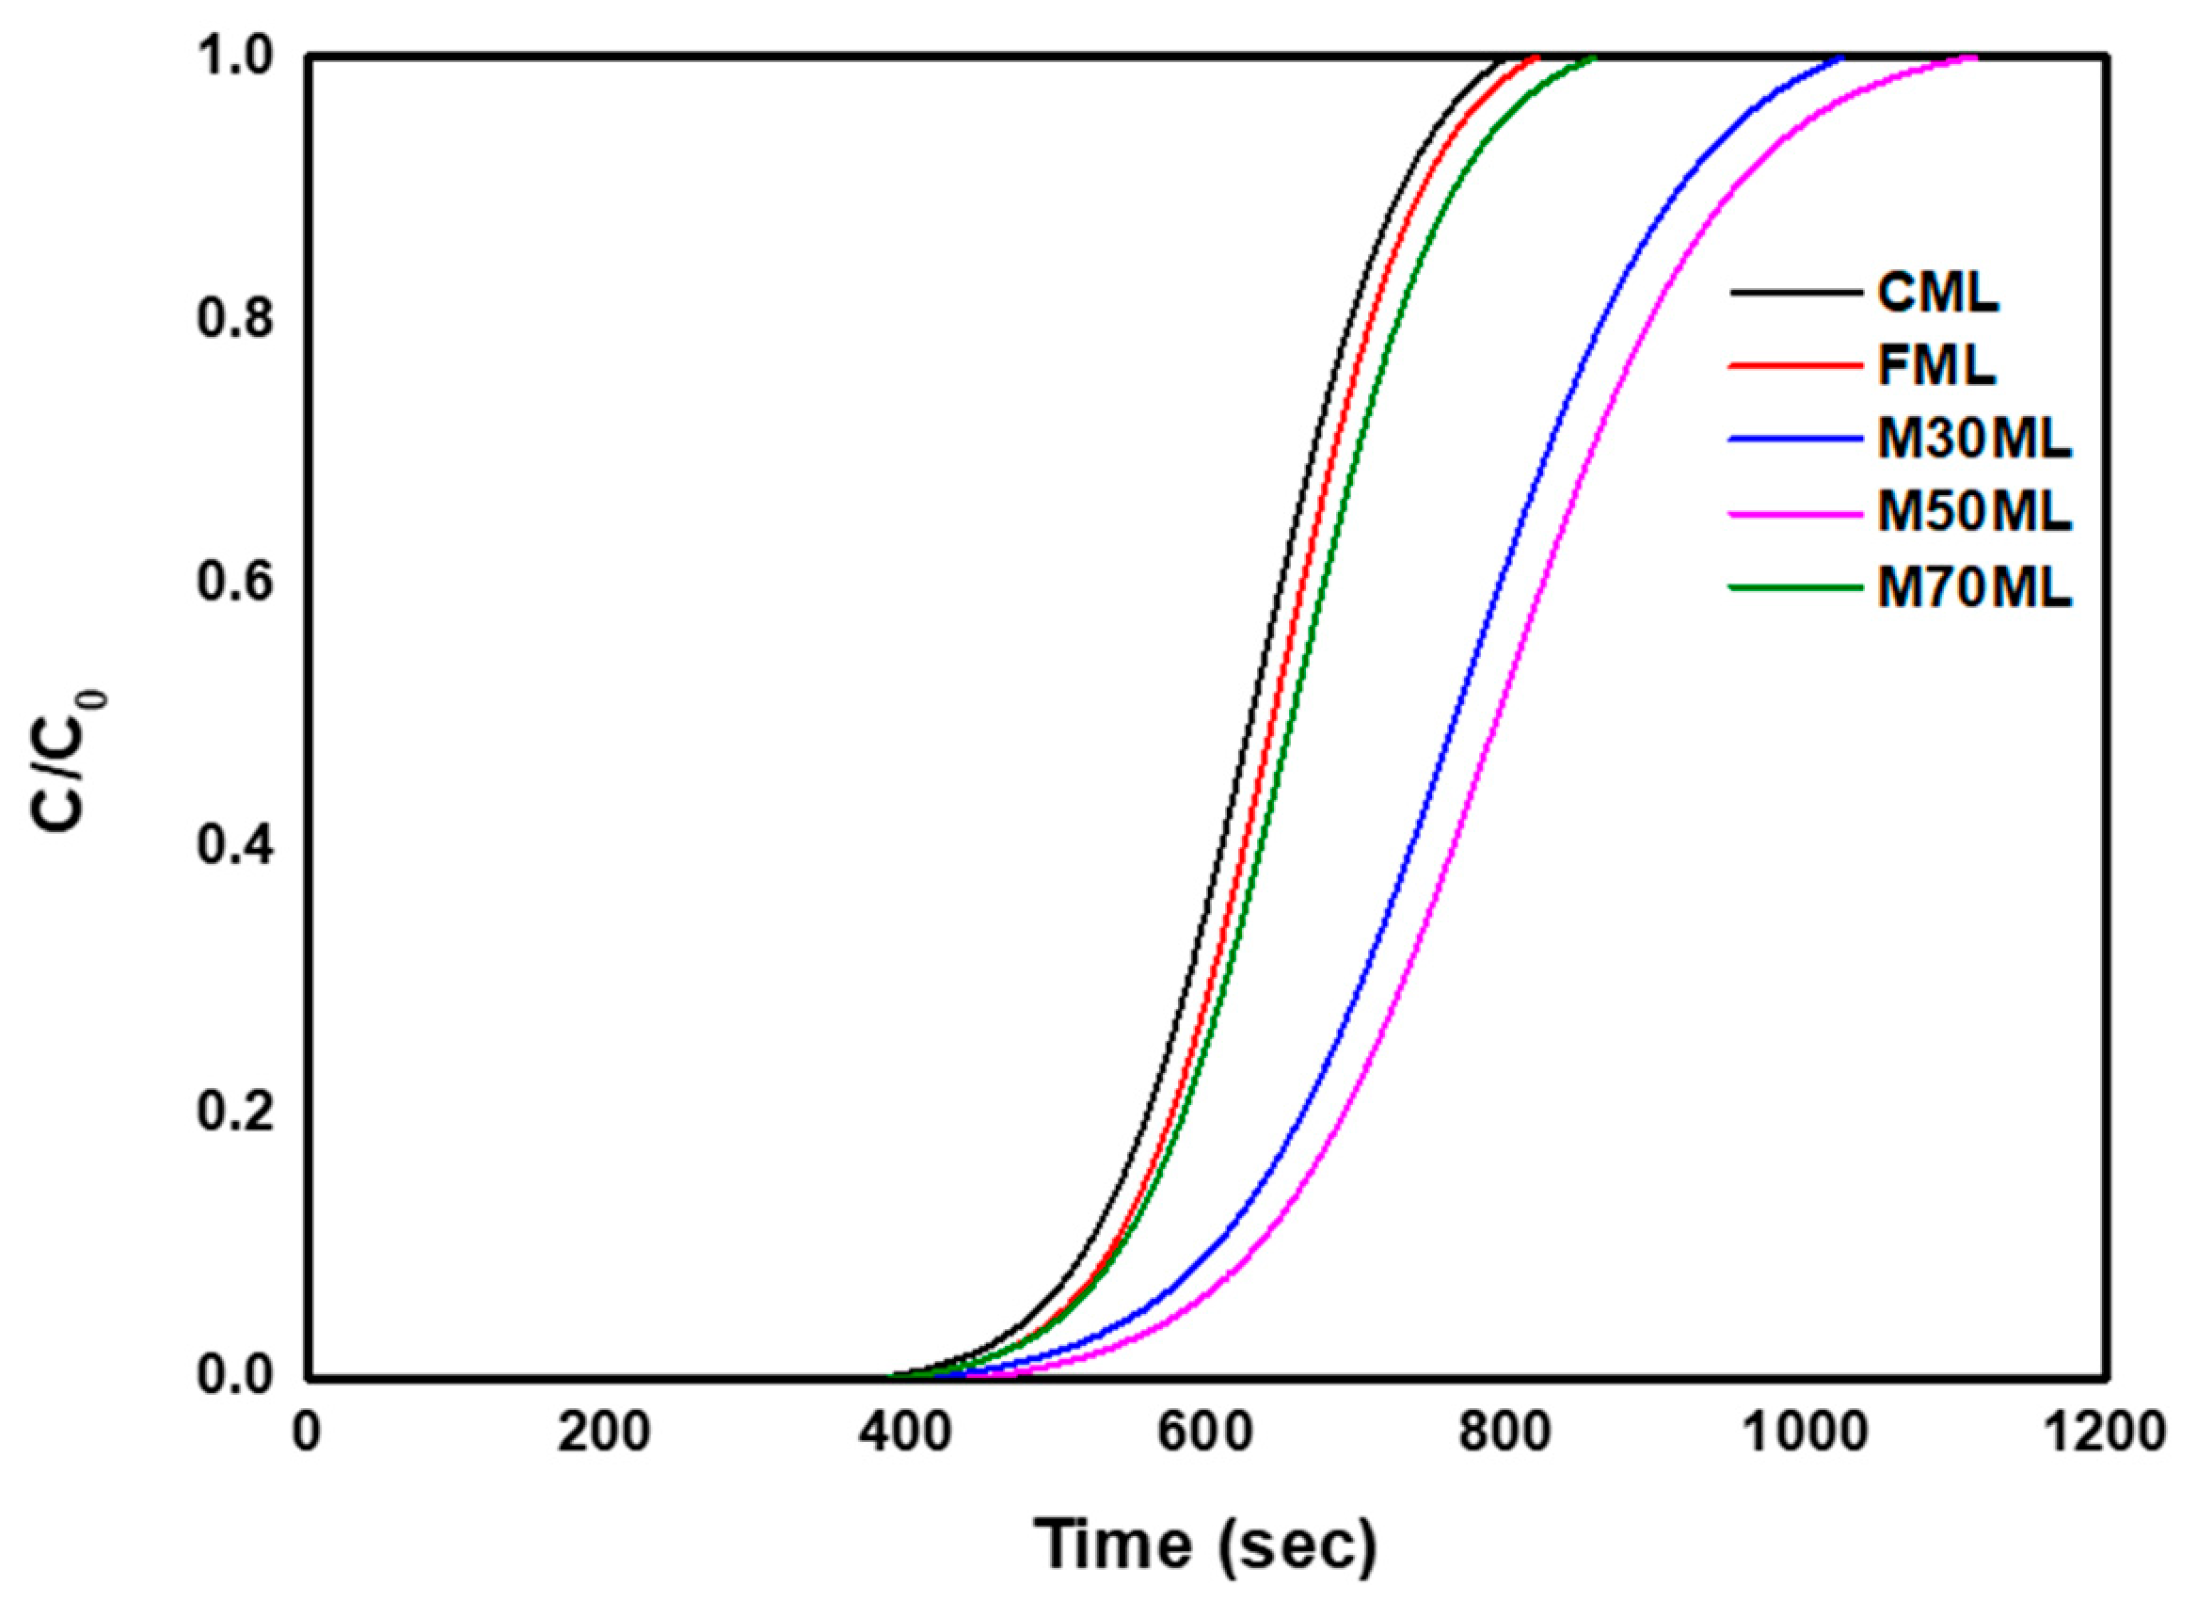
Figure 11 and
Table 10. In the breakthrough curves, lower C/C
0 values and delayed breakthrough indicate higher methane uptake in the packed bed under the present test conditions. The mixed-particle samples (M30ML, M50ML, and M70ML) showed delayed breakthrough compared with the single-particle samples (CML and FML), indicating higher methane uptake under the present screening conditions.
The adsorption performance was evaluated based on the C/C
0 ratio, total removal (
mtotal), removal rate (
Rtotal), and adsorption per unit mass (
qtotal). The data were calculated using the following Equation (1) [
41]:
where
ttotal represents the total operating time (min) and
Q represents the flow rate (cc/min). The total adsorption capacity (
qtotal) is calculated using Equation (2) [
42]:
where
Cad represents the concentration of methane gas adsorbed on the monolith.
The total methane gas inlet into the column (
mtotal, mg) is calculated using Equation (3) [
43]:
The total methane gas removal (
Rtotal, %) is calculated using Equation (4) [
44]:
The mass transfer zone (
MTZ),
Zm, is defined as follows (5) [
45]:
where
Zm is the length of the
MTZ (cm),
Z is the bed height (cm),
t0.05 is the time at the breakthrough (min), and
t0.95 is the time at saturation (min). The column usage of the fixed-bed column adsorption device (
f) is defined as follows (6) [
45]:
Under the present screening conditions, the mixed-particle samples generally showed higher methane uptake than the single-particle samples. The MTZ analysis also showed bed utilization values close to 80% for most samples, indicating that the packed bed was used relatively effectively during this preliminary test. This tendency appears to be related to improved packing efficiency by particle size blending, which affected the accessible pore structure of the packed material. However, because the adsorption test was carried out using pulverized monolith samples, these results should be interpreted as composition-based material adsorption behavior, not as the adsorption performance of the intact monolithic body. Therefore, the differences among samples should be interpreted qualitatively. Because the methane adsorption test was conducted without replicates, the differences among samples should be interpreted qualitatively.
Among the tested samples, M50ML showed the highest methane adsorption capacity of 3.06 mg/g. This result is consistent with the structural characterization results. As shown in
Table 7, M50ML maintained a relatively high specific surface area (1675.2 m
2/g) and micropore volume (0.77 cm
3/g), indicating that the selected particle size blending condition preserved microporosity without severe pore blockage during monolith fabrication. At the same time,
Table 8 shows that M50ML had a relatively high structural density of 0.544 g/cm
3. Based on this value, the volumetric methane uptake of M50ML can be estimated as approximately 1.66 mg/cm
3 (3.06 mg/g × 0.544 g/cm
3). These results suggest that the balanced combination of pore preservation and structural densification in M50ML was favorable for methane uptake in this screening test.
M30ML also showed relatively high methane adsorption capacity (2.62 mg/g). This result suggests that increasing the fraction of fine particles can improve packing characteristics and maintain effective access to the microporous structure. In contrast, M70ML showed the lowest adsorption capacity among the mixed-particle samples (2.34 mg/g). Consistent with this result, M70ML had the lowest specific surface area (1493.0 m2/g) and micropore volume (0.70 cm3/g) among the mixed samples. This indicates that the structural balance in M70ML was less favorable for methane uptake than in M30ML or M50ML. In addition, partial pore blocking or surface coverage by binder may have further reduced the accessible adsorption sites in this sample.
Overall, the methane adsorption results suggest that particle size blending ratio affected the adsorption behavior of the prepared materials under the present screening conditions. However, these low-concentration tests do not directly represent the performance of intact monoliths or the operating conditions of practical high-pressure ANG systems. Therefore, the present results should be regarded as preliminary material-level screening data that provide a basis for future evaluation of intact monolith performance under practical methane storage conditions.