Article

Economic Assessment Comparison of Biochar and Hydrothermal Biochar Production Processes from Sargassum


Department of Chemistry and Chemical Engineering, Florida Institute of Technology, Melbourne, FL 32901, USA
*
Author to whom correspondence should be addressed.
Processes 2026, 14(15), 2403; https://doi.org/10.3390/pr14152403
Submission received: 12 June 2026 / Revised: 12 July 2026 / Accepted: 23 July 2026 / Published: 25 July 2026
(This article belongs to the Special Issue Biomass Pyrolysis Characterization and Energy Utilization)

Abstract

Increasing Sargassum accumulation across the Gulf of America and the Caribbean has raised environmental, economic, and public health concerns for coastal communities. As Sargassum decomposes, it can impair tourism, aquatic ecosystems, and air quality, highlighting the need for valorization strategies that convert collected Sargassum into useful products. This study evaluates two carbon-product pathways: Case 1, direct pyrolysis of dried Sargassum at 600.00 °C for 30 min; and Case 2, hydrothermal pyrolysis, in which wet Sargassum was hydrothermally carbonized at 220.00 °C for 30 min before pyrolysis. Process configurations, stream balances, capital costs, manufacturing costs, net present values (NPVs), and breakeven selling price sensitivity analyses were compared. It was seen that Case 1 outperformed Case 2, breaking even in year 5 and achieving a year 12 NPV of over 9.60 million USD, whereas Case 2 never broke even and had a year 12 NPV of −66.04 million USD. A breakeven cost sensitivity analysis showed that Case 1 was sensitive to the Sargassum acquisition cost, while Case 2 was sensitive to the hydrothermal reaction temperature. These results indicated that while direct pyrolysis was economically favorable under the modeled assumptions, hydrothermal pyrolysis could become competitive with additional environmental incentives or carbon credits.

1. Introduction

Brown macroalgae, commonly known as Sargassum, has become a persistent coastal management problem across the Caribbean, the Gulf of America, and the state of Florida, USA, with negative consequences regarding public health, fisheries, navigation, and tourism [1,2]. When large accumulations of Sargassum decompose near shore, there are large releases of hydrogen sulfide, ammonia, and other gases that pollute coastal air quality and adversely affect nearby communities’ economic activities, such as tourism and aquatic industries [1]. As a result, Sargassum is no longer viewed solely as a seasonal biomass, but increasingly as a recurrent waste-management challenge that requires the interception and treatment of Sargassum [2]. This recurring influx has also intensified interest in waste management strategies that can reduce shoreline impacts while creating opportunities for downstream utilization of Sargassum.
Conventional management of Sargassum has relied primarily on near-shore collection, beach removal, hauling, and landfill disposal [3,4]. However, these practices are logistically complex and increasingly expensive due to Sargassum being a wet, saline, heterogeneous biomass that often contains entrained sand and debris such as shells and small organisms [5]. Regional assessments in the Gulf of America and near the Caribbean have shown that the cleanup costs can be substantial [6,7]. In Mexico, cleanup costs have been reported at approximately 19.00 to 85.00 USD m−3, with annual cleaning costs of roughly 0.30 to 1.50 million USD km−1 [5]. In the state of Florida, USA, Miami-Dade County reported an annual cost of about 35.00 million USD to collect, transport, and landfill Sargassum [1]. These reports highlight why simple removal and disposal strategies are difficult to sustain and why valorization pathways, which reduce transport and disposal burdens, are becoming increasingly more attractive.
Among potential valorization processes, thermochemical conversion is particularly relevant for Sargassum because it can convert heterogeneous biomass into carbonaceous solids and combustible gases in short residence times, with relatively compact equipment [8,9]. The resulting products can also serve as a stream of revenue, as they have established applications in soil improvement, adsorbents, and environmental remediation, highlighting a value beyond traditional waste disposal [10]. For Sargassum, the most meaningful process comparison is between direct pyrolysis and hydrothermal pyrolysis, where hydrothermal pyrolysis in this study refers to a two-stage process consisting of hydrothermal carbonization followed by pyrolysis. Direct pyrolysis is a dry thermal conversion process in which the feed is typically dried before entering a nitrogen-swept pyrolyzer, yielding a solid carbonaceous product known as biochar [11]. It benefits from a simple reactor configuration and near-atmospheric pressure, but it generally requires the partial drying of the feedstock before thermal conversion [12,13,14]. By contrast, hydrothermal pyrolysis uses water as the reaction medium to make hydrothermal biochar or H-biochar and can accept wet feed as a slurry, making this pathway a favorable process for wet biomass because it operates in hot compressed water and avoids complete pre-drying before primary conversion. However, this introduces pressure-rated equipment, liquid handling, and downstream solid–liquid separation requirements [15,16,17].
The suitability of either process is also shaped by the chemical and mineral characteristics of the Sargassum [18]. Sargassum typically exhibits a high ash content, elevated inorganic salt content, and variable moisture composition, all of which can affect reactor fouling, corrosion risk, downstream gas and solids handling, product quality, ash management requirements, and overall operating cost [19,20,21]. In a drying-intensive process such as direct pyrolysis, moisture removal is a primary economic challenge; in a wet-processing pathway such as hydrothermal pyrolysis, dissolved salts and minerals can shift the economic burden towards slurry handling, liquid recycle, and pressure-rated equipment [22,23]. These feedstock-specific features mean that the most suitable process cannot be identified from generic biomass literature alone and must instead be evaluated within a process-specific design framework.
Previous studies have demonstrated the technical feasibility of converting Sargassum into biochar and H-biochar. Farobie et al. demonstrated that Sargassum can be converted into biochar through pyrolysis, while Lu et al. showed that hydrothermal processing of wet seaweed can produce H-biochar [17,24]. González-Fernádez et al. and Jafarian et al. further indicated that Sargassum-derived solids can be used as value-added adsorbent materials, underscoring the broader potential for both energy and environmental applications [13,25]. However, the available economic assessments remain limited, and existing studies have generally focused on broad simulation frameworks rather than on experimentally anchored assessments with a common throughput basis [13,26]. The novelty of the present work lies in developing a comparative, experimentally grounded process design and economic assessment of two thermochemical pathways on a common throughput basis.
In this study, direct pyrolysis was designated as Case 1 and operated at a reaction temperature of 600.00 °C with a holding time of 30 min under inert nitrogen conditions. Hydrothermal pyrolysis was designated as Case 2, where hydrothermal carbonization was performed at 220.00 °C for 30 min, followed by pyrolysis at 600.00 °C for 30 min, under inert nitrogen conditions. A common wet feed throughput was applied, and the cases were compared using experimentally measured yield data, process-specific moisture assumptions, and standard process-design economic metrics, including total capital cost, annual manufacturing cost, net present value (NPV), return on investment (ROI), and a breakeven selling price sensitivity analysis. The central purpose was not only to identify which process was more economically favorable under the modeled assumptions but also to explain the results in terms of interactions among moisture handling systems, liquid recycling systems, product yield, reactor complexity, and financial assumptions.

2. Materials and Methods

2.1. Study Basis and Process Boundary

The economic assumptions summarized in Table 1 were included to define the common design and financial basis for comparing direct and hydrothermal pyrolysis. Similar processes, such as hydrothermal carbonization (HTC) alone, hydrothermal liquefaction (HTL), and activated carbon production, were not included as separate cases because they represent different product targets and economic boundaries rather than the two solid-carbon pathways. HTC alone produces hydrochar rather than a thermally upgraded biochar-like product, while HTL primarily targets liquid bio-crude and would require oil recovery and upgrading assumptions that are not directly comparable with solid biochar revenue [27]. Similarly, activated carbon production was treated as a downstream upgrading pathway rather than a primary conversion case because it requires additional physical or chemical activation steps and would place the product in a higher-specification adsorbent market, with different revenue assumptions, equipment boundaries, and product-quality specifications [28]. Therefore, direct pyrolysis and hydrothermal pyrolysis were selected for comparison because both pathways produce solid carbonaceous products, allowing the economic effect of each process to be evaluated on a comparable product basis.
To be consistent with similar studies in the literature, a 12-year plant life was modeled at 330.00 operating d yr−1 and 7920.00 operating h yr−1, accounting for unexpected downtime and maintenance [29]. This created a basis for comparing capital recovery, discounted cash flows, hourly stream flows, annual feed consumption, product generation, utility demand, and manufacturing costs. Both processes were evaluated on a common wet-feed basis so that the differences in economic performance could be attributed to process configuration rather than to inconsistent throughput assumptions and were derived from the National Oceanic and Atmospheric Administration’s (NOAA’s) assessment of the annual amount of Sargassum that the Gulf of America receives [30]. As seen in Table 1, the modeled feed rate was 1525.50 wet t d−1, equivalent to 63,562.50 kg h−1 under continuous 24 h d−1 operation. Fresh, washed Sargassum was experimentally found to have a moisture content of 82.00 wt%, and it was assumed in this study that all Sargassum was fresh and washed prior to entering both processes and had the same moisture content throughout. Using this moisture content, the feed rate was determined to be 11,441.30 dry kg h−1. As shown in Table 1, working capital was estimated to be 15.00% of the annual labor and material cost and was determined based on similar studies found in the literature [29]. This was included as a basis assumption for both processes, as commercial operations require funds tied up in labor, raw materials, and early operating needs before revenue is fully recovered and are dependent on the needs of the given process [31]. Similarly, the annual interest rate, tax rate, selling-price escalation, and operating-cost escalation were estimated at 4.50% of the initial investment, 20.00% of the annual income, 3.50% of the market value, and 2.00% of the annual manufacturing costs, respectively [29,32]. These were similarly derived based on studies found in the literature and were included as a basis assumption to move the analysis beyond a static cost comparison and into a project-level cash-flow framework that reflects financing burden, after-tax performance, increasing market value, inflation, and rising operating costs over time [31]. The market value of the products, biochar and H-biochar, was assumed to be the same and was set at a comparable, literature-derived value of 100.00 USD t−1. This assumption was used to isolate the effect of process configuration, capital cost, utilities, and product yield on the economic performance, rather than introducing an additional product-quality premium that was not experimentally quantified in this study. Product quality metrics such as BET surface area, pore structure, adsorption capacity, ash content, and inorganic contaminant concentrations can strongly influence the final market value of biochar-derived materials; however, these properties are application-specific and were not measured as part of the present study’s boundary to maintain a consistent economic comparison between the two processes [33]. In addition, the Sargassum acquisition cost was fixed at 2.00 USD t−1 [32]. Both values were set as fixed parameters for both processes to highlight the differences in the process configurations and their associated effects on process economics. Natural-gas and nitrogen cost values were set at 0.13 USD m−3 and 755.00 USD t−1, respectively, based on similar studies in the literature and were used as a basis assumption because the modeled processes both require inert operation and process heat, which directly influence the annual manufacturing costs [29,33]. The labor cost was evaluated to be 54,858.00 USD yr−1 per operator and was based on the average salary for a waste management employee; it was included in the basis assumptions to represent staffing requirements for continuous operation. The cost year was specified to ensure that all economic results were consistently reported, and for this study, the 2024 USD basis was chosen. Together, these assumptions create a transparent boundary for the analysis, allowing differences in capital cost, manufacturing costs, net present value (NPV), and breakeven selling price to be interpreted as consequences of the process design rather than inconsistent economic inputs.
Table 1. Economic assumptions and corrected unit basis used for comparative Sargassum assessment.
ParameterValueUnit BasisClassificationReferences
Plant life12.00yrLiterature[29]
Operating days per year330.00d yr−1Literature[29]
Operating time per day24.00h d−1Literature[29]
Annual operating hours7920.00h yr−1DerivedThis study
Wet Sargassum feed rate1525.50t d−1Scenario-based, informed by regional loading literature[30]
Wet Sargassum moisture content82.00wt%Scenario-based and literature feed characterization[24,34]
Working capital15.00% of annual labor plus raw material costLiterature[29]
Annual interest rate4.50% yr−1Literature[29]
Tax rate20.00% yr−1Literature[32]
Selling-price escalation after year 23.50% yr−1Literature[29]
Operating-cost escalation2.00% yr−1Literature[29]
Biochar value parameter100.00USD t−1Literature value used for cross-comparative screening[32]
Sargassum acquisition cost2.00USD t−1Scenario assumptionThis study
Nitrogen cost755.00USD t−1Literature[32]
Natural-gas cost0.13USD m−3Literature[29]
Labor wage54,858.00USD yr−1 per operatorLiterature wage salary[35]
Cost year2024.00yrReporting basisThis study
The model boundary begins with fresh, washed, raw Sargassum entering the processing system and ends with recovered solid product, waste, or ventilation streams leaving the system. This study was designed as a techno-economic assessment rather than a full life-cycle assessment; therefore, environmental factors such as greenhouse gas emissions, avoided landfill impacts, nutrient discharge, and long-term carbon sequestration potential were not monetized in the baseline model. Additionally, collection logistics, transport from offshore interception to the processing system, feedstock storage, detailed gas cleanup, product certification, and carbon-credit verification were outside of the primary model boundary. These factors are nevertheless important for Sargassum valorization because the feedstock’s high moisture content directly affects transportation, drying energy requirements, process water handling, and disposal-related emissions. These exclusions define the present study as a process-to-process comparison based on conversion, product recovery, and screening-level economics. In addition, the wet-feed basis was retained in this study to reflect the practical management challenge faced by coastal communities, where collected Sargassum is typically handled as a high-moisture biomass rather than as a dry feedstock. However, the results should be interpreted as a process-level economic assessment within the defined system boundaries rather than as a comprehensive environmental optimization of Sargassum management pathways.

2.2. Experimental Yield Inputs and Conversion Conditions

Process-specific solid yields were used to translate laboratory-scale conversion behavior into process-scale product flow. For this analysis, fresh Sargassum was obtained from Melbourne, Florida, USA, and rinsed to remove any sand and debris. For Case 1, Sargassum was dried overnight at 105.00 °C before being pyrolyzed at 400.00, 600.00, and 800.00 °C in a horizontal MTI series tube furnace (OTF−1200X-S-HPCVD) (Richmond, CA, USA), with a holding time of 30 min and a nitrogen flow rate of 1.00 L min−1. After pyrolysis, the biochar was allowed to cool to room temperature under ambient conditions. This resulted in direct pyrolysis producing a baseline biochar yield of 68.39 ± 1.96, 64.45 ± 1.00, and 51.91 ± 1.06 dry wt%, respectively, which agreed with values found in the literature [36,37]. The model reaction temperature for Case 1, used in this study, was 600.00 °C, while the other reaction temperatures, 400 and 800 °C, were retained for the reaction temperature sensitivity analysis.
For Case 2, Sargassum was hydrothermally carbonized in a 600.00 mL Parr reactor (Moline, IL) using the method described in the literature [14]. In short, the reactor was loaded with fresh, washed Sargassum and deionized (DI) water until a slurry with a 1:10 solid-to-water ratio was achieved. The moisture content of Sargassum was measured to be 82.00%, which agreed with previous studies [14]. The Sargassum was hydrothermally carbonized at 180.00, 220.00, and 260.00 °C for 30 min. The reactor was then quenched using a water bath, and the pressurized gas was vented into a fume hood. The resulting carbonized Sargassum was separated from the process liquid by vacuum filtration and then dried overnight at 105.00 °C. Once dried, the carbonized Sargassum was converted into H-biochar using a horizontal MTI series tube furnace (OTF−1200X-S-HPCVD) (Richmond, CA, USA) at 600.00 °C, using a holding time of 30 min, as well as a nitrogen flow rate of 1.00 L/min. This methodology was derived from the literature and resulted in hydrothermal pyrolysis producing a baseline H-biochar yield of 39.76 ± 0.79, 36.91 ± 1.15, and 36.31 ± 1.22 dry wt%, respectively, which also agreed with values found in the literature [36,37,38,39]. The model hydrothermal reaction temperature for Case 2 used in this study was 220.00 °C, while the other hydrothermal reaction temperatures, 180.00 and 260.00 °C, were retained for the reaction temperature sensitivity analysis.

2.3. Case 1: Direct Pyrolysis Process Description

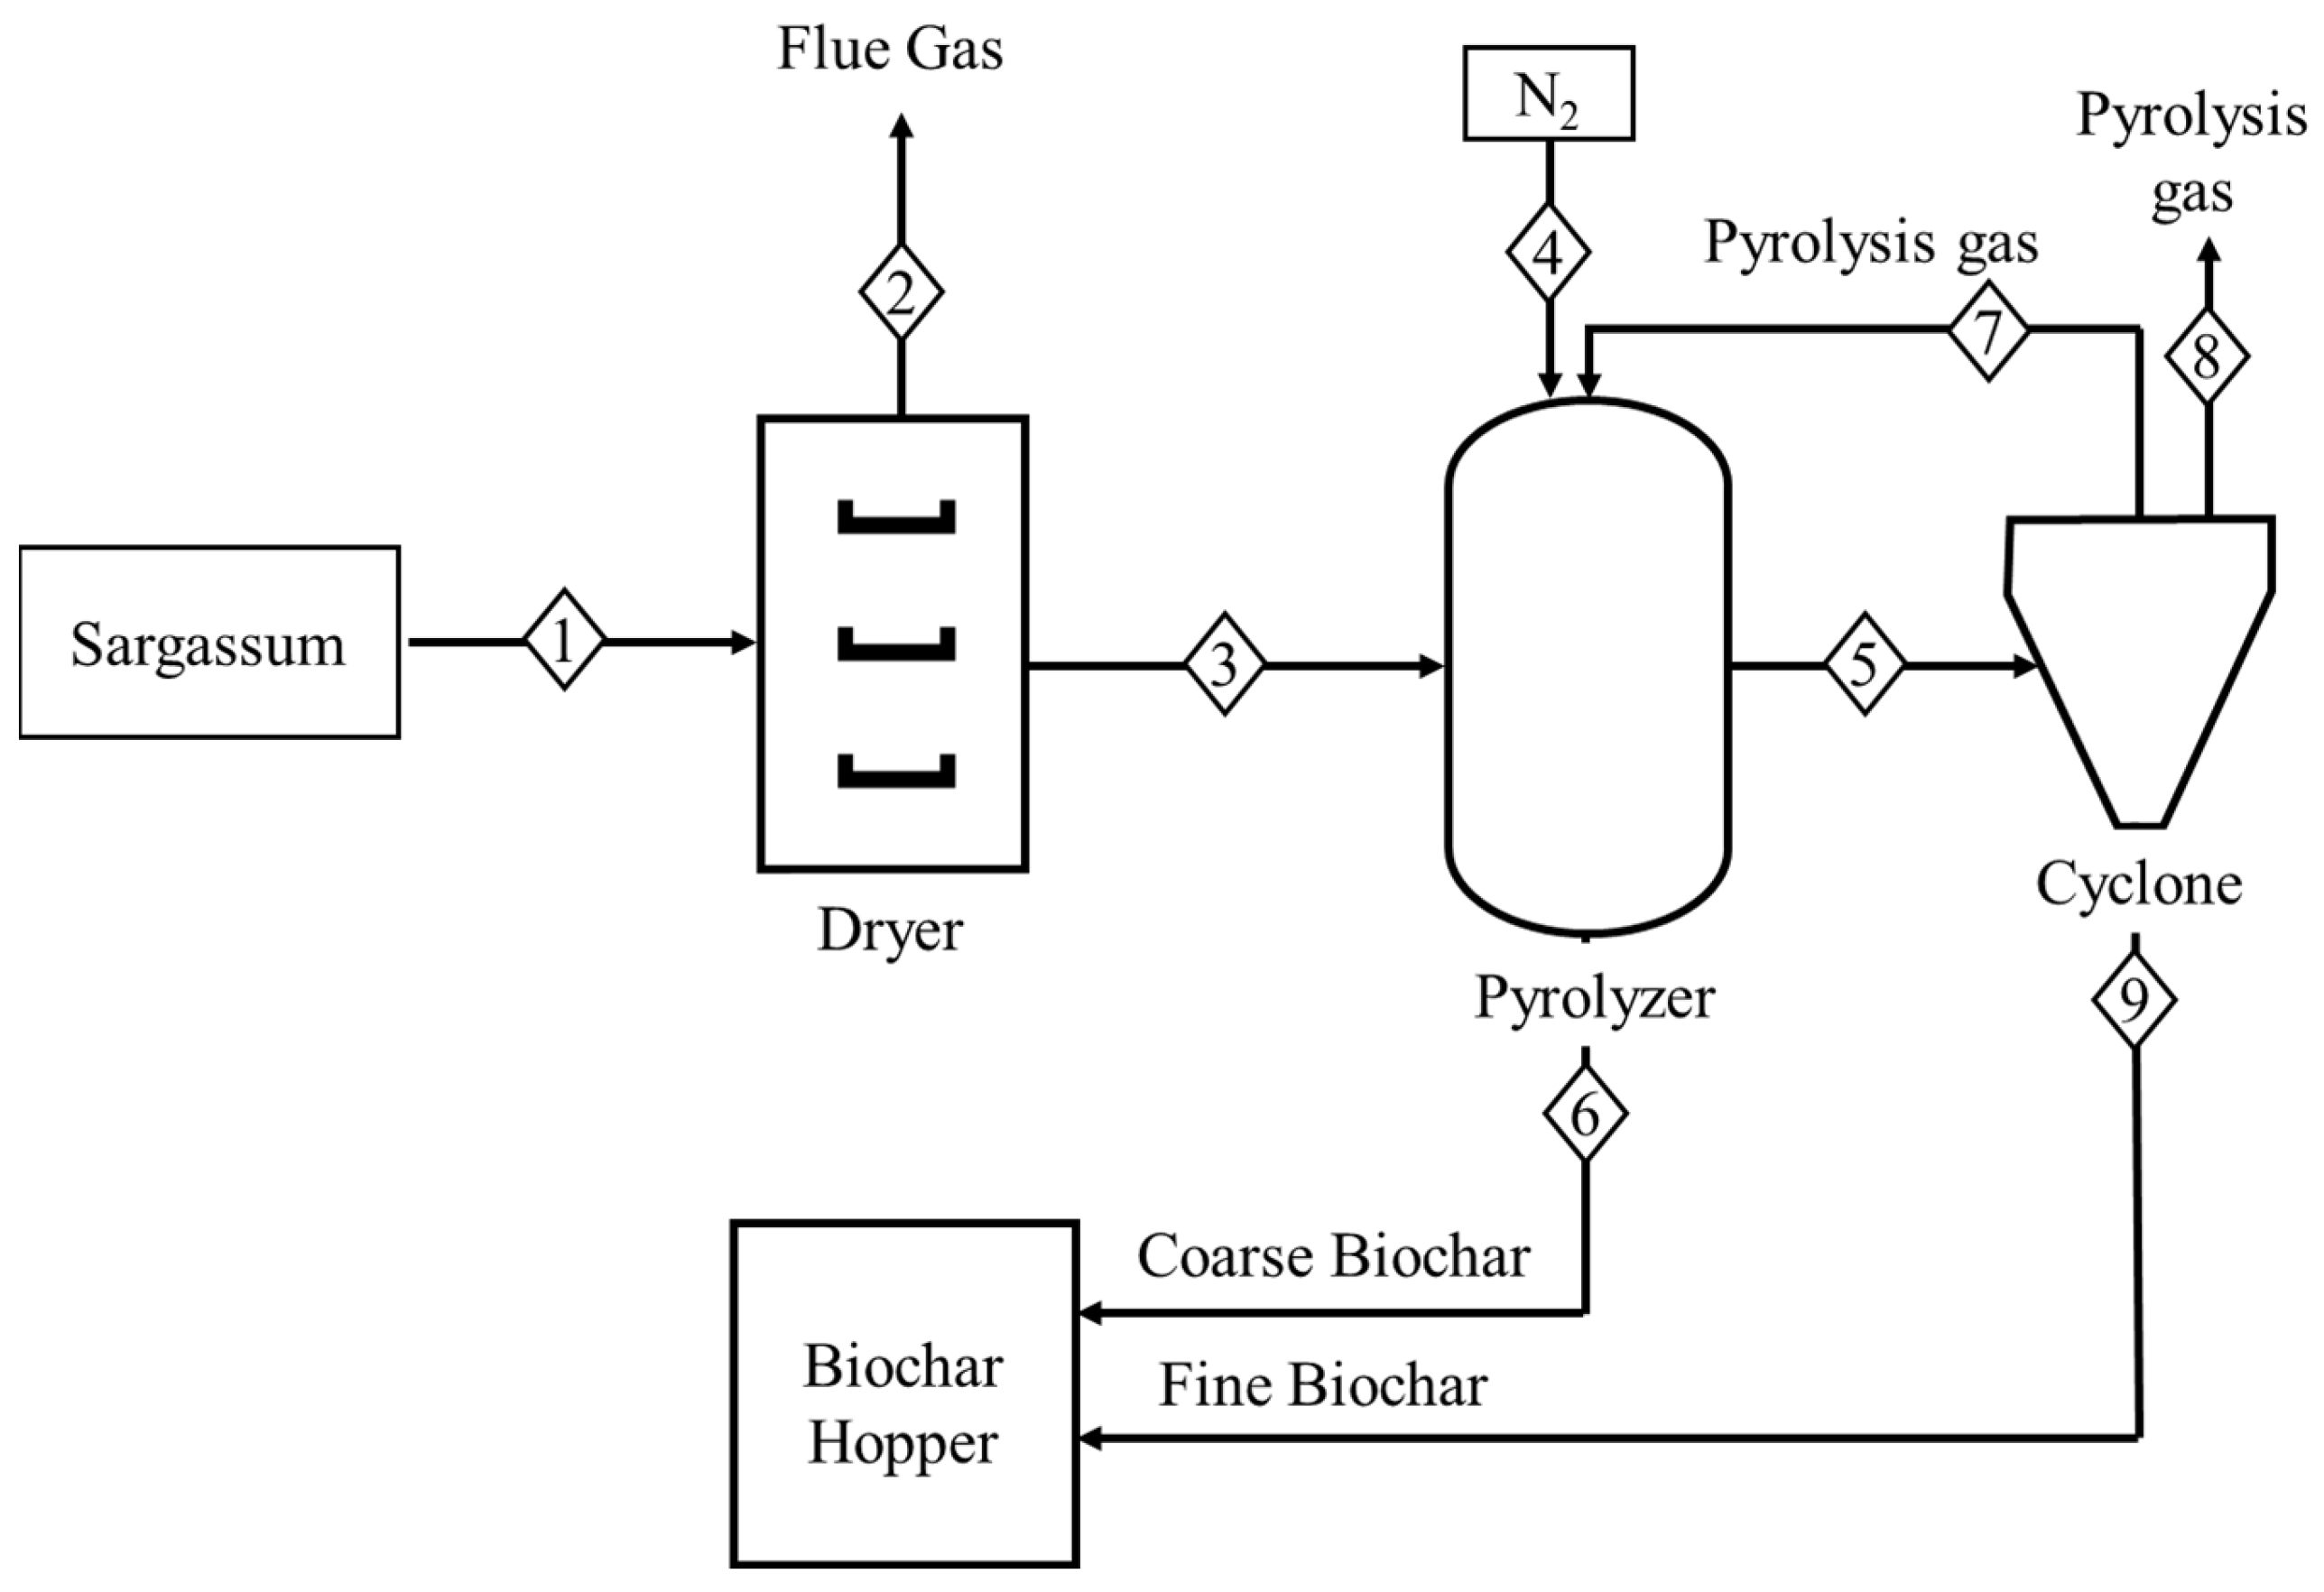
Direct pyrolysis was defined in this study as the thermal decomposition of dried Sargassum biomass under an inert nitrogen atmosphere to produce biochar, condensable vapors, and non-condensable gases. In this model, the process was represented as a dry thermochemical pathway, with the dominant front-end burden being moisture removal. The process flow diagram is shown in Figure 1, and the associated stream mass balance table is shown in Table 2.
As seen in Figure 1, the system begins with raw Sargassum entering the dryer via stream 1 at a rate of 63,562.50 kg h−1 under standard atmospheric conditions. Because the feed has a high moisture content, the dryer removed 52,121.25 kg h−1 of evaporated moisture and flue gas in stream 2. This step concentrated the feed in stream 3 into 11,441.25 kg h−1 of dry Sargassum. This dry Sargassum was then sent to a pyrolysis unit, where nitrogen was supplied in stream 4 at a rate of 10.00 kg h−1 to maintain inert conditions and prevent oxidation of the Sargassum during thermal conversion. After the reaction, a combination of airborne biochar and pyrolysis gas moved to a cyclone/dust collector unit in stream 5, while coarse biochar was moved to a hopper in stream 6. Based on the literature, 95.00% of the biochar was assumed not to be airborne, resulting in stream 6 containing 7005.19 kg h−1 of biochar product, while stream 9 produced 368.69 kg h−1 of fine biochar product [40]. These two streams were treated as saleable biochar and assumed to have the same market value in this study. The gas handling after pyrolysis was intentionally simply designed, based on the literature, with 407.74 kg h−1 of the pyrolysis gas recycled back to the pyrolyzer in stream 7, resulting in 3669.63 kg h−1 of gas being vented as pyrolysis gas in stream 8 [41].

2.4. Case 2: Hydrothermal Pyrolysis Process Description

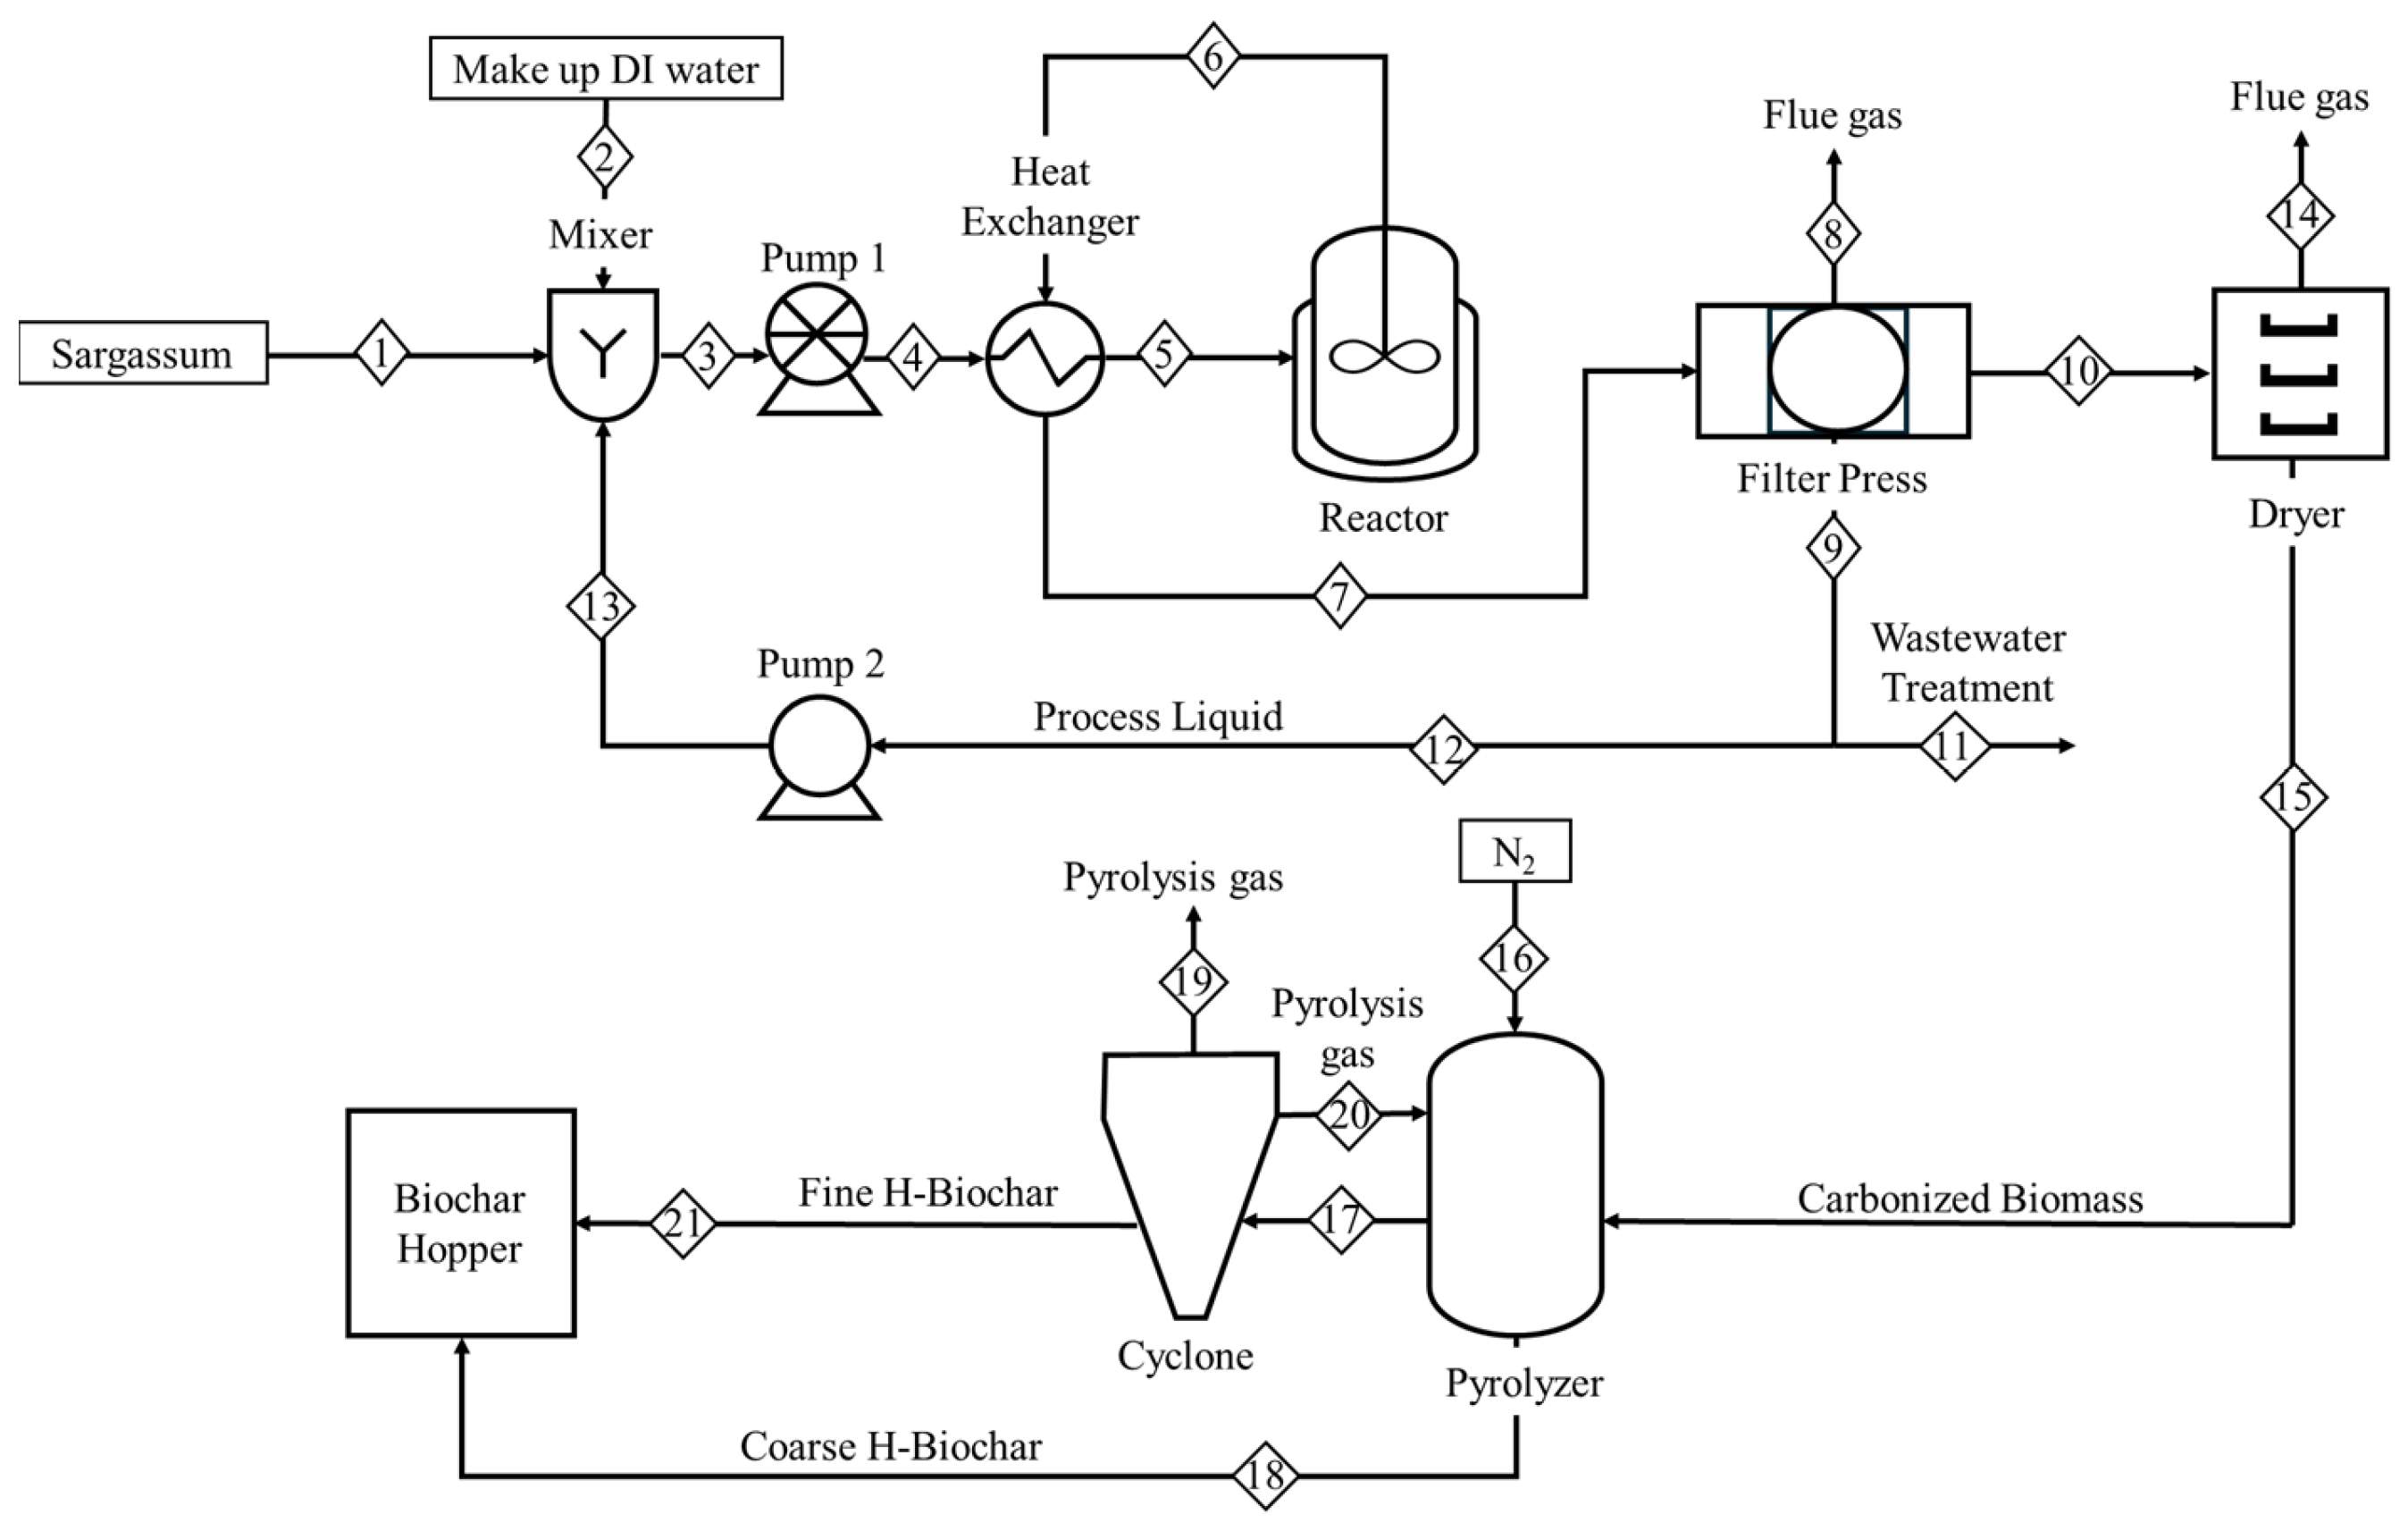
Hydrothermal pyrolysis is defined in this study as a two-stage process in which wet Sargassum is first hydrothermally carbonized, and the recovered carbonized solid is then dried and pyrolyzed to form H-biochar. This process is designed to exploit the wet-feed compatibility of hydrothermal processing while still producing a thermally upgraded solid product. Figure 2 shows the process flow diagram, while Table 3 provides the associated stream mass balance.
As seen in Figure 2, the process begins with the same raw Sargassum feed rate as Case 1: 63,562.50 kg h−1 at atmospheric conditions. DI water was then added in stream 2 at a rate of 3111.56 kg h−1, as well as recycled process liquid from the front of the process, to form a 1:10 solid-to-liquid slurry. The combined slurry flow was found to be 125,853.75 kg h−1 in stream 3 and was pressurized to 2.00 bar in order to be pumped to a heat exchanger in stream 4. Once in the heat exchanger, the slurry was preheated to 180.00 °C and pressurized to 10.00 bar in stream 5. This was necessary in order to maintain a liquid-phase reaction environment and avoid uncontrolled vaporization. Once preheated, the slurry underwent hydrothermal carbonization in a reactor at 220.00 °C and 23.20 bar. After the reaction, the reactor contents were passed back through the heat exchanger to recycle heat, then cooled and depressurized to 40.00 °C and 1 bar. After being cooled and depressurized, the solid and liquid fractions were separated, resulting in 115,499.42 kg h−1 of process liquid and 8886.99 kg h−1 of wet carbonized Sargassum in streams 9 and 10, respectively. Using literature, it was assumed that 95.00% of the liquid needed for hydrothermal activation was recycled process liquid, which meant that about 51.20% of the process liquid could be recycled, leaving the remaining 59,176.69 kg h−1 to be sent to a wastewater treatment facility for processing [42].
The wet carbonized Sargassum was dried at 105.00 °C, removing 2050.84 kg h−1 of moisture and flue gas in stream 14, while 6836.15 kg h−1 of dried carbonized Sargassum was sent to a pyrolyzer in stream 15. In the pyrolyzer, nitrogen was supplied in stream 16 at a rate of 10.00 kg h−1 to maintain inert conditions and prevent oxidation of the Sargassum during thermal conversion, as in Case 1. After the reaction, a combination of airborne H-biochar and pyrolysis gas moved to a cyclone/dust collector unit in stream 17, while coarse H-biochar was moved to a hopper in stream 18. Based on the literature, 95.00% of the H-biochar was assumed to not be airborne, resulting in stream 18 containing 4011.55 kg h−1 of H-biochar, while stream 21 produced 211.13 kg h−1 of fine biochar [40]. As in Case 1, these two streams were treated as saleable H-biochar and assumed to have the same market value in this study. The gas handling was intentionally simply designed, based on the literature, with 131.17 kg h−1 of the pyrolysis gas recycled back to the pyrolyzer in stream 20, resulting in 2492.29 kg h−1 of gas being vented as pyrolysis gas in stream 19 [41].

2.5. Economic Model, Capital Cost Basis, and Manufacturing Cost Basis

The economic model was developed to translate the experimental conversion yields and process-flow assumptions described in the previous sections into process-specific capital costs, annual manufacturing costs, and cash-flow inputs. As previously mentioned, Cases 1 and 2 were evaluated using the same wet feed rate, annual operating time, plant life, cost year, product-value basis, labor assumption, tax rate, and interest rate so that differences in economic performance could be attributed to the process design rather than inconsistent economic inputs.
The capital cost estimate was performed at a screening level using equipment sizes derived from stream mass balances and process flow diagrams and applied to the module-costing approach presented by Turton et al. [31]. By following Turton et al.’s methodology, the capital cost was estimated with an accuracy range of −25.00% to +40.00%, as best described in the literature [32]. In this method, the purchased base cost of each item of the equipment was first calculated from its primary design parameter using Equation (1), where C P 0 is the base purchase cost for carbon-steel equipment at ambient pressure; A is the primary equipment sizing parameter; and K1, K2, and K3 are equipment-specific, unitless cost constants obtained from the literature [31]. In this study, the equipment-specific K-values and bare-module factors for each unit were taken from the equipment costing tables in the literature and are presented in Table 4.
l o g C P 0 = K 1 + K 2 log A + K 3 log A 2
Once the base purchase cost was obtained, the bare module cost of each unit was obtained from Equation (2), where CBM,j is the bare module cost of the equipment item j, C p 0 is the base purchase cost obtained from Equation (1), and FBM,j is the bare module factor [29].
C B M , j = C p 0 F B M , j
The fixed capital investment (FCI) was estimated in Equation (3) by summing the bare module costs and adding general fees, contingency, and auxiliary costs [31]. These fees were estimated to account for 3.00%, 15.00%, and 50.00% of the bare module cost, respectively [43].
F C I = j C B M , j + 0.03 j C B M , j + 0.15 j C B M , j + 0.50 j C B M , j
Once the FCI was obtained, the working capital (WC) was estimated using Equation (4), where COL represents annual operating labor costs and CRM represents the annual raw material costs. The WC investment was assumed not to depreciate and was also recovered in the plant’s cash flow in the final year. This was observed to be standard practice and in accordance with the literature [32]. In the presented cases, the raw material term corresponds to the effective Sargassum acquisition and handling costs, estimated at a competitive 2.00 USD t−1, while the finished biochar and H-biochar product was assumed to have a market value of 100 USD t−1 [44].
W C = 0.15 ( F C I + C O L + C R M )
This allowed the total capital investment (TCI) to be calculated in Equation (5) by adding Equations (3) and (4) [31].
T C I = F C I + W C
All cost estimations were normalized to the 2024 USD using Equation (6), where C2024 is the updated cost in 2024 USD, Cbase is the original reference cost obtained from literature, and CEPCI is the Chemical Engineering Plant Cost Index for the corresponding year [31].
C 2024 = C b a s e C E P C I 2024 C E P C I b a s e
The annual cost of manufacturing, COMd, was estimated using Equation (7), where Cu is the annual utility cost, CWT is the annual waste treatment or disposal cost, CRM is the annual raw material cost, and COL is the annual operating labor cost [31]. According to the literature, 18.00% of the FCI should be allocated to general plant maintenance, with other cost multipliers used to accurately account for fluctuating or indirect costs [43]. In this study, the manufacturing cost includes utilities, raw materials, labor, and fees for all cases.
C O M d = 0.18 F C I + 2.73 C O L + 1.23 ( C U + C W T + C R M )

2.6. NPV, ROI, and Breakeven Selling Price Sensitivity Analysis

After the capital and manufacturing costs were established, the economic model was extended to annual revenue, after-tax cash flow, net present value (NPV), return on investment (ROI), and a breakeven selling price sensitivity analysis. These metrics were included to answer the central economic question: not only which process required lower capital investment, but also which process could recover its capital and annual costs through the sale of solid products over the 12-year plant life.
The annual revenue for each case was calculated using Equation (8), where Rk is the annual revenue in year k, mchar is the annual biochar or H-biochar production rate, top is the annual operating time, and Pchar is the market value of the biochar or H-biochar [31].
R k = m ˙ c h a r t o p P c h a r
The annual taxable net profit (NP) was then calculated using Equation (9), where dk is depreciation in year k [31].
N P k = R k C O M d d k
Using the value obtained from Equation (9), the after-tax net profit (ANP) was then determined from Equation (10), where t is the tax rate [31].
A N P k = N P k t N P k
The annual cash flow (Fk) was then calculated using Equation (11), which promptly yielded Equation (12) by substituting in Equations (9) and (10).
F k = A N P k + d k
F k = ( R k C O M d d k ) ( 1 + t ) + d k
The net present value (NPV) was then calculated over the project life using Equation (13), where i is the annual interest rate, and n is the project lifetime. A positive NPV was taken to indicate an economically favorable project, while a neutral NPV (NPV = 0) was taken to correspond to the breakeven condition [31]. The return on investment (ROI) was used as a secondary profitability metric and was calculated using Equation (14).
N P V = T C I + k = 1 n F k ( 1 + i ) k
R O I = k = 1 n F k T C I T C I × 100
A deterministic one-factor-at-a-time sensitivity analysis was used to identify which assumptions most strongly controlled the breakeven selling price. The breakeven selling price was chosen because it provided a direct measure of the minimum product value required for each process to recover its capital and operating costs over the 12-year plant life [39]. The breakeven selling price was calculated by setting the NPV = 0 and substituting in Equations (8) and (12) in order to solve for Pchar. Six different process parameters were taken into consideration, including Sargassum acquisition cost, price of natural gas, price of nitrogen, interest rate, tax rate, and reaction temperature. In each sensitivity analysis, one parameter was changed to a lower sensitivity bound (LSB) or higher sensitivity bound (HSB), while the remaining variables were held constant. This approach was selected as a screening-level method to identify the individual variable with the greatest influence on the breakeven selling price and overall process economics.

3. Results and Discussion

3.1. Process Design and Mass-Balance Comparison

The stream mass balances highlighted in Table 2 and Table 3 provide the first indication of the process-level difference between Cases 1 and 2. Although both processes were evaluated using the same raw Sargassum feed rate, the two process configurations distribute mass, water, and recoverable solid product differently. These differences are important because the economic performance of each process is controlled not only by the reaction temperature or product yield but also by the amount of material that must be dried, pumped, recycled, vented, separated, or treated as waste [45].
For Case 1, 63,562.50 kg h−1 of raw Sargassum entered the process, and 52,121.25 kg h−1 was removed during the drying stage as evaporated moisture and flue gas. As a result, only 11,441.25 kg h−1 of dried Sargassum was sent to the pyrolysis unit. This demonstrates that the main process burden for direct pyrolysis occurs at the front end of the process, where the high moisture content of the Sargassum must be removed before thermal conversion [46]. Once dried, however, the process remains comparatively simple, consisting primarily of nitrogen-swept pyrolysis, gas–solid separation, limited gas recycle, and biochar recovery. The combined modeled biochar product rate was 7373.88 kg h−1 when the coarse and fine product streams were combined.
Case 2 began with the same Sargassum feed rate but generated a substantially larger internal process flow because the wet Sargassum was converted into a slurry and combined with recycled process liquid. The slurry reached 125,853.75 kg h−1 before hydrothermal treatment, which was nearly twice the raw Sargassum feed rate. After hydrothermal treatment and solid–liquid separation, 115,499.42 kg h−1 of process liquid was recovered, with 59,176.69 kg h−1 being recycled and 56,322.73 kg h−1 purged as a wastewater stream. The final combined H-biochar production rate was 4222.68 kg h−1, which was about 57.00% lower than the biochar product rate from Case 1. Therefore, Case 2 required greater internal liquid handling while producing less final solid product under the modeled assumptions.
This comparison explains the economic structure evaluated in the following sections. Direct pyrolysis concentrates its process burden in the drying step, but the remaining flowsheet is relatively compact and produces a higher final solid product flow [47,48]. In contrast, hydrothermal pyrolysis reduces the need for complete front-end drying before the first conversion step, but it introduces slurry preparation, pressurization, heat exchange, hydrothermal reaction, process-liquid separation, process-liquid recycling, and wastewater purging [47,49]. Therefore, the economic comparison should be interpreted as a flowsheet-level comparison rather than simply as a comparison between two reaction chemistries. Under the current model assumptions, it can be seen that the process with fewer unit operations and higher final product recovery has a structural economic advantage.

3.2. Capital and Manufacturing Cost Comparison

The capital and manufacturing cost results further demonstrated that the economic separation between the two processes was driven primarily by process architecture and material-flow requirements. As shown in Table 5, Case 1 required a total capital cost of 250,015.00 USD, whereas Case 2 required 587,254.00 USD, nearly twice the total capital cost of Case 1. This difference is consistent with the process comparison previously discussed because Case 2 requires additional equipment for slurry preparation, pumping, heat exchange, pressurized hydrothermal reactions, solid–liquid separation, process-liquid handling, and downstream drying [50]. In contrast, Case 1 was consistent with a direct dry thermochemical process in which the major equipment requirements are associated with drying, solid feeding, gas–solid separation, and biochar handling.
The dominant capital cost category also differed between the two processes. In Case 1, solid handling and storage accounted for 79.13% of the total capital costs, which reflects the importance of feeding, recovering, and storing solid material in a dry thermochemical process. In Case 2, reactor systems accounted for 59.27% of the total capital costs, which reflects the higher cost of hydrothermal processing at elevated temperatures and pressures [51]. This distinction is important because it shows that the hydrothermal process does not simply add a wet pretreatment step but rather changes the overall structure of the process [38]. Although hydrothermal processing can accept wet Sargassum as a slurry, the benefit was seen to be offset by the need for pressure-rated equipment and additional liquid-phase processing [52].
The annual manufacturing cost results in Table 5 showed an even larger separation between the two cases. Case 1 required about 4.83 million USD yr−1, while Case 2 required 12.95 million USD yr−1, making the annual manufacturing cost of Case 2 approximately 2.68 times higher than that of Case 1. As seen previously, the dominant manufacturing burden stemmed from the fundamental difference between Cases 1 and 2. In Case 1, the manufacturing cost was primarily associated with the Sargassum acquisition costs and the energy required to dry the high-moisture feedstock prior to pyrolysis. In Case 2, the higher manufacturing costs were largely driven by liquid-phase processing requirements, including makeup water demand, process-water recycle, wastewater purge, and wastewater treatment. This accounted for Case 2 costing about 8.12 million USD yr−1 more than Case 1 to operate despite having lower energy costs than Case 1. The energy costs for Case 2 were lower than Case 1 because hydrothermal processing reduced the front-end drying burden within the wet-processing loop. Nevertheless, the energy savings in Case 2 were outweighed by the costs associated with liquid handling [50,53]. Labor costs were identical in both cases, confirming that the manufacturing cost separation was primarily driven by process-specific material flows and process complexity rather than staffing assumptions. Therefore, the higher annual manufacturing costs of Case 2 reflect the cumulative economic burden of water management and multi-step processing, while the lower costs of Case 1 reflect its simpler dry thermochemical configuration despite being more energy-intensive than Case 2.

3.3. NPV Analysis over the 12-Year Plant Life

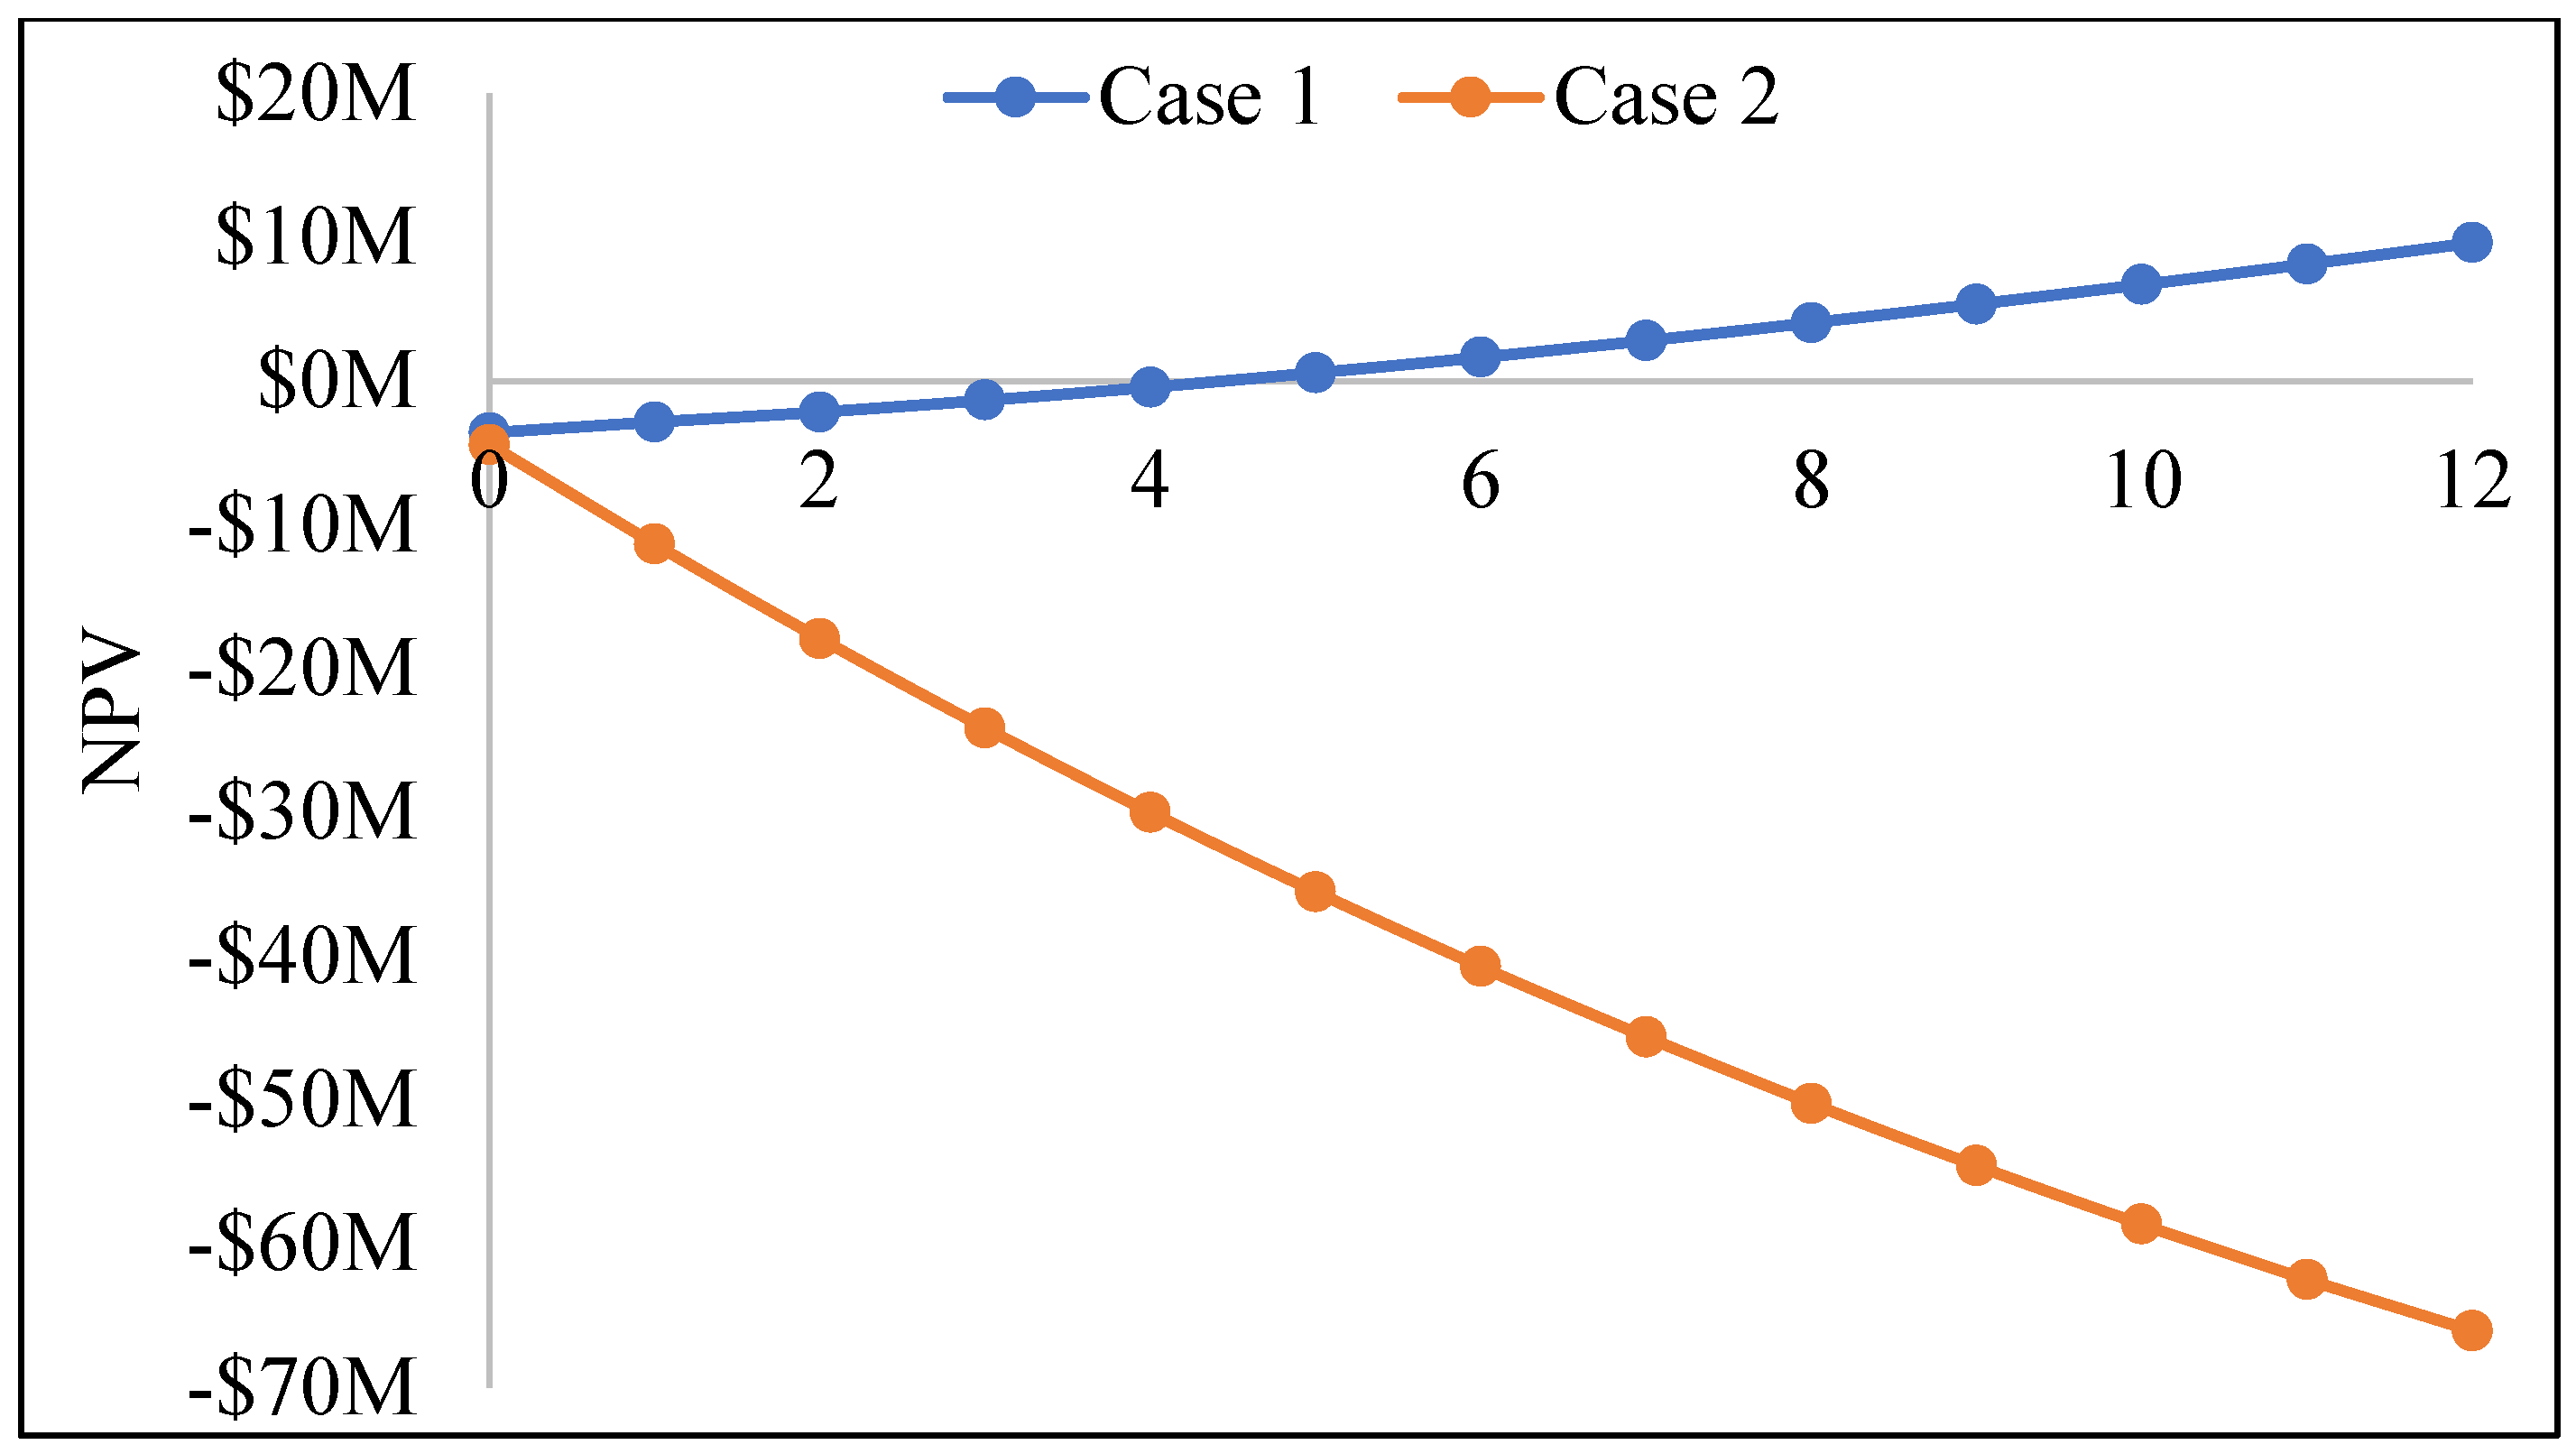
The NPV results provide the clearest project-level comparison between the two processes because they combine the effects of the capital investment, annual manufacturing cost, product revenue, tax rate, interest rate, and the time value of money, as seen in Figure 3. As seen in Figure 3, Case 1 began with a year-0 NPV of −3.59 million USD and remained negative until it became positive during year 5, reaching 0.57 million USD. By year 12, Case 1 reached a final NPV of 9.62 million USD. This transition from negative to positive NPV indicates that direct pyrolysis recovered its initial investment early in the plant life, as visually seen in Figure 3, and generated a comparably large cumulative economic return under the modeled assumptions.
Case 2 was not profitable over the 12-year life span under the current modeled assumptions. The hydrothermal pyrolysis process began with a year-0 NPV of approximately −4.41 million USD and remained negative through year 12. The process had a year 12 NPV value of −66.04 million USD. This is a direct result of the lower solid-product yield not being able to generate enough product revenue to offset the higher annual manufacturing costs. These elevated manufacturing costs were driven by the added liquid handling requirements of the hydrothermal stage, including water addition, slurry processing, liquid separation, and wastewater management.
The separation between the two NPV curves demonstrates that the economic advantage of Case 1 was not caused by a single cost category but by the combined effect of a simpler process design, lower capital costs, lower annual manufacturing costs, and higher final solid-product recovery. In contrast, Case 2 was burdened by a lower H-biochar output and the additional costs associated with slurry handling, pressurized hydrothermal treatment, process-liquid recycle, wastewater purge, and downstream drying. Therefore, the NPV analysis supports the broader interpretation of direct pyrolysis being the more economically favorable process design under the modeled assumptions, while hydrothermal pyrolysis would require additional incentives such as avoided disposal costs, environmental credits, or carbon-credit revenue streams to become competitive [32,54].

3.4. Breakeven Selling Price Sensitivity Analysis

The breakeven selling price provides a direct measure of the product value required for each process to recover its total project cost over the modeled 12-year plant life. Under the current modeled assumptions, the baseline breakeven selling prices were mathematically calculated to be 99.82 and 457.78 USD t−1 for Cases 1 and 2, respectively. This result strengthens the economic separation between the two processes. Under the assumed biochar value parameter of 100.00 USD t−1, direct pyrolysis would remain below the assumed selling price, while hydrothermal pyrolysis would require either a higher-value product evaluation and avoided-disposal credit, or an additional stream of revenue from environmental incentives to reach the same level of economic attractiveness [39]. The breakeven analysis additionally indicates that Case 1 is not only the lower-cost process but also the one with the greatest margin between the modeled product value and the required selling price [29].
Among the sensitivity parameters, the Sargassum acquisition cost remained one of the most important economic drivers. This was expected because the feedstock costs are applied to the full wet Sargassum feed rate, whereas revenue is generated only from the recovered solid product. As seen in Table 6 for Case 1, if a tipping fee of 25.00 USD t−1 was collected, this would decrease the breakeven selling price to 17.20 USD t−1, while increasing the acquisition cost to 25.00 USD t−1 increased the breakeven selling price to 343.68 USD t−1. This reveals that because the raw Sargassum is processed at a high wet-mass throughput, increasing the Sargassum acquisition cost would strongly affect the product selling price required to recover the annual costs for Case 1. For Case 2, the same trend was observed in Table 6, where the Sargassum acquisition cost fluctuated from a tipping fee of 25.00 USD t−1 to a Sargassum acquisition cost of 25.00 USD t−1, resulting in the breakeven costs for Case 2 ranging from 70.53 to 883.63 USD t−1. These results highlight that if Case 2 were to receive some economic benefits, such as a tipping fee, the process could be competitive with Case 1.
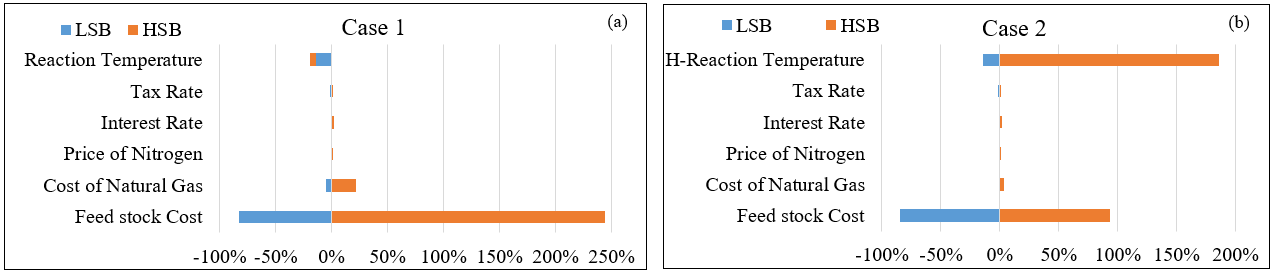
The reaction temperature also produced a process-specific sensitivity response and was most clearly seen in Figure 4. For Case 1, when the reaction temperature was varied from 400.00 to 800.00 °C, the breakeven cost ranged from 85.78 to 123.93 USD t−1. This indicated that, by increasing the pyrolysis temperature, the breakeven cost would also increase because the solid product yield would decrease at higher temperatures [29]. For Case 2, the hydrothermal reaction temperature was adjusted between 180.00 and 260.00 °C, resulting in breakeven costs of 392.77 and 1309.24 USD t−1, respectively. The much larger, higher-temperature response in Case 2 was due not only to a decrease in the solid product yield but also to increased process requirements associated with the higher reaction temperature, including higher capital and manufacturing costs [39]. Financing and tax assumptions had a much smaller but still meaningful effect on the breakeven selling price. It was observed that when the interest rate changed between 4.00 and 5.50%, the lower interest rate increased the amount of future cash flow and thus decreased the breakeven selling prices of Cases 1 and 2 to a respective 98.86 and 453.87 USD t−1, while a higher interest rate reduced the amount of profit and thus led to higher breakeven selling prices of 101.88 and 466.27 USD t−1 for Cases 1 and 2, respectively. The tax rate had less effect than the Sargassum acquisition cost, but when it changed from 15.00% to 30.00%, the breakeven cost changed by about 1.00% in both cases. In addition, it was seen that when varying factors like the price of natural gas and nitrogen, to a respective 0.11 and 0.18 USD m−3 and 500.00 to 1000.00 USD t−1, the breakeven cost for both cases changed by less than 3.00%.
Overall, the sensitivity analysis showed that the economic feasibility of Sargassum-derived biochar production is primarily determined by the feedstock-cost structure, product yield, and reaction temperature rather than by utility and financial fluctuations. The analysis also showed that Case 1 had a wider economic margin under the modeled assumptions, while Case 2 relied on additional value mechanisms, such as higher selling points and landfill credits. It should be noted that while this approach provides a strong screening method for identifying the individual variables with the greatest influence on the breakeven selling price and overall economics, it does not fully capture interaction effects among process parameters. In practical operation, several variables are expected to be coupled; for example, feedstock moisture influences drying duty, transportation burden, and effective dry solids throughput, while hydrothermal reaction temperature can simultaneously affect carbon yield, utility demand, process-water generation, and downstream pyrolysis performance. Therefore, the sensitivity results should be interpreted as local economic responses around the baseline case rather than as a complete multivariable uncertainty analysis

3.5. Practical Implications and Future Recommendations for Sargassum Valorization

The present study indicated that direct pyrolysis was the more favorable near-term process under the modeled assumptions, but the literature suggests that, in future studies, process comparisons should be interpreted in terms of product quality and end-use readiness rather than by the process economics alone [55,56]. From this study, it was seen that the economic advantage of direct pyrolysis stems from its simpler process design, lower capital and manufacturing costs, and higher final biochar production rate. However, future studies would benefit from additional chemical validation, as Sargassum has been reported as a saline, mineral-rich marine biomass that can accumulate metals, metalloids, and other micropollutants, with arsenic repeatedly identified as a key downstream-use concern in reviews and regulatory discussions [1]. The potential use of Sargassum-derived biochar for traditional biochar applications, such as soil amendment applications, should be interpreted cautiously. For example, although properties such as elevated ash, soluble salts, and inorganic constituents may provide agronomic value in some contexts, they may also limit direct soil application if electrical conductivity, salinity, pH, heavy metals, arsenic, or other regulated contaminants exceed protocol-quality thresholds. This limitation is economically significant because product eligibility strongly affects the attainable selling price. If the Sargassum-derived biochar does not meet application quality requirements because of salts, ash, metals, or arsenic, the product may require additional washing, blending, stabilization, or redirection to a lower-value market. These additional treatment and certification requirements would increase operating costs and could reduce the effective product value. This makes procurement certification central to commercialization, with standards such as the International Biochar Initiative (IBI) and the European Biochar Certificate (EBC) guidelines crucial for commercialization and future experimental work [57,58].
Other Sargassum and marine-biomass studies suggest that environmental protection technologies are a more realistic market pathway than traditional biochar applications [56]. Raw Sargassum biomass has been evaluated for heavy-metal uptake from water, including lead and cadmium removal, and the literature has shown that Sargassum can remove heavy metals from stormwater runoff, although performance depends on competing ions and organic matter [59]. Thermochemical conversion can further expand these applications. Poo et al. reported that biochar produced from marine macroalgae, including Sargassum fusiforme, showed a strong potential for heavy metal removal, while Devrajani et al. demonstrated arsenic removal using modified biochar derived from Sargassum polycystum [60,61]. These studies support practical applications for the biochar produced in this study and also suggest that other economic factors could be applied, such as increased market value and environmental credits, depending on the specific application. Future work can incorporate this by combining an economic assessment with a life-cycle assessment and product performance testing.
Hydrothermal pyrolysis was less favorable in the current model, but the broader literature suggests that its future may be in wet-feed compatibility, product engineerability, and process-liquid valorization rather than in baseline H-biochar production alone [62]. Hydrothermal carbonization has been widely studied as a process for processing wet biomass without complete front-end drying, and macroalgal-specific studies have shown that H-biochar can exhibit enhanced adsorption capabilities, which are typically recognized as having a higher market value than traditional biochar applications [52]. The process liquid has also been recognized as a valuable resource in recent reviews, such as those done by Xu et al. and Spagnuolo et al., which show that, when coupled with additional processes such as anaerobic digestion, the process liquid can be recovered for nutrients and biodegradable organic matter [51,63]. That said, the literature also acknowledges that inhibitory compounds and additional treatment costs can limit the performance and that future experimental and economic studies should compare disposal only, recycle-and-treatment, anaerobic digestion, and nutrient-recovery scenarios, while also adding benefits for landfill disposal, beach cleaning, and environmental credits [64,65]. Additionally, while this study, as well as similar studies in the literature, focus on one-factor-at-a-time sensitivity analysis, the economic outcome of Sargassum valorization may change significantly when multiple unfavorable or favorable parameters occur simultaneously. For example, a high-moisture feedstock combined with higher natural gas prices would amplify the cost penalty of direct pyrolysis, whereas lower hydrothermal reaction temperatures combined with improved solid yield could improve the economic performance of hydrothermal pyrolysis. Future work should apply a multivariable sensitivity analysis, factorial design, Monte Carlo simulation, or response surface modeling approach to quantify the interactions among feedstock moisture, product yield, reaction temperature, energy price, capital costs, wastewater handling, and product value. Under the expanded study framework, hydrothermal pyrolysis would become a competitive research pathway despite its flowsheet complexity.

4. Conclusions

This study developed a comparative study of two Sargassum-derived biochar processes, based on common throughputs and economic frameworks. Case 1, direct pyrolysis, was economically favored over Case 2, hydrothermal pyrolysis, under the modeled assumptions. Direct pyrolysis had a lower total capital cost of 250,015.00 USD compared to hydrothermal pyrolysis, which had a total capital cost of 587,254.00 USD. Case 1 also demonstrated stronger profitability, with an annual manufacturing cost of 4.83 million USD yr−1, breakeven occurring in year 5, a year-12 NPV of 9.62 million USD, and a baseline breakeven selling price of 99.82 USD t−1. In comparison, Case 2 had a higher annual manufacturing cost of 12.95 million USD yr−1, remained economically unfavorable over the 12-year plant life with a year-12 NPV of −66.04 million USD, and required a breakeven selling price of 457.78 USD t−1.
The economic advantage of direct pyrolysis resulted from a comparatively simpler process architecture and higher final product flow. Hydrothermal pyrolysis provided wet-feed compatibility but introduced slurry handling, pressure-rated reactor systems, process-liquid recycle and wastewater disposal. These additions increased capital and manufacturing costs while reducing the final H-biochar production compared with direct pyrolysis.
A one-factor-at-a-time sensitivity analysis showed that the Sargassum acquisition cost and reaction temperature were the most important economic drivers, while financial and utility costs had a negligible impact. The results suggest that future commercial feasibility will depend strongly on feedstock logistics, avoided disposal costs, product quality, and application-specific biochar pricing. Although hydrothermal pyrolysis was less economically favorable under the baseline assumptions, it remains a promising research pathway if measurable advantages, such as higher product value, nutrient recovery, salt management, or reduced environmental impact, can offset its higher process complexity in future research.

Author Contributions

R.W.C.: Conceptualization, Visualization, Formal analysis, Methodology, Investigation, Writing—original draft, Writing—review and editing. E.S.: Data investigation, Writing—original draft. R.C.S.: Writing—original draft, Writing—review and editing. M.T.R.: Conceptualization, Resources, Formal analysis, Methodology, Investigation, Visualization, Writing—review and editing. All authors have read and agreed to the published version of the manuscript.

Funding

Environmental Protection Agency (EPA) Grant: 2D20522.

Data Availability Statement

The data presented in this study are available on request from the corresponding author.

Acknowledgments

The authors are grateful to Dr. Cadianne Chambers at the Pacific Northwest National Laboratory (PNNL) for their valuable input.

Conflicts of Interest

The authors declare no conflicts of interest. The funders had no role in the design of the study; in the collection, analyses, or interpretation of data; in the writing of the manuscript; or in the decision to publish the results.

References

  1. EPA. Sargassum Inundation Events (SIEs): Impacts on the Economy. 2025. Available online: https://www.epa.gov/habs/sargassum-inundation-events-sies-impacts-economy (accessed on 5 February 2025).
  2. EPA. Planning for and Managing Sargassum Inundation Events (SIEs). 2025. Available online: https://www.epa.gov/habs/planning-and-managing-sargassum-inundation-events-sies (accessed on 5 February 2025).
  3. Oxenford, H.A.; Cox, S.-A.; van Tussenbroek, B.I.; Desrochers, A. Challenges of Turning the Sargassum Crisis into Gold: Current Constraints and Implications for the Caribbean. Phycology 2021, 1, 27–48. [Google Scholar] [CrossRef] [Scilit]
  4. Chávez, V.; Uribe-Martínez, A.; Cuevas, E.; Rodríguez-Martínez, R.E.; van Tussenbroek, B.I.; Francisco, V.; Estévez, M.; Celis, L.B.; Monroy-Velázquez, L.V.; Leal-Bautista, R.; et al. Massive Influx of Pelagic sargassum spp. on the Coasts of the Mexican Caribbean 2014–2020: Challenges and Opportunities. Water 2020, 12, 2908. [Google Scholar] [CrossRef] [Scilit]
  5. Paraguay-Delgado, F.; Carreño-Gallardo, C.; Estrada-Guel, I.; Zabala-Arceo, A.; Martinez-Rodriguez, H.A.; Lardizábal-Gutierrez, D. Pelagic sargassum spp. capture CO2 and produce calcite. Environ. Sci. Pollut. Res. 2020, 27, 25794–25800. [Google Scholar] [CrossRef] [Scilit]
  6. Milledge, J.J.; Harvey, P.J. Golden Tides: Problem or Golden Opportunity? The Valorisation of Sargassum from Beach Inundations. J. Mar. Sci. Eng. 2016, 4, 60. [Google Scholar] [CrossRef] [Scilit]
  7. Rodríguez-Martínez, R.; Torres-Conde, E.; Rosellón-Druker, J.; Cabanillas-Terán, N.; Jáuregui-Haza, U. The Great Atlantic Sargassum Belt: Impacts on the Central and Western Caribbean–A review. Harmful Algae 2025, 144, 102838. [Google Scholar] [CrossRef] [Scilit] [PubMed]
  8. Tobío-Pérez, I.; Alfonso-Cardero, A.; Díaz-Domínguez, Y.; Pohl, S.; Piloto-Rodríguez, R.; Lapuerta, M. Thermochemical Conversion of Sargassum for Energy Production: A Comprehensive Review. BioEnergy Res. 2022, 15, 1872–1893. [Google Scholar] [CrossRef] [Scilit]
  9. Amador-Castro, F.; García-Cayuela, T.; Alper, H.S.; Rodriguez-Martinez, V.; Carrillo-Nieves, D. Valorization of pelagic sargassum biomass into sustainable applications: Current trends and challenges. J. Environ. Manag. 2021, 283, 112013. [Google Scholar] [CrossRef] [Scilit]
  10. Zhang, X.; Wang, Y.; Cai, J.; Wilson, K.; Lee, A.F. Bio/hydrochar Sorbents for Environmental Remediation. Energy Environ. Mater. 2020, 3, 453–468. [Google Scholar] [CrossRef] [Scilit]
  11. Khater, E.-S.; Bahnasawy, A.; Hamouda, R.; Sabahy, A.; Abbas, W.; Morsy, O.M. Biochar production under different pyrolysis temperatures with different types of agricultural wastes. Sci. Rep. 2024, 14, 2625. [Google Scholar] [CrossRef] [Scilit] [PubMed]
  12. Jerzak, W.; Acha, E.; Li, B. Comprehensive Review of Biomass Pyrolysis: Conventional and Advanced Technologies, Reactor Designs, Product Compositions and Yields, and Techno-Economic Analysis. Energies 2024, 17, 5082. [Google Scholar] [CrossRef] [Scilit]
  13. González-Arias, J.; Sánchez, M.E.; Cara-Jiménez, J. Profitability analysis of thermochemical processes for biomass-waste valorization: A comparison of dry vs wet treatments. Sci. Total Environ. 2022, 811, 152240. [Google Scholar] [CrossRef] [Scilit] [PubMed]
  14. Chambers, C.; Saha, S.; Grimes, S.; Calhoun, J.; Reza, M.T. Physical and morphological alteration of Sargassum-derived ultraporous superactivated hydrochar with remarkable cationic dye adsorption. Biomass Convers. Biorefinery 2023, 14, 29131–29144. [Google Scholar] [CrossRef] [Scilit]
  15. Islam, T.; Sultana, A.I.; Chambers, C.; Saha, S.; Saha, N.; Kirtania, K.; Reza, M.T. Recent Progress on Emerging Applications of Hydrochar. Energies 2022, 15, 9340. [Google Scholar] [CrossRef] [Scilit]
  16. Smith, R.C.; Klinger, J.; Saha, N. Process and environmental safety of thermochemical conversion of biomass. Process Saf. Environ. Prot. 2026, 205, 108209. [Google Scholar] [CrossRef] [Scilit]
  17. Farobie, O.; Amrullah, A.; Bayu, A.; Syaftika, N.; Anis, L.A.; Hartulistiyoso, E. In-depth study of bio-oil and biochar production from macroalgae Sargassum sp. via slow pyrolysis. RSC Adv. 2022, 12, 9567–9578. [Google Scholar] [CrossRef] [Scilit] [PubMed]
  18. Lu, X.; Jordan, B.; Berge, N.D. Thermal conversion of municipal solid waste via hydrothermal carbonization: Comparison of carbonization products to products from current waste management techniques. Waste Manag. 2012, 32, 1353–1365. [Google Scholar] [CrossRef] [Scilit] [PubMed]
  19. Khan, N.; Sudhakar, K.; Mamat, R. Seaweed processing: Efficiency, kinetics, and quality attributes under solar drying. Food Chem. Adv. 2025, 6, 100859. [Google Scholar] [CrossRef] [Scilit]
  20. Bilba, K.; Potiron, C.O.; Arsène, M.-A. Invasive biomass algae valorization: Assessment of the viability of Sargassum seaweed as pozzolanic material. J. Environ. Manag. 2023, 342, 118056. [Google Scholar] [CrossRef] [Scilit]
  21. Ahmad, F.; Sulaiman, M.R.; Saimon, W.; Yee, C.F.; Matanjun, P. Proximate compositions and total phenolic contents of selected edible seaweed from Semporna, Sabah, Malaysia. Borneo Sci. 2012, 31, 74–83. [Google Scholar] [CrossRef] [Scilit]
  22. Fonseca, F.G.; Funke, A.; Niebel, A.; Dias, A.P.S.; Dahmen, N. Moisture content as a design and operational parameter for fast pyrolysis. J. Anal. Appl. Pyrolysis 2019, 139, 73–86. [Google Scholar] [CrossRef] [Scilit]
  23. Fagernäs, L.; Brammer, J.; Wilén, C.; Lauer, M.; Verhoeff, F. Drying of biomass for second generation synfuel production. Biomass Bioenergy 2010, 34, 1267–1277. [Google Scholar] [CrossRef] [Scilit]
  24. Lu, J.; Li, Y.; Wang, B.; Si, H. The development of hydrothermal carbonization process using seaweed-contained water as the reaction environment and analysis of its impact on adsorption. Energy 2024, 313, 133916. [Google Scholar] [CrossRef] [Scilit]
  25. Jafarian, S.; Bolouk, A.M.L.; Norouzian, R.-S.; Taghavi, S.; Mousavi, F.; Kianpour, E.; Signoretto, M. Sargassum macro-algae-derived activated bio-char as a sustainable and cost-effective adsorbent for cationic dyes: A joint experimental and DFT study. Colloids Surf. A Physicochem. Eng. Asp. 2023, 678, 132397. [Google Scholar] [CrossRef] [Scilit]
  26. Flores-Mendoza, O.; Lopez-Arenas, T. Simulation and Evaluation of Processing Technologies for the Valorization of Sargassum. Processes 2025, 13, 1916. [Google Scholar] [CrossRef] [Scilit]
  27. Mathanker, A.; Das, S.; Pudasainee, D.; Khan, M.; Kumar, A.; Gupta, R. A Review of Hydrothermal Liquefaction of Biomass for Biofuels Production with a Special Focus on the Effect of Process Parameters, Co-Solvents, and Extraction Solvents. Energies 2021, 14, 4916. [Google Scholar] [CrossRef] [Scilit]
  28. Heidarinejad, Z.; Dehghani, M.H.; Heidari, M.; Javedan, G.; Ali, I.; Sillanpää, M. Methods for preparation and activation of activated carbon: A review. Environ. Chem. Lett. 2020, 18, 393–415. [Google Scholar] [CrossRef] [Scilit]
  29. Saha, N.; McGaughy, K.; Davis, S.C.; Reza, M.T. Assessing hydrothermal carbonization as sustainable home sewage management for rural counties: A case study from Appalachian Ohio. Sci. Total Environ. 2021, 781, 146648. [Google Scholar] [CrossRef] [Scilit] [PubMed]
  30. NOAA. Sargassum: From Sea to Shore. 2024. Available online: https://oceanservice.noaa.gov/news/sargassum/ (accessed on 17 October 2024).
  31. Turton, R.; Bailie, R.C.; Whiting, W.B.; Shaeiwitz, J.A.; Bhattacharyya, D. Analysis, Synthesis and Design of Chemical Processes, 4th ed.; Pearson: Boston, MA, USA, 2018. [Google Scholar]
  32. Saba, A.; McGaughy, K.; Reza, M.T. Techno-Economic Assessment of Co-Hydrothermal Carbonization of a Coal-Miscanthus Blend. Energies 2019, 12, 630. [Google Scholar] [CrossRef] [Scilit]
  33. Sultana, A.I.; Reza, M.T. Techno-economic assessment of superactivated hydrochar production by KOH impregnation compared to direct chemical activation. Biomass Convers. Biorefinery 2025, 15, 1957–1969. [Google Scholar] [CrossRef] [Scilit]
  34. Garlapalli, R.K.; Wirth, B.; Reza, M.T. Pyrolysis of hydrochar from digestate: Effect of hydrothermal carbonization and pyrolysis temperatures on pyrochar formation. Bioresour. Technol. 2016, 220, 168–174. [Google Scholar] [CrossRef] [Scilit] [PubMed]
  35. PayScale. Average Hourly Rate for Waste Management, Inc. Employees. 2026. Available online: https://www.payscale.com/research/US/Employer=Waste_Management%2C_Inc./Hourly_Rate (accessed on 17 March 2026).
  36. Sultana, A.I.; Cheatham, R.W.; Reza, M.T. Deep eutectic solvent pretreatment alters surface morphology and functionality of activated hydrochar resulting in enhanced carbon dioxide capture. J. CO2 Util. 2023, 68, 102350. [Google Scholar] [CrossRef] [Scilit]
  37. Cheatham, R.W.; Sultana, A.I.; Reza, M.T. Co-activation of Martian regolith and hydrochar for enhanced water retention and water holding capacity. J. Anal. Appl. Pyrolysis 2025, 189, 107064. [Google Scholar] [CrossRef] [Scilit]
  38. Saha, S.; Islam, T.; Calhoun, J.; Reza, T. Effect of Hydrothermal Carbonization on Fuel and Combustion Properties of Shrimp Shell Waste. Energies 2023, 16, 5534. [Google Scholar] [CrossRef] [Scilit]
  39. Islam, M.T.; Saha, N.; Klinger, J.L.; Reza, M.T. Technoeconomic assessment comparison of batch and continuous hydrothermal carbonization of waste corn stover into advanced biorefinery feedstock. Biofuels Bioprod. Biorefining 2023, 17, 1668–1680. [Google Scholar] [CrossRef] [Scilit]
  40. Wright, M.M.; Daugaard, D.E.; Satrio, J.A.; Brown, R.C. Techno-economic analysis of biomass fast pyrolysis to transportation fuels. Fuel 2010, 89, S2–S10. [Google Scholar] [CrossRef] [Scilit]
  41. Calero, M.; Solís, R.R.; Muñoz-Batista, M.J.; Pérez, A.; Blázquez, G.; Martín-Lara, M.Á. Oil and gas production from the pyrolytic transformation of recycled plastic waste: An integral study by polymer families. Chem. Eng. Sci. 2023, 271, 118569. [Google Scholar] [CrossRef] [Scilit]
  42. Wang, F.; Wang, J.; Gu, C.; Han, Y.; Zan, S.; Wu, S. Effects of process water recirculation on solid and liquid products from hydrothermal carbonization of Laminaria. Bioresour. Technol. 2019, 292, 121996. [Google Scholar] [CrossRef] [Scilit] [PubMed]
  43. Saba, A.; Saha, P.; Reza, M.T. Co-Hydrothermal Carbonization of coal-biomass blend: Influence of temperature on solid fuel properties. Fuel Process. Technol. 2017, 167, 711–720. [Google Scholar] [CrossRef] [Scilit]
  44. Elias, M.; Sanchez, D.L.; Saksa, P.; Hunt, J.; Remucal, J. Market analysis of coupled biochar and carbon credit production from wildfire fuel reduction projects in the western USA. Biofuels Bioprod. Biorefining 2024, 18, 1226–1237. [Google Scholar] [CrossRef] [Scilit]
  45. Zein, S.H.; Antony, A. Techno-Economic Analysis and Feasibility of Industrial-Scale Activated Carbon Production from Agricultural Pea Waste Using Microwave-Assisted Pyrolysis: A Circular Economy Approach. Processes 2022, 10, 1702. [Google Scholar] [CrossRef] [Scilit]
  46. Awad, M.I.; Makkawi, Y.; Hassan, N.M. Yield and Energy Modeling for Biochar and Bio-Oil Using Pyrolysis Temperature and Biomass Constituents. ACS Omega 2024, 9, 18654–18667. [Google Scholar] [CrossRef] [Scilit] [PubMed]
  47. Libra, J.A.; Ro, K.S.; Kammann, C.; Funke, A.; Berge, N.D.; Neubauer, Y.; Titirici, M.-M.; Fühner, C.; Bens, O.; Kern, J.; et al. Hydrothermal carbonization of biomass residuals: A comparative review of the chemistry, processes and applications of wet and dry pyrolysis. Biofuels 2011, 2, 71–106. [Google Scholar] [CrossRef] [Scilit]
  48. Zimmer, T.; Rudi, A.; Glöser-Chahoud, S.; Schultmann, F. Techno-Economic Analysis of Intermediate Pyrolysis with Solar Drying: A Chilean Case Study. Energies 2022, 15, 2272. [Google Scholar] [CrossRef] [Scilit]
  49. Langone, M.; Basso, D. Process Waters from Hydrothermal Carbonization of Sludge: Characteristics and Possible Valorization Pathways. Int. J. Environ. Res. Public Health 2020, 17, 6618. [Google Scholar] [CrossRef] [Scilit] [PubMed]
  50. Loeffler, C.R.; Bodi, D.; Tartaglione, L.; Dell’AVersano, C.; Preiss-Weigert, A. Improving in vitro ciguatoxin and brevetoxin detection: Selecting neuroblastoma (Neuro-2a) cells with lower sensitivity to ouabain and veratridine (OV-LS). Harmful Algae 2021, 103, 101994. [Google Scholar] [CrossRef] [Scilit] [PubMed]
  51. Xu, Q.; Qian, Q.; Quek, A.; Ai, N.; Zeng, G.; Wang, J. Hydrothermal Carbonization of Macroalgae and the Effects of Experimental Parameters on the Properties of Hydrochars. ACS Sustain. Chem. Eng. 2013, 1, 1092–1101. [Google Scholar] [CrossRef] [Scilit]
  52. Petrović, J.; Ercegović, M.; Simić, M.; Koprivica, M.; Dimitrijević, J.; Jovanović, A.; Pantić, J.J. Hydrothermal Carbonization of Waste Biomass: A Review of Hydrochar Preparation and Environmental Application. Processes 2024, 12, 207. [Google Scholar] [CrossRef] [Scilit]
  53. Lucian, M.; Fiori, L. Hydrothermal Carbonization of Waste Biomass: Process Design, Modeling, Energy Efficiency and Cost Analysis. Energies 2017, 10, 211. [Google Scholar] [CrossRef] [Scilit]
  54. Gamaralalage, D.; Rodgers, S.; Gill, A.; Meredith, W.; Bott, T.; West, H.; Alce, J.; Snape, C.; McKechnie, J. Biowaste to biochar: A techno-economic and life cycle assessment of biochar production from food-waste digestate and its agricultural field application. Biochar 2025, 7, 50. [Google Scholar] [CrossRef] [Scilit] [PubMed]
  55. Devault, D.A.; Massat, F.; Lambourdière, J.; Maridakis, C.; Dupuy, L.; Péné-Annette, A.; Dolique, F. Micropollutant content of Sargassum drifted ashore: Arsenic and chlordecone threat assessment and management recommendations for the Caribbean. Environ. Sci. Pollut. Res. 2022, 29, 66315–66334. [Google Scholar] [CrossRef] [Scilit]
  56. Devault, D.A.; Pierre, R.; Marfaing, H.; Dolique, F.; Lopez, P.-J. Sargassum contamination and consequences for downstream uses: A review. J. Appl. Phycol. 2021, 33, 567–602. [Google Scholar]
  57. Initiative, I.B. Biochar Standards-International Biochar Initiative. 2025. Available online: https://biochar-international.org/biochar-standards (accessed on 10 June 2026).
  58. Certificate, E.B. European Biochar Certificate. 2025. Available online: https://www.european-biochar.org/en (accessed on 10 June 2026).
  59. Khanzada, A.K.; Rizwan, M.; Al-Hazmi, H.E.; Majtacz, J.; Kurniawan, T.A.; Mąkinia, J. Removal of Arsenic from Wastewater Using Hydrochar Prepared from Red Macroalgae: Investigating Its Adsorption Efficiency and Mechanism. Water 2023, 15, 3866. [Google Scholar] [CrossRef] [Scilit]
  60. Poo, K.-M.; Son, E.-B.; Chang, J.-S.; Ren, X.; Choi, Y.-J.; Chae, K.-J. Biochars derived from wasted marine macro-algae (Saccharina japonica and Sargassum fusiforme) and their potential for heavy metal removal in aqueous solution. J. Environ. Manag. 2018, 206, 364–372. [Google Scholar] [CrossRef] [Scilit]
  61. Devrajani, S.K.; Ahmed, Z.; Qambrani, N.A.; Kanwal, S.; Sundaram, U.M.; Mubarak, N.M. Mechanism of arsenic removal using brown seaweed derived impregnated with iron oxide biochar for batch and column studies. Sci. Rep. 2024, 14, 18102. [Google Scholar] [CrossRef] [Scilit] [PubMed]
  62. Kambo, H.S.; Dutta, A. A comparative review of biochar and hydrochar in terms of production, physico-chemical properties and applications. Renew. Sustain. Energy Rev. 2015, 45, 359–378. [Google Scholar] [CrossRef] [Scilit]
  63. Spagnuolo, D.; Iannazzo, D.; Len, T.; Balu, A.M.; Morabito, M.; Genovese, G.; Espro, C.; Bressi, V. Hydrochar from Sargassum muticum: A sustainable approach for high-capacity removal of Rhodamine B dye. RSC Sustain. 2023, 1, 1404–1415. [Google Scholar] [CrossRef] [Scilit]
  64. Zhou, M.; Taiwo, K.; Wang, H.; Ntihuga, J.-N.; Angenent, L.T.; Usack, J.G. Anaerobic digestion of process water from hydrothermal treatment processes: A review of inhibitors and detoxification approaches. Bioresour. Bioprocess. 2024, 11, 47. [Google Scholar] [CrossRef] [Scilit] [PubMed]
  65. Merzari, F.; Goldfarb, J.; Andreottola, G.; Mimmo, T.; Volpe, M.; Fiori, L. Hydrothermal Carbonization as a Strategy for Sewage Sludge Management: Influence of Process Withdrawal Point on Hydrochar Properties. Energies 2020, 13, 2890. [Google Scholar] [CrossRef] [Scilit]
Figure 1. Process flow diagram for Case 1: direct pyrolysis of Sargassum.
Processes 14 02403 g001
Figure 2. Process flow diagram for Case 2: hydrothermal pyrolysis of Sargassum.
Processes 14 02403 g002
Figure 3. The NPV values for Cases 1 and 2 over a 12-year plant lifespan.
Processes 14 02403 g003
Figure 4. Sensitivity analysis showing change in breakeven price of product with respect to baseline breakeven costs for (a) Case 1 and (b) Case 2.
Processes 14 02403 g004
Table 2. Stream mass balance of Case 1’s direct pyrolysis of Sargassum.
StreamStream TypeMain ComponentsFlow Rate
(kg h−1):
Temperature (°C)Pressure (Bar)
1FeedRaw Sargassum63,562.5025.001.00
2VentMoisture and Flue Gas52,121.25105.001.00
3FeedDried Sargassum11,441.2525.001.00
4FeedNitrogen10.0025.001.00
5FeedBiochar and Pyrolysis Gas11,451.25600.001.00
6ProductCourse Biochar7005.19600.001.00
7RecyclePyrolysis Gas407.7425.001.00
8VentPyrolysis Gas3669.6325.001.00
9ProductFine Biochar368.6925.001.00
Table 3. Stream mass balance of Case 2’s hydrothermal pyrolysis of Sargassum.
StreamStream TypeMain ComponentsFlow Rate (kg/h):Temperature (°C)Pressure (Bar)
1FeedRaw Sargassum63,562.5025.001.00
2FeedDI Water3114.5625.001.00
3FeedSargassum Slurry125,853.7525.001.00
4FeedSargassum Slurry125,853.7525.002.00
5FeedPreheated Slurry125,853.75180.0010.00
6FeedCarbonized Biomass Slurry125,853.75220.0023.20
7FeedCarbonized Biomass Slurry125,853.7540.001.00
8VentFlue Gas1467.3425.001.00
9Recycle Process Liquid11,5499.4240.001.00
10FeedWet Carbonized Biomass8886.9940.001.00
11WasteProcess Liquid56,322.7340.001.00
12Recycle Process Liquid59,176.6940.001.00
13Recycle Process Liquid59,176.6940.001.10
14VentMoisture and Flue Gas2050.84105.001.00
15FeedCarbonized Biomass6836.1525.001.00
16Feed Nitrogen 10.0025.001.00
17FeedH-Biochar and Pyrolysis Gas6846.15600.001.00
18ProductH-Biochar4011.55600.001.00
19VentPyrolysis Gas2492.2925.001.00
20Recycle Pyrolysis Gas131.1725.001.00
21ProductH-Biochar211.1325.001.00
Table 4. Sizing and cost modifiers for Cases 1 and 2.
Case EquipmentSizeSize UnitK1K2K3Cost Modifier (FBM)
Case 1Conveyor 10.67m24.060.260.16-
Dryer68.17m23.560.11−0.081.25
Pyrolyzer6.40m23.560.11−0.082.60
Dust collector0.25m33.63−0.500.040.00
Conveyor 20.05m24.060.260.162.86
Hopper114.92m33.500.450.112.86
Case 2Mixer37.02m34.71−0.550.001.38
Positive Displacement Pump15.63kW3.480.140.143.24
Heat Exchanger258.05m24.83−0.850.323.29
CSTR Reactor24.68m34.11−0.470.004.00
Filter Press60.28m24.28−0.650.071.65
Pump3.75kW3.390.050.153.24
Dryer9.90m23.560.12−0.081.25
Pyrolyzer10.09m23.560.12−0.081.25
Dust Collector2.19m33.63−0.50−0.042.86
Hopper65.81m33.500.450.112.86
Conveyor 10.50m23.610.270.201.10
Table 5. Capital and annual manufacturing cost comparison for Cases 1 and 2.
Case 1Case 2
Total capital cost (USD)250,015.00587,254.00
Capital Cost Dominant equipment or groupSolid HandlingReactor Systems
Share of total capital (%)79.1359.27
Annual utility cost (USD yr−1)2,302,822.316,911,529.63
Raw material cost (USD yr−1)1,066,626.003,040,012.80
Labor cost (USD yr−1)221,671.10221,671.10
Fixed-charge (USD yr−1)1,234,068.652,778,051.48
Total manufacturing cost (USD yr−1)4,825,188.0712,951,265.01
Manufacturing Cost Dominant burdenRaw Material CostUtility Costs
Table 6. Sensitivity parameters used to determine breakeven cost ranges and the associated low and high breakeven costs.
CaseSensitivity ParameterBaseline ScenarioLSB ValueHSB ValueBase Breakeven Cost ($/Tonne) LSB Breakeven Cost ($/Tonne)HSB Breakeven Cost ($/Tonne)
Case 1Feedstock Cost (USD t−1)2.00−25.0025.0099.8217.20343.68
Case 1Cost of Natural Gas (USD m−3)0.130.110.1899.8294.43121.37
Case 1Price of Nitrogen (USD t−1)755.00500.001000.0099.8299.39100.23
Case 1Interest Rate (%)4.504.005.5099.8298.86101.88
Case 1Tax Rate (%)20.0015.0030.0099.8298.55100.53
Case 1Reaction Temperature (°C)600.00400.00800.0099.8285.78123.93
Case 2Feedstock Cost USD t−1)2.00−25.0025.00457.7870.53883.63
Case 2Cost of Natural Gas (USD m−3)0.130.110.18457.78453.61474.51
Case 2Price of Nitrogen (USD t−1)755.00500.001000.00457.78457.04458.50
Case 2Interest Rate (%)4.504.005.50457.78453.87466.27
Case 2Tax Rate (%)20.0015.0030.00457.78452.59460.73
Case 2H-Reaction Temperature (°C)220.00180.00260.00457.78392.771309.24
Disclaimer/Publisher’s Note: The statements, opinions and data contained in all publications are solely those of the individual author(s) and contributor(s) and not of MDPI and/or the editor(s). MDPI and/or the editor(s) disclaim responsibility for any injury to people or property resulting from any ideas, methods, instructions or products referred to in the content.