1. Introduction
Over the past decades, the increasing anthropogenic pressure on ecosystems and the rise in greenhouse gas (GHG) emissions, estimated at approximately 37.6 Gt of CO
2 from the energy sector [
1], have intensified the interest in innovative climate-mitigation strategies and in the sustainable management of residual biomass [
2]. In this context, technologies for Carbon Capture and Storage (CCS) gained considerable attention, and among them, the storage of carbon in biochar represents a promising strategy to mitigate CO
2 emissions [
3]. Biochar is a carbon-rich material produced through the thermochemical conversion of organic feedstocks, such as agricultural waste and forestry by-products, under limited or absent oxygen atmosphere, via processes such as pyrolysis or gasification [
4]. Its application to soil provides a dual benefit: on one hand, the stable carbon fraction stored in soil prevents CO
2 release; on the other hand, biochar can improve soil quality and agricultural productivity [
5]. Moreover, biochar is increasingly recognized as an advanced functional material, for example as a catalyst support in various applications [
6].
Life Cycle Assessment (LCA) is the most widely recognized methodology to systematically evaluate the environmental aspects and impacts of a product, technology or service across its entire life cycle. The LCA framework is defined and regulated by the ISO 14040:2006 and the ISO 14044:2006 standards [
7,
8]. LCA of biochar production and soil application is an interesting topic among researchers with various articles and reviews published in the last decade, approximately half a thousand documents between 2015 and 2025 [
9]. Despite the substantial number of published studies, direct comparison of results remains challenging due to differences in methodological choices, including system boundaries, Functional Units (FUs), and dataset composition. In addition, biochar can be produced from a wide range of feedstocks and through various technologies, further increasing the complexity of cross-study comparisons [
10]. Recent studies include the works of Sahoo et al. [
11] and Puettmann et al. [
12], which investigate portable systems for localized valorisation of forest residues to produce biochar. The environmental impact of biochar production, comparing various feedstocks with a cradle-to-gate approach, was assessed by Patel et al. [
13], while Arfelli et al. [
14] focused the study on the impacts of combined energy and biochar production through gasification. Furthermore, Osman et al. reviewed the role of biochar as sorbent for soil remediation [
15]. Another relevant work was published by Tisserant et al. regarding the deployment of biochar in Norwegian soils using the management of 1 ha of soil for a year as a FU [
16].
In the present work, the environmental impact of biochar production from pyro-gasification of wood pellets and its application on the soil have been assessed through LCA methodology. The system boundaries follow a cradle-to-grave approach, with 1 kg of biochar as a FU. The introduction of a heat recovery unit to valorise the by-products of the biochar production process is evaluated in a second scenario, named improved scenario, in order to quantify and qualify the impacts of energy integration within the system.
2. Materials and Methods
2.1. Goal and Scope
The main objective of this study is to assess the potential environmental impacts of the production of biochar through pyro-gasification of residual biomass and its application on the soil. The production of the biochar was carried out on a pilot-scale plant, and the study is based on the experimental results collected during these tests. The main objectives are:
The study focuses on Italian and transport datasets, and the results may change when different national electricity mixes or transportation scenarios are considered. Nevertheless, this ensures high data quality, transparency, and the use of verified primary data derived directly from pilot-scale operations, avoiding the introduction of broad uncertainties associated with generalised assumptions. The primary goal of this work was to evaluate the local environment feasibility and hotspots of biochar production coupled with pilot-scale heat recovery, rather than to perform a global macro-assessment. The methodology and process models established in this paper are scalable and adaptable by researchers in other countries, who can apply the proposed GaBi workflow by substituting local electricity mix datasets and adjusting transportation parameters to fit their specific regional conditions.
2.2. Functional Unit and Data Quality
The main function of the whole system is the production of biochar through pyro-gasification conducted in a pilot-scale plant using residual and waste biomass. The FU of the study is therefore 1 kg of dry biochar. The mass and energy flows of the whole process and, in general, all input and output data are calculated considering this Functional Unit as reference. In this LCA study, two types of data are used:
Primary data, obtained from experimental tests of the pilot plant by direct measurement or calculation of the process.
Secondary data obtained from the GaBi Professional database, Ecoinvent 3.01 database, or published sources.
2.3. System Boundaries and Process Description
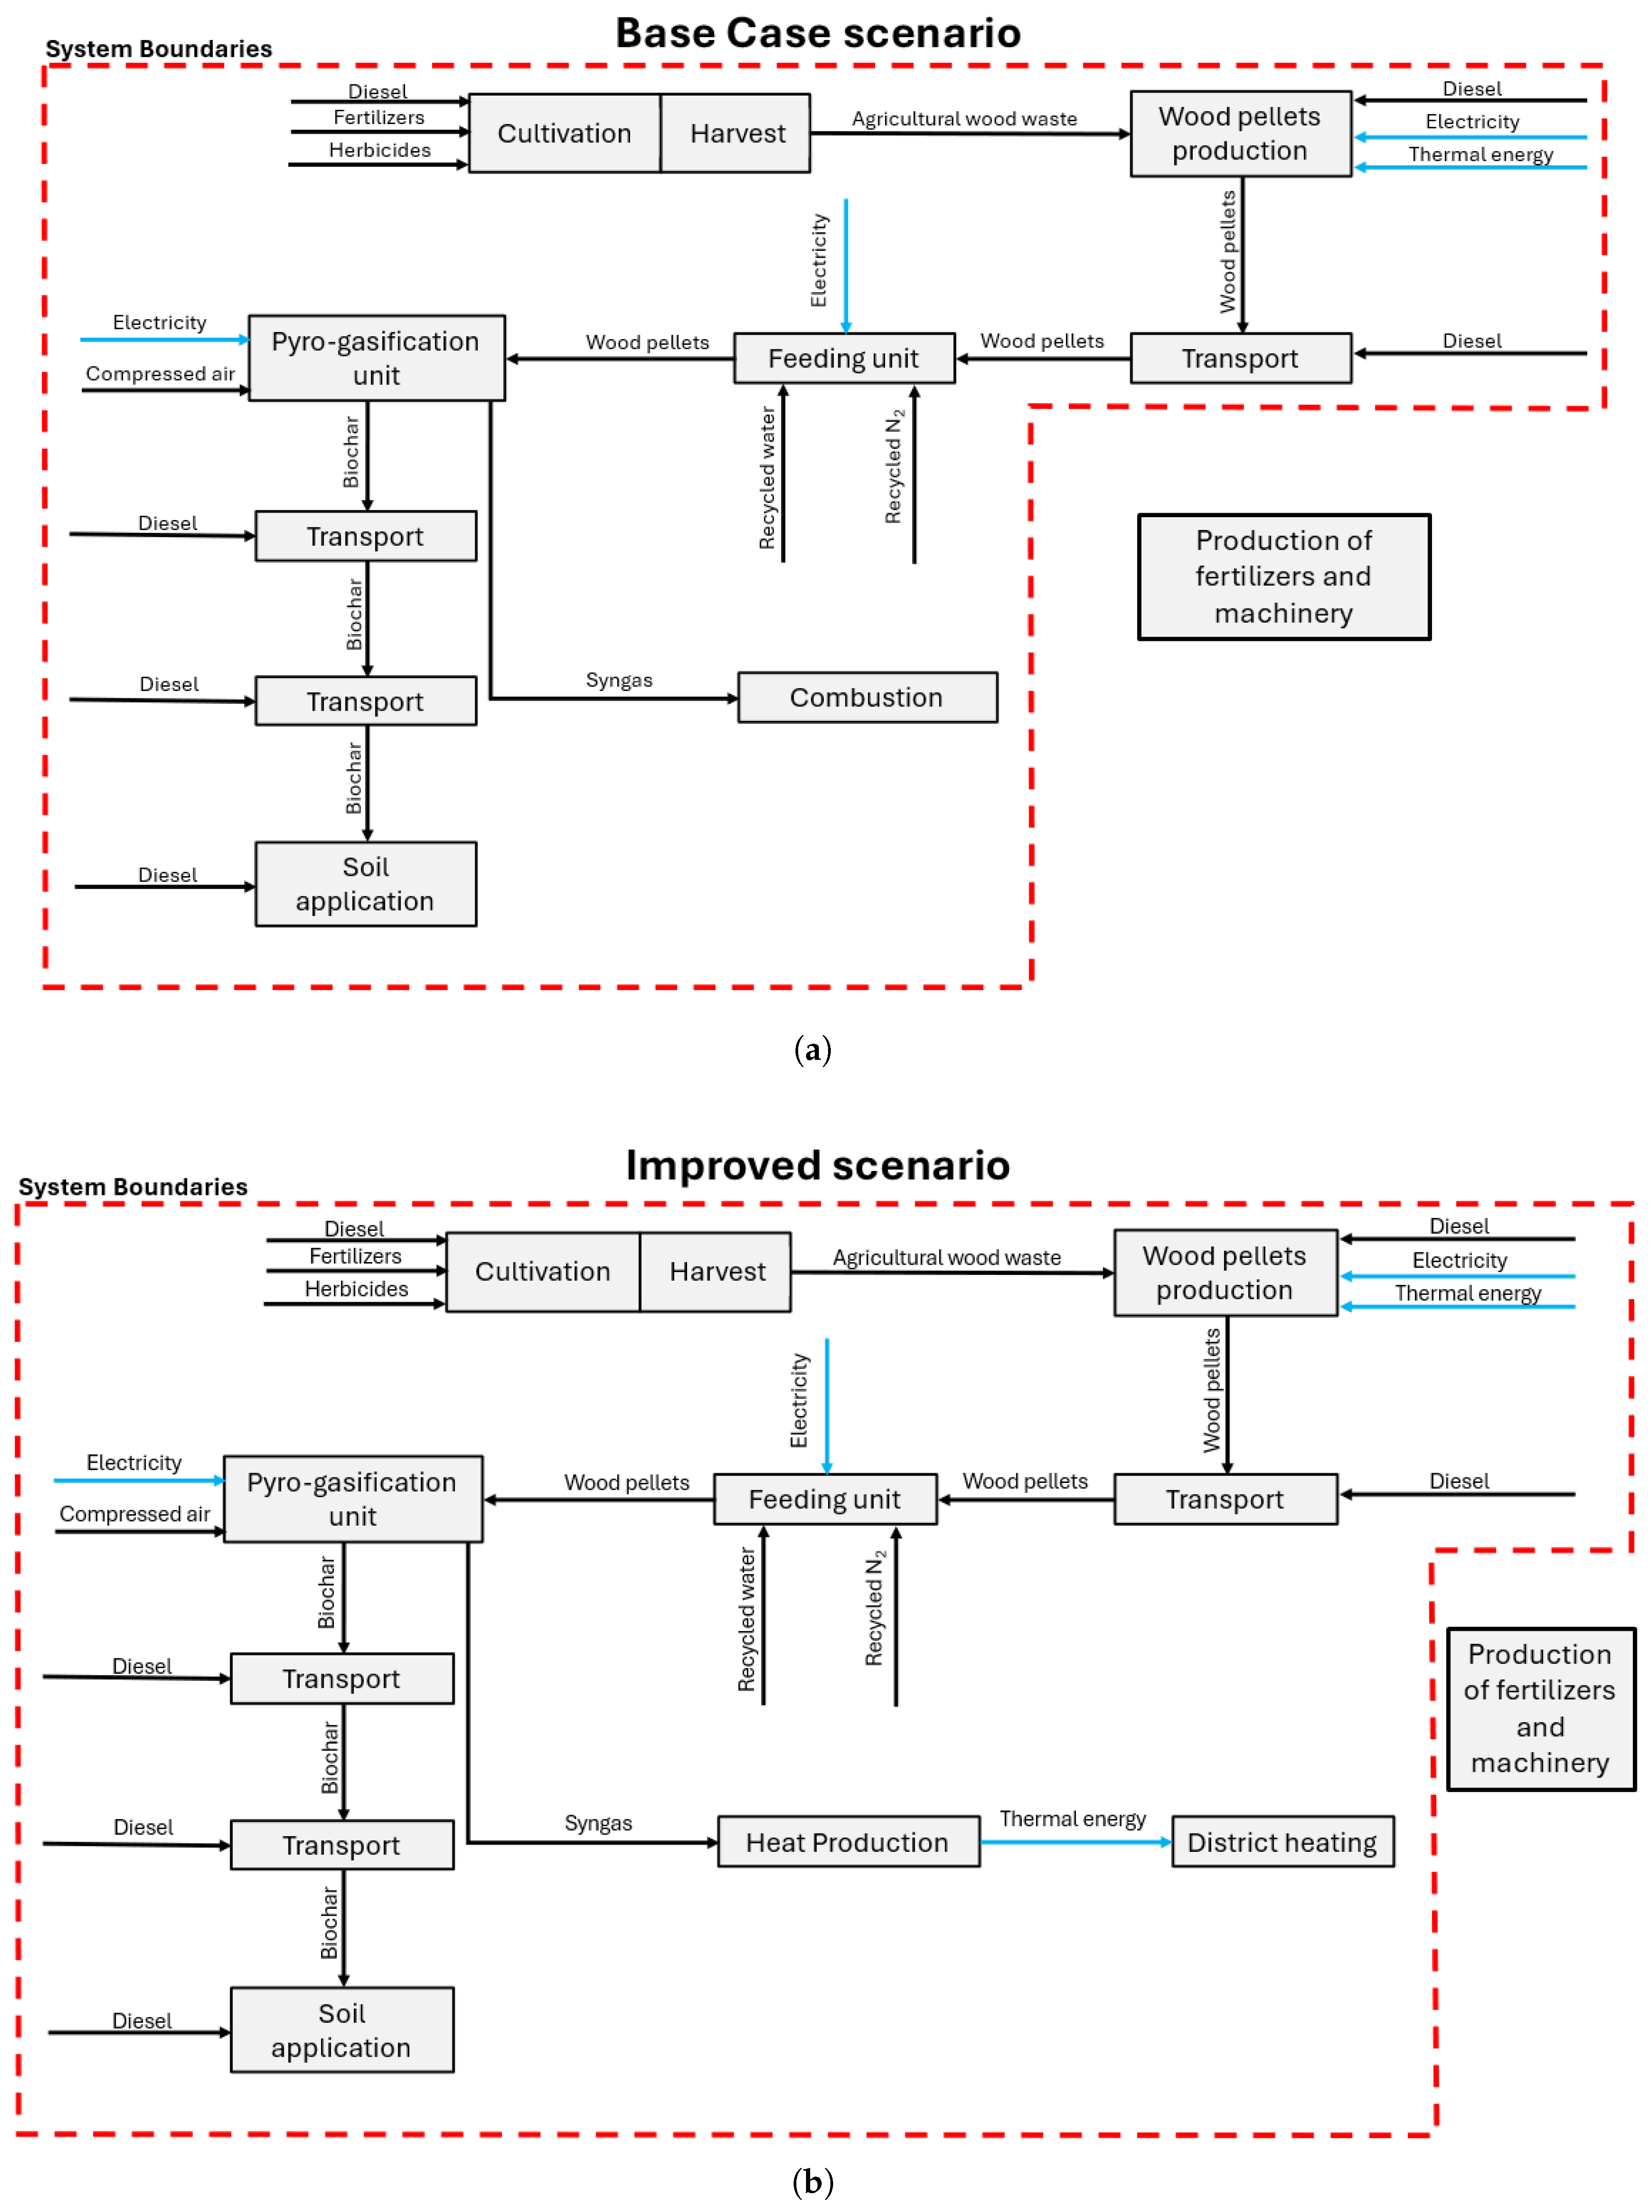
The biochar production and utilisation scenarios consist of multiple processes presented in
Figure 1a for the base case scenario and in
Figure 1b for the improved scenario. The model comprises the steps from wood cultivation to the application of biochar to the soil following a cradle-to-grave approach. The system boundaries include the transportation of pellets to the pyro-gasification facility, as well as the transportation of produced biochar and its spreading to the soil. The materials and manufacturing of the pyro-gasification plant, the heat production facility and the manufacturing of other machinery are excluded from the system boundaries. Furthermore, the effect of biochar on soil emissions, fertiliser needs in crop cultivation and crop yields are not considered in this study. The agricultural wood wastes, after the pelletization process, are sent and stored at the plant. Then, 40 kg/h of pellets are sent to the pyro-gasification unit through a double feeding screw. The pyro-gasifier unit is a rotating drum operating with air as gasification agent, with an Equivalence Ratio ER(O
2) of 0.15. The pyrolysis temperature (400–500 °C) is reached with electrical resistors equipped in the reactor. The biochar, produced continuously, is collected in a tank and subsequently transported before its application to the soil. In the base case scenario, the remaining pyro-gasification products, gases, vapours, and bio oil are sent to a heated calming chamber and subsequently to a torch. In the improved scenario, these streams are directed to a heat generation and distribution network.
2.4. Life Cycle Inventory
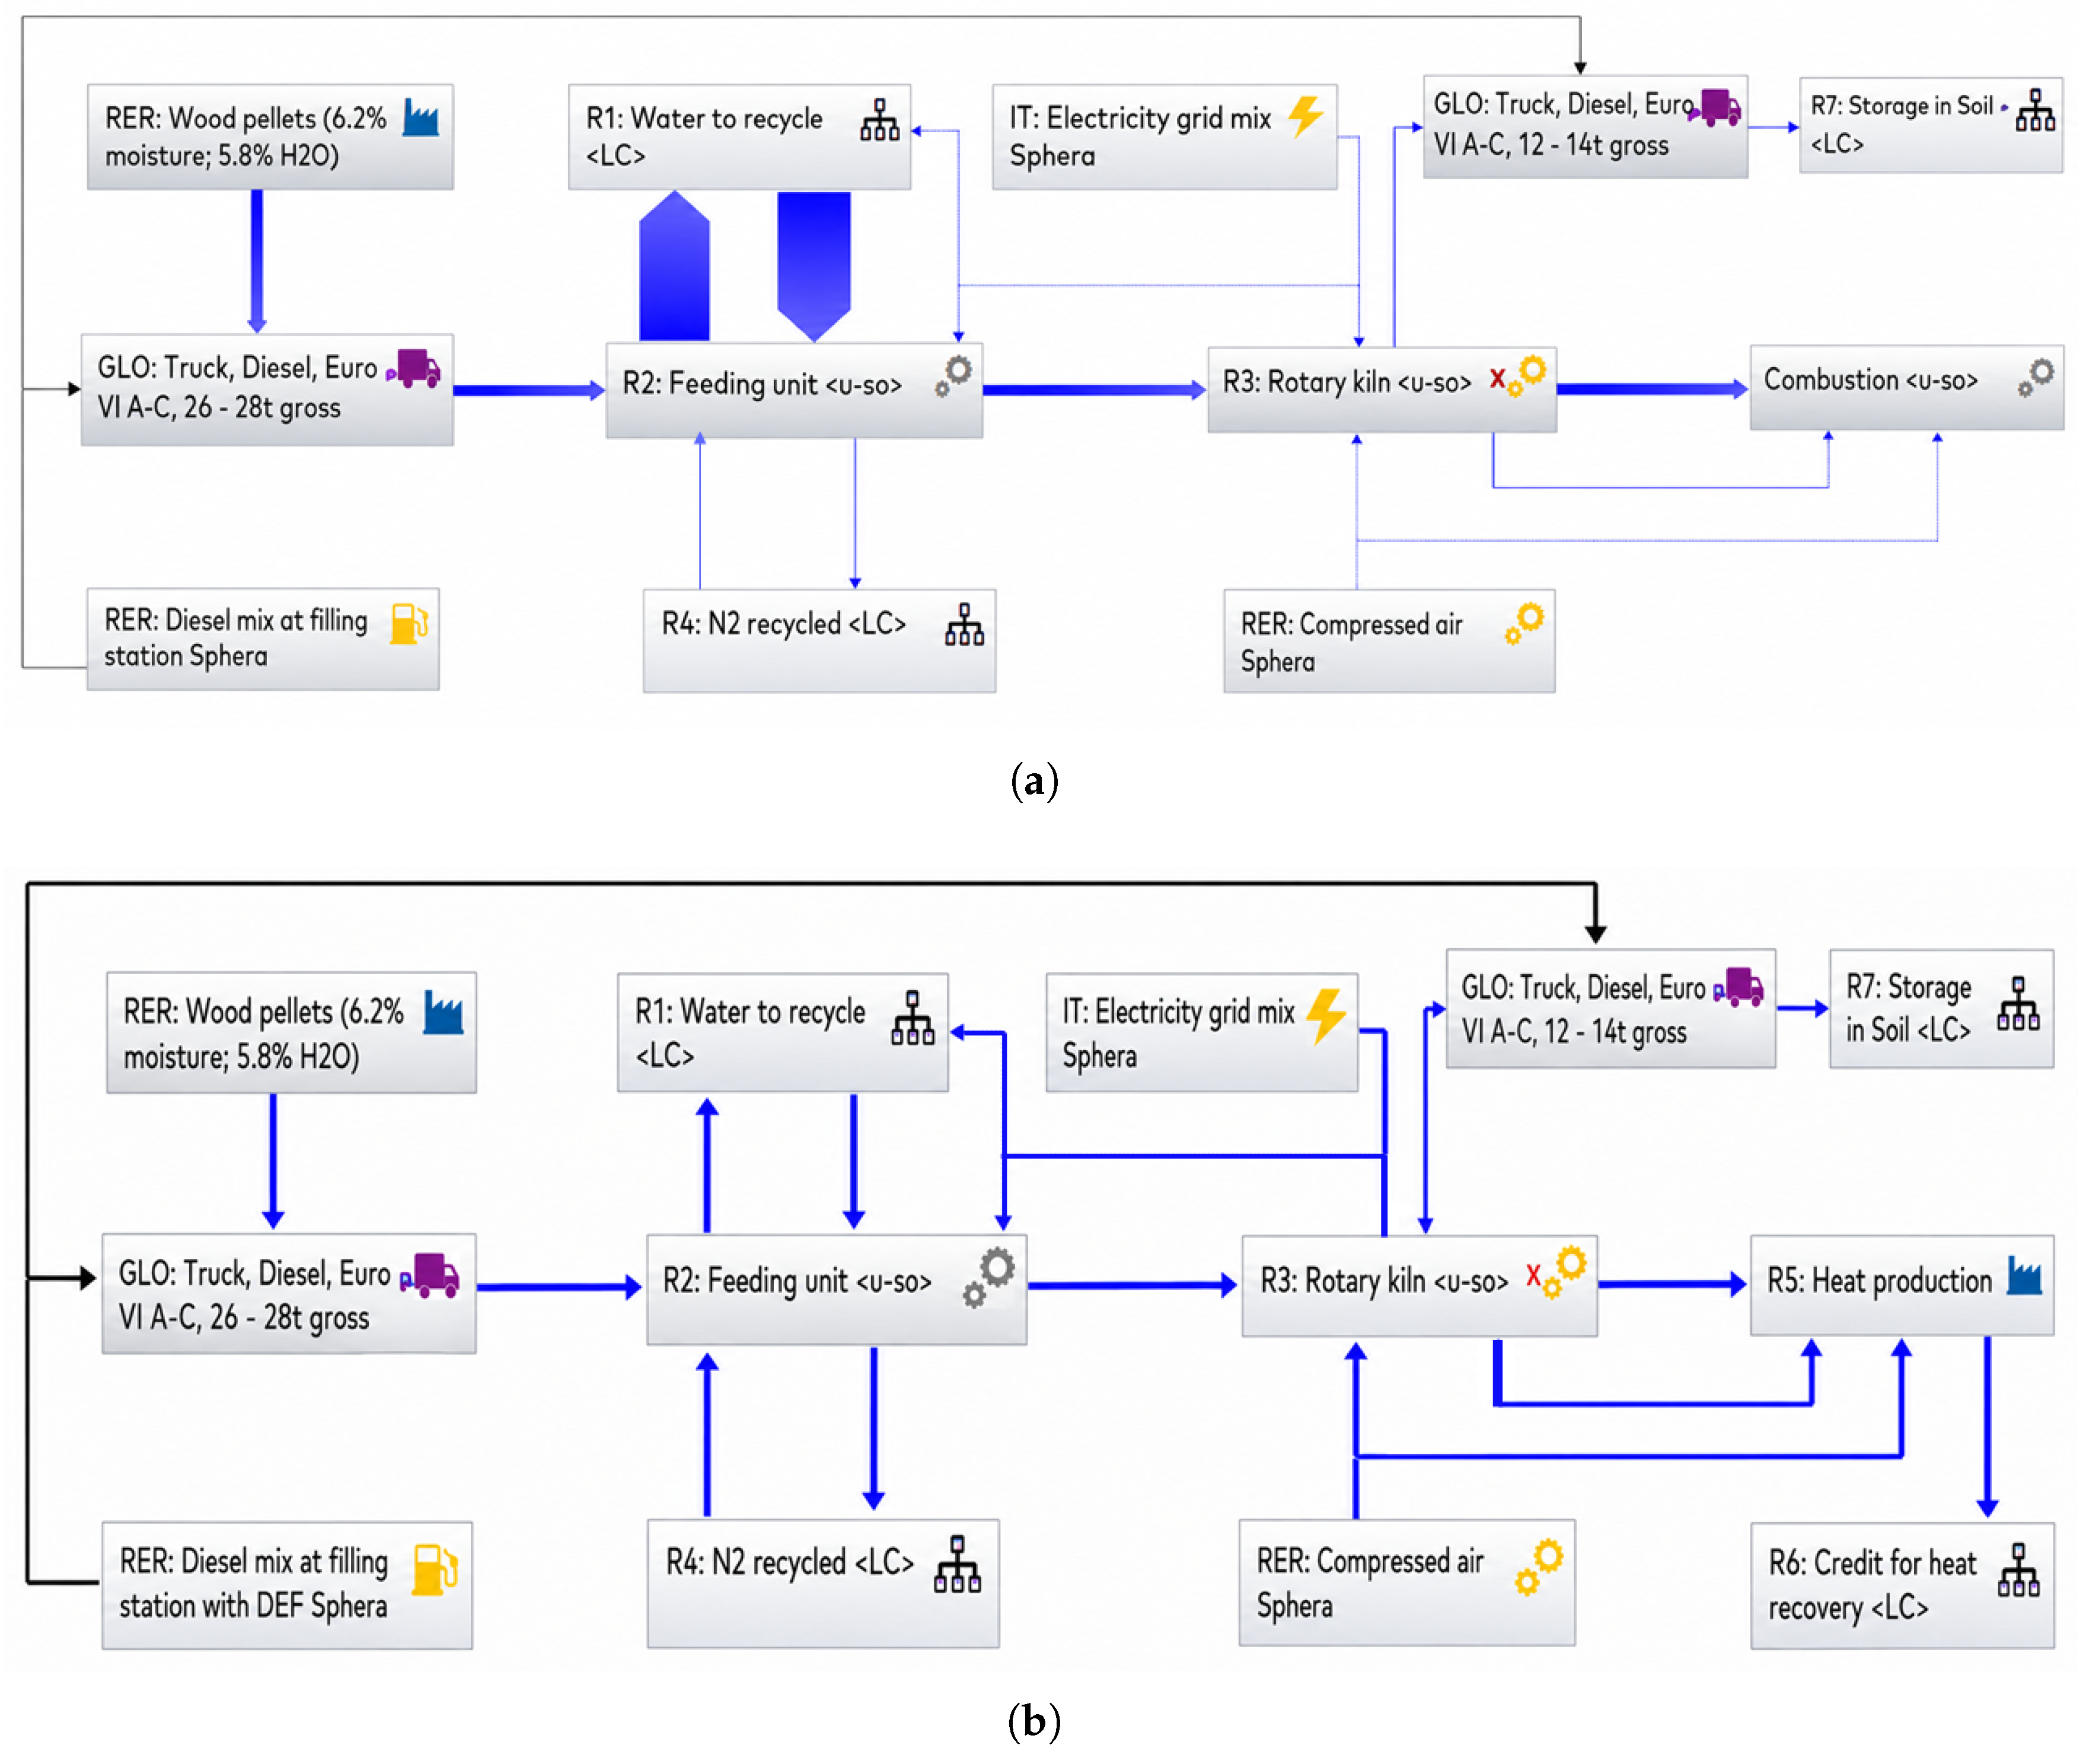
The data presented for each unit in this subsection are quantified based on the basis of experimental tests carried out on a pilot-scale pyro-gasifier and on the nominal power of the various equipment installed in the plant. The GaBi models for both studied scenarios are presented in
Figure 2a,b, involving the following processes: (i) pellet production, (ii) transport, (iii) pyro-gasification, (iv) biochar storage in soil, (v) auxiliary services, (vi) combustion and heat generation.
2.4.1. Pellet Preparation
The feedstock chosen for biochar production is pellets of vine prunings. This feedstock ensures a stationary process and allows for the production of stable biochar. The pellets exhibit a standard diameter of 6 mm and an average length of 20–30 mm, ensuring optimal flowability through the feeding screws. The composition of the pellets as well as the comparison with literature data are reported elsewhere [
18]. In the GaBi environment, the pelletization operations have been modelled with an aggregated process that contains the entire life cycle data of wood pellets. The dataset is referred to the production of 1 kg of wood pellets with 6.2 wt% of moisture and is currently indicated as RER (Rest of Europe Region): Wood pellets. The electricity and thermal energy demand are not included in the dataset.
2.4.2. Transport Operation
After the pelletization of the residual biomass, the wood pellets are transported to the pyro-gasification facility. The transport distance considered is 100 km, assuming that it is the distance from the pellet production site to the pyro-gasification facility. Transport has been modelled in the GaBi environment with the process GLO: Truck-trailer, Euro 6, 26–28 t gross weight and payload capacity of 18.4 t, setting the distance to 100 km. At the end of the pyro-gasification process, the biochar is transported for its application on the soil. This operation has been modelled in the GaBi environment with the process GLO: Truck, Euro 6 A–C, 12–14 t gross weight and payload capacity of 9.3 t, setting the distance to 20 km. The inputs of the transport model are diesel and cargo, while the outputs are cargo and combustion emissions (ammonia, benzene, carbon dioxide, carbon monoxide, methane, nitrogen monoxide, nitrogen dioxide, nitrous oxide, Non-Methane Volatile Organic Compounds (NMVOC), PM 2.5 particulate, sulphur dioxide). Truck production, end-of-life treatment, and the fuel supply chain (emissions from exploration, refinery, transportation, etc.) are not included in the data set. Moreover, the diesel inputs for each transport operation have been modelled with the process RER: Diesel mix at filling stations, covering the entire supply chain of the filling station products. This includes well drilling, crude oil production and processing, transport of crude oil to the refinery, either through pipelines or by vessel, and transport from the refinery to the filling station.
2.4.3. Feeding Unit
The feeding system of the pyro-gasifier consists of three screws designed to process a mass flow rate ranging from 0 to 40 kg/h. The feedstock is extracted from the accumulation hopper by a horizontal dosing screw and sent to an inclined screw. The feedstock is then conveyed into a third feeding screw and successively sent into the reactor through a loading chamber. Before each loading operation, an N
2 flow of 10 L/min is injected into the third screw to avoid pyro-gasification gases rising from the reactor. The screw is also cooled with 200 L/h of water to avoid the start of the process in the feeding system. The feeding system is equipped with an electric motor and an inverter powered by electricity from the grid with a power consumption of 1.4 kW. Three new processes were created in the GaBi environment to model the feeding system: feeding unit, water to recycle, and N
2 recycled. The inputs of these processes are residual wood pellets, water, nitrogen and electricity, and the whole dataset is reported in
Table 1.
2.4.4. Pyro-Gasification Reactor Unit
Slow pyrolysis is usually applied to produce biochar with an average biochar yield of 35%, variable in the range between 20 and 45% [
19,
20]. An average biochar of 30% is assumed in this assessment, requiring 3.33 kg of residual wood pellets to produce 1 kg of biochar. The pyro-gasification unit consists of a 3° inclined rotary kiln rotating at a speed of 1 rpm. The inclined design eases the movement of material through the reactor as it rotates, while the rotation enhances mixing and ensures that the feedstock is evenly exposed to heat. The 3° inclination of the kiln rotating at a speed of 1 rpm ensures the optimal solid residence time of 9 min for complete devolatilization of the feedstock [
21]. The slow pyro-gasification process starts with three electrical resistors that heat the system at a temperature in the range of 450–500 °C. This temperature range was selected based on experimental optimisation to maximise biochar yield and carbon stability. After reaching the desired temperature, the resistors are turned off, and air is introduced in the reactor with an ER(O
2) of 0.15. This specific Equivalence Ratio was experimentally determined to provide sufficient exothermic partial oxidation to sustain the endothermic pyrolysis reactions, thereby minimising external energy input, while preventing the full gasification of the solid residue. The air supply takes over the resistors as primary heat source for the pyrolysis or gasification process. The introduction of air ensures the partial oxidation of the organic material in the reactor, resulting in the production of biochar, gases, vapours and pyrolysis oil. The dataset for the pyro-gasification unit is reported in
Table 2. The data presented for each unit in this subsection are quantified based on experimental tests carried out on the pilot-scale pyro-gasifier. Specifically, the inventory represents the average values derived from 3 distinct steady-state experimental runs, each lasting 4 to 6 h. Data were continuously logged at 3 min intervals, and transient startup/shutdown phases were excluded from the mass and energy balances. Under these stable conditions, the average biochar yield was 30% with a standard deviation of ±3.3%. All input and output flows presented in
Table 1 and
Table 2 represent the arithmetic means of these steady-state measurements.
2.4.5. Biochar Stability and Storage in Soil
According to Colantoni et al. [
22], who characterised biochar derived from the pyrolysis of pelletized grapevine residues, the carbon content of the biochar is 72.8 wt%. Biochar is a heterogeneous material consisting of two carbon pools with different persistences in soil: the persistent aromatic carbon (PAC) and the semi-persistent carbon (SPC) [
23]. PAC is composed of large clusters of aromatic carbon rings (typically more than seven) and is highly resistant to degradation, with a mean residence time in soil exceeding 1000 years [
24,
25]. The SPC pool contains aliphatic, small aromatic, and hetero-atomic carbon species, which are more degradable in soil [
26]. A common assumption for biochar permanence in soil is that the 68% of the carbon remains in soil after 100 years and it has been applied to this study [
27]. Considering the carbon content (72.8%) and the assumed biochar stability (68% of the carbon after 100 years), 0.495 kg of carbon are stored for at least 100 years when 1 kg of dry biochar is applied to soil. One kilogram of carbon corresponds to 3.67 kg of CO
2 based on molar mass ratios. Therefore, storing 0.495 kg of carbon results in the storage of approximately 1.81 kg/FU of CO
2. The remaining 32% of biochar carbon is considered as degradable and released over the 100-year assessment period as biogenic CO
2. In the GaBi environment, this biochar carbon storage was modelled by creating a new process (R7: Storage in soil), where the inputs are biochar and 1.81 kg CO
2/FU.
2.4.6. Auxiliary Services
The production of electricity is modelled with the aggregated process IT: Electricity grid mix. This dataset represents the average country-specific (Italy) electricity supply for final consumers, including own electricity consumption, transmission and distribution, grid losses, and electricity imports from neighbouring countries. The national energy mix used for electricity production, power plant efficiencies, the shares of electricity-only and Combined Heat and Power (CHP) generation, as well as transmission/distribution losses and own consumption, are calculated based on various information sources for the corresponding reference year. Detailed power plant models are used, combining measured emission values (e.g., NOx) with calculated ones (e.g., heavy metals). The inventory is partly based on primary industry data and partly on secondary literature data. The supply of compressed air used in the pyro-gasification and combustion processes is modelled with the aggregated process RER: Compressed air.
2.4.7. Combustion and Heat Generation
In the base case scenario, the vapours and gases produced during pyro-gasification are directed to a torch for combustion. A dedicated combustion process was created in GaBi, taking air, syngas, and pyrolysis oil as inputs. In the improved scenario, the heat produced from the combustion of pyro-gasification by-products is recovered and supplied to a heating network. A new process, named Credit for heat recovery, was created in GaBi. This process also takes air, syngas and pyrolysis oil as inputs, while the outputs include heat for the district heating network and air emissions. The heat generated is used to substitute the heat produced from natural gas combustion in the heating network. A thermal efficiency of 0.95 is adopted for both scenarios. In the improved scenario, the specific localised pipeline distribution losses of the district heating network are excluded from the model, since they depend on specific site layouts and network lengths. The datasets used for the combustion and heat generation processes are reported in
Table 3.
2.5. Life Cycle Impact Assessment
Based on the LCI, the environmental impacts of the system are quantified in the Life Cycle Impact Assessment (LCIA) phase. The impact categories considered in this study, summarised in
Table 4, are calculated according to the CML-IA baseline methodology (CML 2001, ver. Aug. 2016 [CML 2001], additionally ver. 2001–ver. Jan. 2016) [
28]. In addition to these impact categories, the study also evaluates the primary energy demand from renewable resources and from non-renewable resources.
2.6. Results Presentation
Data analysis was performed using Microsoft Excel, while MATLAB R2024b, developed by MathWorks Inc. (Natick, MA, USA) [
29], has been used for data visualisation and plot generation. In the present work, the following results are presented:
The comparison of the two scenarios, base case and improved, has been conducted by evaluating the Relative Improvement (RI), calculated as shown in Equation (
1):
where
represents the environmental impact category. The use of absolute value is necessary because of the presence of negative values.
Normalized Contribution (NC) of each process within each environmental impact category has been calculated with Equation (
2):
where
represents the environmental impact of a process in a given category.
Detailed analysis of GWP to assess the contribution of each process to the total GWP in both scenarios.
Energy demand from renewable and non-renewable sources expressed in MJ/FU net calorific value (NCV).
A sensitivity analysis was also carried out to assess how the variation of key parameters affects the overall assessment. The sensitivity analysis was conducted on the improved scenario, considering three cases:
Biomass and biochar distance set to 50 km.
Biomass and biochar distance set to 500 km.
Heat recovery efficiency set to 0.85.
3. Results and Discussions
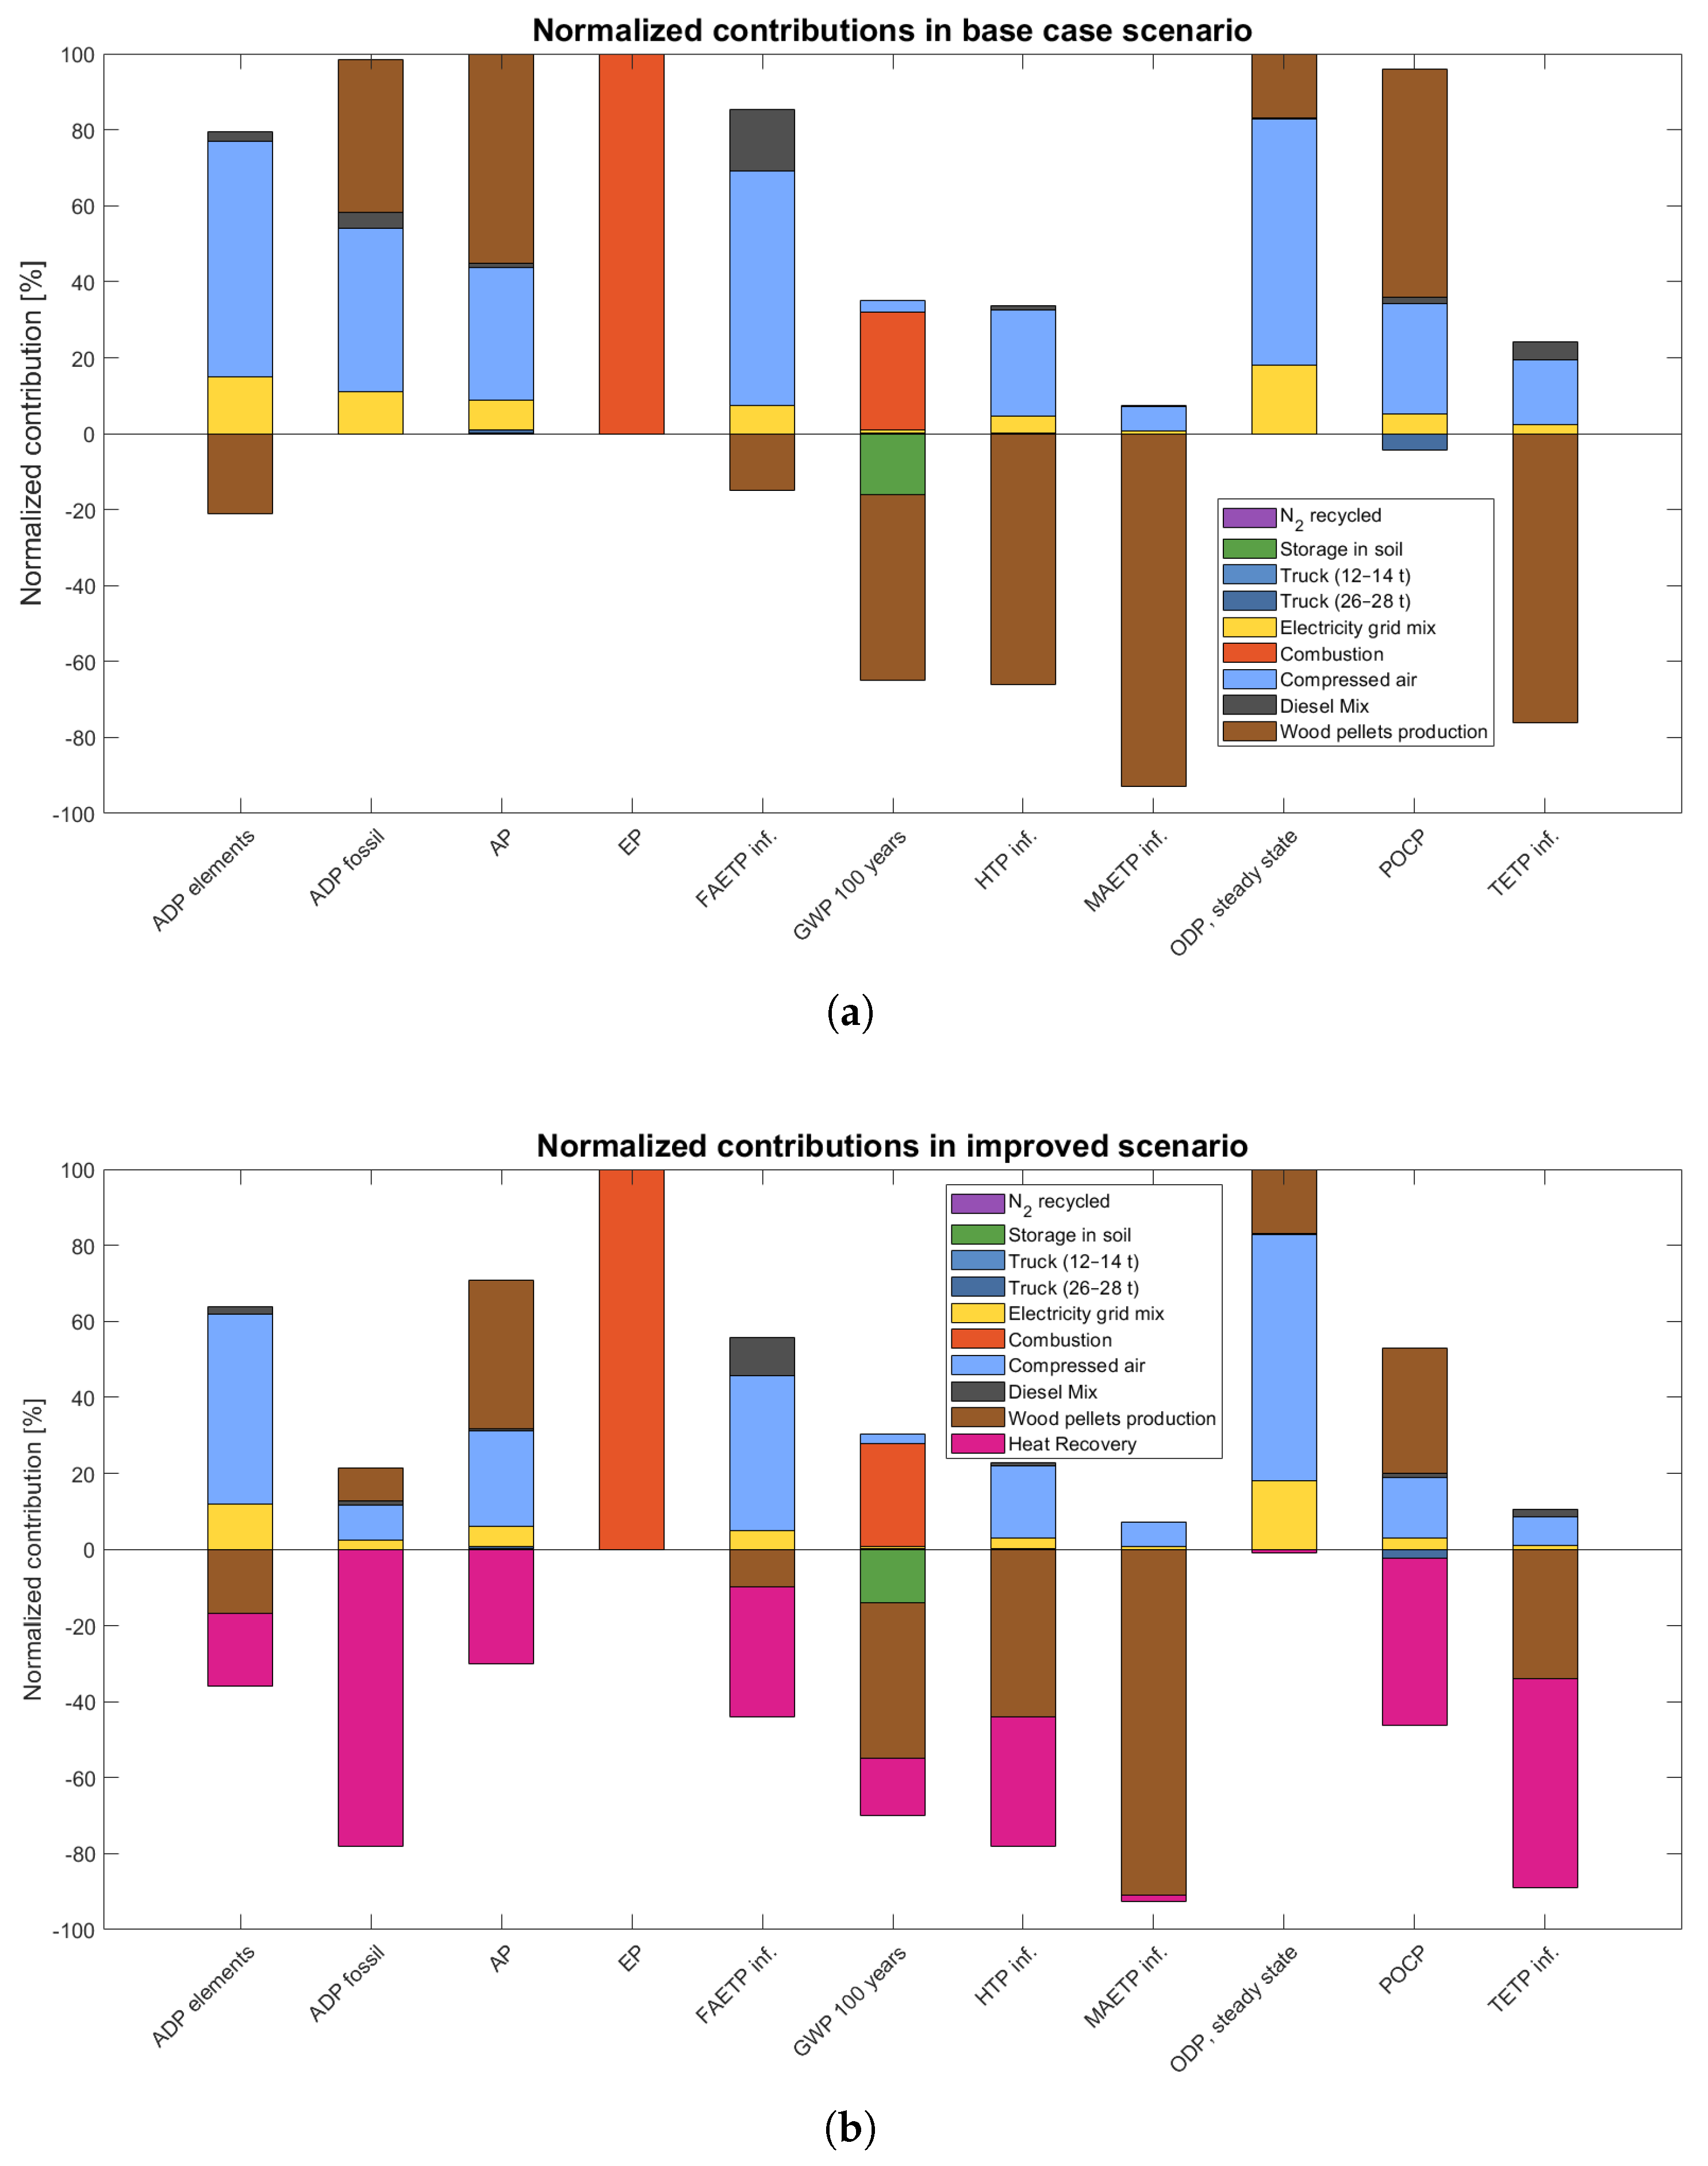
The comparison between the base case scenario and the improved scenario shows that the improved configuration achieves better environmental performance in most of the impact categories reported in
Table 4. The total values for each environmental impact category for both scenarios, and the RI, are summarized in
Table 5, while the analysis of NC for each process is shown in
Figure 3a for base case scenario and
Figure 3b for improved scenario.
This improvement can be attributed to the enhanced energetic valorisation of the pyrolysis by-products. In the base case scenario, these products are sent to a torch, whereas in the improved scenario they are recovered for heat generation. The heat generated is convoyed to a district heating network, replacing the combustion of natural gas. This mechanism generates an energetic credit, reducing the demand for fossil fuels and the associated emissions, thereby increasing the overall process efficiency and lowering the related emissions. The addition of the heat recovery unit in the improved scenario has, as expected, a major influence on the reduction of fossil fuel consumption for heat generation. By using the gaseous and liquid pyrolysis products as an energy source, the system avoids the use of fossil fuels. This benefit is particularly evident in the ADP fossil category where an RI of 364.9% is observed. This result is consistent with the contribution analysis, shown in
Figure 3a,b, in which the heat recovery unit accounts for approximately 78% of the total ADP fossil impact. Furthermore, the implementation of the heat recovery unit leads to a negative ADP fossil value, decreasing from 9.10 MJ/FU in the base case scenario to −24.1 MJ/FU in the improved scenario. The terrestrial and human toxicity categories show the second and third largest improvements following the introduction of the heat recovery unit, with RI values of 233.1% and 157.2%, respectively. In the base case scenario, both environmental impact categories already exhibit negative values, meaning that the system provides an environmental benefit by avoiding emissions in terms of kg of DCB eq., mainly due to wood pellets production. In the improved scenario, the values remain negative but are larger in absolute terms: the TETP inf. changes from −9.61·10
−4 kg DCB eq. to −3.2·10
−3 kg DCB eq. in the improved case, and the HTP changes from −1.89·10
−2 kg DCB eq. to −4.87·10
−2 kg DCB eq. Most of the environmental impact categories (ADP elements, AP, FAETP inf., GWP 100 years and POCP) show an RI between approximately 40% and 88% with particular emphasis on GWP 100 years that already in the base case scenario have a negative value, confirming that the biochar application on soil is a valid strategy for CCS as shown in
Figure 3a. The addition of the heat recovery unit improved this effect with a Normalized Contribution of approximately 15%. The EP, MAETP, and OLDP categories benefit the least from the introduction of the heat recovery unit with RI values of 1.74% for MAETP, 0.86% for OLDP, and 0.00% for EP. In the EP category, in both scenarios the major contribution is related to combustion, and the addition of the heat recovery unit has a negligible effect on this impact category.
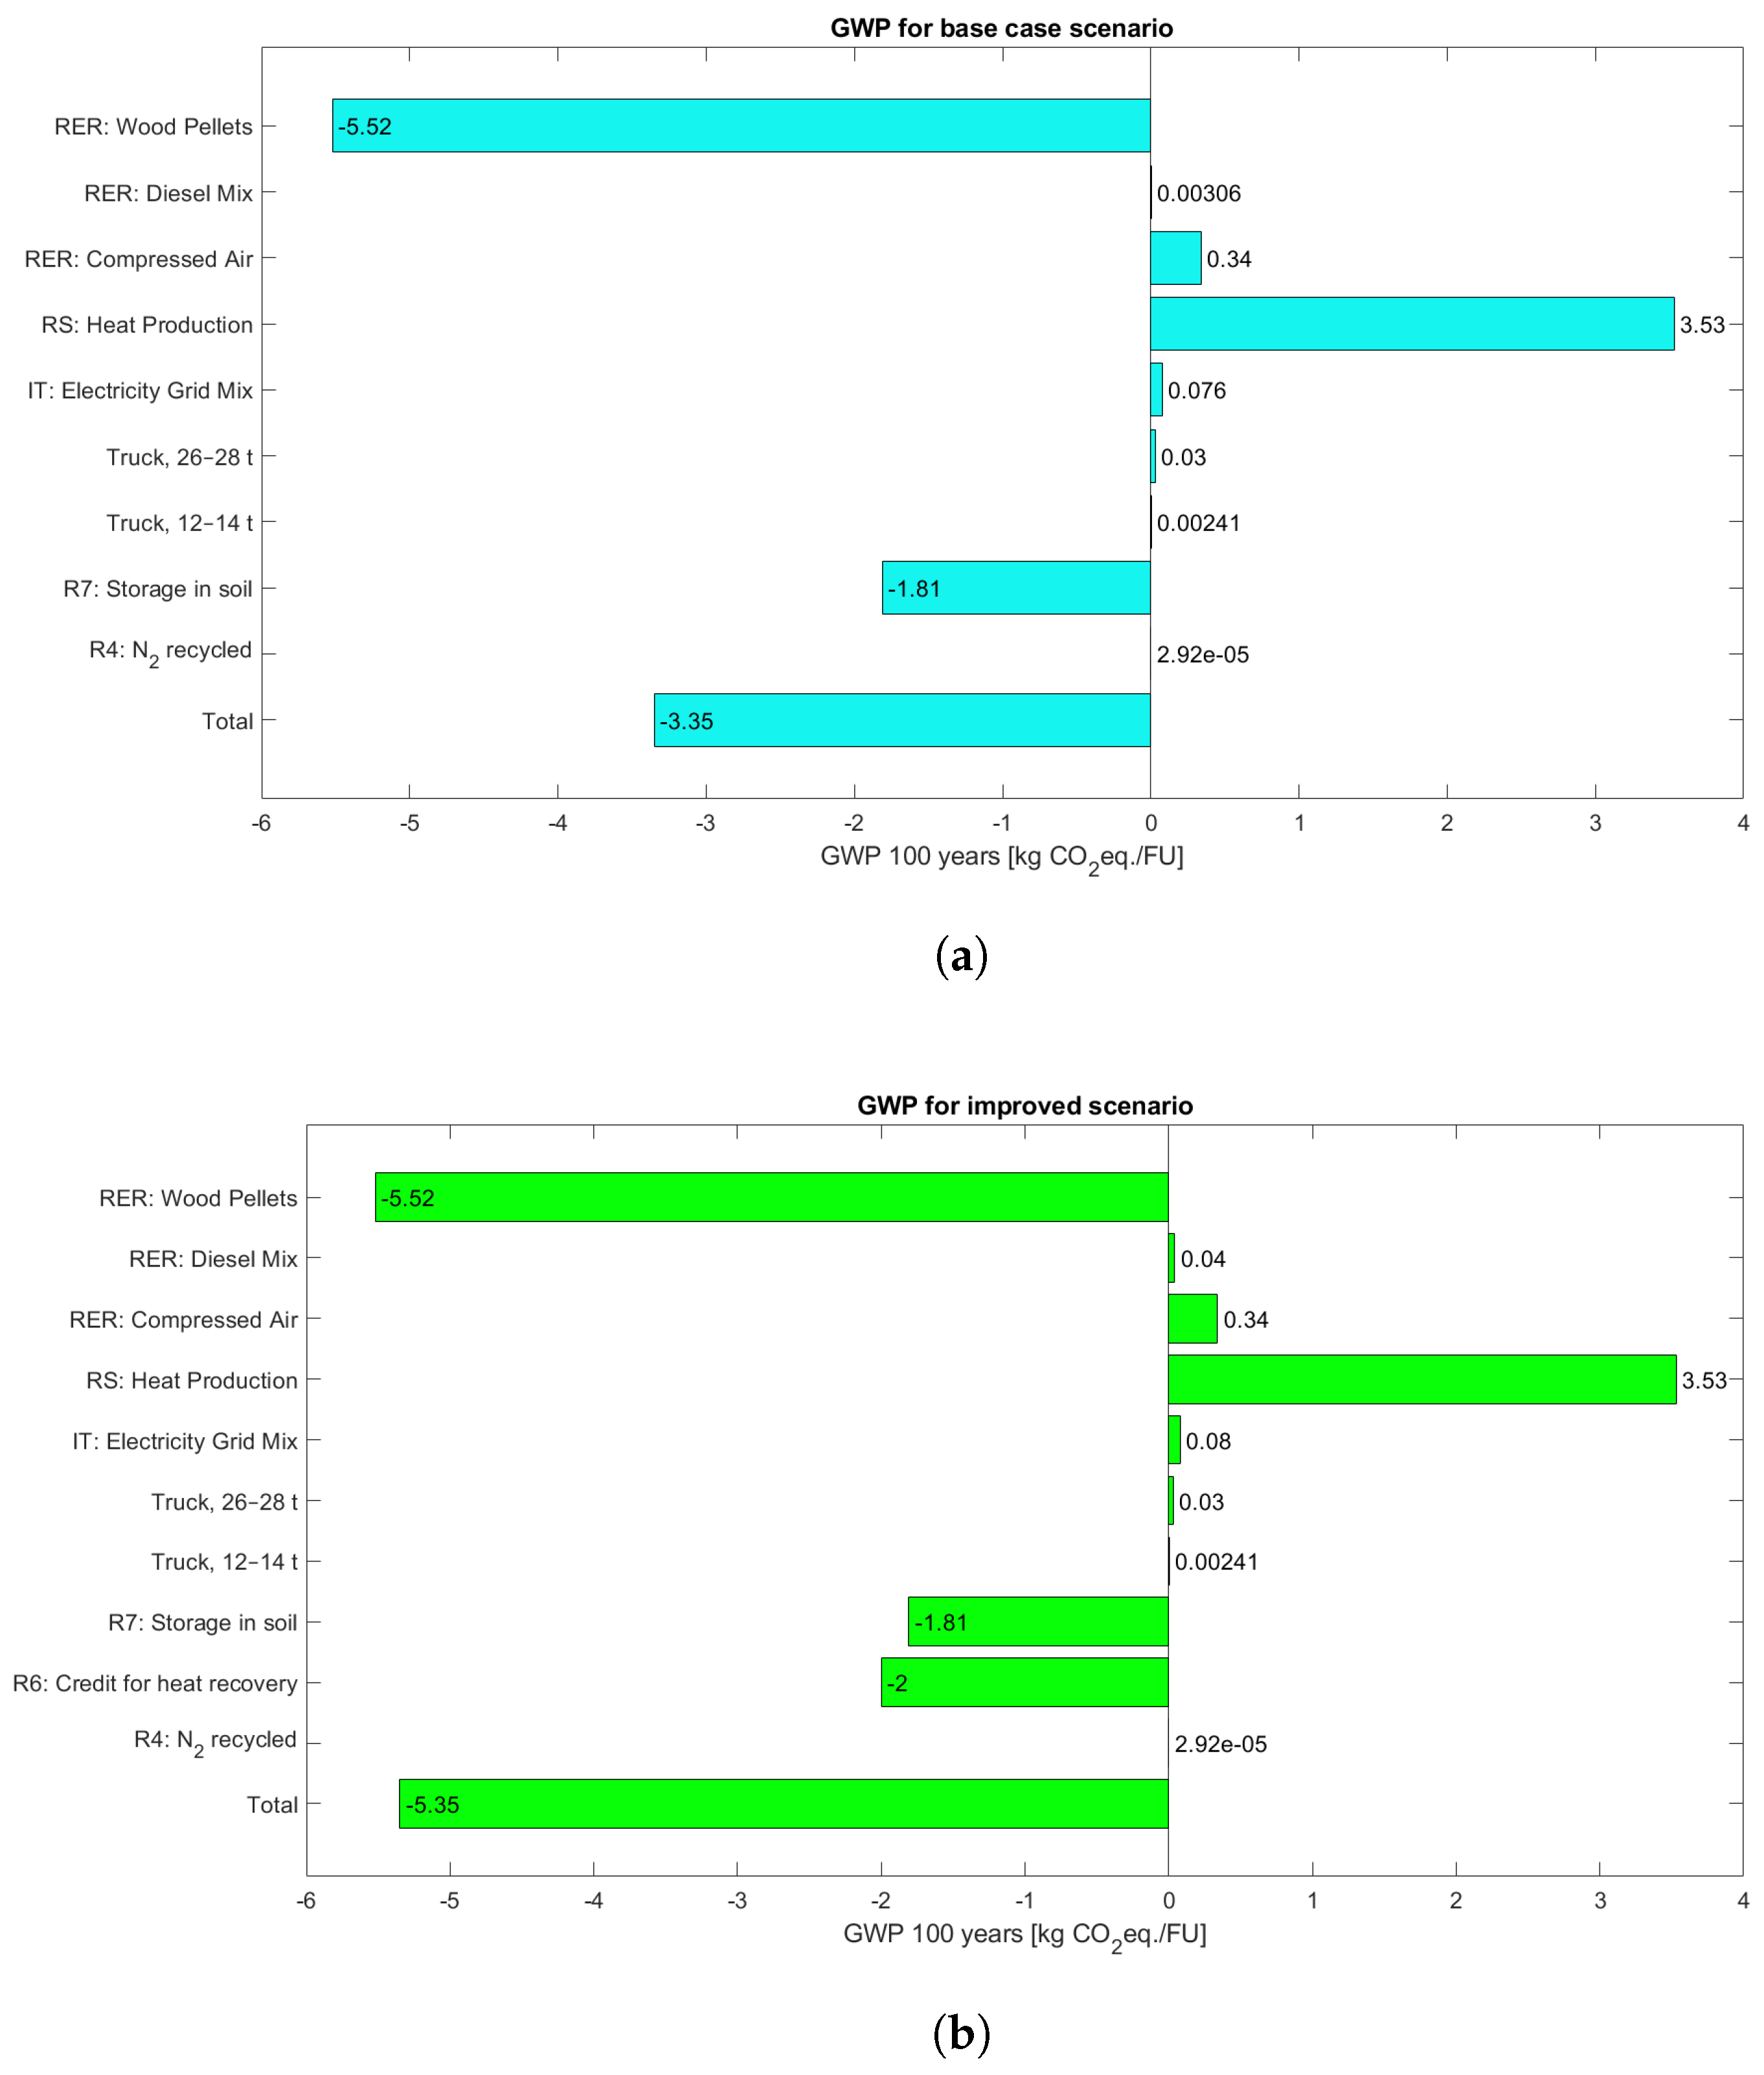
The detailed analysis of the GWP results shows a negative carbon balance in both scenarios. In the base case scenario, shown in
Figure 4a, the total GWP is −3.35 kg CO
2 eq./FU resulting from the combination of negative contributions from biomass growth (−5.52 kg CO
2 eq./FU) and carbon sequestration in soil (−1.81 CO
2 eq./FU), and positive contributions associated with process emissions, as combustion of gases and pyrolysis oils (+3.53 kg CO
2 eq./FU), compressed air production (+0.34 kg CO
2 eq./FU) and electricity consumption (+0.08 kg CO
2 eq./FU). In the improved scenario, shown in
Figure 4b, the GWP is further reduced thanks to the contribution of the heat recovery system (−2.00 kg CO
2 eq./FU), for a total GWP of −5.35 kg CO
2 eq./FU.
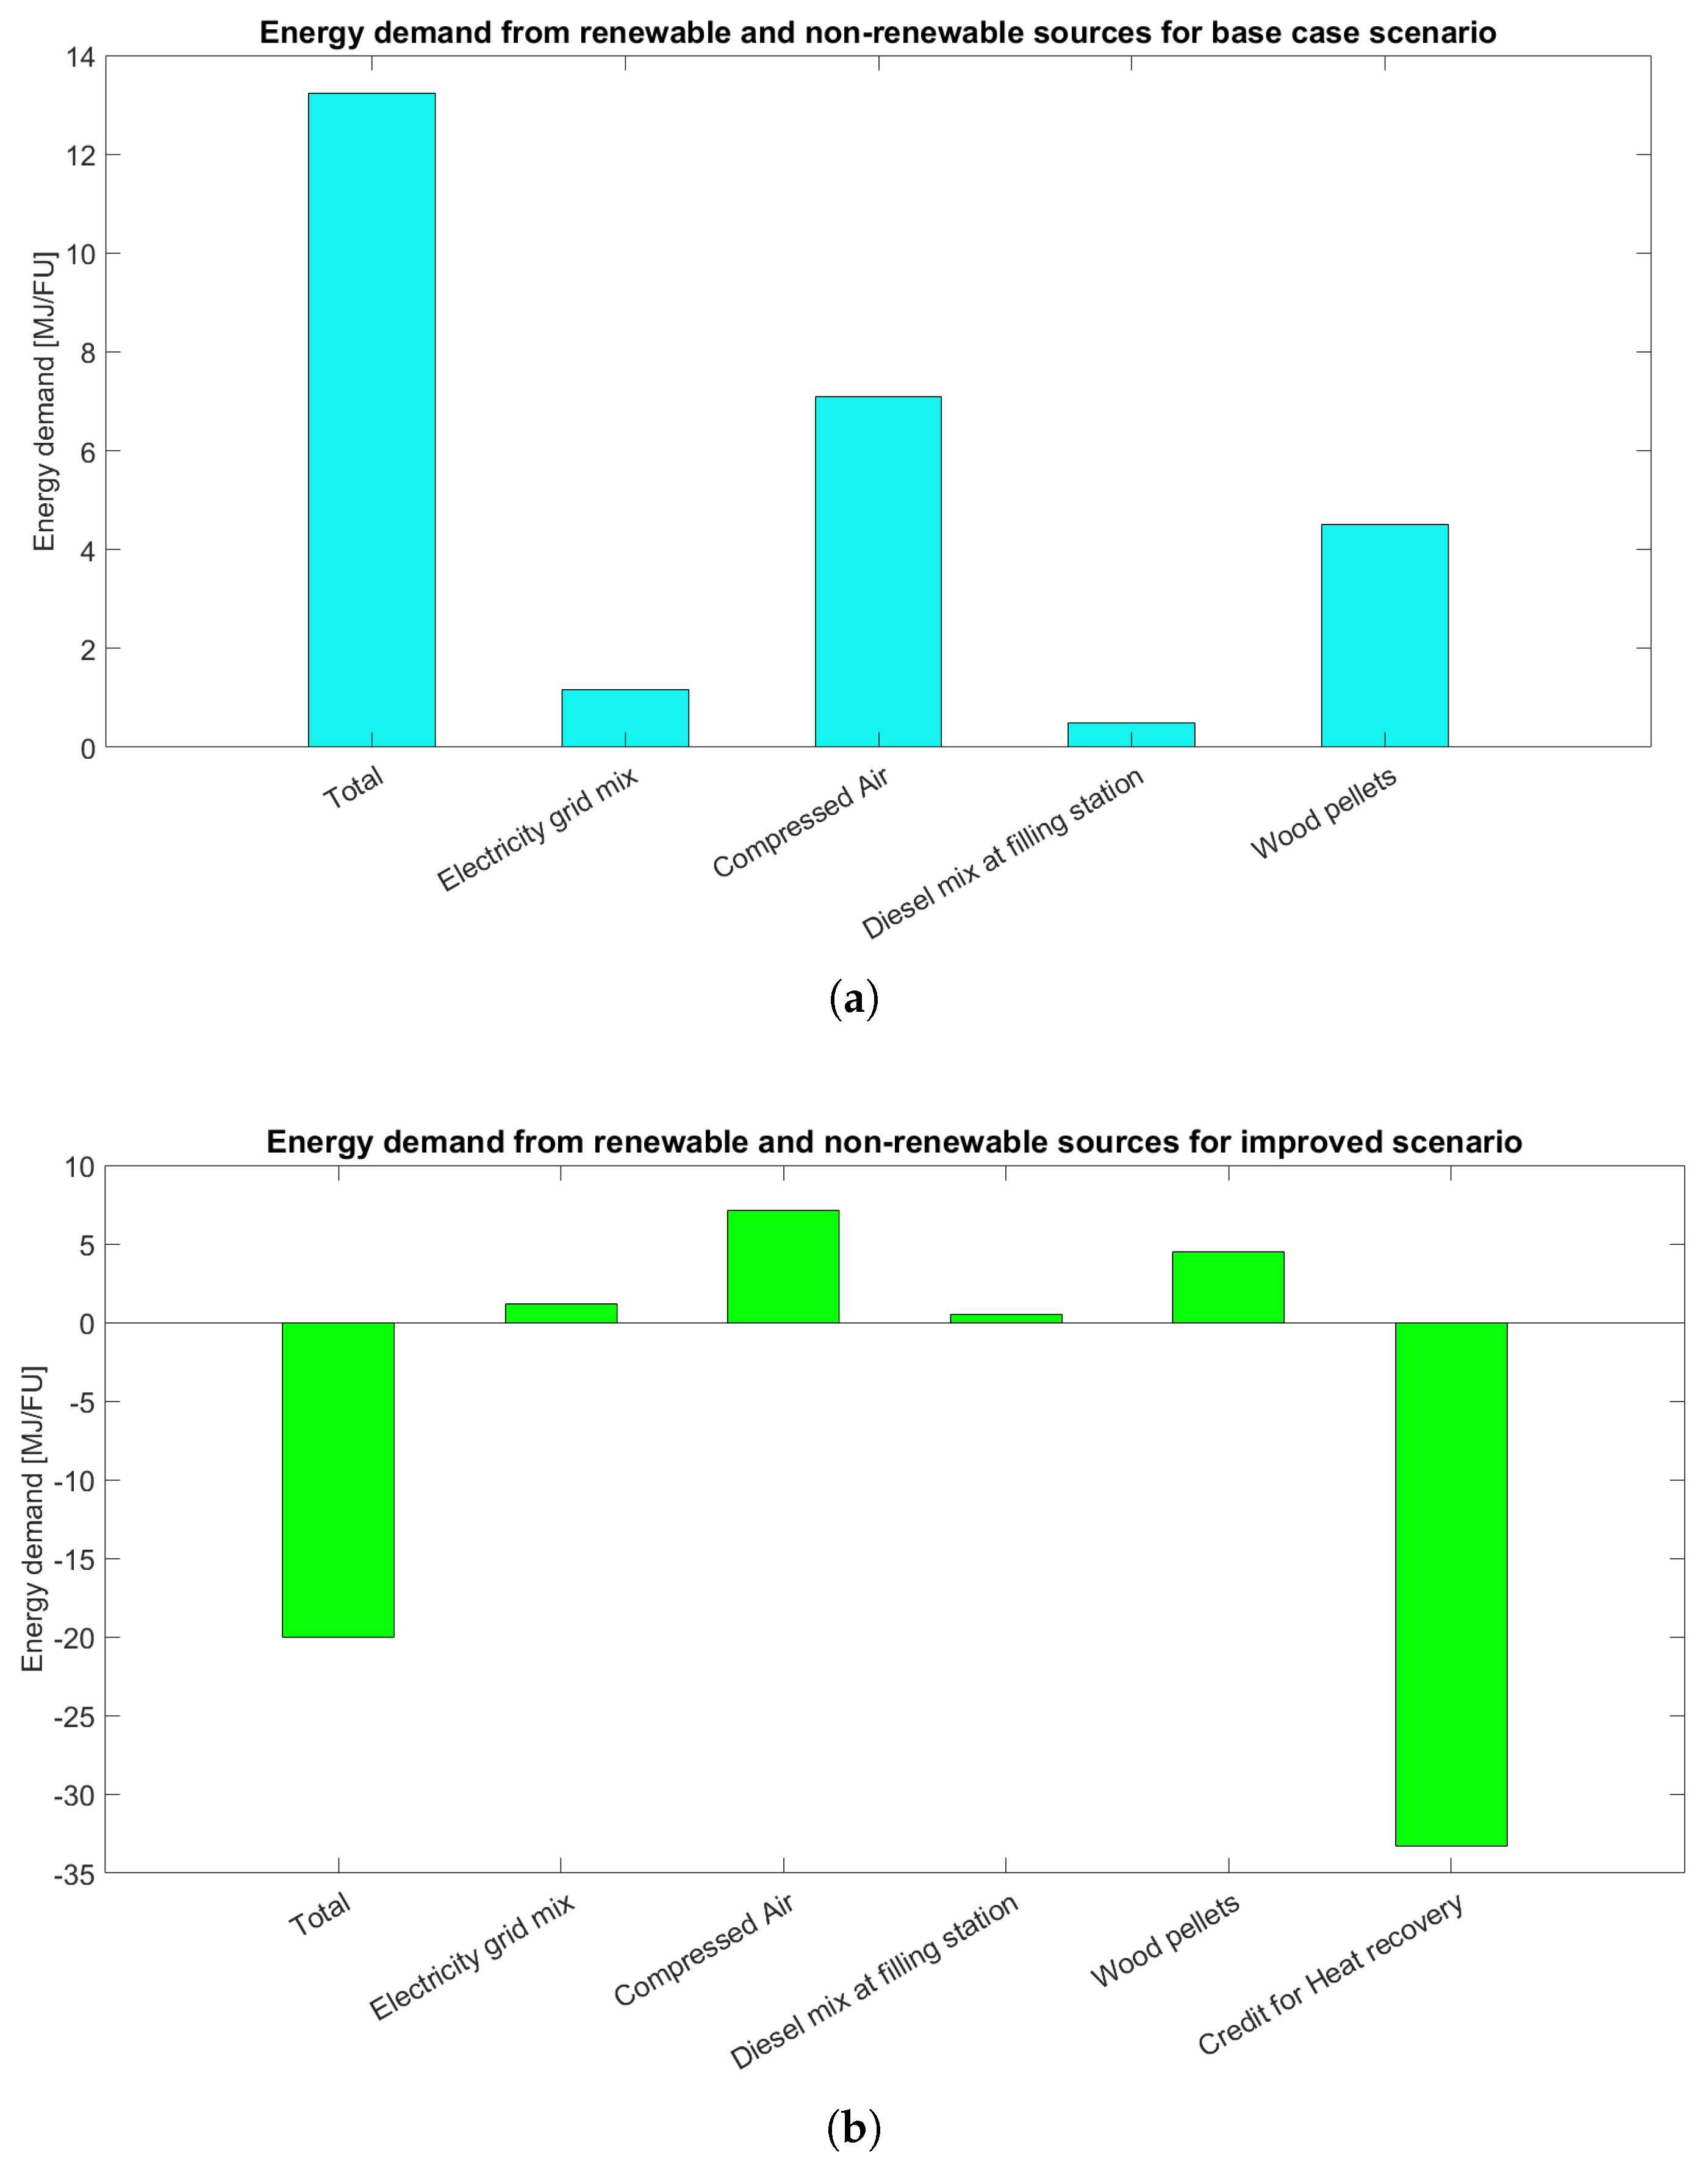
The results of the analysis of the primary energy demand from renewable and non-renewable sources expressed in MJ/FU NCV are shown in
Figure 5a for the base case scenario and in
Figure 5b for the improved scenario. In the base case scenario, the system shows a positive primary energy demand of 13.24 MJ/FU, where the major components are the compressed air production (7.1 MJ/FU) and the biomass pelletization (4.5 MJ/FU). In the improved scenario, the impact of the heat recovery credit −33.3 MJ/FU outweighs the upstream energy requirement and results in a net primary energy demand of −20.02 MJ/FU, reflecting the avoided fossil energy consumption attained by replacing the fossil-based heat with the recovered heat from pyrolysis gaseous and liquid products. The hotspot analysis reveals that compressed air production and biomass pelletization also remain major contributors to the system’s energy demand in the improved scenario that demonstrated significant environmental benefits. Several practical engineering measures can be implemented to further optimise the environmental performance of the process at an industrial scale. In the case of compressed air, this includes deploying variable speed drive compressors, implementing rigorous leak management programs, and recovering compressor waste heat for biomass drying. Regarding pelletization, plant designs should evaluate the feasibility of processing directly shredded biomass (e.g., appropriately sized wood chips), thereby bypassing the energy-intensive pelletization step entirely. Alternatively, integrating the recovered heat from pyro-gasification to power the biomass drying phase before pelletization could extensively reduce the reliance on external energy sources.
To ensure the robustness of the pilot-scale model, the results were validated against published LCA studies on biochar derived from lignocellulosic biomass. The GWP results obtained in this assessment (−3.35 kg CO
2 eq./FU and −5.35 kg CO
2 eq./FU for the base case and improved scenarios, respectively) are consistent with the literature consensus that biochar acts as a net carbon sink. For instance, studies by Sahoo et al. [
11] and Tisserant et al. [
16] on biochar from forest and agricultural residues report net-negative GWP values generally ranging from −0.5 kg CO
2 eq./kg of biochar to −3.5 kg CO
2 eq./kg of biochar, depending on system boundaries and energy recovery configurations. The base case scenario of this study falls within this range. The higher carbon negativity observed in the improved scenario is attributed to the specific combination of high biochar carbon content (72.8 wt%), the 68 % carbon permanence assumption, and the substantial fossil fuel substitution credit resulting from the recovery of pyrolysis by-products for heat generation. This benchmarking confirms that the GaBi model built upon our experimental data yields sound results.
Sensitivity Analysis and Scale Up
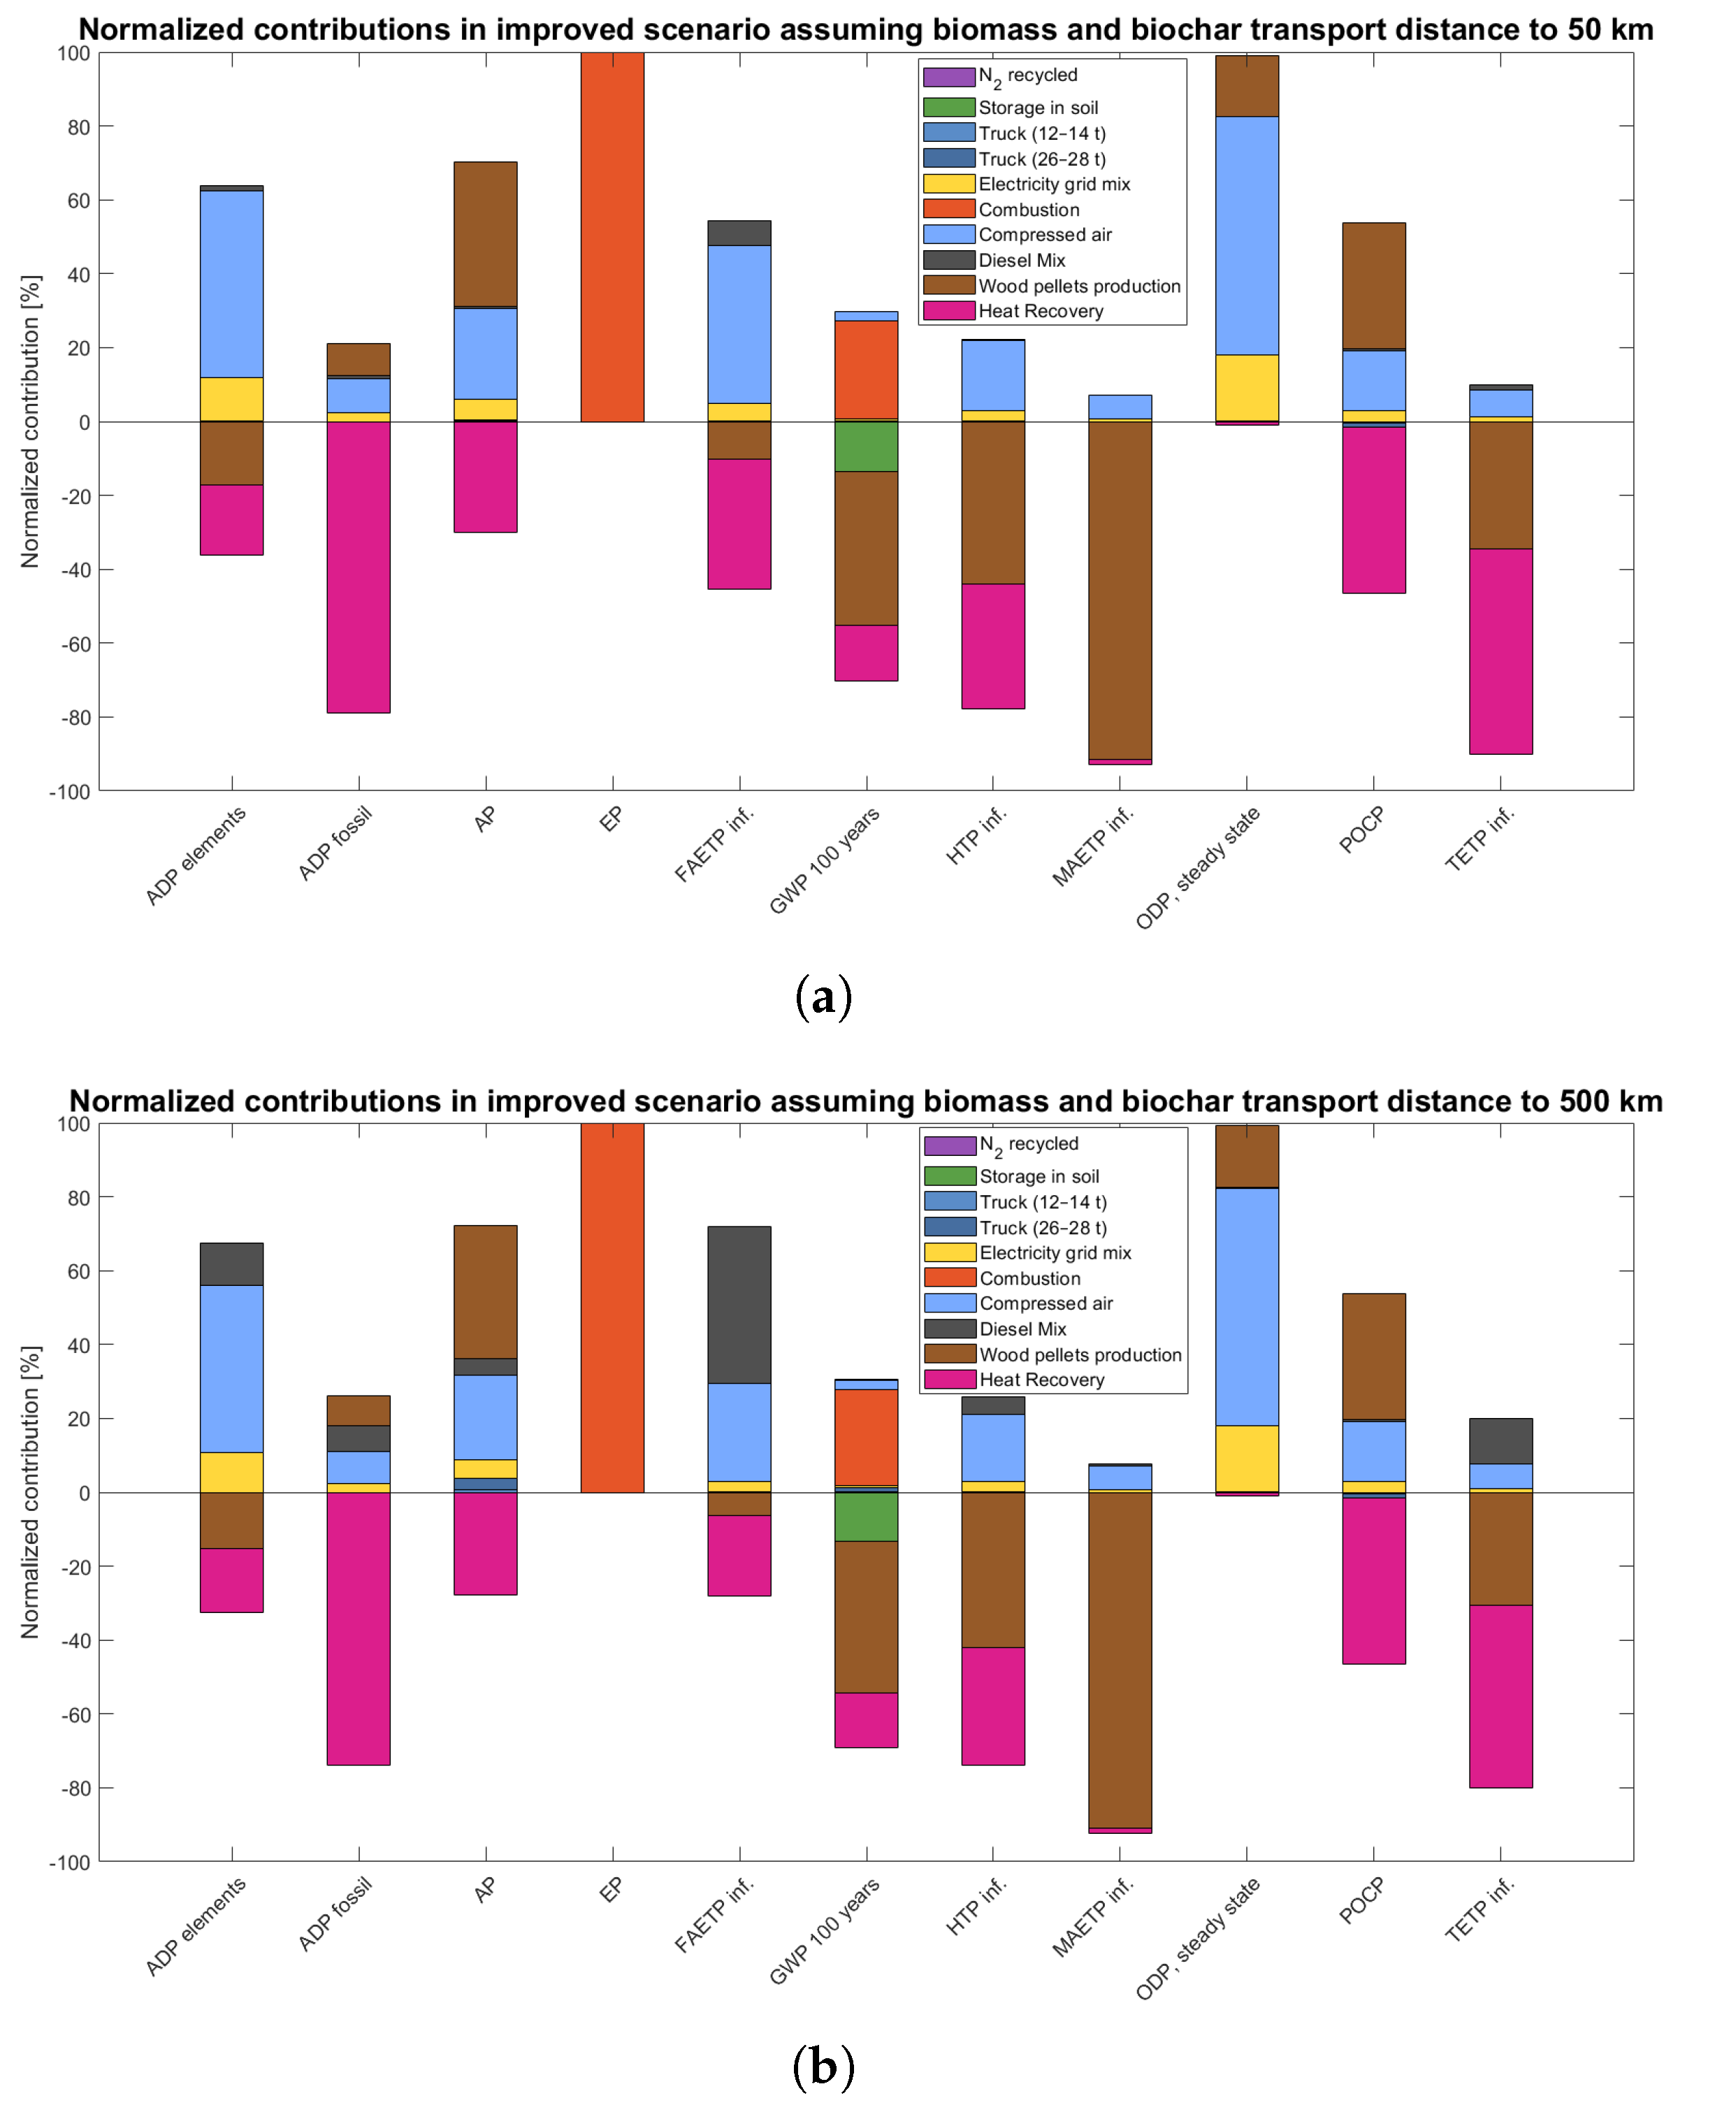
To strengthen the robustness of the LCIA, a sensitivity analysis was carried out to evaluate how variations in key methodological parameters, namely the transport distance and the heat recovery efficiency, influence the overall results of the LCA in the improved scenario. The influence of the transport distance was evaluated in two cases: the first, setting the biomass and biochar transport distance to 50 km, and the second, increasing the distance to 500 km. The NCs of the improved scenario after setting the transportation distance to 50 km and 500 km are shown in
Figure 6a,b. Halving the distance to 50 km resulted in only a marginal decrease in environmental impacts, driven by the proportional reduction in diesel fuel consumption and the subsequent lowering of combustion emissions such as fossil CO
2, NO
x, and particulate matter. Conversely, increasing the transport distance to 500 km implied a directly proportional increase in environmental impacts due to heightened fuel consumption and logistical emissions. However, despite this massive 450 km variation range between the two cases, the overall LCA profile of the system remained highly robust; the environmental burdens added by the 500 km transport were effectively offset by the substantial environmental credits generated from syngas and bio-oil energy recovery.
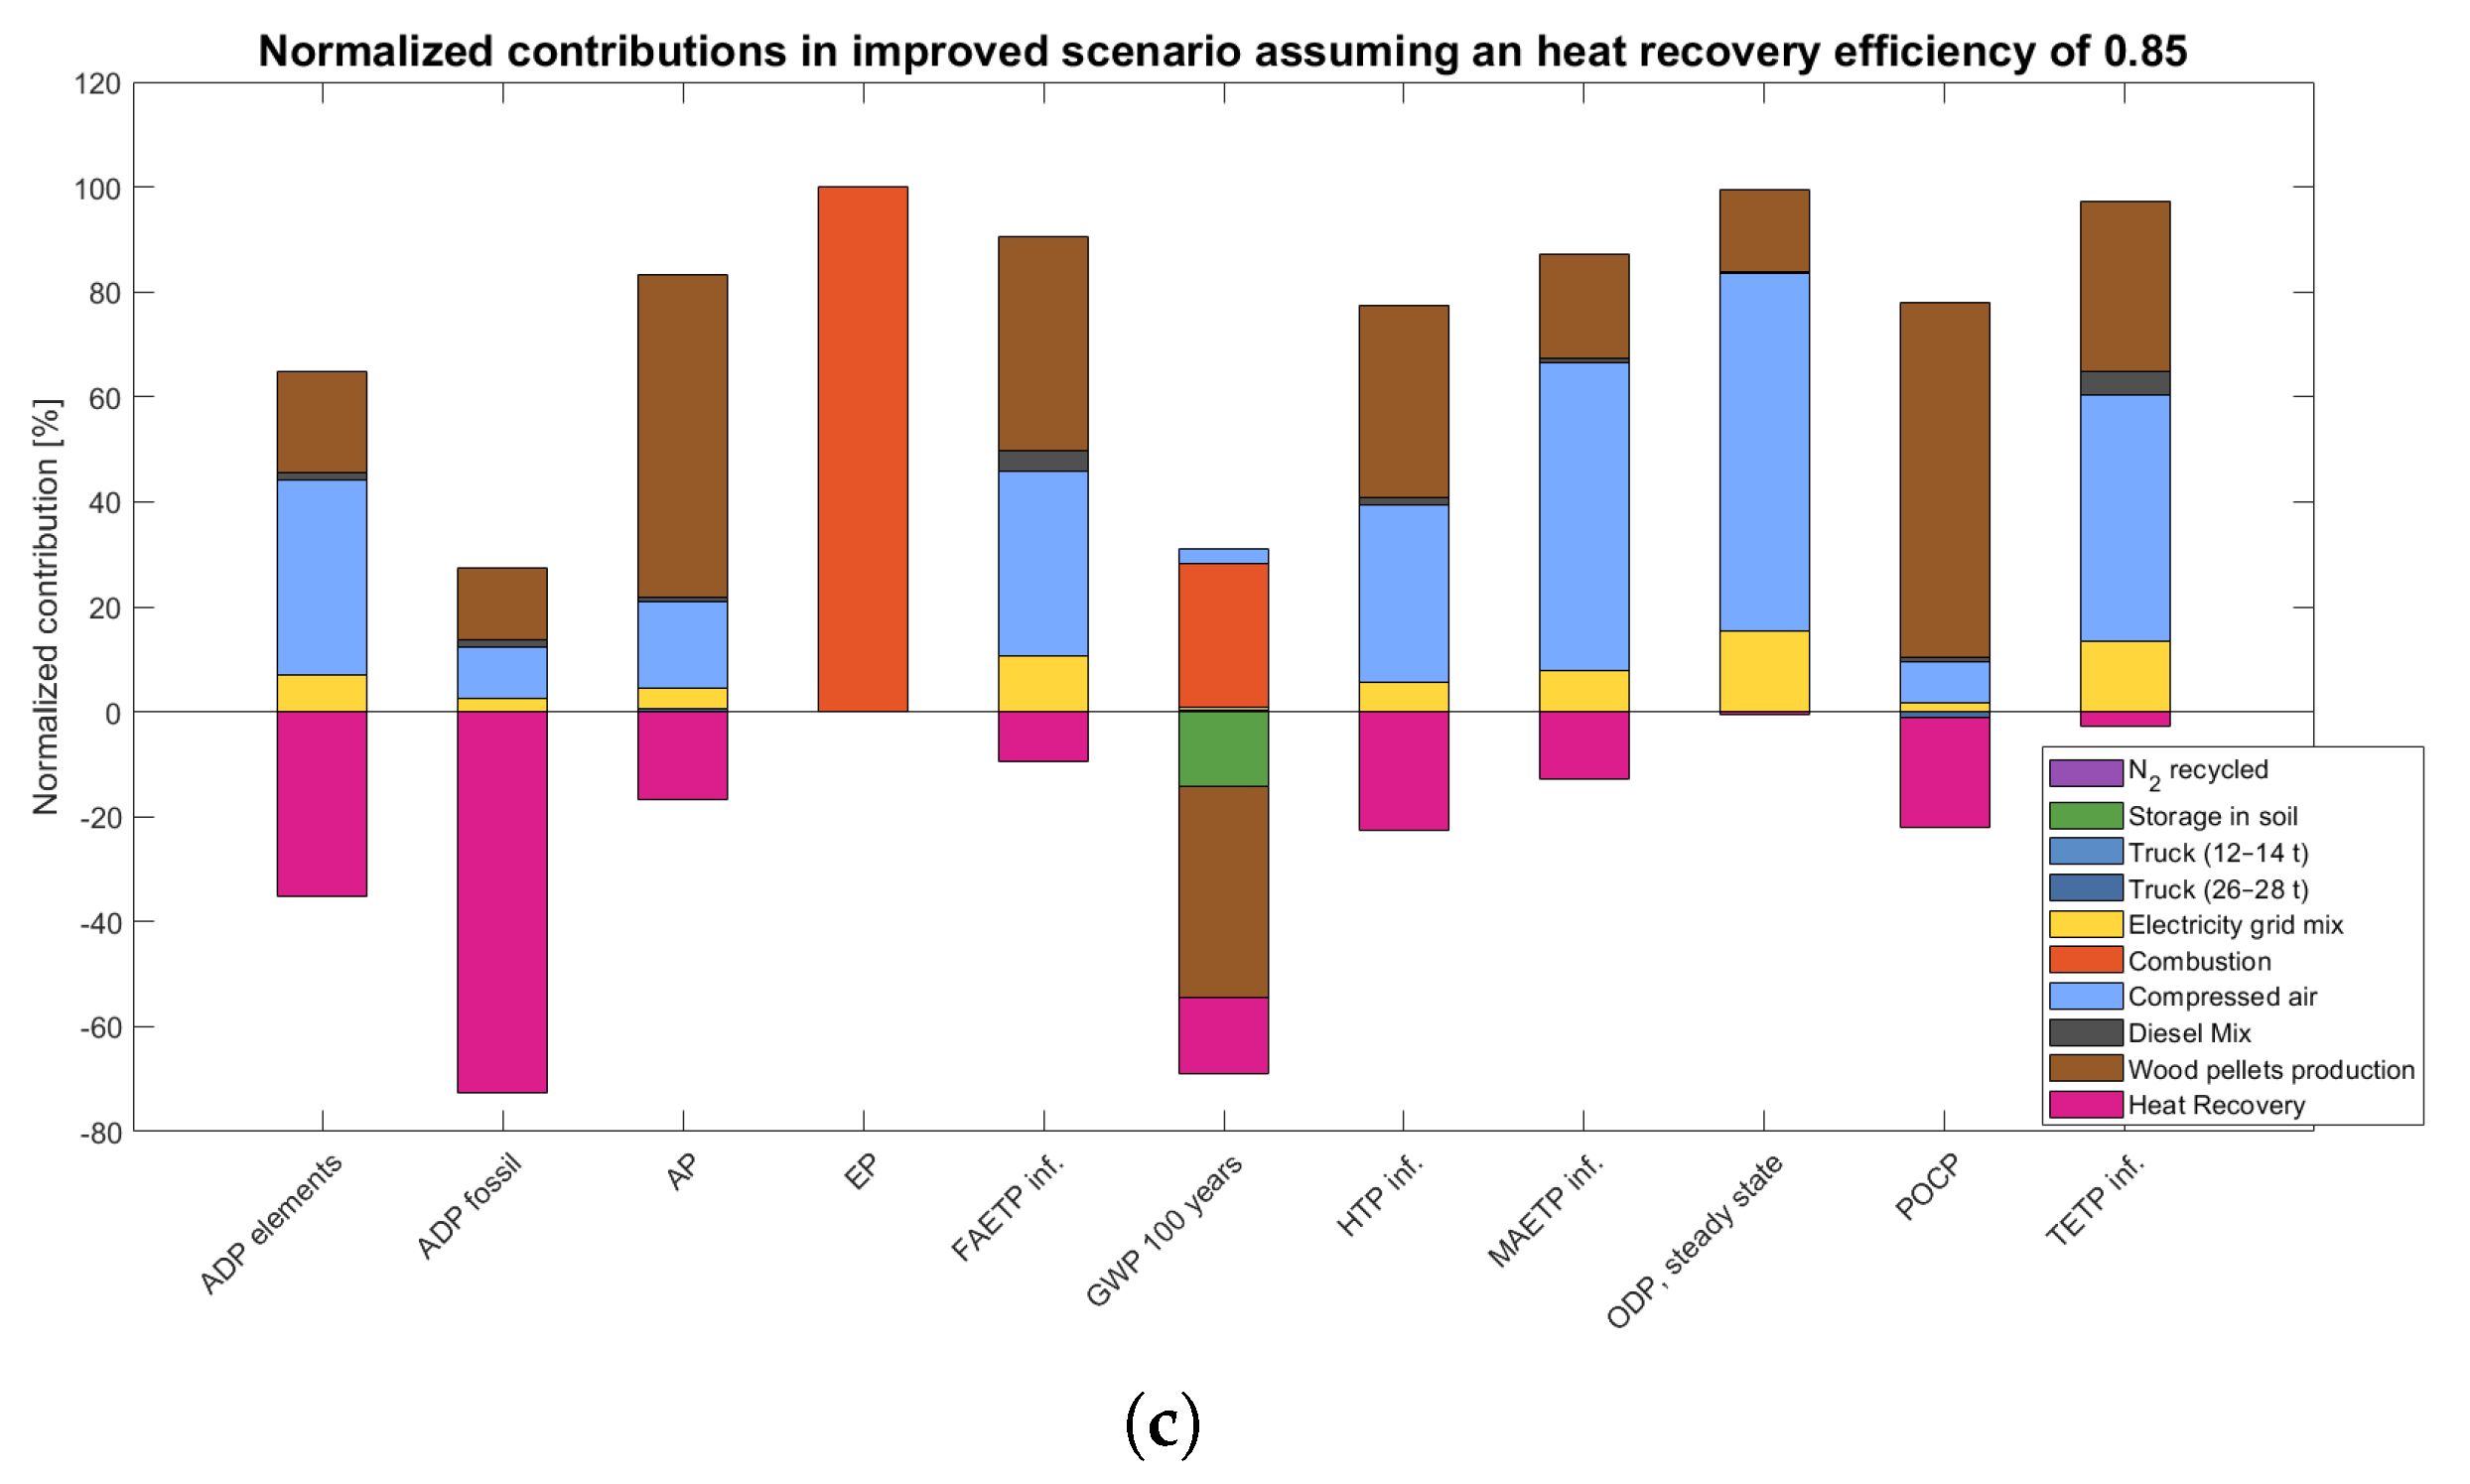
The deviations induced in the improved scenario by reducing the heat recovery efficiency by 10% (from 0.95 to 0.85), for which the NCs are shown in
Figure 6c, decreased the renewable primary energy recovery and reduced the renewable primary energy demand. Quantitatively, the primary energy demand from non-renewable sources NCV reduced from −20.02 MJ/FU in the improved scenario to −15.29 MJ/FU, corresponding to a reduction of approximately 24% in avoided fossil energy credits. Compared to transport distance variations, which produce marginal shifts, energy recovery efficiency proves to be a primary energy driver of the assessment.
Transferring this technology to commercial-scale biochar facilities presents several engineering and logistical hurdles which are critical to replicate the performance demonstrated in this LCA at an industrial scale. The core rotary kiln technology is scalable from pilot capacity (40 kg/h of pellets) to industrial capacities but requires maintaining precise temperature control, uniform solid mixing, and consistent heat transfer across larger reactor volumes, which all become increasingly complex. Moreover, commercial plants will face feedstock logistics challenges, particularly the seasonal availability of biomass. Future commercial designs should prioritise robust feeding systems capable of handling loose biomass besides vine pruning to bypass pelletization. Finally, large scale plants will require advanced gas cleaning systems to manage tars and particulates from heterogeneous feedstocks, ensuring that the heat recovery infrastructure operates efficiently over time.
4. Conclusions
The LCA was applied to evaluate the environmental impact of biochar production via pyro-gasification and its subsequent soil amendment. By comparing a base case configuration against an improved scenario integrated with a district heating network, this study demonstrated the critical role of pyrolysis by-product valorisation and system integration in enhancing the ecological benefits of biochar use. The integration of a heat recovery unit proved to be the key driver for environmental optimization, yielding widespread benefits across most impact categories. The most substantial enhancement was achieved in Abiotic Depletion of fossil resources, which exhibited a Relative Improvement of 365%, supported by the contribution analysis where heat recovery accounted for 78% of the total benefit. Furthermore, significant mitigation was observed in Terrestrial Ecotoxicity Potential (233% RI) and Human Toxicity Potential (157% RI), whereas other categories showed lower or negligible improvements.
Notably, the Global Warming Potential over 100 yielded negative net emissions in both configurations, validating the environmental viability of biochar as an effective strategy for long-term carbon sequestration in soil. While the base case achieved a carbon-negative footprint of −3.35 kg CO2 eq./FU, the improved scenario amplified this climate benefit to −5.35 kg CO2 eq./FU. This result is coupled with a net primary energy demand of approximately −20 MJ/FU in the improved scenario, confirming that the avoidance of fossil-based heat generation significantly enhances the energy balance of the system. These findings confirm that the entire life cycle of biochar can operate as a net negative emission technology. To maximise its environmental and thermodynamic potential, future deployment should systematically prioritise energy integration and the cascading use of pyro-gasification by-products. The sensitivity analysis versus transport distance confirms the LCA robustness, as changes had a minimal environmental impact. Conversely, heat recovery efficiency significantly influenced the overall non-renewable energy credit. Beyond the assessed environmental viability of the improved scenario, its practical implementation depends on techno-economic factors. A preliminary economic assessment indicates that the heat recovery infrastructure (heat exchangers, combustion chamber, and piping) is a relatively standard and manageable capital expenditure. Furthermore, the 20.02 MJ of avoided natural gas consumption per kg of biochar generates substantial operational savings, especially in the current volatile fossil fuel market. Combined with the potential to monetise the high carbon-negative footprint through carbon credit markets, the improved scenario presents a strong economic incentive. Nevertheless, this feasibility is contingent upon the plant proximity to a suitable thermal user (district heating network or industrial facility) to utilise the recovered heat. A comprehensive Life Cycle Costing (LCC) analysis is envisaged for future studies to quantify the exact payback periods and return on investment based on specific local market conditions.




 ,
,