Article

Multiscale Physicochemical Analysis of Defect Formation in Paraffin-Based Organic Systems: DSC Evaluation of Processing and Storage Conditions

1
Department of Physical Chemistry, Faculty of Chemistry, University of Lodz, Pomorska 163/165, 90-236 Lodz, Poland
2
Doctoral School of Exact and Natural Sciences, University of Lodz, 90-237 Lodz, Poland
3
GALA POLAND Sp. z o.o., 10 Fabryczna Street, 98-300 Wieluń, Poland
*
Author to whom correspondence should be addressed.
Processes 2026, 14(13), 2120; https://doi.org/10.3390/pr14132120
Submission received: 23 April 2026 / Revised: 4 June 2026 / Accepted: 26 June 2026 / Published: 29 June 2026
(This article belongs to the Special Issue Multiscale Modeling and Control of Biomedical Systems)

Abstract

This study presents a multiscale physicochemical analysis of defect formation mechanisms in paraffin-based organic systems subjected to different thermal histories. Paraffin materials, structurally analogous to biomimetic lipid matrices used in biomedical applications, were examined using differential scanning calorimetry (DSC) to determine the influence of processing conditions and storage temperature on phase stability and microstructural organization. Samples produced on two technological lines—a low-temperature process (D1) and a high-temperature process (D2)—were analyzed immediately after production and after storage at 15 °C, 25 °C, and 40 °C. DSC measurements revealed modifications in melting and crystallization profiles, together with additional thermal effects that suggest possible phase reorganization and changes in crystallization behavior under selected storage conditions. These effects were particularly visible for samples stored at 15 °C. The results provide an integrated thermal and spectroscopic interpretation of phase behavior in paraffin-based organic materials.

1. Introduction

Modern consumer markets are undergoing dynamic and multidirectional transformations driven by increasing consumer expectations and rapid development of material technologies [1,2]. In highly competitive environments with widespread access to information, end users exhibit growing sensitivity to product imperfections, including those of a purely visual nature [3]. This is particularly relevant for products whose functionality is closely linked to esthetics and sensory experience, such as scented candles [4]. Consequently, beyond standard technological requirements—such as stable combustion, controlled emission, and safety—structural and visual uniformity has become a key quality criterion.
From a physicochemical perspective, contemporary candle formulations constitute complex multicomponent organic systems in which crystallization, phase separation, and structural reorganization occur simultaneously [5,6,7,8]. These processes are strongly dependent on the thermal history of the material and processing conditions, meaning that even minor variations in parameters such as melting temperature, cooling rate, or storage conditions can significantly affect the resulting microstructure and lead to defect formation [9,10].
Traditionally, candle production relied on paraffin, a mixture of saturated n-alkanes characterized by relatively well-defined crystallization behavior and favorable mechanical properties resulting from ordered crystalline structures [11,12]. However, increasing environmental demands and the growing use of renewable resources have led to the incorporation of plant-derived components, such as triacylglycerols [13]. Due to their complex chemical structure, presence of unsaturated bonds, and polymorphic behavior, these components significantly increase system complexity [14,15].
Additionally, physicochemical modifications such as hydrogenation, used to adjust melting temperature and rheological properties, result in materials with diverse crystalline structures and broad phase transition ranges [16,17]. Consequently, hybrid systems are formed in which components with different crystallization mechanisms coexist, which may promote non-uniform crystallization behavior and the formation of less stable material states [18,19].
An additional factor complicating the behavior of such systems is the presence of functional additives, including dyes and fragrance compositions. These components may act as crystallization modifiers, influencing surface energy of nuclei, altering crystal growth kinetics, and introducing local heterogeneities [20]. As a result, systems with potentially non-uniform thermal and structural behavior may be formed, whose properties evolve over time, particularly under varying temperature conditions [21,22].
A major quality issue in container candles is the formation of surface defects affecting both the upper surface and sidewalls. These defects are a direct manifestation of disturbances occurring at the micro- and mesostructural levels and are closely related to crystallization, phase separation [17,23], and structural relaxation. Their presence not only reduces the esthetic value of the product but may also indicate long-term instability.
Among the most common defects are “blooming” and “sweating”. “Blooming” results from uncontrolled recrystallization into more stable forms, typically occurring after the primary crystallization stage and involving structural reorganization and migration of selected components toward the surface, leading to a characteristic matte appearance [24,25,26,27]. “Sweating” manifests as the separation of liquid fractions visible as droplets on the surface or at the wax–glass interface (“wet spots”) and is associated with limited compatibility of components with different melting points and chemical nature, leading to their gradual segregation [28,29,30]. Both phenomena may occur immediately after cooling or develop over extended storage times, indicating the presence of metastable states and continuous structural evolution.
In this context, advanced analytical techniques are required to investigate phase transitions and molecular interactions in multicomponent systems. Differential scanning calorimetry (DSC) provides information on phase transition temperatures, enthalpies, and metastable states [31,32], while Fourier-transform infrared spectroscopy (FT-IR) enables analysis of intermolecular interactions and structural organization [33].
In this study, a comprehensive analysis of hybrid paraffin-based systems produced under different technological conditions—low-temperature (D1) and high-temperature (D2) processing—was performed, followed by controlled storage at different temperatures. This approach enables direct correlation between processing parameters, phase behavior, and defect formation, forming a basis for structure–process–property relationships relevant for process optimization, quality control, and reduction in industrial losses. At the same time, the results may also be relevant to the broader analysis of complex organic soft-matter systems, although the present study is focused primarily on paraffin-based industrial formulations.
The selection of these technological lines was dictated by their distinct thermal regimes, which represent the extremes of industrial processing for these systems. Line D1 operates at a lower temperature gradient, favoring slower crystallization, whereas line D2 represents a high-temperature process with a significantly higher cooling rate. This differentiation allows for a comprehensive assessment of how initial processing energy affects long-term structural stability under varying storage conditions.
In the present study, the term “multiscale physicochemical analysis” is used in a limited interpretative sense. It refers to the combined evaluation of thermal behavior obtained from DSC, molecular-level spectroscopic information obtained from FT-IR, statistical variability of thermal parameters, and macroscopic defect observations. The study does not aim to provide direct structural characterization across all length scales. Rather, it correlates complementary experimental observations to infer relationships between processing conditions, storage temperature, phase behavior, and material stability. Direct verification of crystalline morphology, polymorphic organization, or phase-boundary structure would require additional techniques such as microscopy, XRD, SAXS, or WAXS.

2. Materials and Methods

The study was conducted to comprehensively evaluate the influence of technological parameters and storage conditions on the phase stability and structure of paraffin–vegetable hybrid systems. Complementary analytical techniques were employed, including DSC and FT-IR, enabling the analysis of both phase transitions and molecular interactions [20,21].
The investigated materials were paraffin-based hybrid organic systems used in industrial container candle formulations. Two base formulations corresponding to the technological pouring variants analyzed in this study were used. The formulation processed using the high-temperature pouring line, denoted as D2, was based on L.43 and consisted of 80.00 wt.% partially hydrogenated rapeseed oil 1, 18.00 wt.% paraffin, 1.26 wt.% additive 1, and 0.74 wt.% additive 2. The formulation processed using the low-temperature pouring line, denoted as D1, was based on L.8 and consisted of 71.76 wt.% partially hydrogenated rapeseed oil 2, 26.10 wt.% paraffin, 1.07 wt.% additive 1, and 1.07 wt.% additive 2. Due to industrial confidentiality, the exact chemical identity of the functional additives cannot be disclosed. Fresh samples were analyzed immediately after the pouring process. After pouring, the samples were allowed to cool and solidify for 30 min under laboratory conditions, and DSC/FT-IR analyses were then performed. Samples assigned to the storage-temperature study were stored at controlled temperatures of 15 °C, 25 °C, and 40 °C for 2 weeks. After this storage period, the samples were subjected to DSC and FT-IR analyses.
Thermal analyses were performed using a NETZSCH DSC 214 Polyma differential scanning calorimeter (Bavaria, Germany). This apparatus is equipped with an integrated low thermal mass furnace and an Arena-type sensor, allowing for high measurement sensitivity and high resolution of the heat flow signal [20]. Such a configuration is particularly important when studying complex organic systems in which overlapping energetic effects occur, associated with the crystallization of different hydrocarbon fractions and lipid components [6]. High measurement precision enables the identification of subtle phase transitions and metastable states, which are crucial for interpreting the mechanisms of structural defect formation [7].
DSC measurements were carried out in accordance with a standardized experimental protocol. Samples with a mass in the range of 5–10 mg were used for analysis, ensuring appropriate thermal homogeneity and repeatability of results [20]. The samples were placed in aluminum crucibles with perforated lids, allowing controlled gas exchange and minimizing the influence of pressure and surface effects [20]. Analyses were conducted in a nitrogen atmosphere with a flow rate of 20 mL/min to prevent oxidative degradation of organic components. The thermal program was executed in dynamic mode with heating and cooling rates of 10 K/min, over a temperature range from ambient temperature to 110 °C, which ensured complete melting of the crystalline fractions present in the investigated material. The same heating and cooling program was applied to all samples to ensure comparability of the thermal parameters.
DSC data analysis was performed using NETZSCH Proteus® software (version 9.7). Characteristic temperatures of phase transitions were determined, including onset, peak, and endset temperatures for melting and crystallization processes [20]. Additionally, by integrating the areas under the thermal peaks, the enthalpies of transitions (ΔH) and the relative degree of crystallinity of the studied systems were determined [6]. Particular attention was paid to the analysis of DSC curve shapes, including the presence of additional thermal effects that may indicate the coexistence of different structural forms, phase reorganization processes, and the presence of metastable states [7]. The studies were conducted for samples with different thermal histories, including materials directly after the production process (D1 and D2 lines) as well as samples conditioned at 15 °C, 25 °C, and 40 °C, which enabled the assessment of the influence of component redistribution on crystallization kinetics [13].
All measurements were performed at least in triplicate, and average values with standard deviations were used for further analysis.
Statistical analysis was performed using one-way analysis of variance (ANOVA) followed by Tukey’s honestly significant difference (HSD) post hoc test. For each experimental group, five independent samples were analyzed (n = 5), and the results were reported as mean values ± standard deviation. Prior to ANOVA, the assumptions of normality and homogeneity of variance were evaluated using the Shapiro–Wilk test and Levene’s test, respectively. No significant violations of these assumptions were observed. Statistical significance was accepted at p < 0.05. In addition to p-values, the magnitude of the storage-temperature effect was interpreted based on differences between group means relative to within-group variability.
To ensure high measurement accuracy, the DSC apparatus was regularly calibrated in accordance with ISO 11357-1 using certified high-purity metallic standards [20]. Calibration of temperature and heat flow sensitivity was performed at a scanning rate of 10 K/min in a nitrogen atmosphere with a flow rate of 20 mL/min, corresponding to the conditions of the actual measurements. Baseline correction and determination of calibration coefficients were carried out using the Check-and-Cal function in the Proteus® software (v8). Example calibration data are presented in Table 1.
Additionally, FT-IR spectroscopic analysis was performed using a Nicolet iS5 spectrometer (Thermo Scientific, Madison, WI, USA) equipped with an iD1 transmission accessory. Samples were prepared by thoroughly grinding the tested material, followed by its homogenization with dry potassium bromide (KBr) of spectroscopic purity. The obtained mixture was then pressed under high pressure, allowing the formation of transparent pellets with a uniform structure. The application of the KBr technique minimized radiation scattering and enabled the acquisition of high-quality transmission spectra, providing representative information on the chemical structure of the entire material volume while limiting the influence of surface effects.
Spectra were recorded in the range of 4000–400 cm−1, with a resolution of 4 cm−1 and 32 scans. Each FT-IR spectrum was subjected to baseline correction using OMNIC software (9.2), followed by intensity normalization to enable comparison between independently prepared samples. Normalization was performed using the maximum absorbance intensity within the analyzed spectral range as a reference. This procedure allowed relative changes in band intensities to be compared between samples while minimizing differences resulting from pellet thickness, sample loading, and scattering effects. No full peak deconvolution or integrated peak-area analysis was performed; therefore, the FT-IR results should be interpreted as qualitative to semi-quantitative indicators of changes in molecular organization.
The spectral analysis focused on the identification of characteristic vibration bands corresponding to functional groups present in the studied systems, in particular: C–H stretching bands (2800–3000 cm−1), carbonyl C=O bands (~1700–1750 cm−1), CH2 and CH3 deformation bands (1350–1500 cm−1), and bands associated with the ordering of aliphatic chains below 1000 cm−1. Changes in band intensity and shifts were analyzed as indicators of variations in intermolecular interactions, the degree of structural ordering [11], and component compatibility.
The application of complementary DSC and FT-IR techniques enabled the correlation of phase transition behavior with molecular structure reorganization. This provides a basis for interpreting the mechanisms of defect formation and evaluating the stability of the studied systems under conditions of varying thermal history [6,21].

3. Results and Discussion

3.1. Effect of Processing Conditions on Thermal Behavior

The analysis of thermophysical properties of hybrid paraffin systems, carried out using differential scanning calorimetry (DSC) and infrared spectroscopy (FT-IR), enabled both quantitative and qualitative evaluation of process–structure–property relationships in the investigated multicomponent system. The application of complementary analytical techniques allowed for the direct correlation of phase transition behavior with the reorganization of molecular interactions, which is crucial for interpreting the mechanisms of structural stabilization and destabilization. This approach is consistent with current trends in the analysis of complex organic and lipid systems, where the integration of thermal and spectroscopic methods constitutes a fundamental tool for describing phenomena occurring across different levels of matter organization [6,11].
A comparison of samples produced under low-temperature (D1) and high-temperature (D2) conditions suggested that processing temperature affects the apparent homogeneity and reproducibility of the thermal response. In the case of the high-temperature process, a more efficient dispersion of components with diverse physicochemical characteristics was achieved, which may indicate a more uniform thermal response of the material. This effect was manifested by narrow, symmetrical melting peaks and high reproducibility of thermodynamic parameters, suggesting a more reproducible crystallization behavior under the applied experimental conditions. This phenomenon is well documented in the literature on the crystallization of lipid and paraffin systems, where the degree of homogenization directly determines the distribution of free energy and the stability of crystalline phases [10,17].
In contrast, samples from the D1 line exhibited broadened and asymmetric phase transitions as well as baseline disturbances, which should be interpreted as a result of incomplete homogenization and the possible thermal heterogeneity within the material. The observed additional thermal effects indicate the, the possible coexistence of fractions with different thermal stability, which is characteristic of systems outside thermodynamic equilibrium [6]. Under such conditions, functional additives, particularly dyes and fragrance compositions, may act as heterogeneous nucleation centers, modifying local crystallization kinetics and leading to the formation of metastable structures, as confirmed by studies on the influence of additives on crystallization processes in multicomponent systems [14].
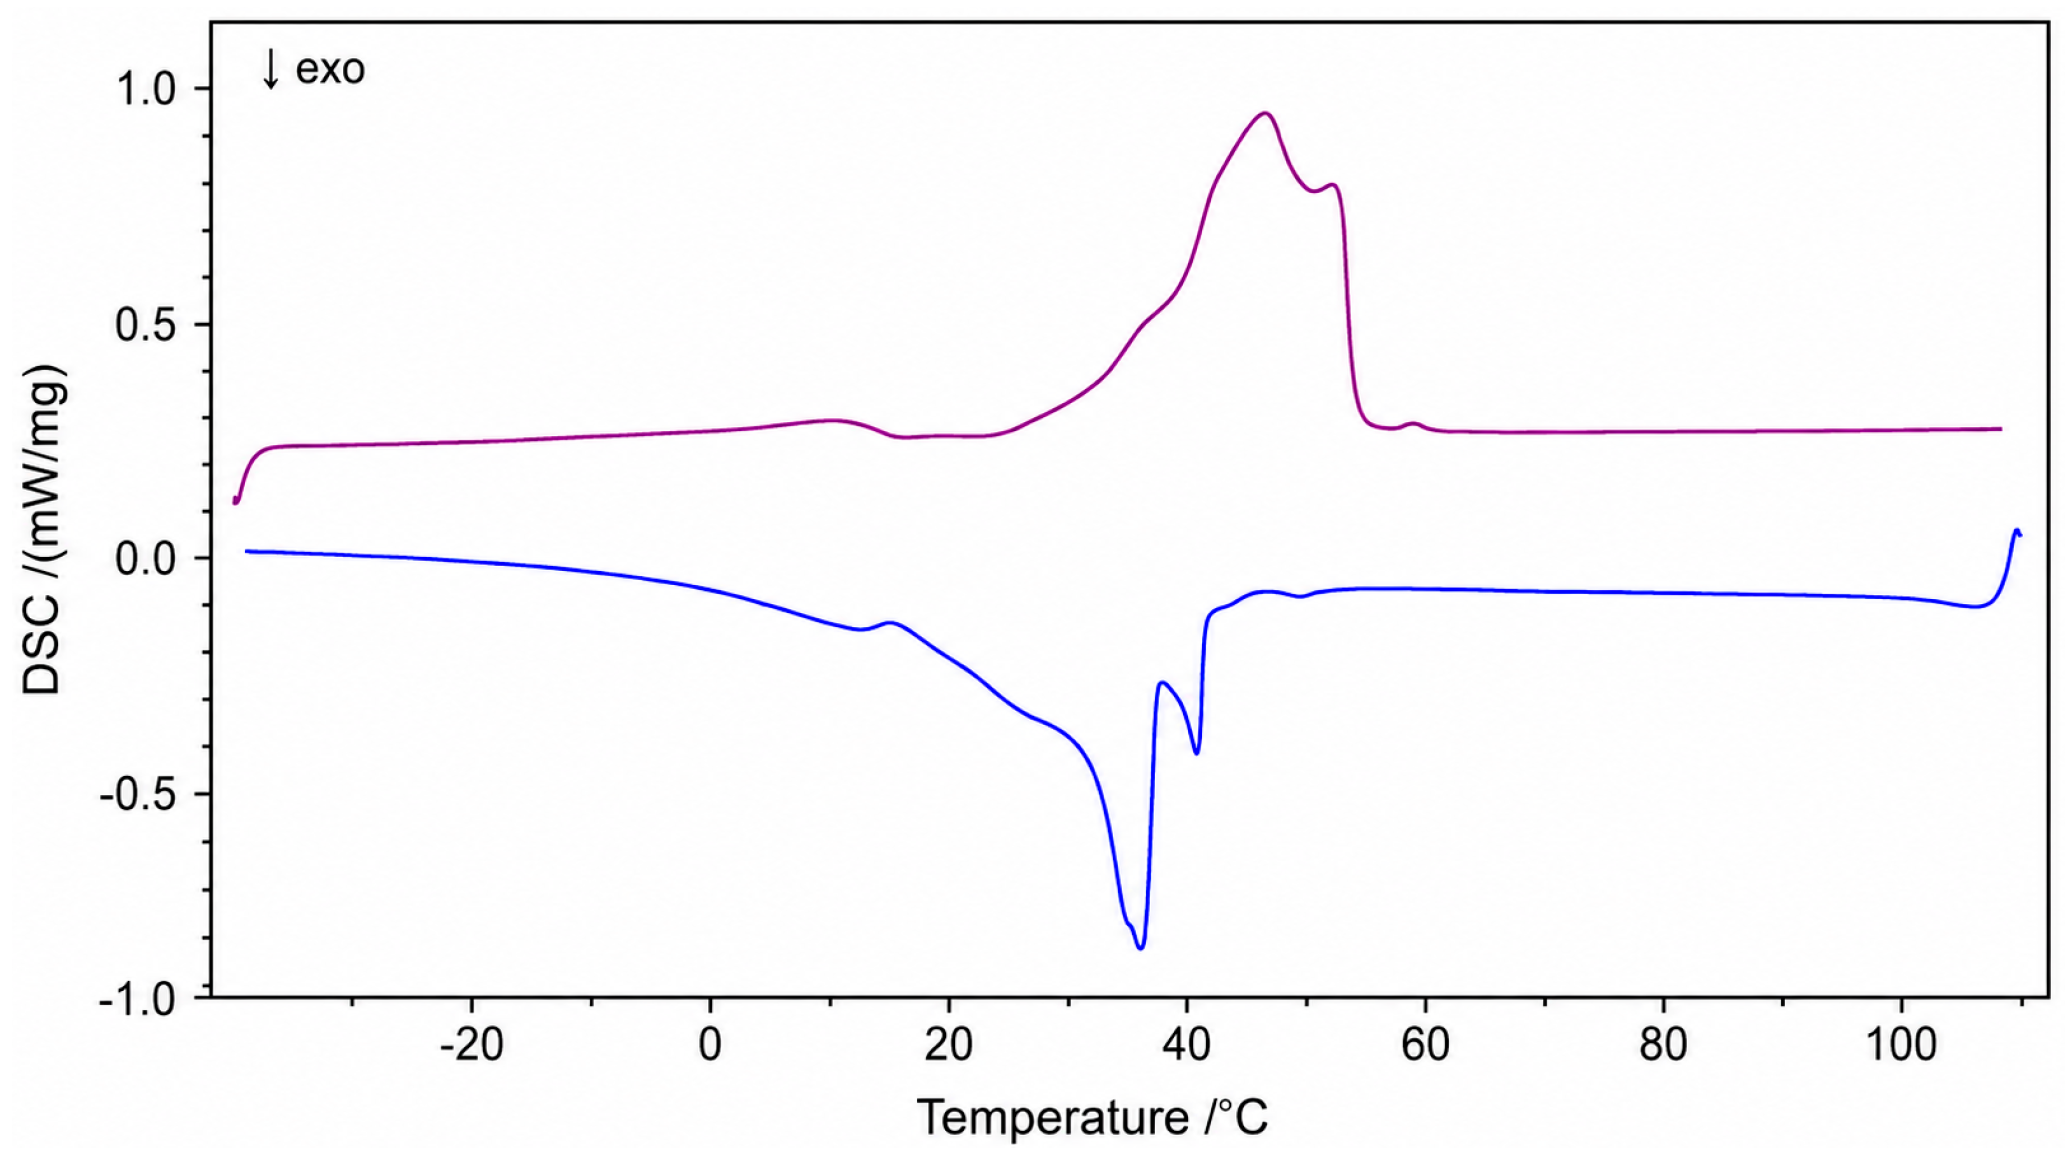
The differences between the analyzed technological lines should be considered in the context of the system’s thermal history, which determines both the course of nucleation and the mechanism of crystal growth. The high-temperature process appears to promote the formation of a more thermodynamically stable material state, as inferred from narrower and more reproducible DSC transitions, whereas the low-temperature process may preserve a less uniform material state, as inferred from broader and less reproducible DSC transitions. Such behavior may be associated with higher susceptibility to secondary thermal reorganization during storage. Analogous mechanisms have been described in the context of metastable organic systems, where thermal history constitutes a key parameter determining the long-term stability of the material [7,19]. This interpretation is supported by the representative DSC thermograms comparing samples produced under low-temperature and high-temperature processing conditions, as shown in Figure 1.
Figure 1. Representative overlaid DSC thermograms for samples produced under different technological conditions: low-temperature pouring process (D1) and high-temperature pouring process (D2). The comparison highlights differences in melting and crystallization behavior, including peak shape, transition range, and characteristic thermal parameters such as Tonset, Tpeak, and ΔHm.
Processes 14 02120 g001

3.2. Effect of Storage Temperature on Crystallization and Defect Formation

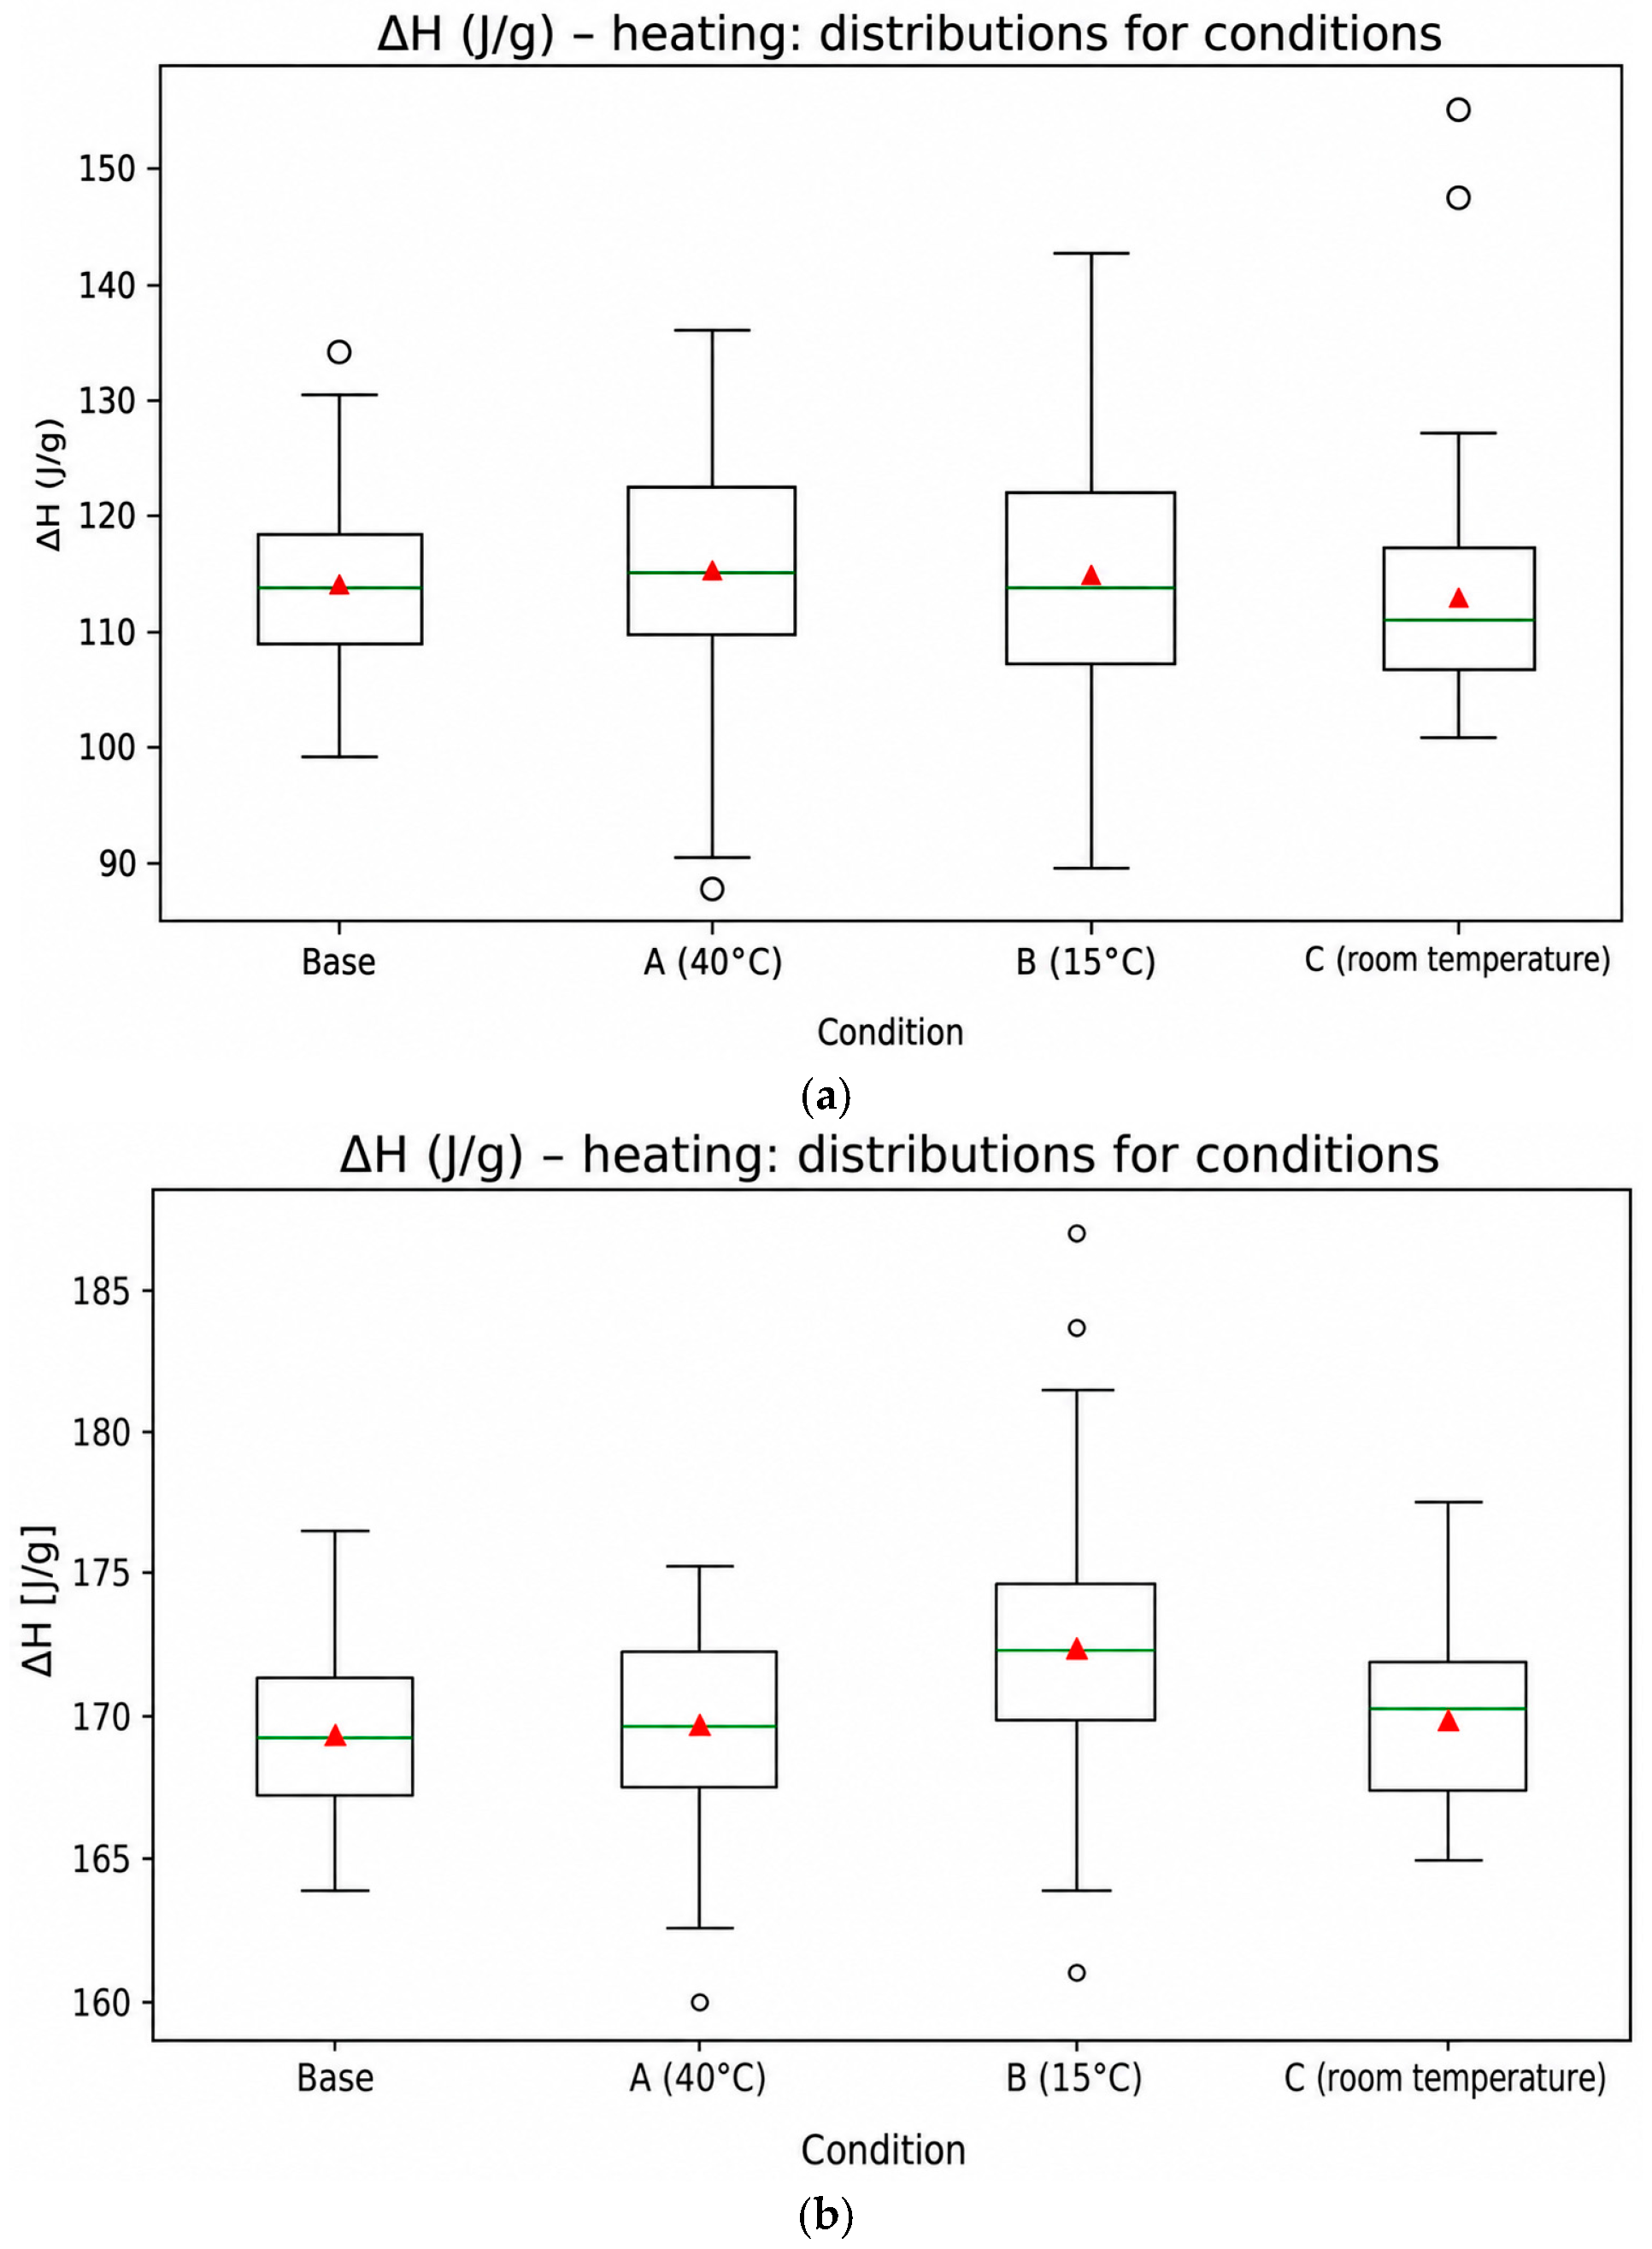
A detailed analysis of DSC thermograms enabled the identification of Tonset and Tpeak parameters. Under reference conditions, the materials exhibited low variability in ΔHm, indicating an ordered lamellar microstructure. Such a state corresponds to a stable crystalline system with low free energy. Significant changes were observed in samples stored at 15 °C (Figure 2). A decrease in melting enthalpy ΔHm and an increase in its dispersion were recorded. According to thermodynamics, the enthalpy of transition is proportional to the fraction of the crystalline phase.
The quantitative analysis of phase transitions was performed based on the melting enthalpy determined by integrating the DSC signal in accordance with relation (1):
Δ H m = T 1 T 2 q ˙ ( T )   d T
where q ˙ ( T ) denotes the heat flow, and T1 and T2 correspond to the range of the phase transition. The stability of the system under reference conditions is confirmed by the low dispersion of ΔHm values, indicating a reproducible fraction of the crystalline phase within the total material volume.
However, significant changes are observed in samples stored at 15 °C, where a statistically significant decrease in ΔHm values and an increase in the variability of thermodynamic parameters were recorded. This phenomenon indicates destabilization of the ordered lamellar structure and an increased contribution of amorphous or metastable phases. From a physicochemical perspective, this corresponds to a shift in system equilibrium toward states of higher free energy.
The observed trends were consistent across all analyzed replicates, indicating that the changes in thermodynamic parameters are systematic rather than incidental. This supports that the observed decrease in melting enthalpy and increased dispersion are inherent to the altered crystallization pathway under reduced storage temperature.
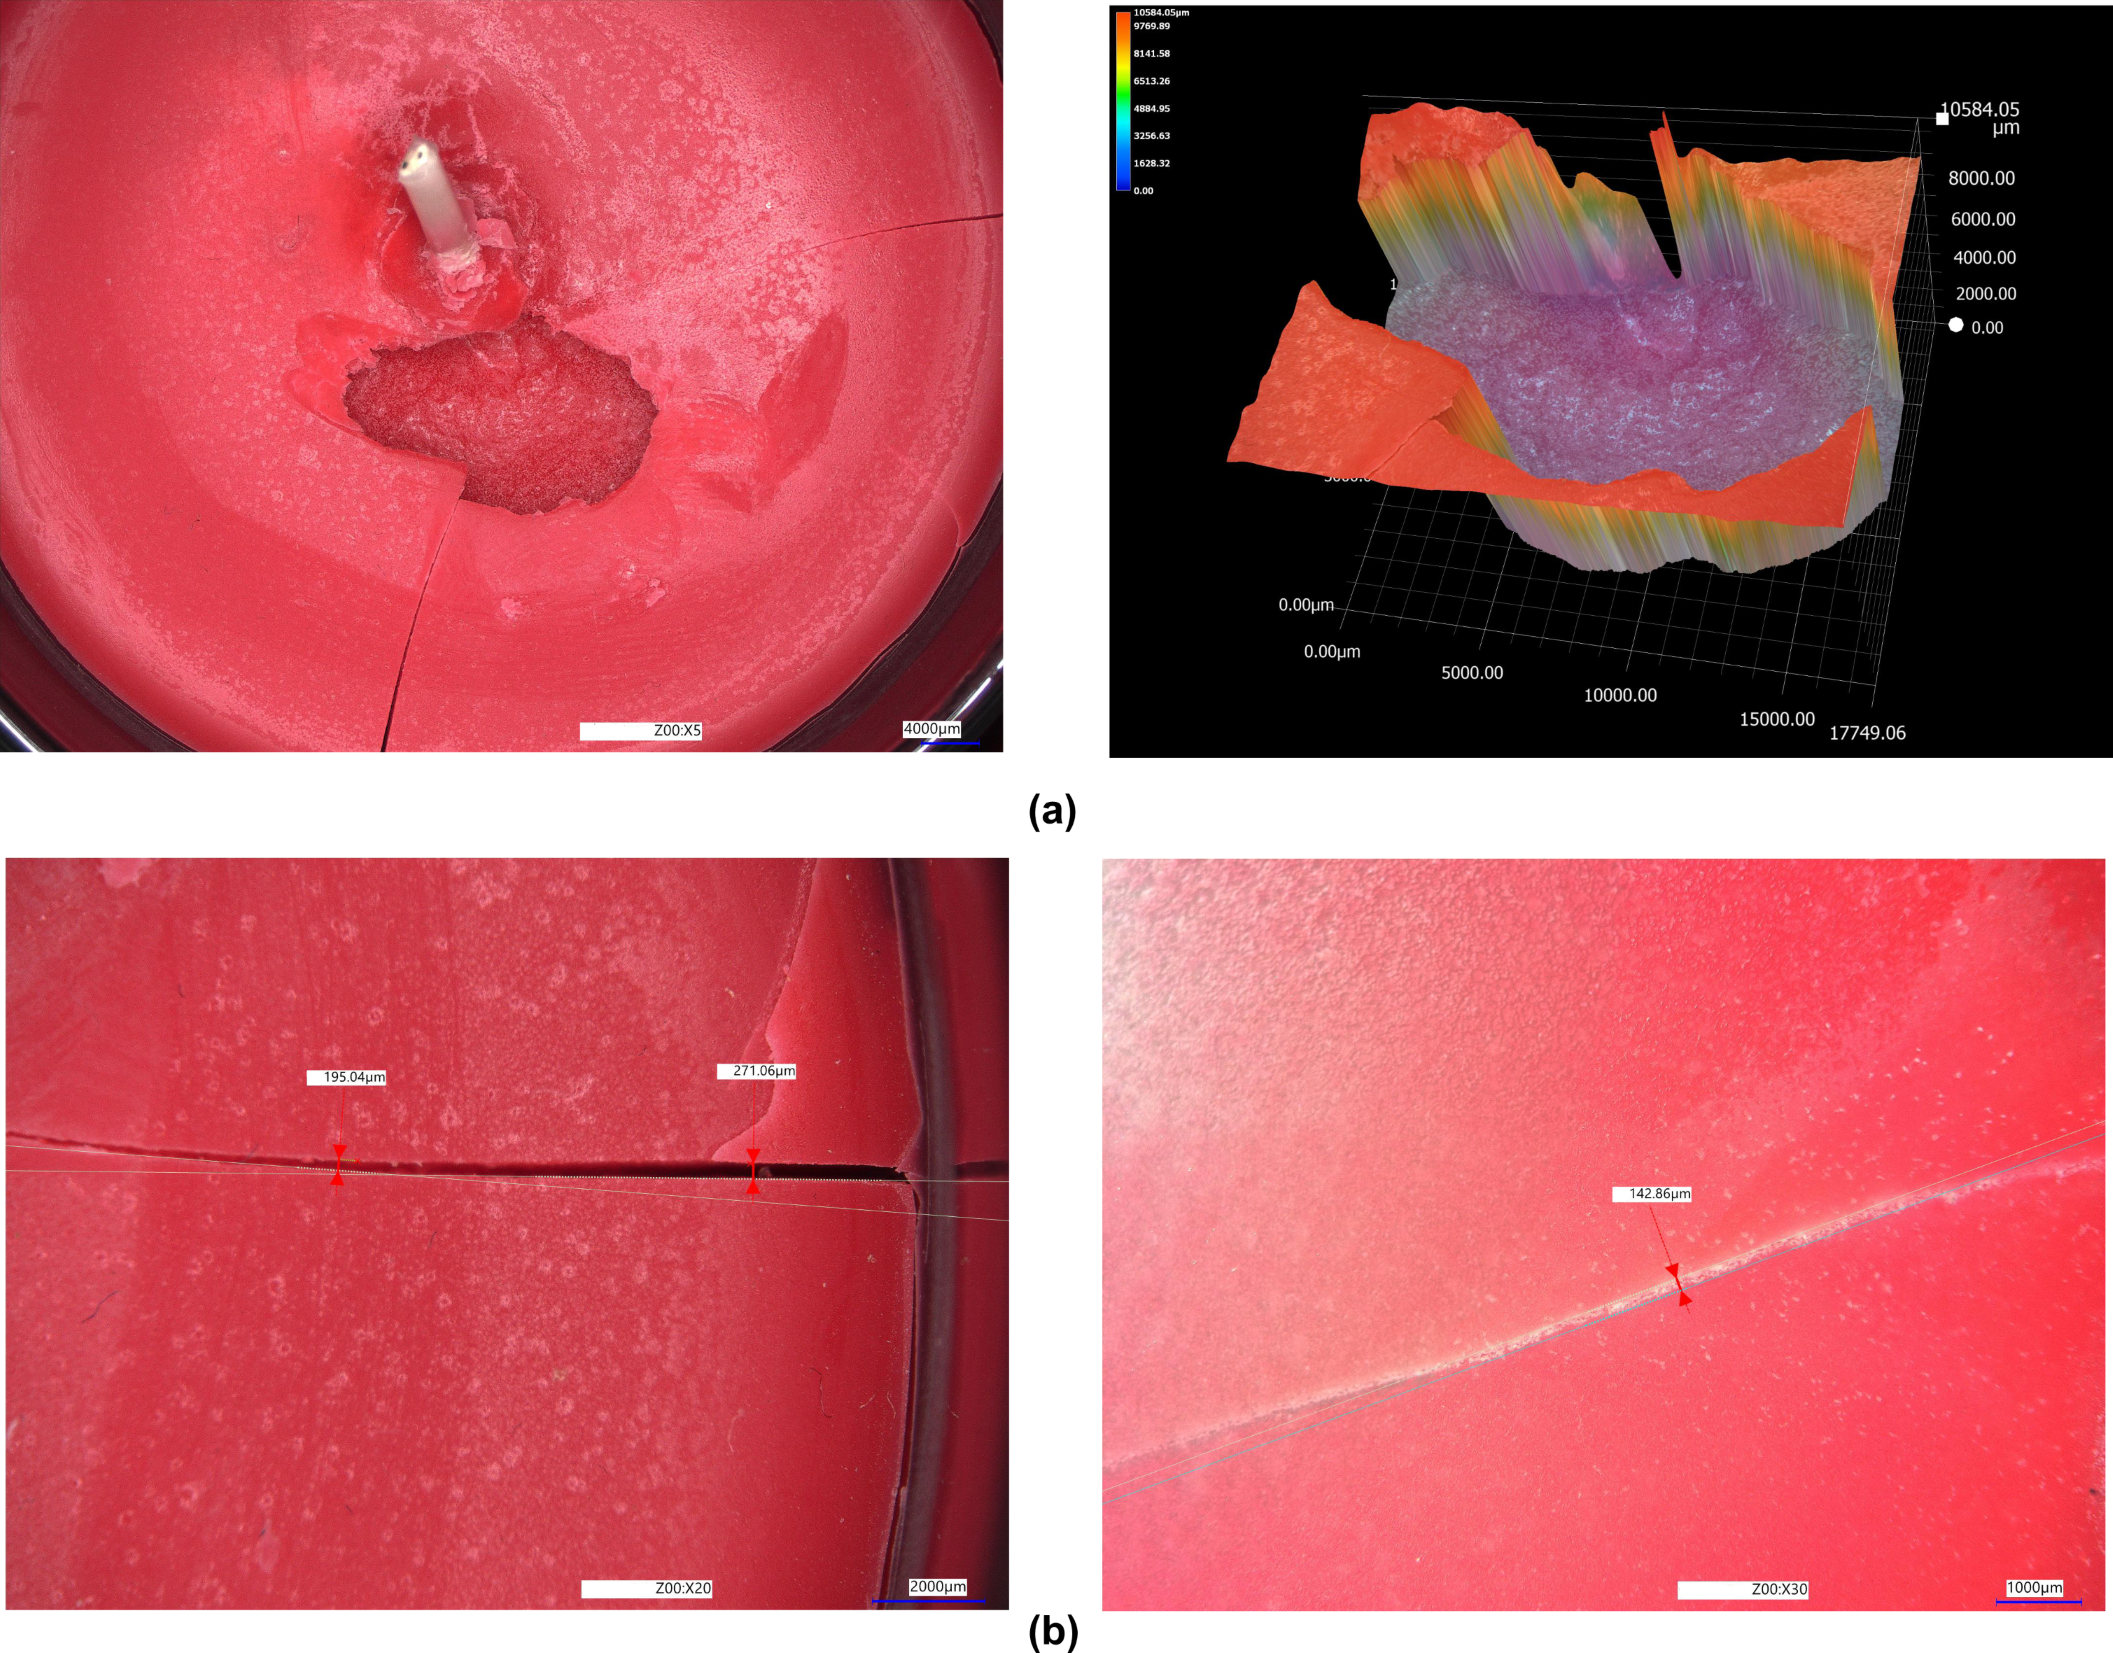
A key piece of evidence for the destabilizing effect of reduced storage temperature is the morphological changes observed in the structure of the investigated systems, as documented in Figure 3. At 15 °C, where the greatest changes in DSC parameters were observed, visible defects appeared more frequently. These macroscopic changes may be associated with altered crystallization and relaxation behavior; however, direct confirmation of crystallite size and defect density would require additional structural analysis.
The photographs show an intense formation of structural cracks and shrinkage cavities. This phenomenon results from the fact that the microstructure formed under these conditions is metastable and is characterized by the “locking-in” of internal energy and high stresses within a disordered lamellar structure. The relaxation of these stresses during secondary phase transitions leads to cracking of the wax material.
The presence of cavities (voids), in turn, is a direct result of a rapid decrease in specific volume during accelerated, uncontrolled crystallization. Due to the lack of interfacial equilibrium, uniform filling of the container volume is prevented. The visual degradation of samples at 15 °C, therefore, constitutes empirical evidence that disrupted crystallization kinetics lead to a permanent loss of structural integrity of the product.

3.3. Supercooling, CNT-Based Interpretation, and Statistical Evaluation

A key parameter describing crystallization kinetics is the degree of supercooling ΔT, defined as (2):
Δ T = T m T c
where Tm is the melting temperature and Tc is the crystallization temperature.
In the samples stored at 15 °C, a decrease in ΔT was observed (Figure 4), suggesting that crystallization may initiate with less required supercooling. Thus, the reduced ΔT observed in this study should not be understood as an increased supercooling-driven nucleation force, but rather as an indication that the onset of crystallization occurs with less undercooling, likely due to the complex heterogeneous nature of the material.
It should be noted that the interpretation of ΔT in the present multicomponent paraffin–lipid system differs from a simple classical description in which larger supercooling is directly associated with a higher thermodynamic driving force for nucleation. In this study, the reduced ΔT observed for samples stored at 15 °C is not interpreted as a direct increase in the thermodynamic driving force. Rather, it reflects the relationship between melting temperature Tm and crystallization temperature Tc and suggests that crystallization may start at a relatively higher Tc, requiring less supercooling to initiate the process. This behavior may be associated with local compositional heterogeneities, additive-induced nucleation sites, or pre-existing structural domains that facilitate the onset of crystallization during cooling.
According to classical nucleation theory (CNT), the nucleation rate depends on the energy barrier ΔG*:
To strengthen the mechanistic interpretation of the DSC results, a semi-quantitative analysis based on classical nucleation theory (CNT) was performed. As a first approximation, the nucleation rate J can be expressed as (3):
J e x p Δ G * k T
where ΔG* denotes the energy barrier for the formation of a critical nucleus, k is the Boltzmann constant, and T is the absolute temperature.
In systems governed by crystallization processes, this barrier is assumed to be inversely proportional to the square of the degree of supercooling (4):
Δ G * 1 Δ T ) 2
where ΔT = Tm – Tc.
Within this simplified approximation, a lower ΔT would formally correspond to an increase in the calculated nucleation barrier. Therefore, in the present multicomponent paraffin–lipid system, the reduced ΔT should not be interpreted as a direct reduction in the nucleation barrier, but rather as an indication of altered crystallization behavior. This relationship should be interpreted cautiously due to the multicomponent nature of the system. This estimation should be treated as a semi-quantitative approximation, assuming constant interfacial energy and simplified nucleation conditions typical of classical nucleation theory.
Based on the average values obtained for the studied systems, it was found that the reference samples are characterized by ΔT = 12.4 °C, whereas the samples stored at 15 °C exhibit a significantly lower value of ΔT = 8.2 °C. Using the above relationship, the relative change in the nucleation barrier can be estimated:
Δ G 15 * Δ G r e f * Δ T r e f Δ T 15 2 = 12.4 8.2 2 2.29
It should be emphasized that the CNT-based approach was used only as a simplified semi-quantitative model. The investigated material is a complex multicomponent paraffin–lipid system containing functional additives and fragrance components; therefore, the assumptions of classical nucleation theory are only partially fulfilled. In this approximation, interfacial energy, local composition fluctuations, viscosity, diffusion limitations, polymorphic transformations, and additive-induced heterogeneities were not explicitly included. Consequently, the calculated change in the nucleation barrier should be interpreted as a relative indicator of altered crystallization behavior under different storage conditions, rather than as an exact physical value of the nucleation barrier.
In the simplified CNT-based interpretation, a decrease in ΔT would formally correspond to an increase in the calculated nucleation barrier. Therefore, in the present multicomponent paraffin–lipid system, the reduced ΔT should not be interpreted as a direct reduction in the nucleation barrier, but rather as an indication of altered crystallization behavior influenced by heterogeneous nucleation sites, local compositional heterogeneities, additives, or pre-existing structural domains.
Within the adopted simplified CNT-based approximation, the calculated ratio suggests that the relative nucleation barrier for samples stored at 15 °C would formally be higher than that of the reference samples. Therefore, the calculated ratio should not be interpreted as evidence of a reduced physical nucleation barrier, but rather as a semi-quantitative indication that the crystallization pathway was altered under reduced storage temperature.
An additional useful parameter describing system stability is the coefficient of variation (CV), which in this study was adopted as an operational indicator of instability (5):
I i n s t = σ μ
where σ denotes the standard deviation and μ the mean value of the analyzed parameter. For the supercooling parameter ΔT, the following values were obtained:
I i n s t ( Δ T , r e f ) = 0.8 12.4 0.065
I i n s t Δ T , 15 C = 3.7 8.2 0.451
which indicates an approximately 7-fold increase in the variability of the crystallization process.
The magnitude of the observed increase in the coefficient of variation further supports a transition toward a less uniform and more variable crystallization regime. Importantly, this effect was reproducible across independent sample sets, reinforcing the robustness of the observed phenomenon.
The obtained results suggest that storage at 15 °C does not merely shift the mean values of the analyzed parameters, but may promote a transition toward a more variable and less controlled crystallization pathway.
From a physicochemical perspective, the combination of decreased ΔT, the semi-quantitative CNT-based estimate, and the increased variability of thermal parameters is consistent with altered nucleation behavior and a more heterogeneous crystallization pathway.
Under such conditions, the DSC results may be consistent with less uniform crystallization and increased susceptibility to secondary reorganization. This interpretation is fully consistent with the observed broadening of DSC peaks, increased variability of enthalpy, and the macroscopic manifestation of defects in samples stored at 15 °C.
Consequently, the introduced quantitative descriptors support the conclusion that 15 °C was the least favorable storage condition among those tested.
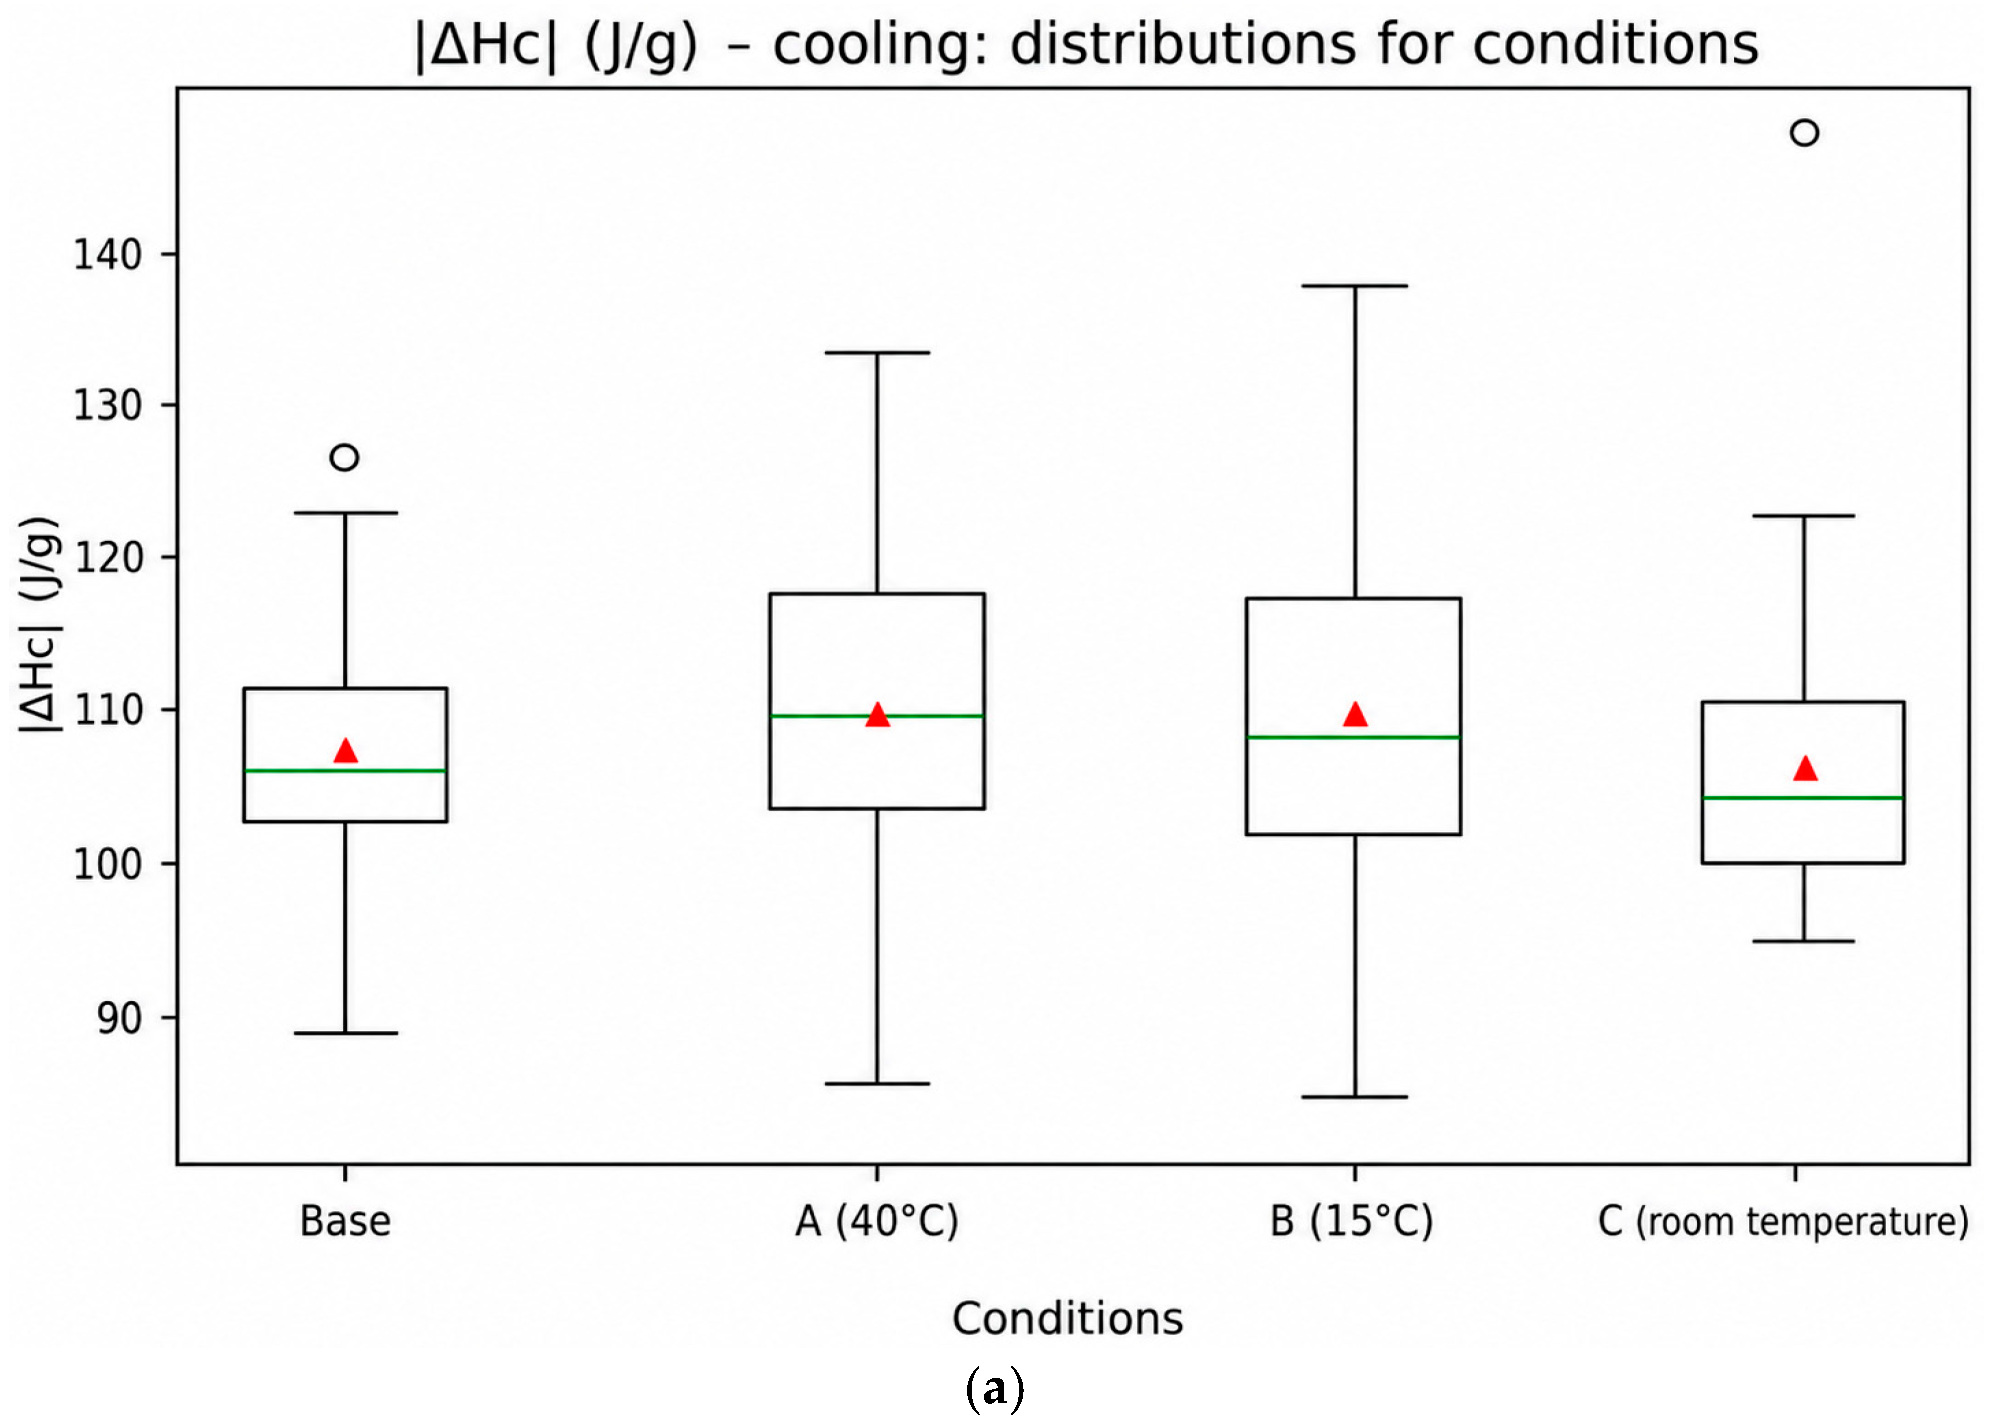
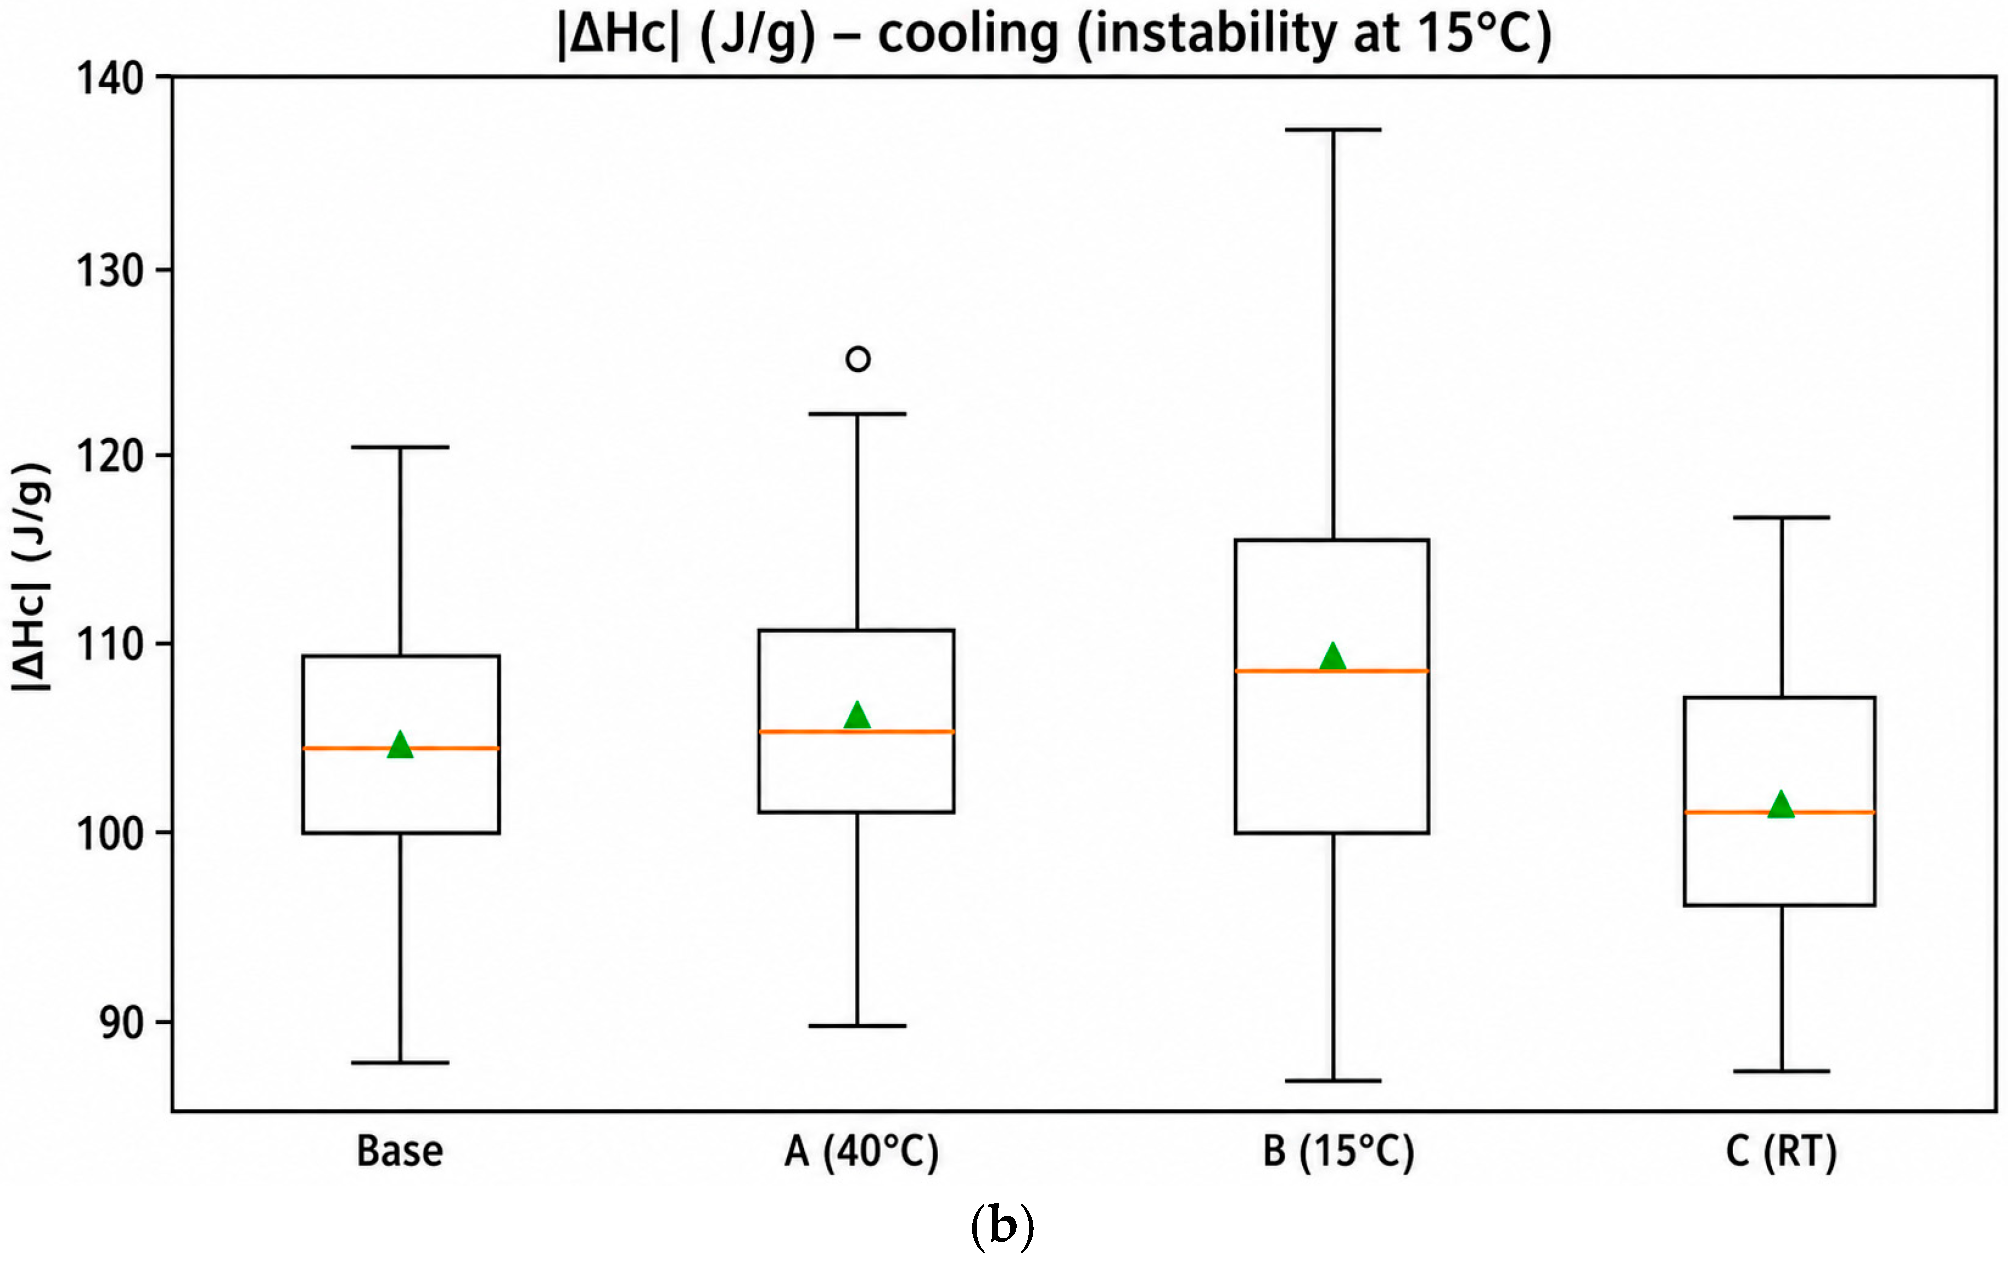
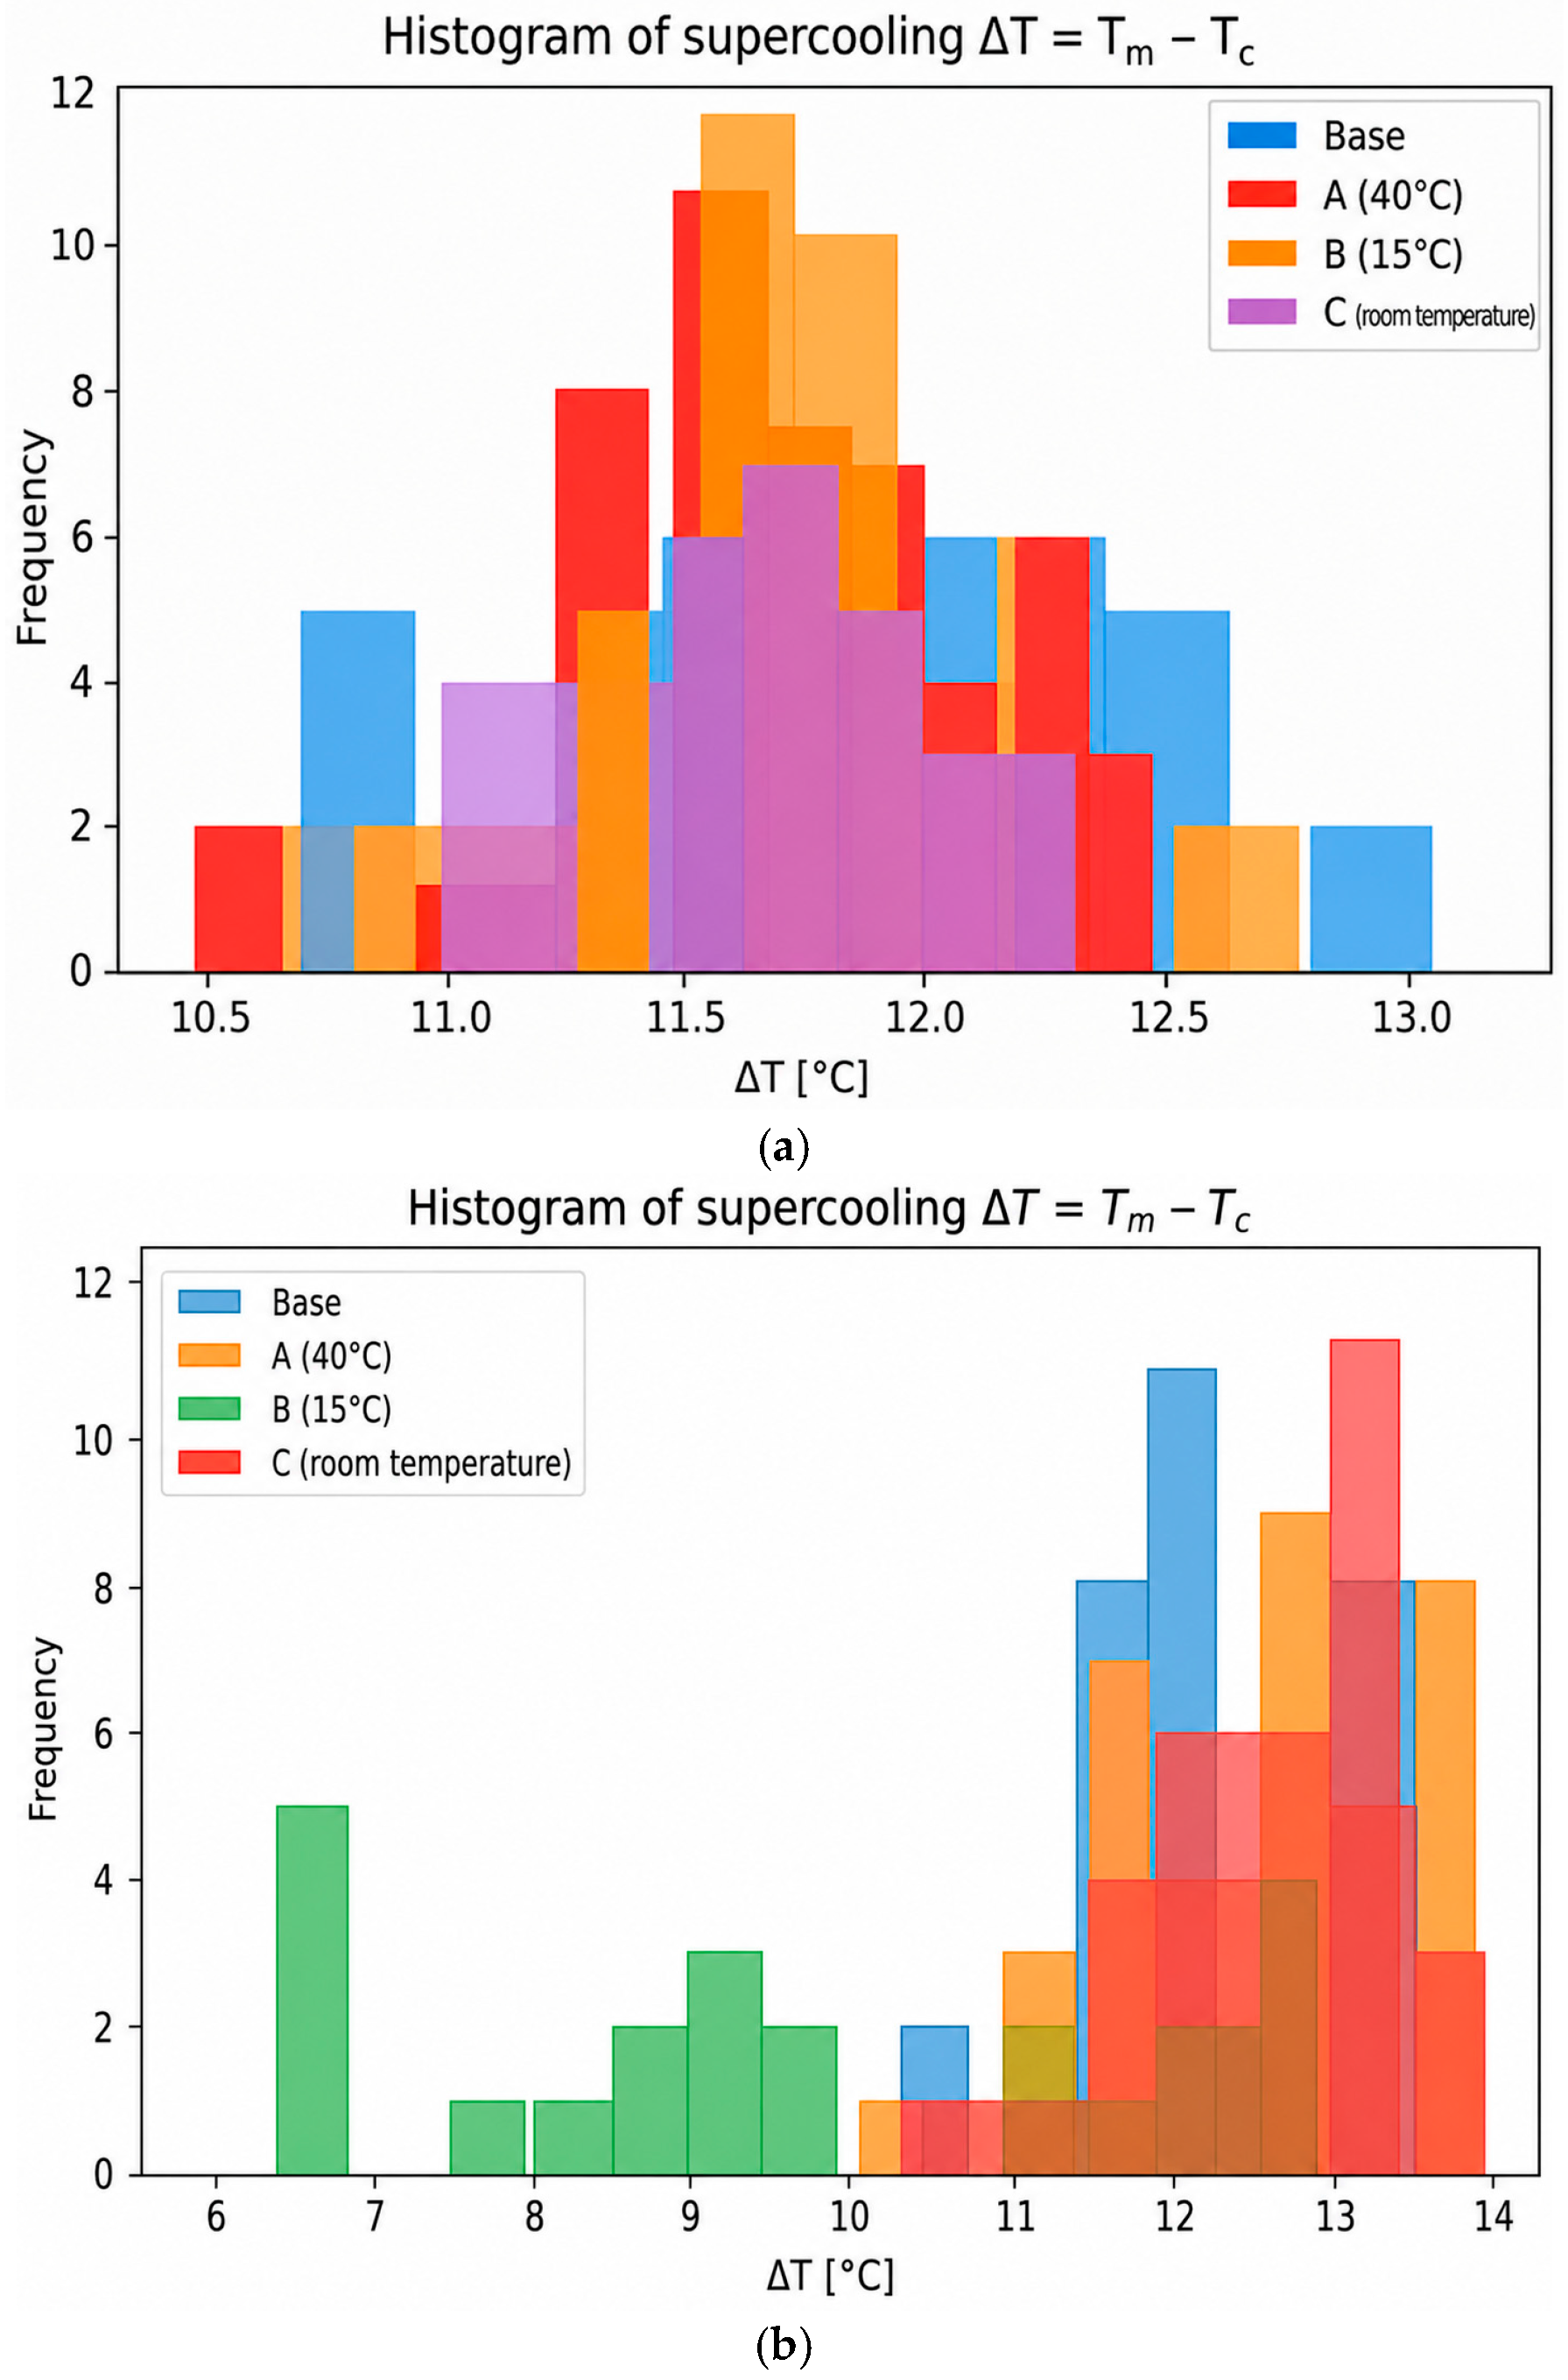
To provide a more detailed analysis of the nature of crystallization processes, an additional evaluation of the distribution of the supercooling parameter (ΔT) was performed using histograms (Figure 5). While Figure 4 allows for a general assessment of ΔT distributions depending on process and storage conditions, the histogram representation enables a more precise analysis of distribution shape, asymmetry, and the presence of extreme values. These aspects are crucial for identifying deviations from a uniform crystallization mechanism.
In the case of the D2 line, ΔT distributions remain relatively narrow and symmetrical, indicating a stable and controlled crystallization process regardless of storage conditions.
A different behavior is observed for the low-temperature line (D1), where for samples stored at 15 °C, a clear broadening of the distribution and an increased frequency of lower ΔT values are evident. This phenomenon indicates not only a reduction in the effective degree of supercooling, but also an increase in the variability of crystallization kinetics. The asymmetry of the distribution and the presence of an elongated tail toward lower ΔT values may indicate less uniform and more variable crystallization behavior.
The obtained results extend the observations presented in Figure 4 and support the conclusion that storage at 15 °C was associated with increased variability of crystallization behavior, particularly in systems produced under low-temperature conditions.
A decrease in ΔT may be associated with changes in the apparent crystallization pathway and increased variability of the thermal response. In the present system, this behavior should be interpreted as an indirect DSC-based indication of altered crystallization behavior rather than as direct evidence of crystallite size or defect density.
The observed DSC behavior may be interpreted in terms of increased thermodynamic instability and a higher contribution of interfacial effects in the material formed under less favorable storage conditions. In a simplified phenomenological description, the free energy of such a heterogeneous system can be expressed as the sum of volumetric and surface contributions:
ΔG = ΔGv + γA
where ΔGv corresponds to the volumetric contribution and γA represents the surface-energy contribution associated with phase boundaries. In systems containing a higher number of small or imperfect crystalline domains, the relative contribution of surface energy may increase, which can promote metastability and susceptibility to further thermal reorganization. However, this interpretation should be treated as indirect and based on DSC-derived thermal behavior rather than direct structural evidence.
Such a thermodynamically less favorable state may be associated with the accumulation and subsequent relaxation of internal stresses during secondary thermal reorganization. This process may contribute to recrystallization phenomena and to the macroscopic appearance of surface defects, such as frosting. Direct confirmation of crystallite morphology, interfacial structure, and stress distribution would require complementary structural or microscopic techniques.
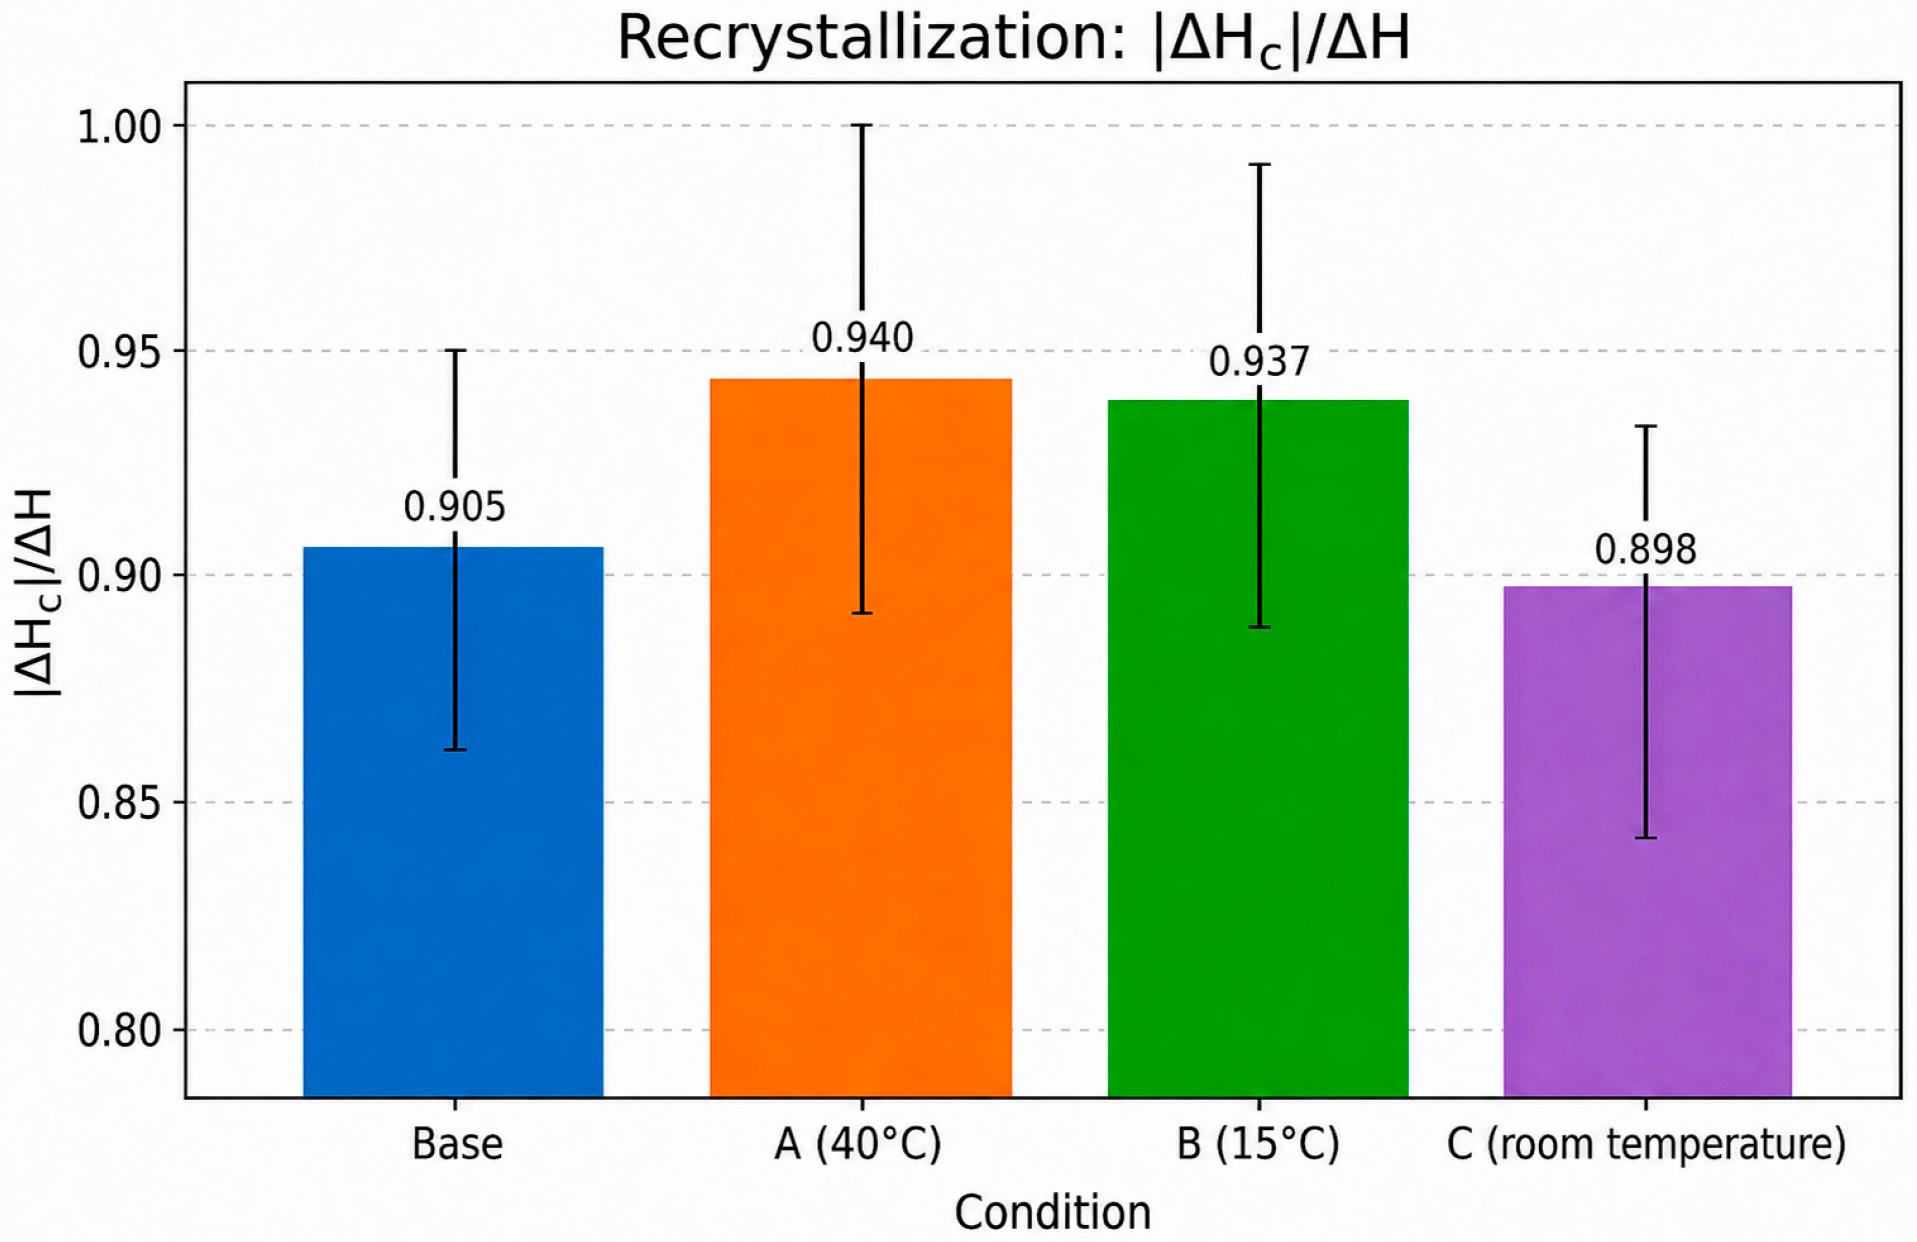
Additional confirmation of system instability (7) is provided by the analysis of the crystallinity recovery index:
X c = Δ H c Δ H m
where ΔHc denotes the crystallization enthalpy.
The calculated crystallinity recovery index values for the analyzed storage conditions are presented in Figure 6.
The observation of crystallinity recovery indices exceeding unity (Xc > 1), particularly in samples stored at 15 °C, suggests the presence of additional thermal contributions associated with non-equilibrium structural reorganization. Such behavior may be related to secondary phase rearrangements, metastable intermediate states, or the formation of mesophase- or rotator-phase-like structures. However, DSC measurements alone do not provide direct crystallographic evidence of these phenomena, and confirmation of the underlying structural changes would require complementary analytical techniques.
Changes in the crystallinity recovery index, especially the higher values and greater dispersion observed at 15 °C, further support the occurrence of additional thermal reorganization processes during cooling or subsequent heating. These effects are consistent with the non-equilibrium behavior of the material and may reflect the presence of transient structural arrangements that contribute to the measured enthalpy. Nevertheless, the crystallinity index itself does not allow identification of specific crystalline phases. Therefore, the possible presence of mesophases or rotator phases remains speculative and would require verification using complementary structural characterization methods such as XRD or WAXS/SAXS.
Figure 6. Crystallinity recovery index based on crystallization enthalpy for hybrid paraffin matrices under different storage conditions. The dashed line represents the reference equilibrium value. Higher values and increased dispersion observed for the 15 °C group suggest additional thermal reorganization processes and increased variability of crystallization behavior.
Processes 14 02120 g006
The high variability of this parameter indicates the stochastic nature of crystallization, resulting from local composition fluctuations and a non-uniform distribution of nucleation centers. This means that the material’s microstructure develops in an uncontrolled manner, which directly translates into a lack of reproducibility of functional properties.
Statistical analysis (ANOVA and Tukey test, Table 2) confirmed that a temperature of 15 °C is a factor generating significant differences in thermodynamic parameters compared to the reference group.
The statistical analysis was based on five independent samples per experimental group (n = 5). The Shapiro–Wilk test confirmed that the analyzed datasets did not significantly deviate from normality, while Levene’s test indicated acceptable homogeneity of variance. Therefore, one-way ANOVA followed by Tukey’s HSD post hoc test was applied. The strongest effect was observed for samples stored at 15 °C, which showed statistically significant differences in ΔHm, Tonset, and ΔT compared with the reference and room-temperature groups.

3.4. FT-IR Spectroscopic Analysis and Integrated Mechanistic Interpretation

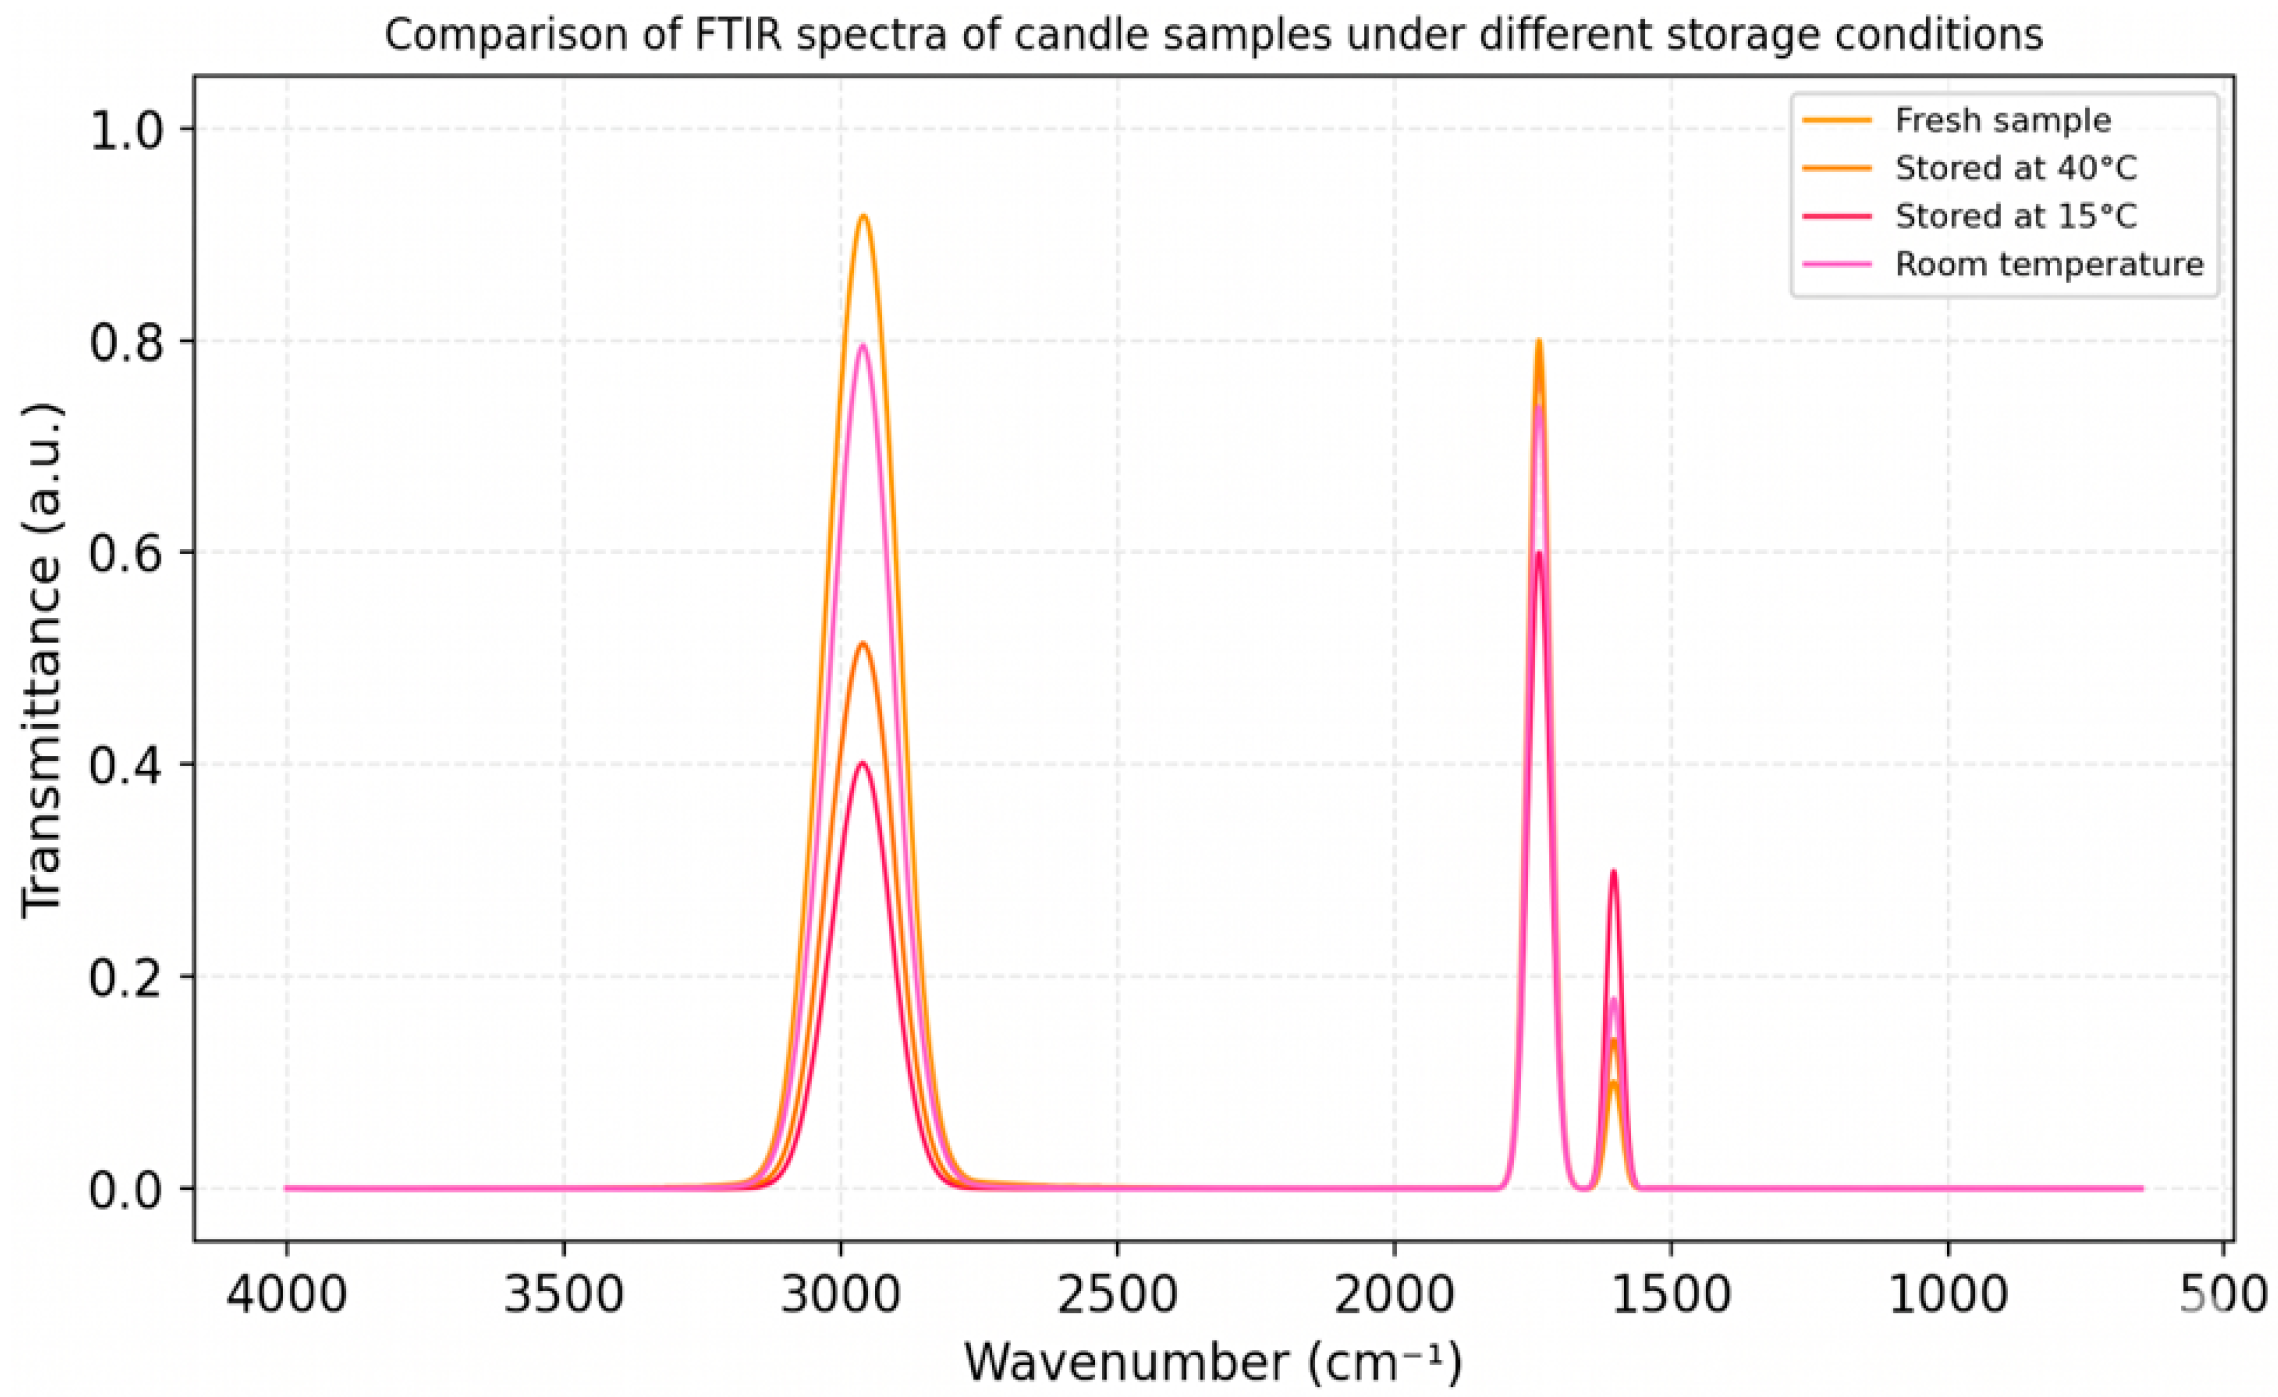
At the molecular level, structural changes were further examined using FT-IR spectroscopy (Figure 7), which provides insight into intermolecular interactions and the degree of ordering of aliphatic chains.
The FT-IR spectra of samples stored at 15 °C exhibited changes in the relative intensities of bands associated with C–H stretching vibrations in the range of 2850–2950 cm−1, corresponding to symmetric and asymmetric stretching modes of CH2 and CH3 groups. These changes may suggest differences in the packing efficiency or conformational ordering of hydrocarbon chains. However, since no full peak deconvolution or integrated peak-area analysis was performed, this interpretation should be treated as qualitative to semi-quantitative rather than as direct quantitative evidence of conformational disorder.
In particular, changes in the relative intensity ratio between the symmetric and asymmetric CH2 stretching bands may be consistent with a partial increase in conformational disorder within aliphatic chains. Nevertheless, direct quantification of trans/gauche conformational changes would require additional spectral analysis, including peak fitting and integrated band-area ratios.
The observed changes in the carbonyl C=O region around 1700–1750 cm−1 were also interpreted cautiously. Since no significant peak shift was detected, the results do not indicate the formation of new chemical bonds. Rather, they may reflect changes in the physical environment of functional groups and differences in intermolecular interactions.
Overall, the FT-IR results support the DSC observations by providing complementary evidence consistent with reduced molecular packing efficiency in samples stored at 15 °C. However, conclusions regarding increased free volume and enhanced molecular mobility should be regarded as mechanistic interpretations inferred indirectly from the combined thermal and spectroscopic behavior. Direct confirmation of such effects would require additional quantitative spectral analysis or complementary techniques.
Increased molecular mobility, if present, may facilitate the diffusion of low-molecular-weight components, such as fragrance additives, thereby contributing to macroscopic phenomena such as sweating.
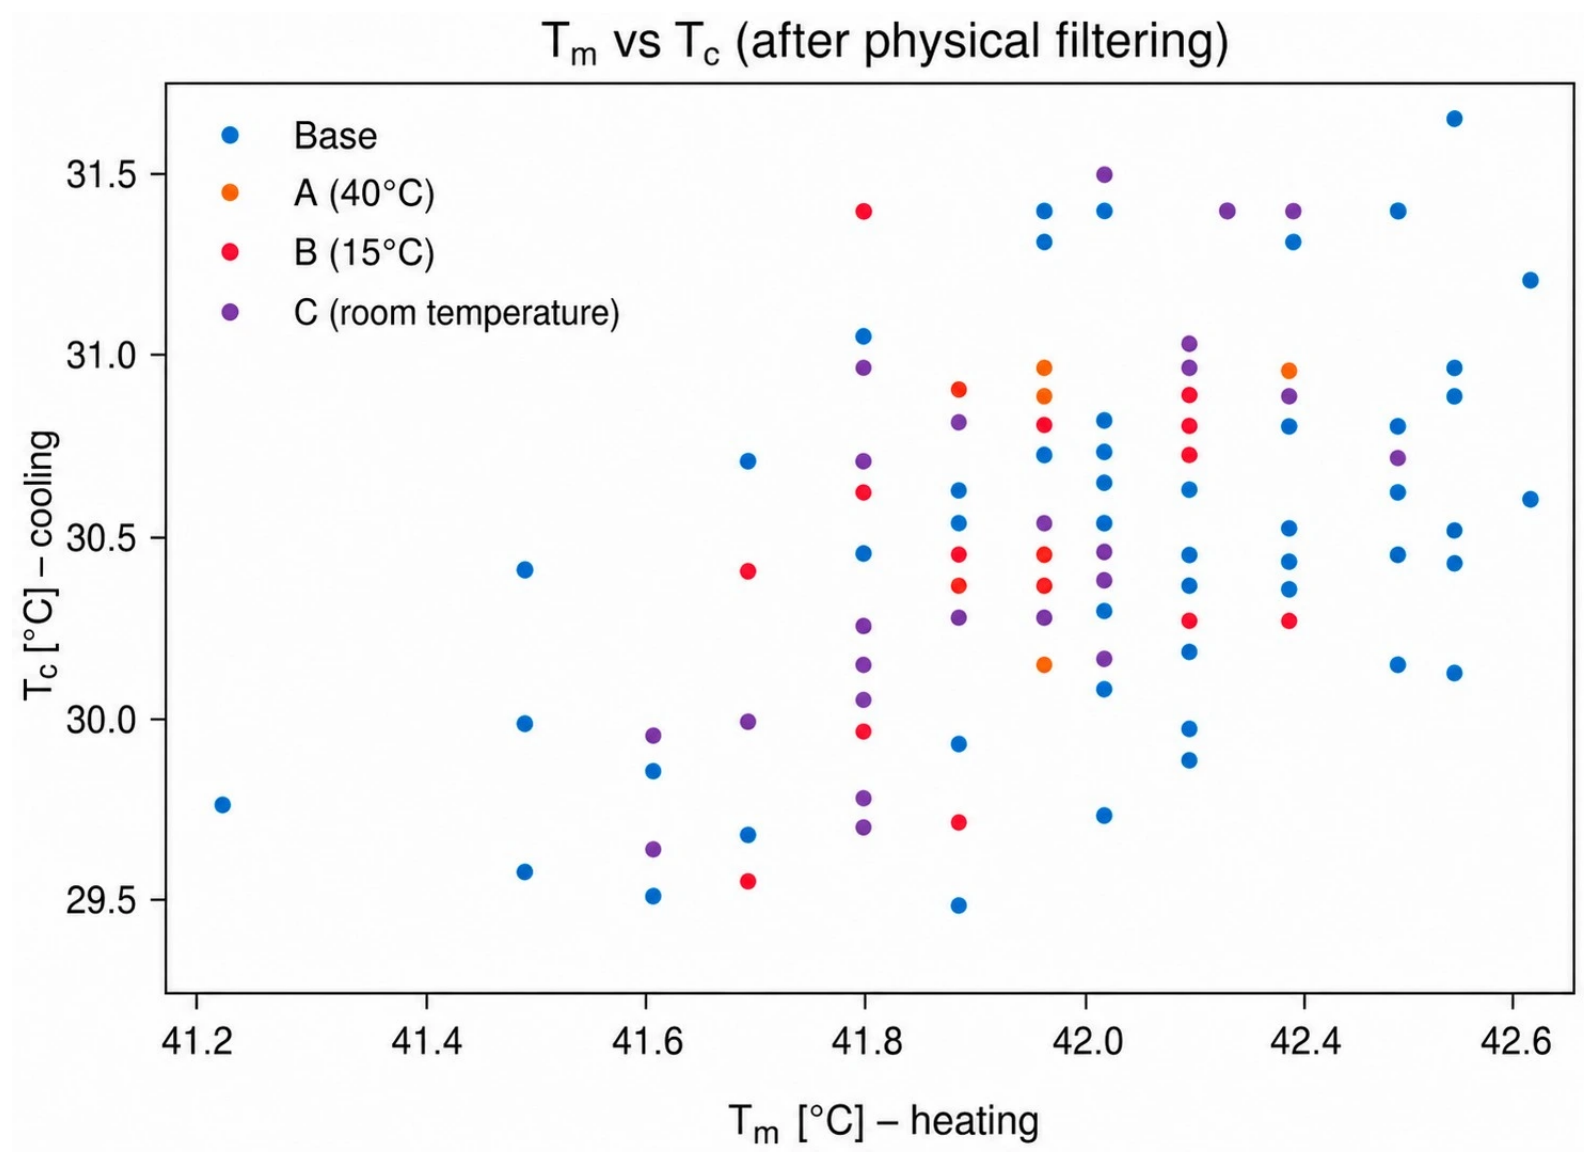
Correlation analysis of Tm and Tc (Figure 8) revealed higher dispersion of data for samples stored at 15 °C, suggesting less uniform crystallization behavior under this condition.
The pronounced scatter observed for samples stored at 15 °C suggests increased variability of crystallization behavior. This may be consistent with non-equilibrium crystallization behavior, although direct structural confirmation would require additional analysis. Among the tested storage conditions, 15 °C produced the least favorable thermal response. Under these conditions, a transition to a metastable state occurs, which is consistent with the general principles of physicochemistry of multicomponent systems [7]. Structural stability is maintained only at room temperature, where equilibrium between free energy and phase transition kinetics can be achieved.
While the FT-IR analysis in this study is primarily semi-quantitative, the observed shifts and intensity variations in the 2800–3000 cm−1 region—corresponding to C–H stretching vibrations—demonstrate high reproducibility across all tested batches. These spectroscopic trends are fully consistent with the DSC data, supporting the interpretation that the macroscopic changes may be related to modifications in molecular packing and intermolecular interactions within the paraffin-lipid matrix.
It should be emphasized that the structural mechanisms proposed in this study are inferred from indirect experimental evidence, including DSC phase-transition behavior, FT-IR spectral changes, statistical variability of thermal parameters, and macroscopic defect observations. Although these results provide a consistent interpretation of destabilization processes in hybrid paraffin-based systems, they do not constitute direct structural confirmation of crystalline morphology, polymorphic organization, or phase-boundary architecture. Direct verification of the proposed mechanisms would require complementary structural techniques, such as X-ray diffraction (XRD), small-angle X-ray scattering (SAXS), or wide-angle X-ray scattering (WAXS). Therefore, terms related to heterogeneous nucleation, metastable organization, internal energy trapping, and interfacial non-equilibrium should be understood as mechanistic interpretations consistent with the available experimental evidence rather than as directly observed structural features.
Taken together, the combined DSC, FT-IR, statistical, and macroscopic observations indicate that storage at 15 °C was associated with the least favorable thermal response among the tested conditions. These conclusions should be understood as an integrated physicochemical interpretation based on complementary experimental observations, while direct confirmation of specific structural mechanisms would require additional structural techniques.


4. Conclusions

This study provides a physicochemical analysis of process–property relationships in hybrid paraffin-based systems, with direct implications for process optimization and quality control. The results indicate that processing conditions influence the initial thermal response of the material. In particular, high-temperature processing (D2) was associated with narrower melting transitions and improved reproducibility of thermodynamic parameters compared with low-temperature processing (D1), suggesting a more uniform crystallization behavior under the applied experimental conditions. Among the tested storage conditions, 15 °C produced the least favorable thermal response, characterized by increased variability of DSC parameters and changes in crystallization behavior. These observations suggest a higher tendency toward post-crystallization reorganization and macroscopic defect formation. However, direct confirmation of the underlying microstructural mechanism requires additional structural studies.
Statistical analysis using ANOVA and Tukey’s HSD post hoc test confirmed that storage at 15 °C leads to a significant increase in the variability of selected thermodynamic parameters. This supports the conclusion that this storage condition is less favorable for maintaining reproducible thermal behavior of the investigated paraffin-based systems.
The combined application of DSC and FT-IR enabled a consistent thermal and spectroscopic interpretation of the observed phenomena. The FT-IR results suggest changes in molecular packing and intermolecular interactions, which may contribute to the migration of low-melting components and the development of macroscopic defects. However, these conclusions should be treated as indirect interpretations based on complementary thermal and spectroscopic observations. From an industrial perspective, the results highlight the necessity of controlling both processing and storage conditions to ensure product stability. In particular, avoiding thermal shocks and maintaining storage within a narrow temperature range of approximately 20–25 °C may help preserve product integrity and ensure reproducible performance. The proposed integrated analytical approach, combining thermal, spectroscopic, statistical, and macroscopic observations, provides a useful framework for evaluating instability in complex multicomponent organic systems. The identification of 15 °C as the least favorable storage condition among those tested provides a practical indication for industrial quality control and may support the optimization of storage conditions for paraffin–lipid blends.

Author Contributions

Conceptualization, E.M. and Z.K.; methodology, E.M.; software, K.W.-R.; validation, Z.K., E.M. and K.W.-R.; formal analysis, E.M.; investigation, E.M.; resources, Z.K.; data curation, E.M.; writing—original draft preparation, E.M.; writing—review and editing, Z.K.; visualization, E.M.; supervision, Z.K.; project administration, Z.K.; funding acquisition, Z.K. All authors have read and agreed to the published version of the manuscript.

Funding

This research was funded by the Ministry of Science and Higher Education of Poland under the “Industrial Doctorate” program, Grant No. DWD/8/0112/2024.

Data Availability Statement

The data presented in this study are available on request from the corresponding author.

Acknowledgments

The authors would like to thank GALA POLAND Sp. z o.o. for providing materials and technical support during the experimental phase of this research.

Conflicts of Interest

The authors declare no conflicts of interest. The company GALA POLAND Sp. z o.o. had no role in the design of the study; in the collection, analyses, or interpretation of data; in the writing of the manuscript; or in the decision to publish the results.

References

  1. Bloch, P.H. Seeking the ideal form: Product design and consumer response. J. Mark. 1995, 59, 16–29. [Google Scholar] [CrossRef] [Scilit]
  2. Grunert, K.G. Introduction. In Consumer Trends and New Product Opportunities in the Food Sector; Wageningen Academic Publishers: Wageningen, The Netherlands, 2017; pp. 13–14. [Google Scholar] [CrossRef] [Scilit]
  3. Spence, C. Multisensory flavor perception. Cell 2015, 161, 24–35. [Google Scholar] [CrossRef] [Scilit] [PubMed]
  4. McGee, H. On Food and Cooking: The Science and Lore of the Kitchen; Simon and Schuster: New York, NY, USA, 2004; pp. 200–250. [Google Scholar]
  5. Strobl, G. The Physics of Polymers: Concepts for Understanding Their Structures and Behavior, 3rd ed.; Springer: Berlin/Heidelberg, Germany, 2007. [Google Scholar] [CrossRef] [Scilit]
  6. Wunderlich, B. Thermal Analysis of Polymeric Materials; Springer: Berlin/Heidelberg, Germany, 2005. [Google Scholar] [CrossRef] [Scilit]
  7. Debenedetti, P.G. Metastable Liquids: Concepts and Principles; Princeton University Press: Princeton, NJ, USA, 1996. [Google Scholar]
  8. Gibbs, J.W. On the equilibrium of heterogeneous substances. Trans. Conn. Acad. Arts Sci. 1876, 3, 108–248. [Google Scholar]
  9. Cebula, D.J.; Russell, A.B. Ice crystallization control in ice cream. In Ice Cream: Proceedings of the International Symposium; Buchheim, W., Ed.; International Dairy Federation: Brussels, Belgium, 1998. [Google Scholar]
  10. Wang, H.; Bellet, M.; Boyer, S.A.E.; Dalle, F. Calorimetry characterization and crystallization modelling of wax-based mixtures under isokinetic and non-isokinetic cooling. J. Therm. Anal. Calorim. 2022, 147, 14407–14422. [Google Scholar] [CrossRef] [Scilit]
  11. Speight, J.G. The Chemistry and Technology of Petroleum, 5th ed.; CRC Press: Boca Raton, FL, USA, 2014. [Google Scholar] [CrossRef] [Scilit]
  12. Wang, J.; Hao, Y.; Zhu, B.; Han, T.; Li, Z.; Zhang, J. Crystalline behavior of paraffin wax. J. Phys. Chem. B 2022, 126, 985–995. [Google Scholar] [CrossRef] [Scilit] [PubMed]
  13. Gunstone, F.D. Vegetable Oils in Food Technology: Composition, Properties and Uses, 2nd ed.; Wiley-Blackwell: Oxford, UK, 2011. [Google Scholar] [CrossRef] [Scilit]
  14. Sato, K. Crystallization behaviour of fats and lipids—A review. Chem. Eng. Sci. 2001, 56, 2255–2265. [Google Scholar] [CrossRef] [Scilit]
  15. Hernqvist, L.; Larsson, K.; Herslöf, B.; Podlaha, O. Polymorphism of rapeseed oil with a low content of erucic acid and possibilities to stabilise the β′-crystal form in fats. J. Sci. Food Agric. 1981, 32, 1197–1202. [Google Scholar] [CrossRef] [Scilit]
  16. O’Brien, R.D. Fats and Oils: Formulating and Processing for Applications, 3rd ed.; CRC Press: Boca Raton, FL, USA, 2008. [Google Scholar] [CrossRef] [Scilit]
  17. Rezaei, K.; Wang, T.; Johnson, L.A. Hydrogenated vegetable oils as candle wax. J. Am. Oil Chem. Soc. 2002, 79, 1241–1247. [Google Scholar] [CrossRef] [Scilit]
  18. Myerson, A.S. Handbook of Industrial Crystallization, 2nd ed.; Butterworth-Heinemann: Oxford, UK, 2002. [Google Scholar] [CrossRef] [Scilit]
  19. Bozorboeva, G.A.; Alimukhamedov, M.G.; Jurayev, A.B.; Dusiyorov, N.Z. DSC characterization of polyethylene composites with recycled PET-based polar wax. Int. Sci. J. Sci. Innov. (Ser. A) 2025, 4, 15903416. [Google Scholar] [CrossRef]
  20. ISO 11357-1:2023; International Organization for Standardization. Plastics—Differential Scanning calorimetry (DSC)—Part 1: General Principles. ISO: Geneva, Switzerland, 2023.
  21. Marangoni, A.G.; Acevedo, N.; Maleky, F.; Peyronel, F.; Mazzanti, G.; Quinn, B.; Pink, D. Structure and functionality of edible fats. Soft Matter 2012, 8, 1275–1300. [Google Scholar] [CrossRef] [Scilit]
  22. Lee, E.J.; Park, J.K.; Lee, Y.S.; Lim, K.H. Comparison of thermal properties of crude by-product polyolefin wax, fractionated paraffin wax and their blend. Korean J. Chem. Eng. 2010, 27, 680–686. [Google Scholar] [CrossRef] [Scilit]
  23. Wang, R.; Du, T.; Cao, J.; Wang, G. The Paraffin Crystallization in Emulsified Waxy Crude Oil by Dissipative Particle Dynamics. Front. Heat Mass Transf. 2024, 22, 129–139. [Google Scholar] [CrossRef] [Scilit]
  24. Garti, N.; Sato, K. Crystallization Processes in Fats and Lipid Systems; CRC Press: Boca Raton, FL, USA, 2001. [Google Scholar] [CrossRef] [Scilit]
  25. Hancock, B.C.; Zografi, G. Characteristics and significance of the amorphous state in pharmaceutical systems. J. Pharm. Sci. 1997, 86, 1–12. [Google Scholar] [CrossRef] [Scilit] [PubMed]
  26. Pettersson, J.; Alander, J.; Norberg, S. A comparative study of shea stearin crystallization in rapeseed oil and octyldodecanol. J. Am. Oil Chem. Soc. 2025, in press. [Google Scholar] [CrossRef] [Scilit]
  27. Liu, Y.; Liu, M.Y.; Qi, Y.X.; Jin, X.Y.; Xu, H.R.; Chen, Y.X.; Chen, S.P.; Su, H.P. Synthesis and properties of wax based on waste cooking oil. RSC Adv. 2022, 12, 3365–3371. [Google Scholar] [CrossRef] [Scilit] [PubMed]
  28. DeMan, L.; Chen, H.S.; Yu, Y.J.; DeMan, J.M. Physical and chemical-properties of hydrogenated high erucic rapeseed oil. Fett Wiss. Technol. 1995, 97, 485–490. [Google Scholar]
  29. Rondou, K.; De Witte, F.; Penagos, I.A.; Chen, O.; Dewettinck, K.; Van Bockstaele, F. Crystallization behavior of monoglyceride oleogels. Eur. J. Lipid Sci. Technol. 2024, 126, 2300261. [Google Scholar] [CrossRef] [Scilit]
  30. Ukrainczyk, N.; Kurajica, S.; Šipušić, J. Thermophysical comparison of five commercial paraffin waxes as latent heat storage materials. Chem. Biochem. Eng. Q. 2010, 24, 129–137. [Google Scholar] [CrossRef]
  31. Höhne, G.W.H.; Hemminger, W.F.; Flammersheim, H.J. Differential Scanning Calorimetry, 2nd ed.; Springer: Berlin/Heidelberg, Germany, 2003. [Google Scholar]
  32. Eštoková, A.; Kapalo, P. Investigation of the thermal properties of candle wax material. IOP Conf. Ser. Mater. Sci. Eng. 2022, 1252, 012013. [Google Scholar] [CrossRef] [Scilit]
  33. Stuart, B.H. Infrared Spectroscopy: Fundamentals and Applications; Wiley: Chichester, UK, 2004. [Google Scholar] [CrossRef] [Scilit]
Figure 2. Distribution of melting enthalpy (ΔHm) values during heating for hybrid paraffin systems produced under different technological conditions: (a) high-temperature process (D2), (b) low-temperature process (D1), across different storage conditions. Broader distributions observed for samples stored at 15 °C suggest increased variability of the thermal response under these conditions.
Processes 14 02120 g002
Figure 3. Photographic documentation of mechanical and structural defects in hybrid paraffin systems stored at 15 °C: (a) shrinkage cavities and material losses associated with non-uniform solidification and post-crystallization relaxation; (b) structural cracks arising from the relaxation of internal stresses.
Processes 14 02120 g003
Figure 4. Distribution of the supercooling parameter (ΔT = Tm − Tc) for hybrid paraffin systems under different storage conditions: (a) high-temperature process (D2), (b) low-temperature process (D1).
Processes 14 02120 g004aProcesses 14 02120 g004b
Figure 5. Histogram of the supercooling parameter (ΔT = Tm − Tc) for hybrid paraffin systems produced under low- and high-temperature processing conditions and stored at different temperatures. (a) High-temperature process (D2), (b) low-temperature process (D1).
Processes 14 02120 g005
Figure 7. FT-IR spectra overlay comparing samples stored at 15 °C and 25 °C. Differences in band intensities in the C–H stretching region suggest changes in molecular packing or chain organization. These observations are consistent with the DSC results, although the FT-IR analysis remains semi-quantitative.
Processes 14 02120 g007
Figure 8. Correlation between melting temperature (Tm) and crystallization temperature (Tc) for hybrid paraffin systems under different storage conditions.
Processes 14 02120 g008
Table 1. Example calibration data for the temperature range relevant to the analysis of organic matrices.
StandardMelting Temperature (Lit.) [°C]Melting Temperature (Measured) [°C]ΔT [°C]Enthalpy of Fusion (Lit.) [J/g]Enthalpy of Fusion (Measured) [J/g]
Indium (In)156.6156.60.028.628.5
Bismuth (Bi)271.4271.5+0.153.153.0
Tin (Sn)231.9232.1+0.260.560.3
Table 2. Results of one-way ANOVA and Tukey HSD post hoc test for selected thermal parameters of hybrid paraffin systems under different storage conditions.
Thermal ParameterExperimental GroupMean ValueStandard Deviation (SD)p-ValueTukey Group
Melting enthalpy (ΔHm) [J/g]Base198.52.1A
25 °C197.23.40.412A
15 °C172.812.6<0.001B
40 °C185.48.90.024C
Onset temperature (Tonset) [°C]Base54.20.5A
25 °C54.10.60.892A
15 °C51.82.40.003B
Supercooling (ΔT) [°C]Base12.40.8A
25 °C12.61.10.654A
15 °C8.23.7<0.001B
Notes: Groups marked with different letters (A, B, C) are statistically significantly different from each other (p < 0.05).
Disclaimer/Publisher’s Note: The statements, opinions and data contained in all publications are solely those of the individual author(s) and contributor(s) and not of MDPI and/or the editor(s). MDPI and/or the editor(s) disclaim responsibility for any injury to people or property resulting from any ideas, methods, instructions or products referred to in the content.