Abstract
The functional properties of coffee are mainly attributed to bioactive compounds, primarily caffeine and polyphenols. Their quantitative and qualitative profile depends on many factors, including the roasting process. The study aimed to assess the effect of different roasting conditions on the caffeine content and polyphenol composition of the Ethiopian variety Coffea arabica L. (from two regions: Sidama and Jimma). In total, 21 bioactive compounds were identified, including caffeine, 14 phenolic acids, 3 flavonoid glycosides, and 3 flavonoids. It was found that chlorogenic acid had the highest concentration of all phenolic compounds in the Jimma and Sidama varieties, regardless of the degree of roasting. Studies have shown that the initial stage of coffee roasting (light roast) affects chlorogenic acid content—its level increases compared to green coffee, but then decreases in subsequent roasting stages (medium and dark roast). In contrast, the concentration of caffeic acid decreases during the light roast stage, while it increases during the medium and dark roast stages. The Sidama variety contains more caffeine than the Jimma variety.
1. Introduction
Coffee is one of the most widely consumed beverages in the world, and its flavor and health properties are primarily attributed to various bioactive compounds, particularly polyphenols and caffeine [1]. The coffee roasting process can modify the content and composition of these compounds, which is a key step in the coffee production chain. Ethiopian coffee, highly valued for its unique flavor profiles and rich cultural significance, is an intriguing subject for studying the effects of roasting on bioactive compounds. The diversity of Ethiopian coffee varieties provides an opportunity to examine how different genetic backgrounds respond to different roasting conditions [2]. The polyphenolic chemistry of coffee is complex and includes diverse classes of phenolic compounds [3]. The dominant polyphenols in coffee are chlorogenic acids, a group of esters formed between quinic acid and various hydroxycinnamic acids, such as caffeic, ferulic, and p-coumaric acids [1]. These chlorogenic acids are the most abundant polyphenols in coffee and contribute significantly to the flavor and antioxidant properties of the beverage. In addition to chlorogenic acids, coffee also contains other classes of polyphenolic compounds, including flavonoids such as catechins and proanthocyanidins, as well as phenolic acids such as protocatechuic acid and vanillic acid [4]. Roasting is a critical step in coffee production, significantly affecting the final product’s flavor, aroma, and acidity. The degree of roasting, particularly color, is a key factor in determining these sensory attributes [5]. During the roasting process, the beans undergo a series of physical and chemical changes, including the Maillard reaction, caramelization, and thermal degradation of various compounds [6]. These changes can lead to the degradation, transformation, and loss of some polyphenolic compounds, such as lactonization and polymerization of chlorogenic acids, as well as epimerization and oxidation of compounds such as catechins [1,7,8,9,10]. The extent of these changes may vary depending on roasting conditions, such as temperature and duration, as well as on coffee variety, which may have inherent differences in polyphenol content and composition.
In addition to polyphenols, caffeine is another key bioactive compound in coffee that contributes to its stimulant properties and potential health benefits. During the roasting process, the caffeine content in coffee beans is generally believed to remain relatively stable, with only minor losses reported [10]. However, some studies have suggested that more severe roasting conditions, such as higher temperatures and longer durations, may slightly decrease caffeine content due to thermal degradation [7]. Caffeine retention during roasting is essential, as it is a valuable component of the coffee beverage and contributes to its overall quality and consumer appeal.
The paper provides a comprehensive evaluation of the impact of coffee roasting on functional properties, focusing on polyphenols and caffeine. The study aimed to assess the effects of different time–temperature profiles during coffee roasting on caffeine content and polyphenols’ composition. By understanding these changes, the researchers aimed to provide valuable insights that could help optimize production processes to deliver high-quality, functional coffee products to consumers.
2. Materials and Methods
2.1. Sample Preparation and Processing
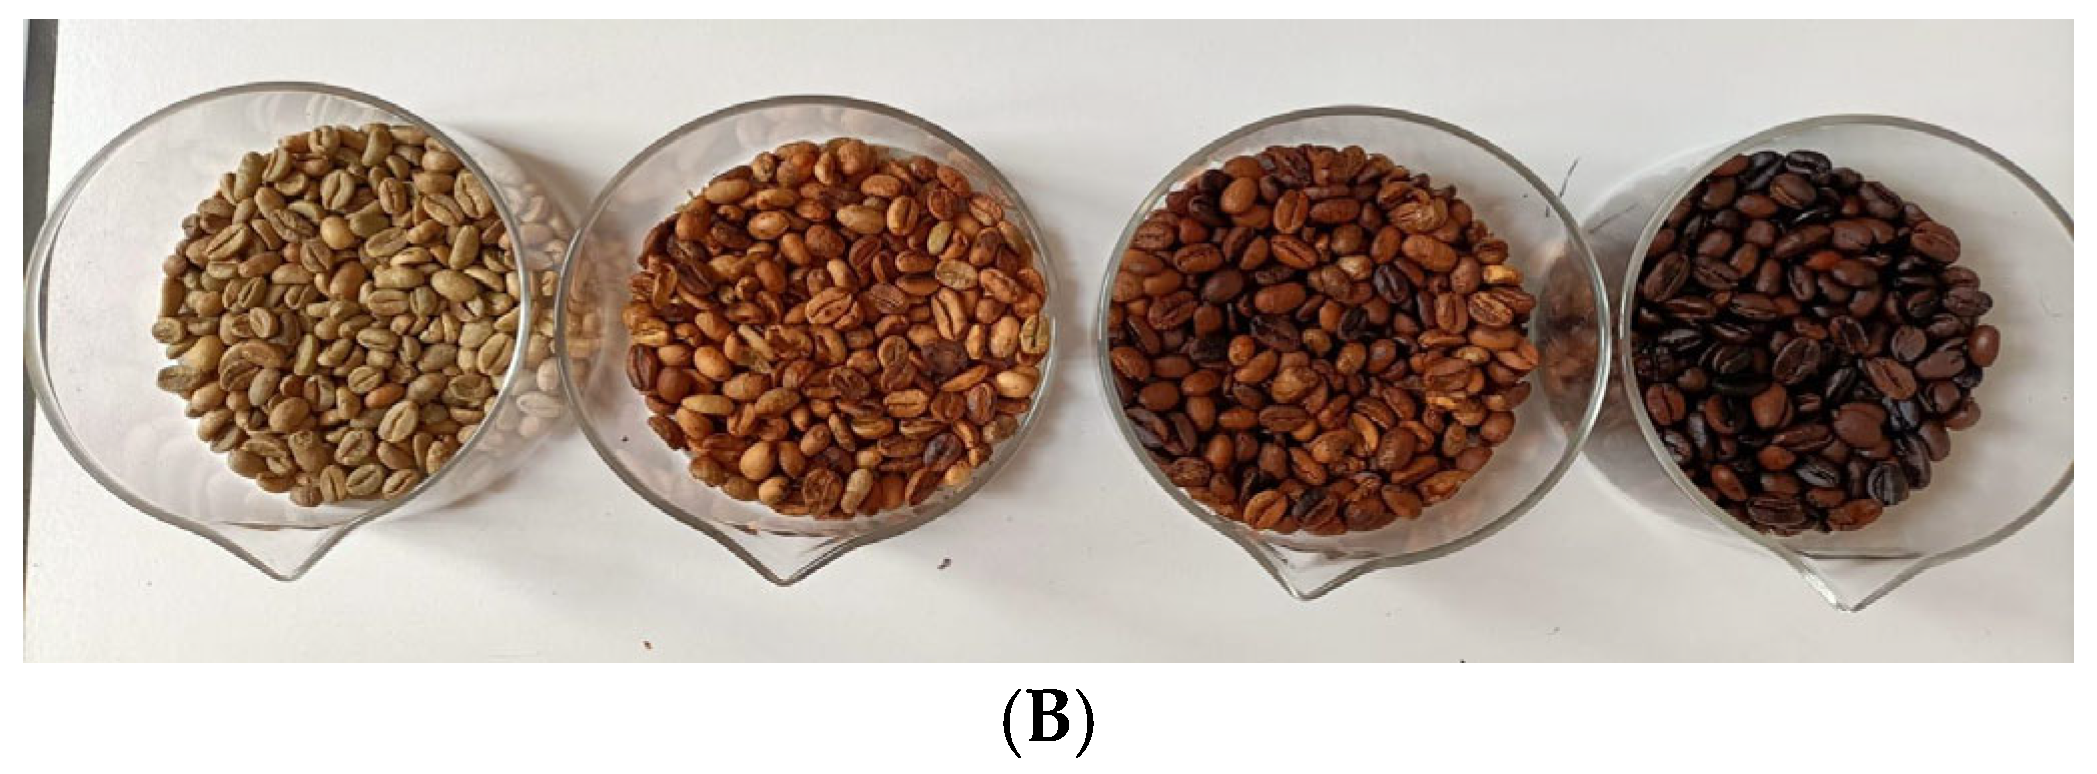
The coffee samples used in this analysis were from Ethiopia, species Coffea arabica L. cultivated in two regions: Jimma (N 7°60′72.2″, E 36°71′18.09″) and Sidama (N 6°85′19.1″, E 38°44′69.2″). Hence, the varieties Sidama and Jimma are discussed later in the manuscript. The coffee roasting method involved the use of a 1400 W coffee roaster at a constant temperature of 230 °C for three stages of 5, 7, and 9 min, respectively (Figure 1A,B). Each variety was roasted in 3 different time variants, giving a total of 6 trials (in the further stage of chemical analyses, each analysis was performed in 3 replicates). After the roasting process, the beans were cooled to ambient temperature to preserve their properties before grinding for brewing. This controlled approach ensured a well-developed flavor profile through precise management of temperature and time during roasting. The ground coffee was then stored in airtight containers to maintain freshness and prevent moisture absorption.
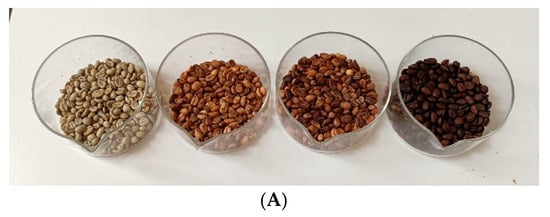
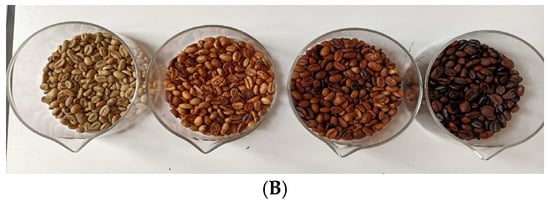
Figure 1.
(A) Jimma coffee samples; (B) Sidama coffee samples (from left, green beans, 1st, 2nd, and 3rd roasting stage).
2.2. Determination of the Phenolic Compounds
The phenolic compounds in the coffee bean samples were analyzed using a two-step process involving alkaline and acid hydrolysis.
The samples for analysis weighed 0.20 g. They were placed in sealed 17 mL culture test tubes, where alkaline and acid hydrolysis were performed first. To perform alkaline hydrolysis, 1 mL of distilled water and 4 mL of 2 M aqueous sodium hydroxide were added to test tubes. Tightly sealed test tubes were heated in a water bath at 95 °C for 30 min. After cooling (approx. 20 min), test tubes were neutralized with 2 mL of a 6 M aqueous hydrochloric acid solution (pH = 2). Next, samples were cooled in water with ice. Flavonoids were extracted from the inorganic phase using diethyl ether (2 × 2 mL). Formed ether extracts were continuously transferred to 8 mL vials. Next, acid hydrolysis was performed. For this purpose, the aqueous phase was supplemented with 3 mL of a 6 M aqueous hydrochloric acid solution. Tightly sealed test tubes were heated in a water bath at 95 °C for 30 min. After being cooled in water with ice, the samples were extracted with diethyl ether (2 × 2 mL). The produced ether extracts were continuously transferred to 8 mL vials, after which they were evaporated to dryness in a stream of nitrogen. Before analysis, samples were dissolved in 1 mL of methanol. Analysis was performed using an Aquity H class Ultra-Performance Liquid Chromatography (UPLC) system equipped with a Waters Acquity photodiode array (PDA) detector (Waters, Milford, MA, USA). Chromatographic separation was performed on an Acquity UPLC® BEH C18 column (100 mm × 2.1 mm, particle size 1.7 μm) (Waters, Dublin, Ireland). The elution was performed in a gradient using the following mobile phase composition: A: 1% aqueous formic acid mixture (pH = 2); B: acetonitrile with 0.1% formic acid. Concentrations of flavonoids were determined using an internal standard at wavelengths of 320 nm. Concentrations of phenolic acids were determined using an internal standard at wavelengths of 280 nm. Compounds were identified by comparing the analyzed peak’s retention time with the standard’s retention time, adding a specific standard amount to the analyzed samples, and repeating the analysis. The detection limit (LOD) is 1 μg/g, the limit of quantification (LOQ) is 2 μg/g, and the calibration range is 1–100 μg/mL for phenolic acids and 1–200 μg/mL for flavonoids. The regression equation and correlation coefficient (r) for UPLC/DAD were used in the Empower software, version 2.1 (Waters, Ireland). Retention times of assayed acids are as follows: kaempferol 6.11 min, gallic acid 8.85 min, vanilic 9.71 min, luteolin 11.89 min, protocatechuic acid 12.23 min, vanilin acid 14.19 min, apigenin 16.43 min, catechin 18.09 min, 4-hydroxybenzoic acid 19.46 min, chlorogenic acid 21.56 min, caffeic acid 26.19 min, syringic acid 28.05 min, naringenin 31.22 min, vitexin 35.41 min, rutin 38.11 min, quercetin 39.58 min, p-coumaric acid 40.20 min, ferulic acid 46.20 min, synapic acid 48.00 min, and t-cinnamic acid 52.40 min [11]. All chemical standards used for analysis were from Sigma Aldrich, St. Louis, MO, USA.
2.3. Determination of the Caffeine
The caffeine content analysis was conducted per PN-ISO 10095:1997 [12]. A 2 g sample of coffee was weighed into a beaker, to which 100 mL of hot distilled water (80 °C) was added. The beaker was covered with a watch glass and allowed to brew for 20 min. Subsequently, the coffee infusion was filtered through a tissue paper filter. A 10 mL aliquot of the filtrate was transferred to a separatory funnel, and the pH was adjusted to 13 by adding 1 mL of 1 M NaOH solution. The decalcified coffee infusion underwent extraction with three successive portions of chloroform (10 mL, 5 mL). The organic layer containing extracted caffeine was collected in a 25 mL volumetric flask. The flask was then filled to the mark with chloroform. The absorbance of the prepared extracts was measured at 276 nm using a UV-Vis Spectrophotometer model DR6000 (HACH LANGE, Wroclaw, Poland). Pure anhydrous caffeine (1,3,7-trimethyl-2,6-dioxypurine-C8H10N4O2) served as the standard, from which a 0.5 g/L caffeine standard solution was prepared. Caffeine working solutions of 1, 5, 10, 25, and 50 mg/dm3 were formulated from this solution. Results were expressed as mg of caffeine per 100 g of coffee extract.
2.4. Statistical Analysis
Statistical analyses in this study were conducted to investigate the influence of variety and roasting processes on the profiles of bioactive compounds in coffee beans sourced from Ethiopia’s Jimma and Sidama regions. A total of 21 bioactive compounds were identified. Descriptive statistics were calculated, including mean value, standard deviation, and the respective minimum and maximum for each treatment group.
The normality of data distribution was assessed using the Shapiro–Wilk test, which showed a non-normal distribution for p values ≥ 0.05. For non-parametric data, the Kruskal–Wallis test was utilized to analyze differences in the chemical composition of coffee beans based on their variety and roasting degree. Dunn’s test provided further pairwise comparisons. Additionally, a 21-variable heat map was created to visualize the relationships between individual chemical compounds, showcasing Spearman’s correlation coefficients. Principal component analysis (PCA) was performed to visualize the effect of different degrees of coffee roasting on its chemical profile. For the variable of caffeine content, which exhibited a normal distribution, ANOVA was performed to compare mean caffeine levels across different roasting degrees and varieties. Tukey’s test was applied for pairwise comparisons, identifying statistically significant differences between groups. The statistical analysis was conducted using the package R (v. 4.4.2), and p-values below 0.05 were considered statistically significant.
3. Results and Discussion
3.1. Content of Bioactive Compounds
Based on the research conducted, it was determined that the variety of coffee and roasting processes influences the profile of bioactive compounds in coffee beans. Studies indicate that variety (Jimma and Sidama) significantly affects the chemical composition of coffee, which subsequently affects its organoleptic properties and potential health benefits. During this investigation, 21 bioactive compounds were identified (Table 1), including caffeine, 14 phenolic acids, 4 flavonoid glycosides, and 2 flavonoid compounds.

Table 1.
The content of coffee beans’ bioactive compounds (mg/g) from the Jimma and Sidama varieties depends on the roasting degree.
Research findings demonstrate that roasting coffee beans induces the decomposition of thermally unstable compounds, such as phenolic acids (primarily chlorogenic acid and its derivatives) or caffeine [13,14]. Although a substantial portion of this acid undergoes spontaneous decomposition during coffee roasting, coffee beans remain the primary source of chlorogenic acid and its derivatives in the human diet. Chlorogenic acid exhibited the highest concentration among all the phenolic compounds examined in the Jimma and Sidama varieties, irrespective of the degree of roasting. The aforementioned acid is a thermolabile compound that loses biological activity or decomposes when exposed to high temperatures. This study observed that in both varieties, during the initial stage of coffee bean roasting, the chlorogenic acid content increased at the expense of cinnamic acid and caffeic acid content. Conversely, the contents of the aforementioned acids exhibited an opposite trend during the second and third stages of coffee bean roasting. This phenomenon is attributed to chlorogenic acid, a derivative of cinnamic acid, which is formed by combining the carboxyl group of caffeic acid with the phenolic group of quinic acid [15,16,17,18]. Both this study and studies by other scientists report that coffee, both green and roasted, contains various bioactive substances, including chlorogenic acids, lactones, methylxanthines (caffeine, theophylline, and theobromine), and diterpenes [19,20,21,22]. In addition to the 21 phenolic compounds identified in the present study, Saud and Salamatullah [20] reported the presence of several other polyphenols, including p-hydroxybenzoic acid, vanillic acid, p-coumaric acid, ferulic acid, and chlorogenic acid. These compounds were isolated alongside caffeic acid, caffeoylquinic acid, dicaffeoylquinic acid, 3-O-feruloylquinic acid, 3-O-feruloyl-4-O-caffeoylquinic acid, and their derivatives. The thermal processing applied during coffee roasting induces the degradation of chlorogenic acid, leading to the formation of bitter phenolic compounds and aromatic phenolic constituents. This study and previous research have confirmed the presence of flavonoids, which constitute a significant class of bioactive compounds [20,23,24]. Coffee contains flavonoids such as catechin, epicatechin, quercetin, and rutin.
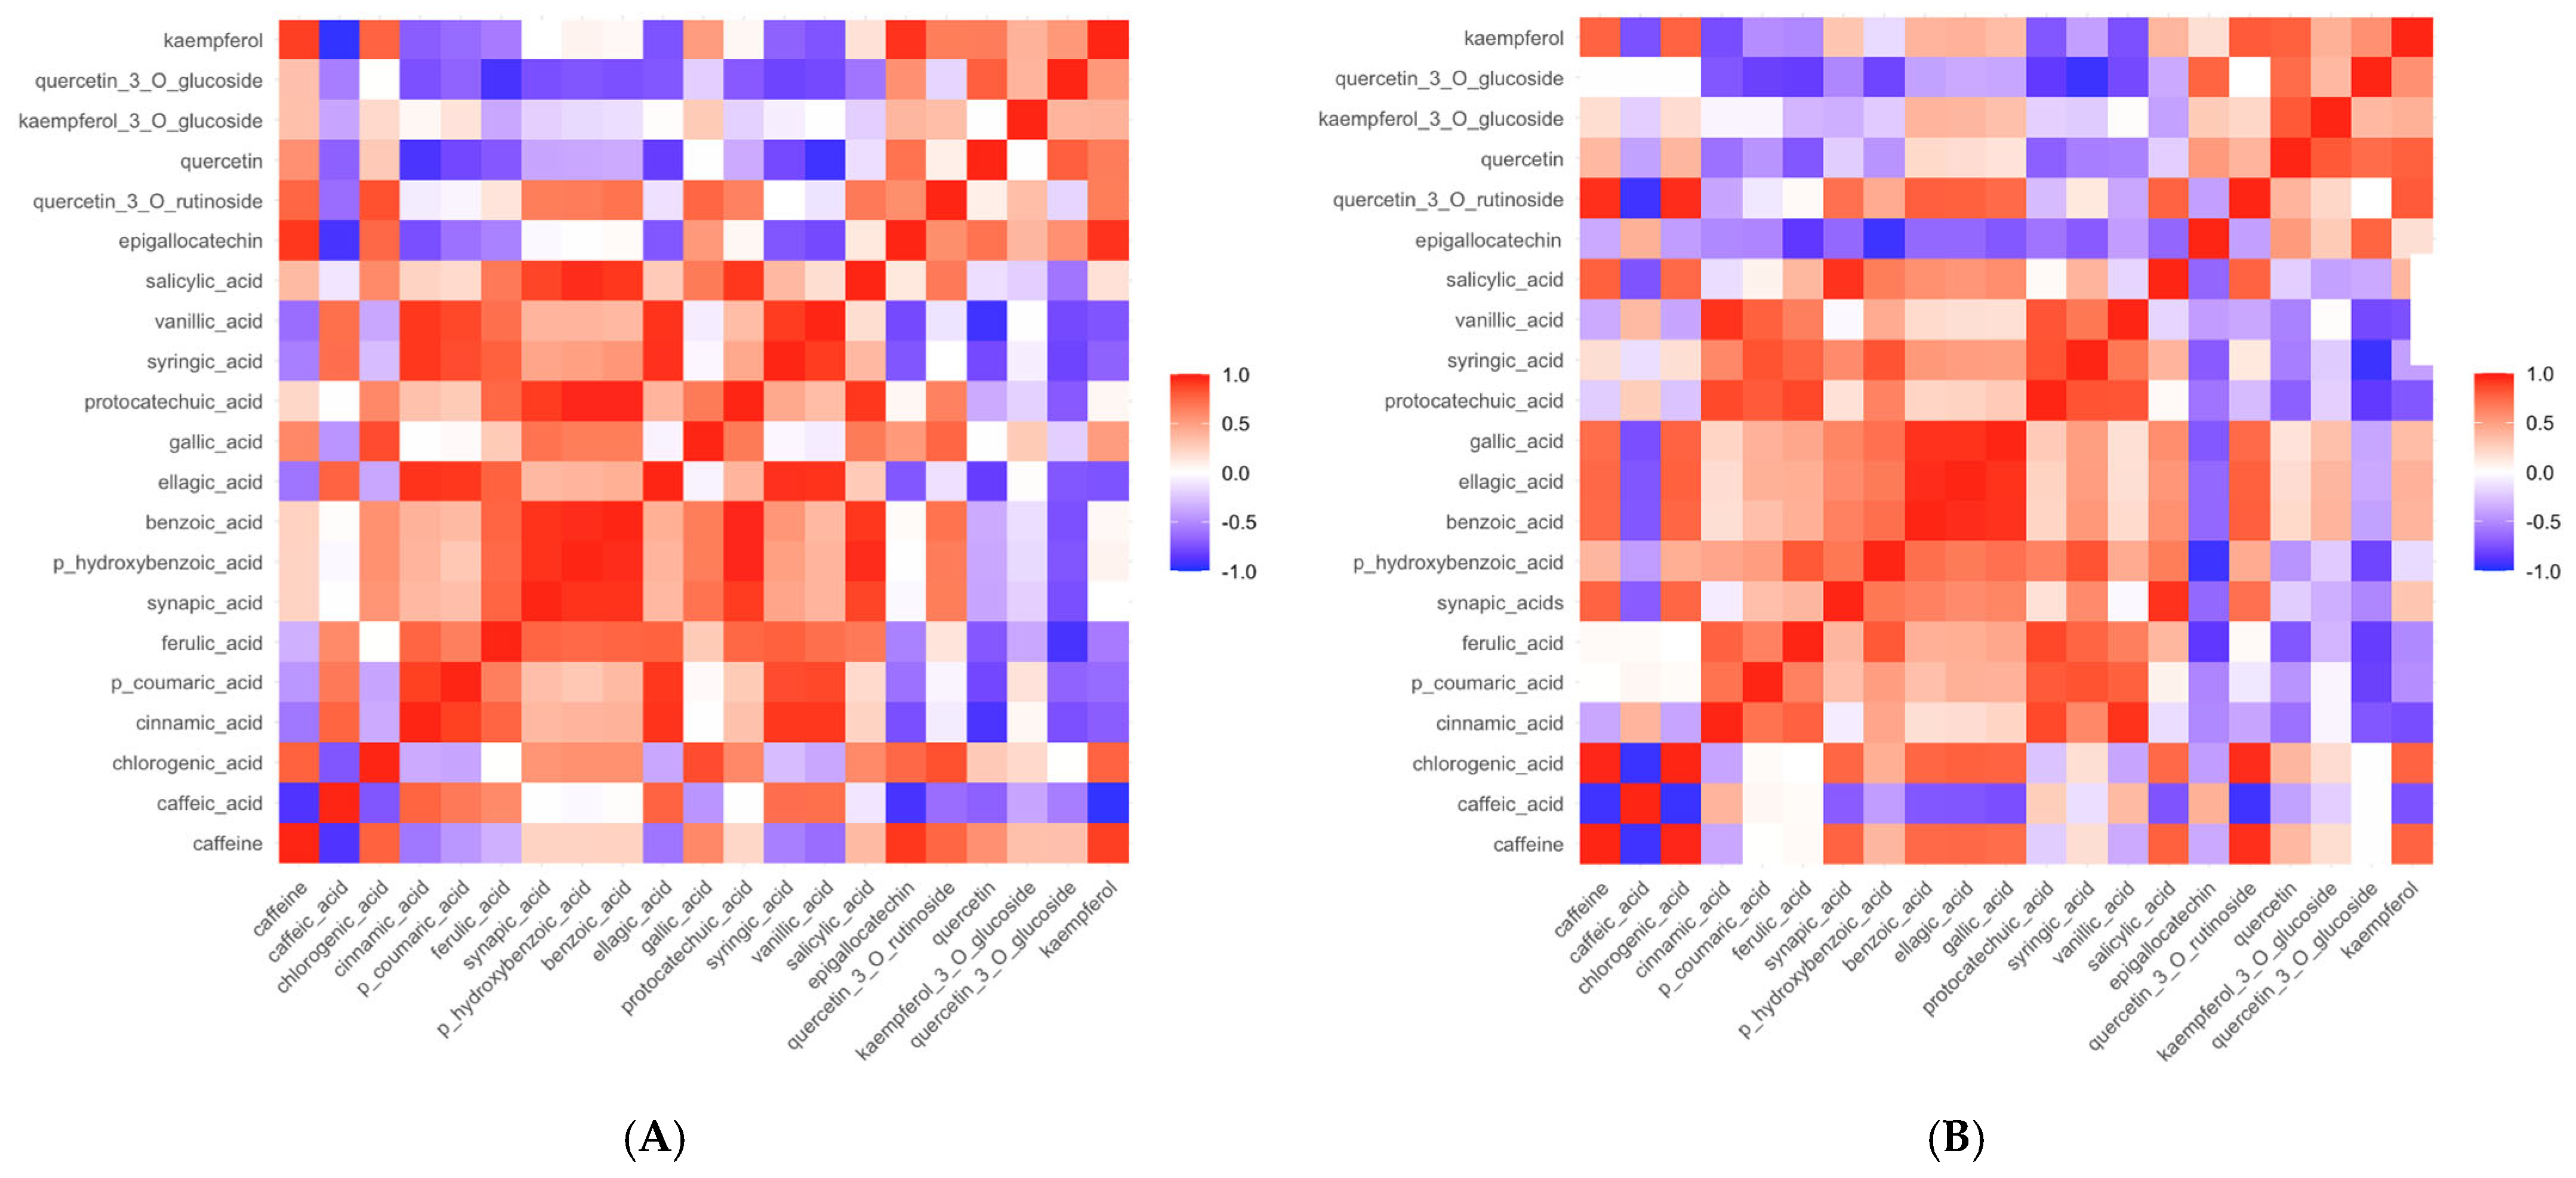
A 21-variable heat map was applied to visualize Spearman’s correlations between individual chemical compounds in coffee from two Ethiopian varieties—Jimma and Sidama—with red representing the high levels and blue representing the low levels (Figure 2).
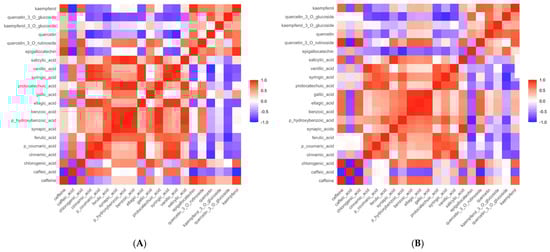
Figure 2.
Heat maps between caffeine and phenolic compounds in coffee beans from Jimma (A) and Sidama (B) varieties.
Analysis of the Spearman correlation matrices revealed significant differences and similarities in the relationships between individual chemical compounds in both coffee varieties. Positive correlations between free phenolic acids were observed in both cases, indicating common synthesis regulation. In the case of Sidama coffee, the sum of strong, positive correlations between these compounds was notably higher than that in Jimma coffee, which may suggest more intensive biosynthesis of these compounds in this variety. Cinnamic acid derivatives such as caffeic acid and ferulic acid exhibited positive correlations within the group, with a robust relationship observed between caffeic acid and ferulic acid. The sole exception was chlorogenic acid, negatively correlated with other cinnamic acid derivatives in both varieties.
Similar relationships were observed for the benzoic acid derivatives. Compounds such as gallic acid and protocatechuic acid exhibited positive correlations in Jimma and Sidama variety coffee beans, suggesting that their synthesis may be interdependent and subject to common metabolic regulation. This relationship is more pronounced in Sidama coffee beans, where a higher content of benzoic acid derivatives is associated with a higher caffeine content, which is not as evident in Jimma coffee beans.
It is worth noting that the observed positive correlations between free phenolic acids and between flavonoids may result from their biosynthetic pathways, which are based on the phenylpropanoid metabolic pathway [25]. The high agreement of these correlations in both varieties indicates the specific conservation of this mechanism within Coffea arabica. Still, the larger correlation name in the case of Sidama may be available with better-known mechanisms contained in this variety, e.g., through the expression of genes of key enzymes such as PAL, C4H, or 4CL.
Caffeine demonstrated variable correlations with other compounds depending on the variety. In the case of cinnamic acid derivatives, this correlation was negative in both varieties, with the relationship being weaker in Jimma coffee. The stronger associations between benzoic acids and caffeine in Sidama may suggest that these groups of compounds co-occur and their biosynthesis may be co-regulated. It is possible that caffeine and some phenolic compounds share common metabolic precursors (e.g., S-adenosylmethionine), which may lead to their mutual synchronization at the metabolic or epigenetic level [26]. In Sidama coffee, caffeine exhibited a stronger negative correlation with flavonoids, such as quercetin 3-O-glucoside and epigallocatechin. Conversely, in Jimma coffee, caffeine positively correlated with kaempferol and epigallocatechin, suggesting that the synthesis of these flavonoids was linked to caffeine accumulation in this variety. The different correlations between caffeine and flavonoids depending on the cultivar indicate distinct mechanisms of metabolic regulation. In Sidama, the strong negative correlation may result from competition for common substrates in biosynthesis or from differences in the cellular localization of caffeine and flavonoid biosynthesis. The positive correlation with kaempferol in Jimma may suggest that caffeine accumulation does not inhibit, but instead promotes the synthesis of some flavonoids, perhaps through standard regulatory signals, e.g., oxidative stress or the presence of hormonal regulators such as abscisic acid.
An interesting phenomenon was the positive correlation between the flavonoids in both coffee varieties, which may indicate the co-dependent occurrence of these compounds. However, it is worth noting that in Jimma coffee, a negative correlation was observed between quercetin 3-O-glucoside and quercetin 3-O-rutinoside, suggesting that these two quercetin derivatives were synthesized via distinct biosynthetic pathways. The negative correlation between quercetin 3-O-rutinoside and epigallocatechin in Sidama coffee indicated potential antagonistic interactions between these compounds.
A strong negative correlation was observed between caffeic acid and flavonoids in both coffee varieties. The negative correlations between caffeic acid and flavonoids may reflect not only biosynthetic competition but also possible metabolic redistribution phenomena, in which the plant organism favors one metabolic pathway over another, depending on environmental conditions, grain maturation stage, or enzyme availability [27]. In Jimma coffee, the strongest negative correlation was observed between kaempferol and caffeic acid (r2 = −0.9562), whereas in Sidama coffee, the most significant negative relationship was observed between quercetin 3-O-rutinoside and caffeic acid (r2 = −0.9301). In Jimma coffee, multiple negative correlations were also found between flavonoids (except for quercetin 3-O-rutinoside) and free phenolic acids, suggesting the possibility of competitive metabolic pathways or functional antagonism. In Sidama coffee, benzoic acid, ellagic acid, gallic acid, and chlorogenic acid were positively correlated with flavonoids, which indicates synergistic co-occurrence of these compounds in this coffee variety.
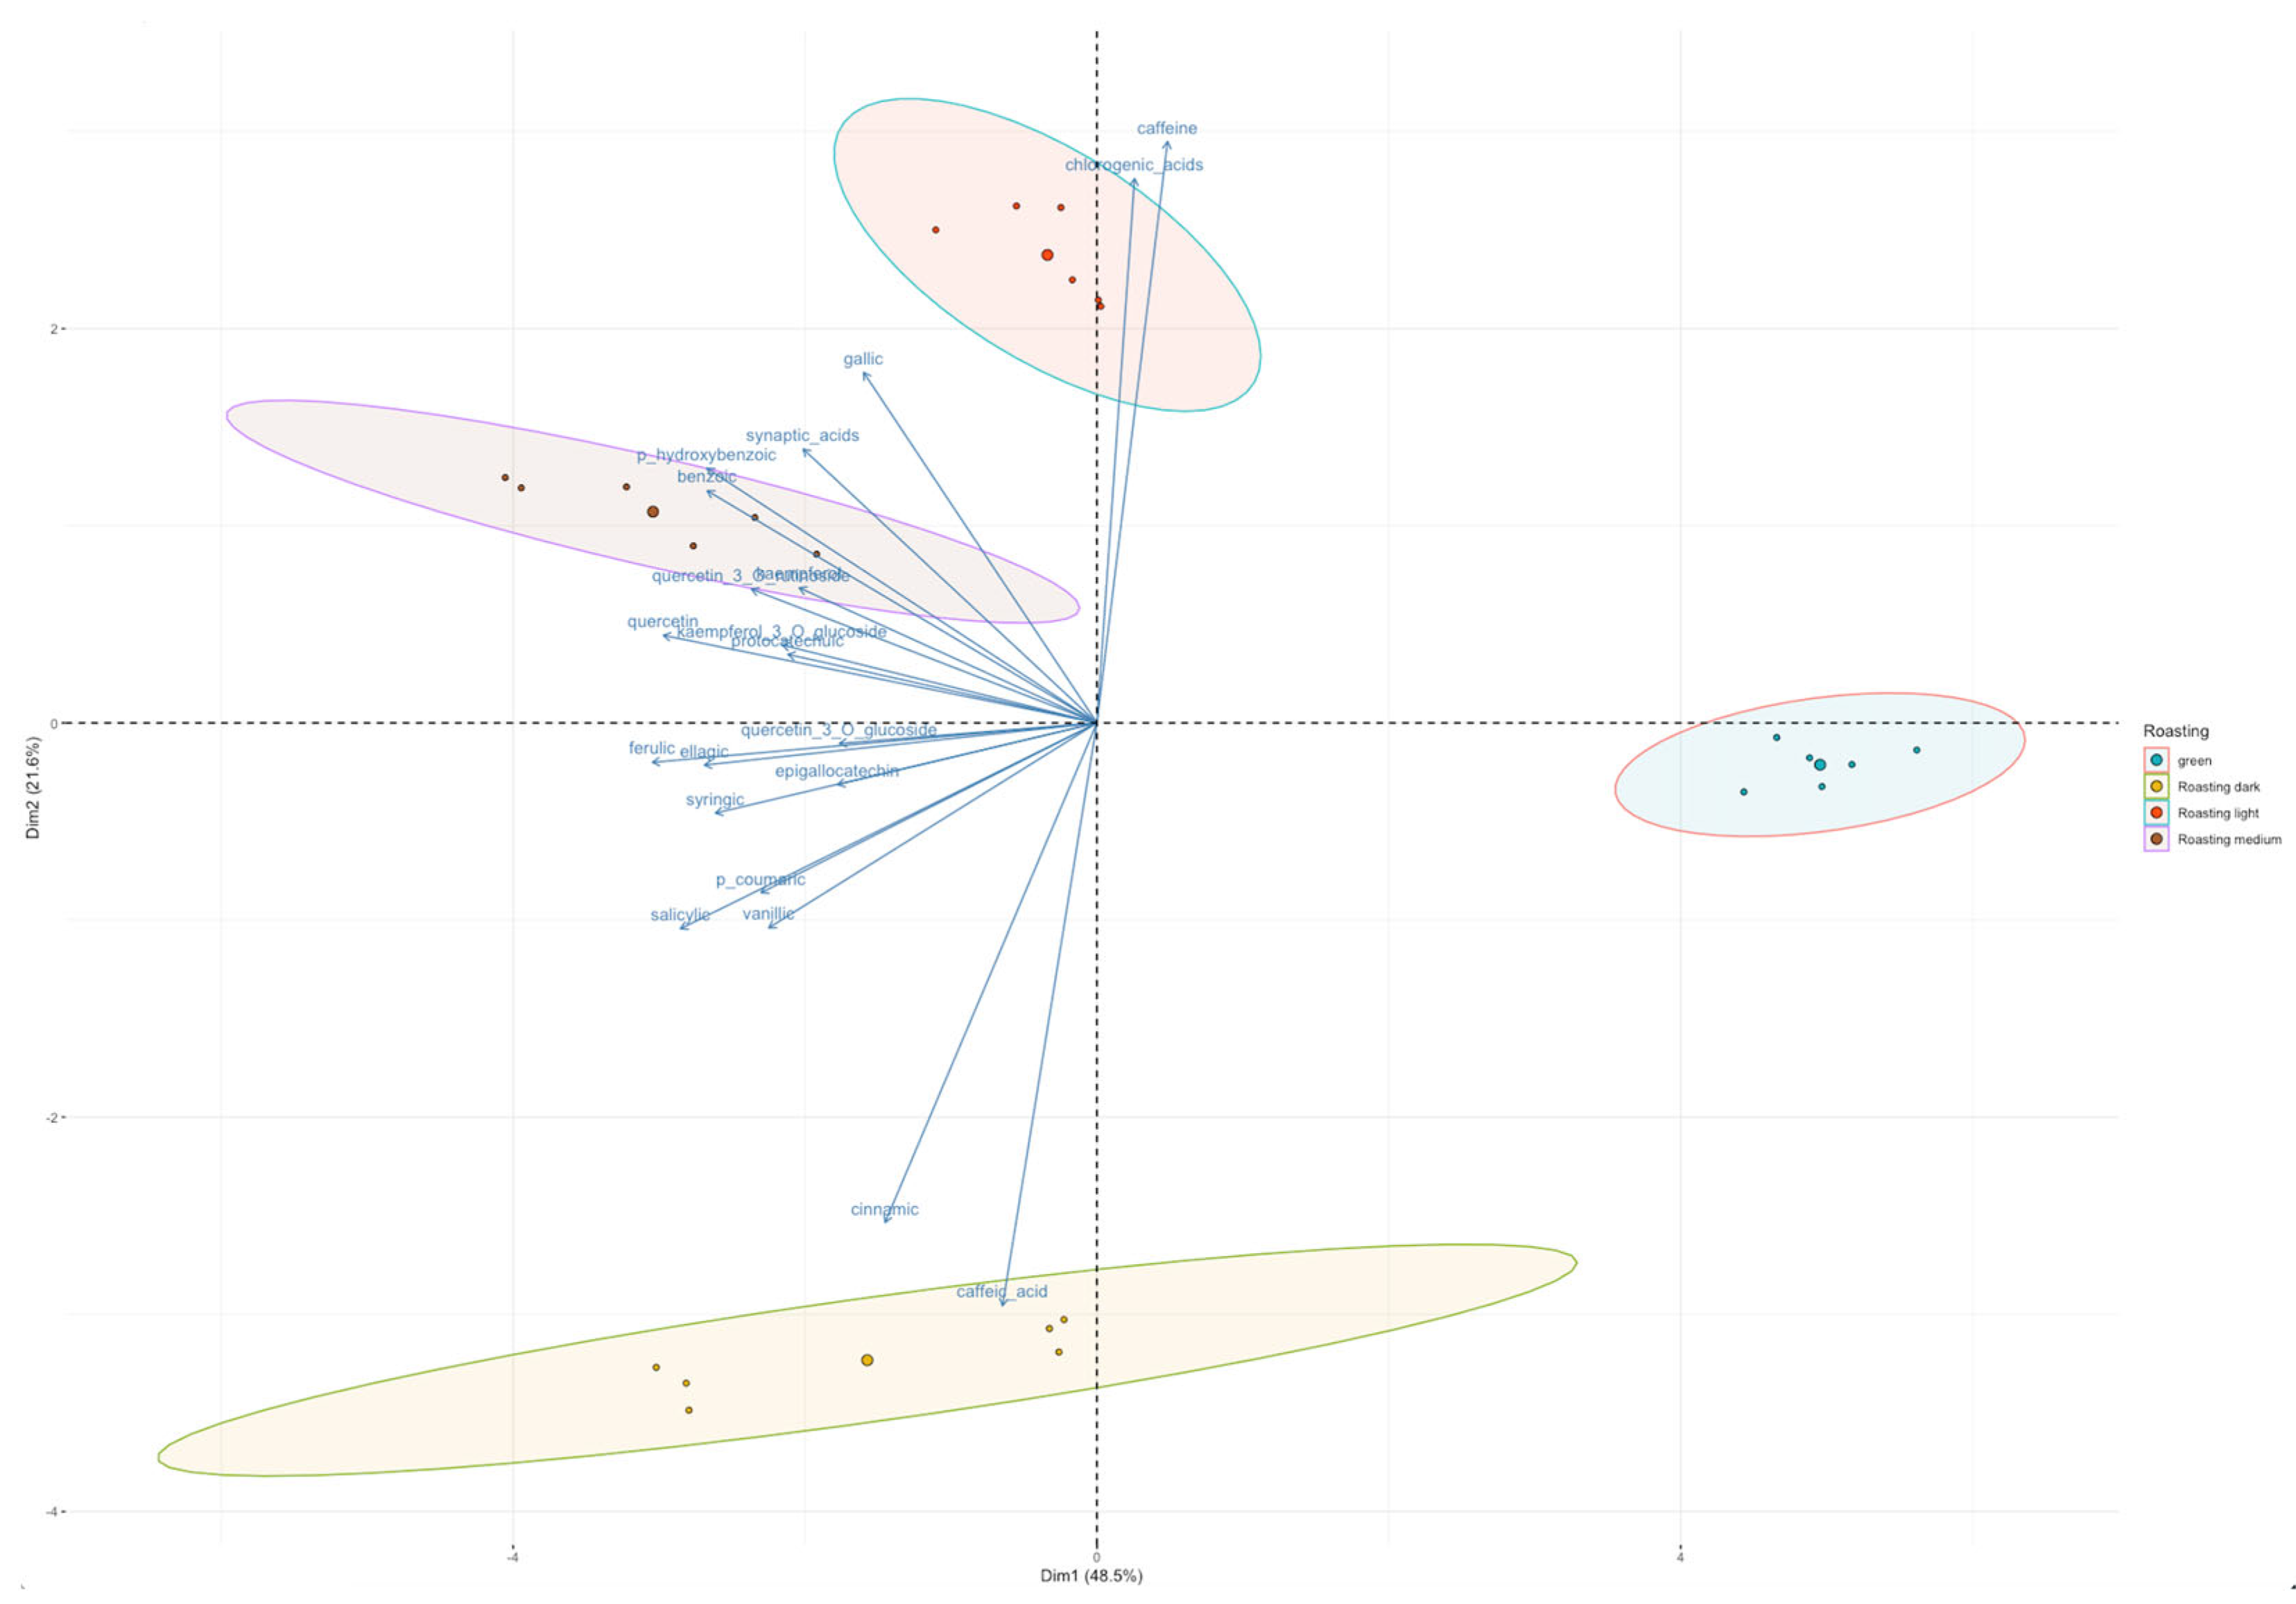
Principal component analysis (PCA) showed that the content of bioactive compounds, such as phenolic acids and flavonoids, is the primary variable determining the division of coffee samples according to the degree of roasting (Figure 3). The study did not consider the variety of beans, which allowed us to focus solely on the differences related to the roasting process. The PCA graph indicates that unroasted coffee samples (green beans) are separated from roasted samples, indicating a high significance of differences in the bioactive composition between these groups. Lightly, medium, and darkly roasted coffee samples are located on the left side of the graph, while unroasted coffee samples occupy the opposite side. The reduction in the content of phenolic compounds and flavonoids with the intensification of the roasting process is mainly due to their thermolability and degradation into Maillard reaction products and other aromatic compounds [19]. For example, chlorogenic acids, although the dominant phenolic compounds in green coffee, are particularly susceptible to degradation at high temperatures, forming caffeic and quinic acids [28]. The stability of caffeic acid suggests that it may originate from direct biosynthesis and the degradation of more complex esters, which is supported by literature data and the present results.
Figure 3.
Principal component analysis for caffeine and phenolic compounds of coffee beans under different roasting conditions. PC1 (48.5%) and PC2 (21.6%) explained variance. Ellipses represent a 95% confidence interval for each group.
Green coffee beans (unroasted) are rich in various bioactive compounds, such as chlorogenic, gallic, sinapic, p-coumaric, ferulic acids, and flavonoids such as quercetin and its derivatives. The high concentration of these compounds in green coffee is due to their stability at low temperatures and their natural presence in unprocessed beans [8]. Lightly roasted coffee samples contain the most chlorogenic acid and caffeine, although the roasting process reduces the content of heat-sensitive phenolic acids [29].
Moderately roasted coffee beans shift slightly further to the left on the PCA plot, reflecting a continued decrease in the content of phenolic compounds and flavonoids compared to lightly roasted samples. This decrease is accompanied by an increase in the formation of Maillard reaction products, which are produced during the more intense roasting process. Polyphenolic compounds polymerize and form complexes with proteins and sugars [30]. As a result, specific reactions occur during the roasting process, forming a wide range of new flavors and aroma compounds that contribute to the distinct sensory profile of moderately roasted coffee. However, the reduced levels of health-beneficial phenolic antioxidants in these samples suggest a potential trade-off between desired roast characteristics and the preservation of the coffee’s functional properties [31,32,33].
Dark roasted beans in the lower left part of the graph showed an apparent decrease in the content of most bioactive phenolic compounds and flavonoids. However, caffeic acid remained stable despite the intensive roasting process. These results confirm previous findings, where Hečimović et al. reported a significant reduction in total phenolic content and antioxidant capacity with increasing roasting intensity, especially in dark roasted coffee beans [30]. Similarly, Sacchetti found that chlorogenic acids, the leading group of phenolic compounds in coffee, decreased significantly during roasting, with losses of up to 95% in dark roasts. However, they also noted that some phenolic compounds, such as caffeic acid, showed relative stability, which confirms the present findings [34]. The stability of caffeic acid observed in this study was consistent with the studies of Duarte, who found that while most chlorogenic acids were degraded during roasting, caffeic acid levels remained relatively constant or even increased slightly [35]. This phenomenon was attributed to decomposing more significant phenolic compounds into simpler ones during the roasting process [14].
The accumulation of discriminants in the form of phenolic compounds in light and medium roasted coffee samples indicated that their content was the main factor differentiating samples depending on the degree of roasting. Therefore, changes in the content of bioactive compounds were considered a qualitative descriptor of coffee beans, reflecting the roasting process’s level and intensity.
3.2. Caffeine Content
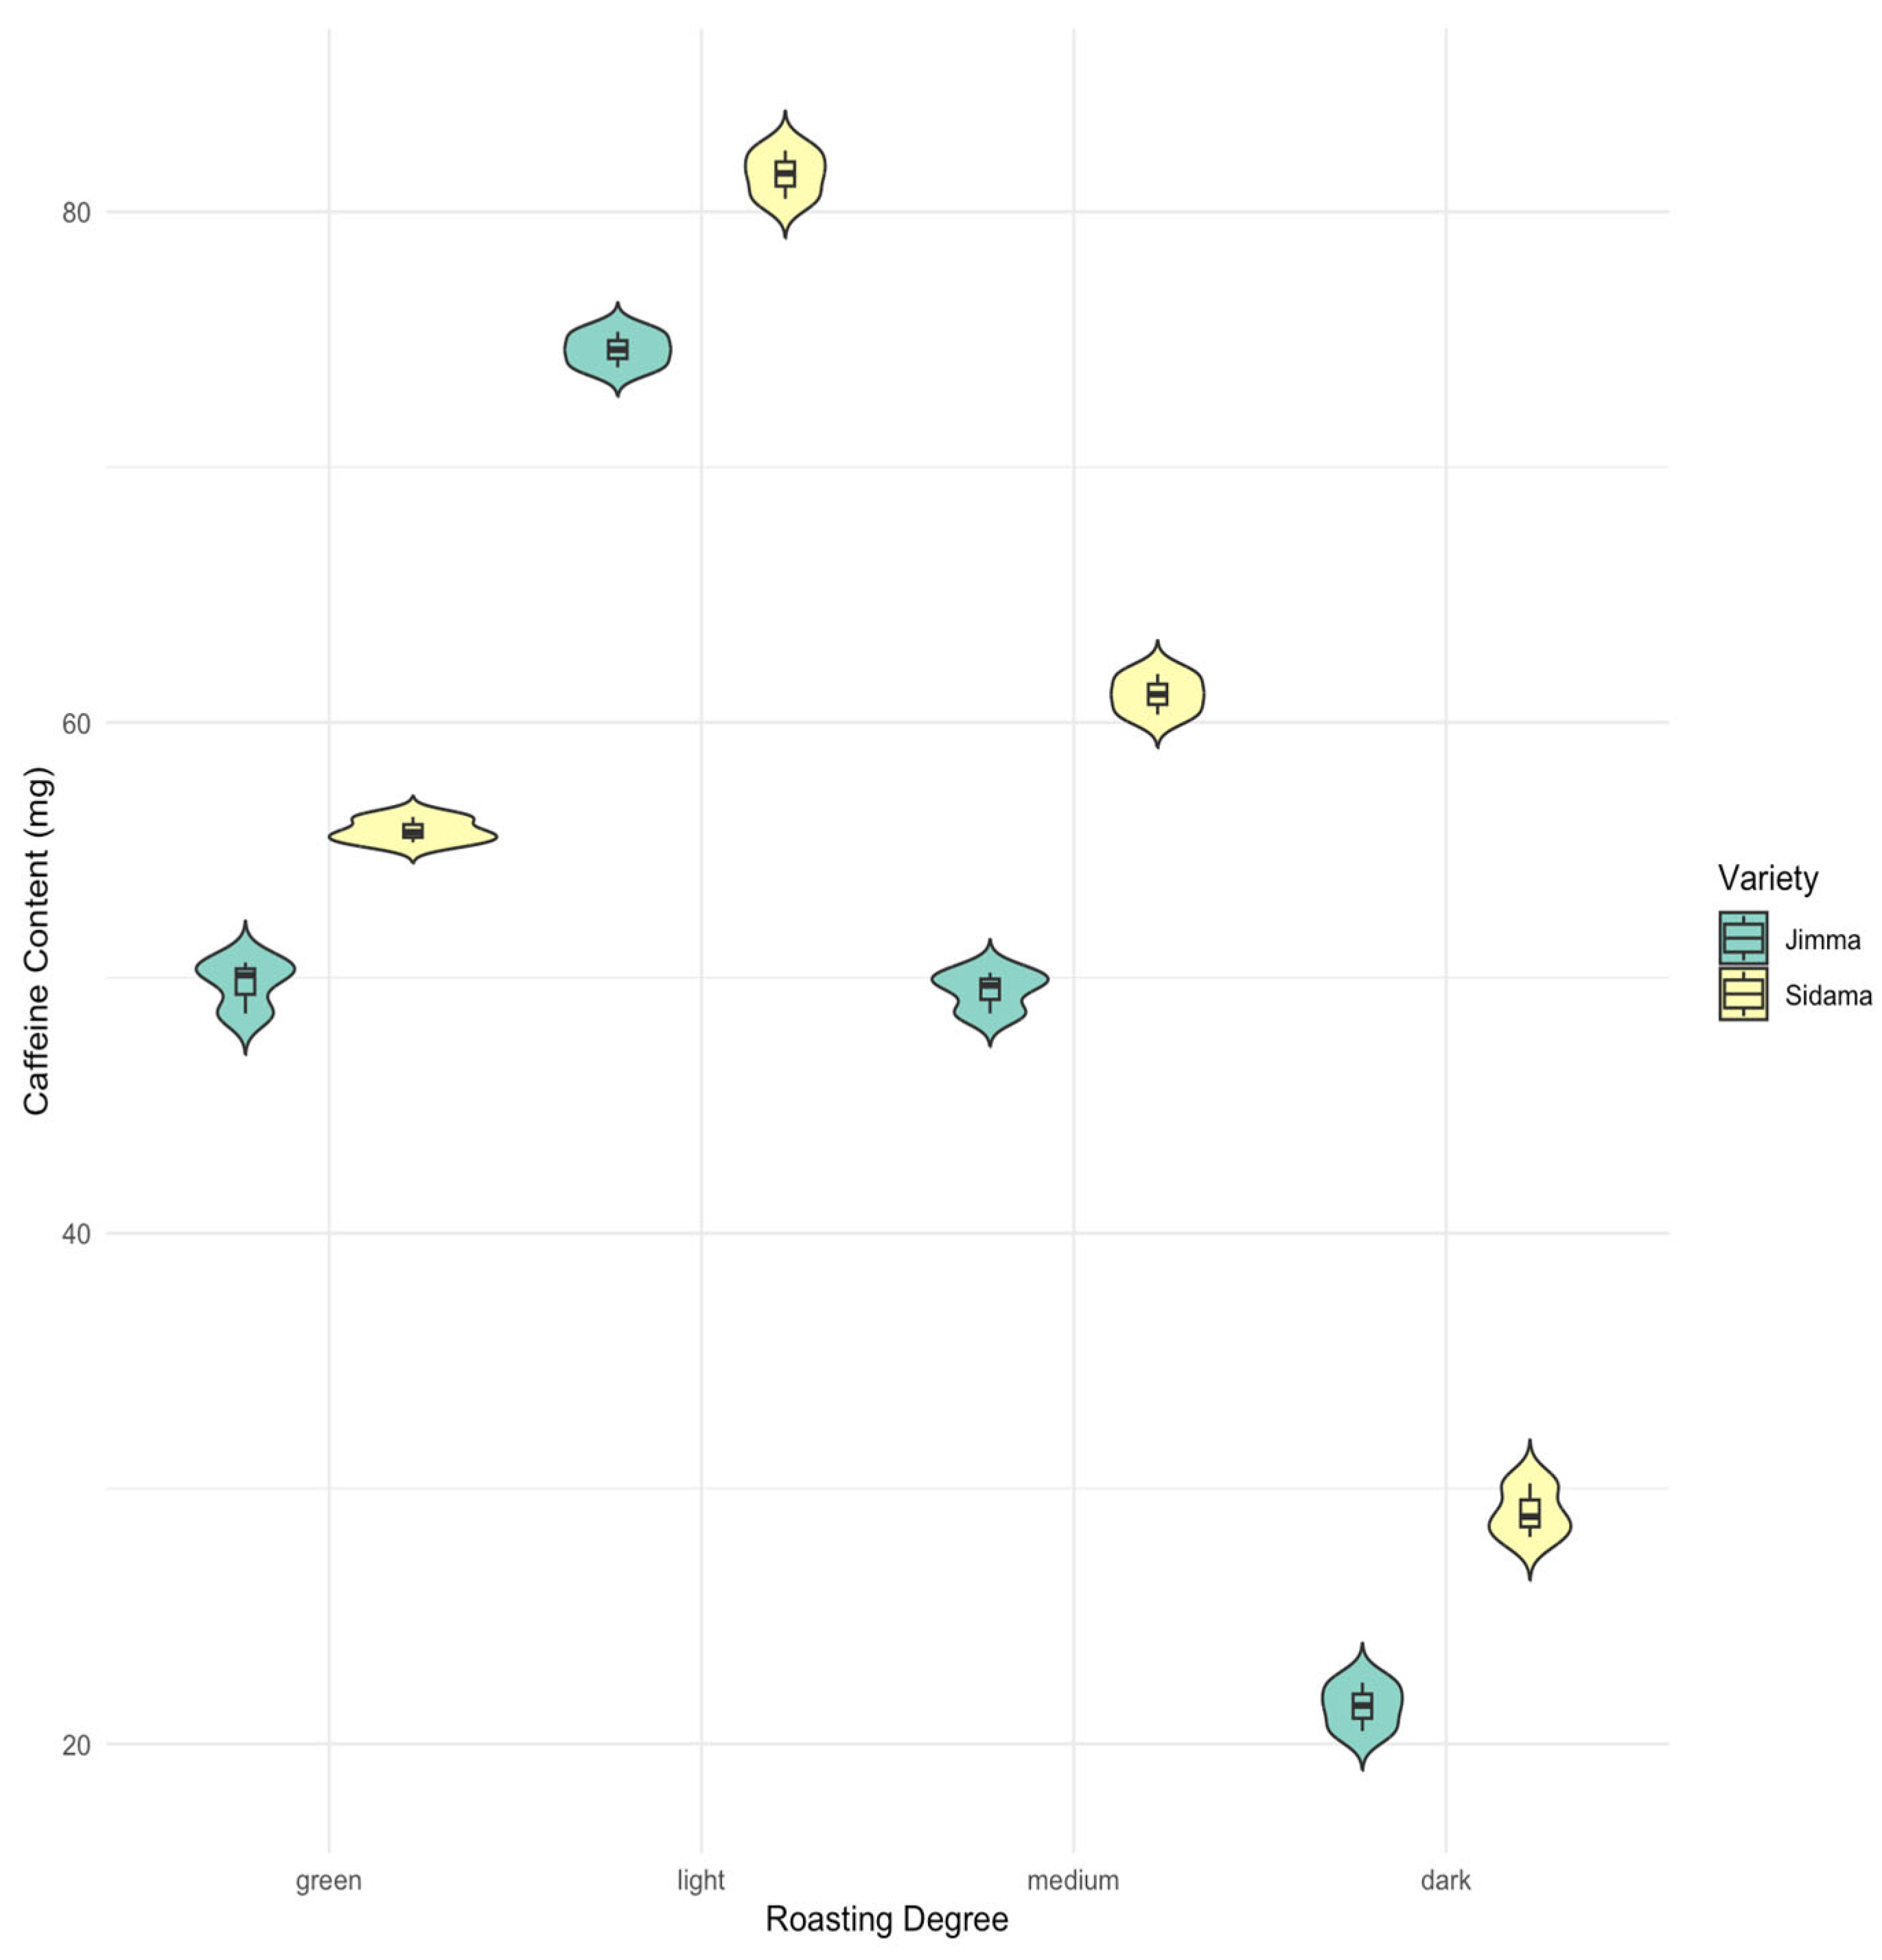
The analysis of variance results confirm that both coffee variety and roasting degree significantly affect the caffeine content in coffee beans, with a significant interaction also observed between these factors. The coffee beans of the Sidama variety were characterized by a higher caffeine content than those of the Jimma variety (Table 2). The 95% confidence interval for this difference ranged from 7.26 to 8.77 mg, and the p-value was reported to be under 0.0001, indicating extremely high statistical significance. This suggests that the Sidama coffee variety naturally contains a considerably higher caffeine concentration than the Jimma variety. This relates to genetic factors—genes involved in caffeine’s anabolism and catabolism. Other factors that affect caffeine levels include environmental factors such as shade levels and altitude [36].
Table 2.
The coffee beans’ caffeine content (mg/100 g of coffee extract) from the Jimma and Sidama regions depends on the roasting degree.
The ANOVA results revealed a highly significant effect of roasting degree (F = 3695.08; p < 0.001). Lighter roasted coffee samples exhibited the highest caffeine content. In contrast, dark roasted samples had the lowest caffeine content, with a 52.77 mg caffeine/100 g coffee extract difference between light and dark roasted coffee (p < 0.001).
Post hoc analysis using Tukey’s test revealed statistically significant differences between all roast levels. In particular, green coffee’s caffeine content was significantly lower than light roast coffee, which had the highest caffeine content. Specifically, compared to green coffee, light roast coffee had significantly higher caffeine content. In contrast, medium and dark roast coffees showed lower caffeine levels, except for medium roast Sidama coffee, which had 61.1 mg caffeine/100 g coffee extract. The highest caffeine content was found in light roast samples, while the lowest was in dark roast coffees. The highest caffeine content was found in light roast samples. Unroasted coffee samples, representing green coffee, served as a reference point, and the roasting process at each level affected the caffeine content, causing significant changes. The statistically significant interaction between coffee variety and roasting degree (F = 12.13; p < 0.001) suggests that the changes in caffeine content caused by different roasting levels depend on the variety.
The post hoc test results showed that the differences between the individual roasting degrees in both varieties were statistically significant, with the most considerable differences between the Sidama and Jimma varieties observed in the case of light and medium roasted coffee. Both light and medium roasted Sidama coffee had significantly higher caffeine content than Jimma (Figure 4), suggesting that Sidama may be less susceptible to caffeine reduction during roasting. It is worth noting that for Jimma bean samples, the difference in caffeine content between the medium roasted and unroasted samples was statistically insignificant, suggesting that roasting had no significant impact on the caffeine content. However, studies conducted by Mengesha et al. [37] did not reveal statistically significant differences between the caffeine concentration in coffee samples from the Jimma and Sidama regions. This suggests a considerable diversity of coffee varieties originating from this region of Ethiopia.
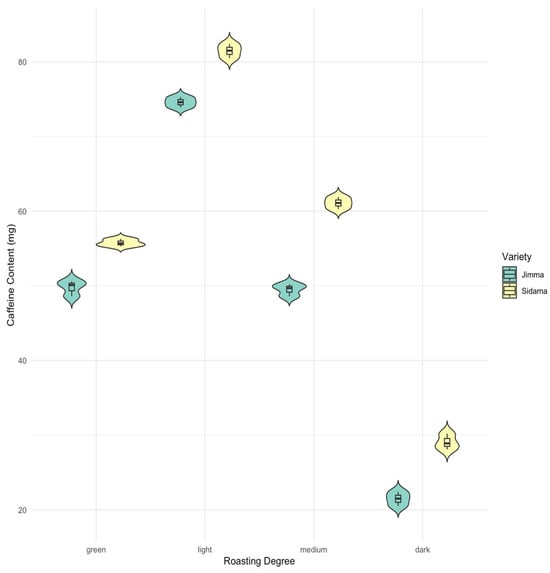
Figure 4.
Relationship between caffeine concentration and the degree of roasting and coffee variety.
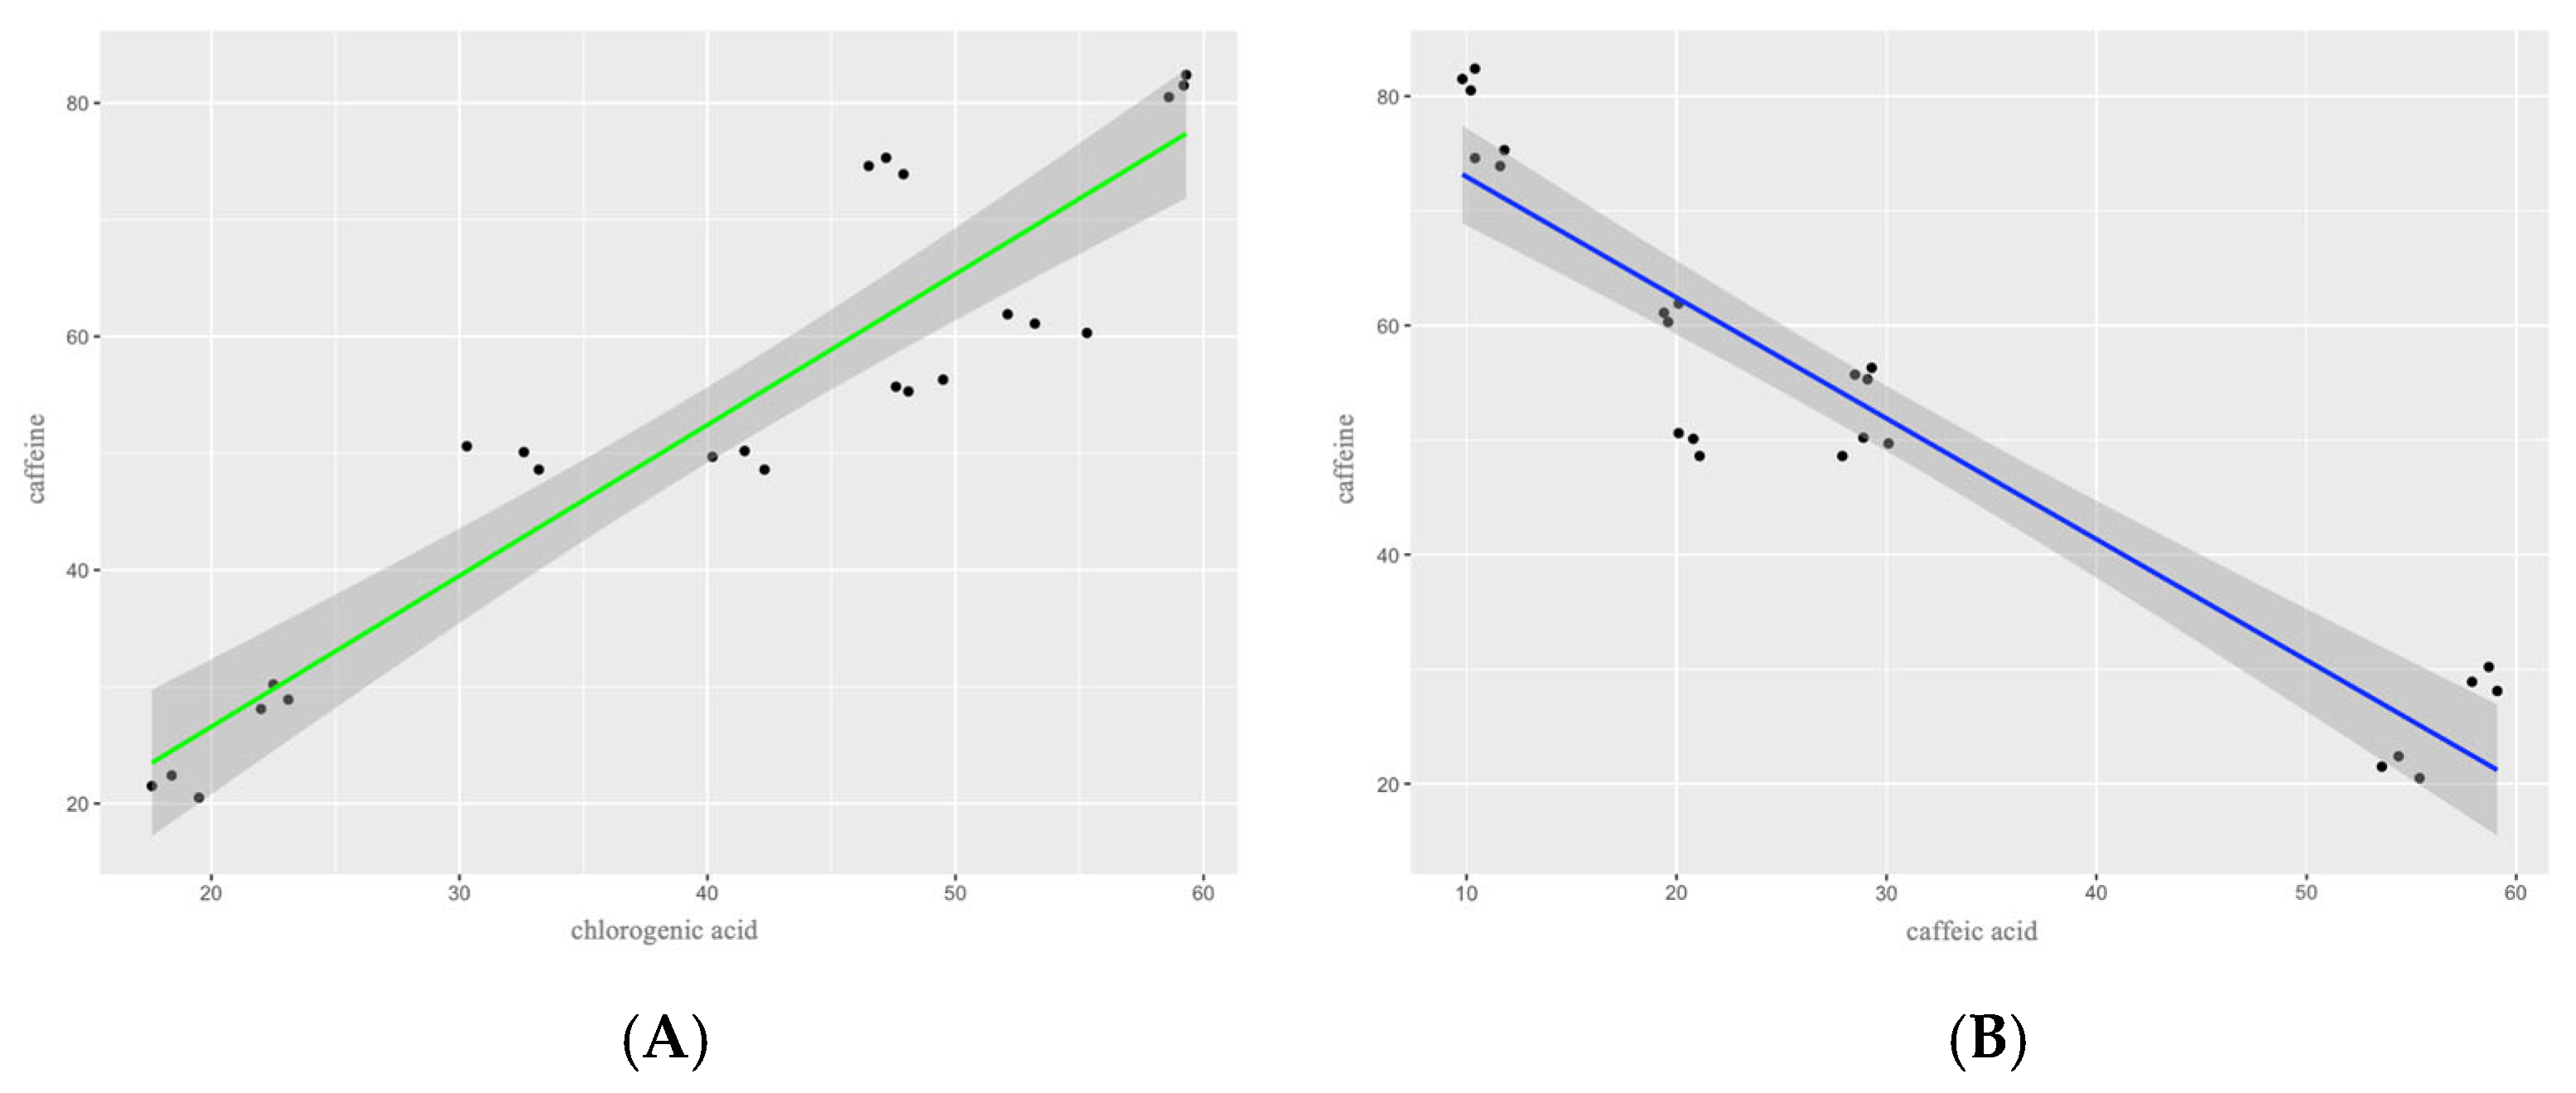
The analysis revealed a positive correlation between caffeine and chlorogenic acid in coffee samples subjected to different roasting degrees (Figure 5). These compounds have a similar oxidative mechanism during the roasting process—their highest concentrations are observed in samples subjected to light roasting. At the same time, the lowest values occur in dark-roasted samples. The high statistical significance of this correlation indicates the stability of this relation [38]. In contrast to the above positive association, the relationship between caffeine and caffeic acid exhibits a clear negative correlation. As the content of caffeic acid increases, there is a systematic decrease in caffeine concentration. This inverse trend is particularly evident in dark roasted coffee samples, where high caffeic acid content (54.47–58.57 mg/g) coincides with the lowest concentration of caffeine (54.47–58.57 mg/100 g coffee extract) (21.47–29.07 mg/g). Conversely, the opposite pattern is observed in lightly roasted samples, where a low concentration of caffeic acid corresponds to a high caffeine concentration. More excellent thermal resistance for caffeine than for phenolic compounds was demonstrated by Mehaya et al. [39]. However, the correlations between caffeine, chlorogenic acid, and caffeic acid were negative.
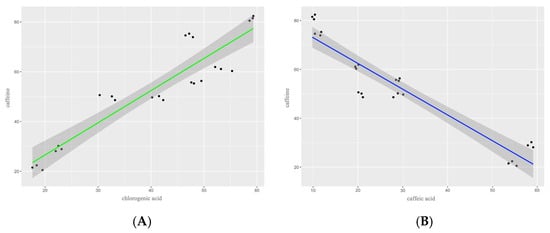
Figure 5.
Caffeine/chlorogenic acid (A) and caffeine/caffeic acid (B) correlation in coffee beans at different roasting degrees.
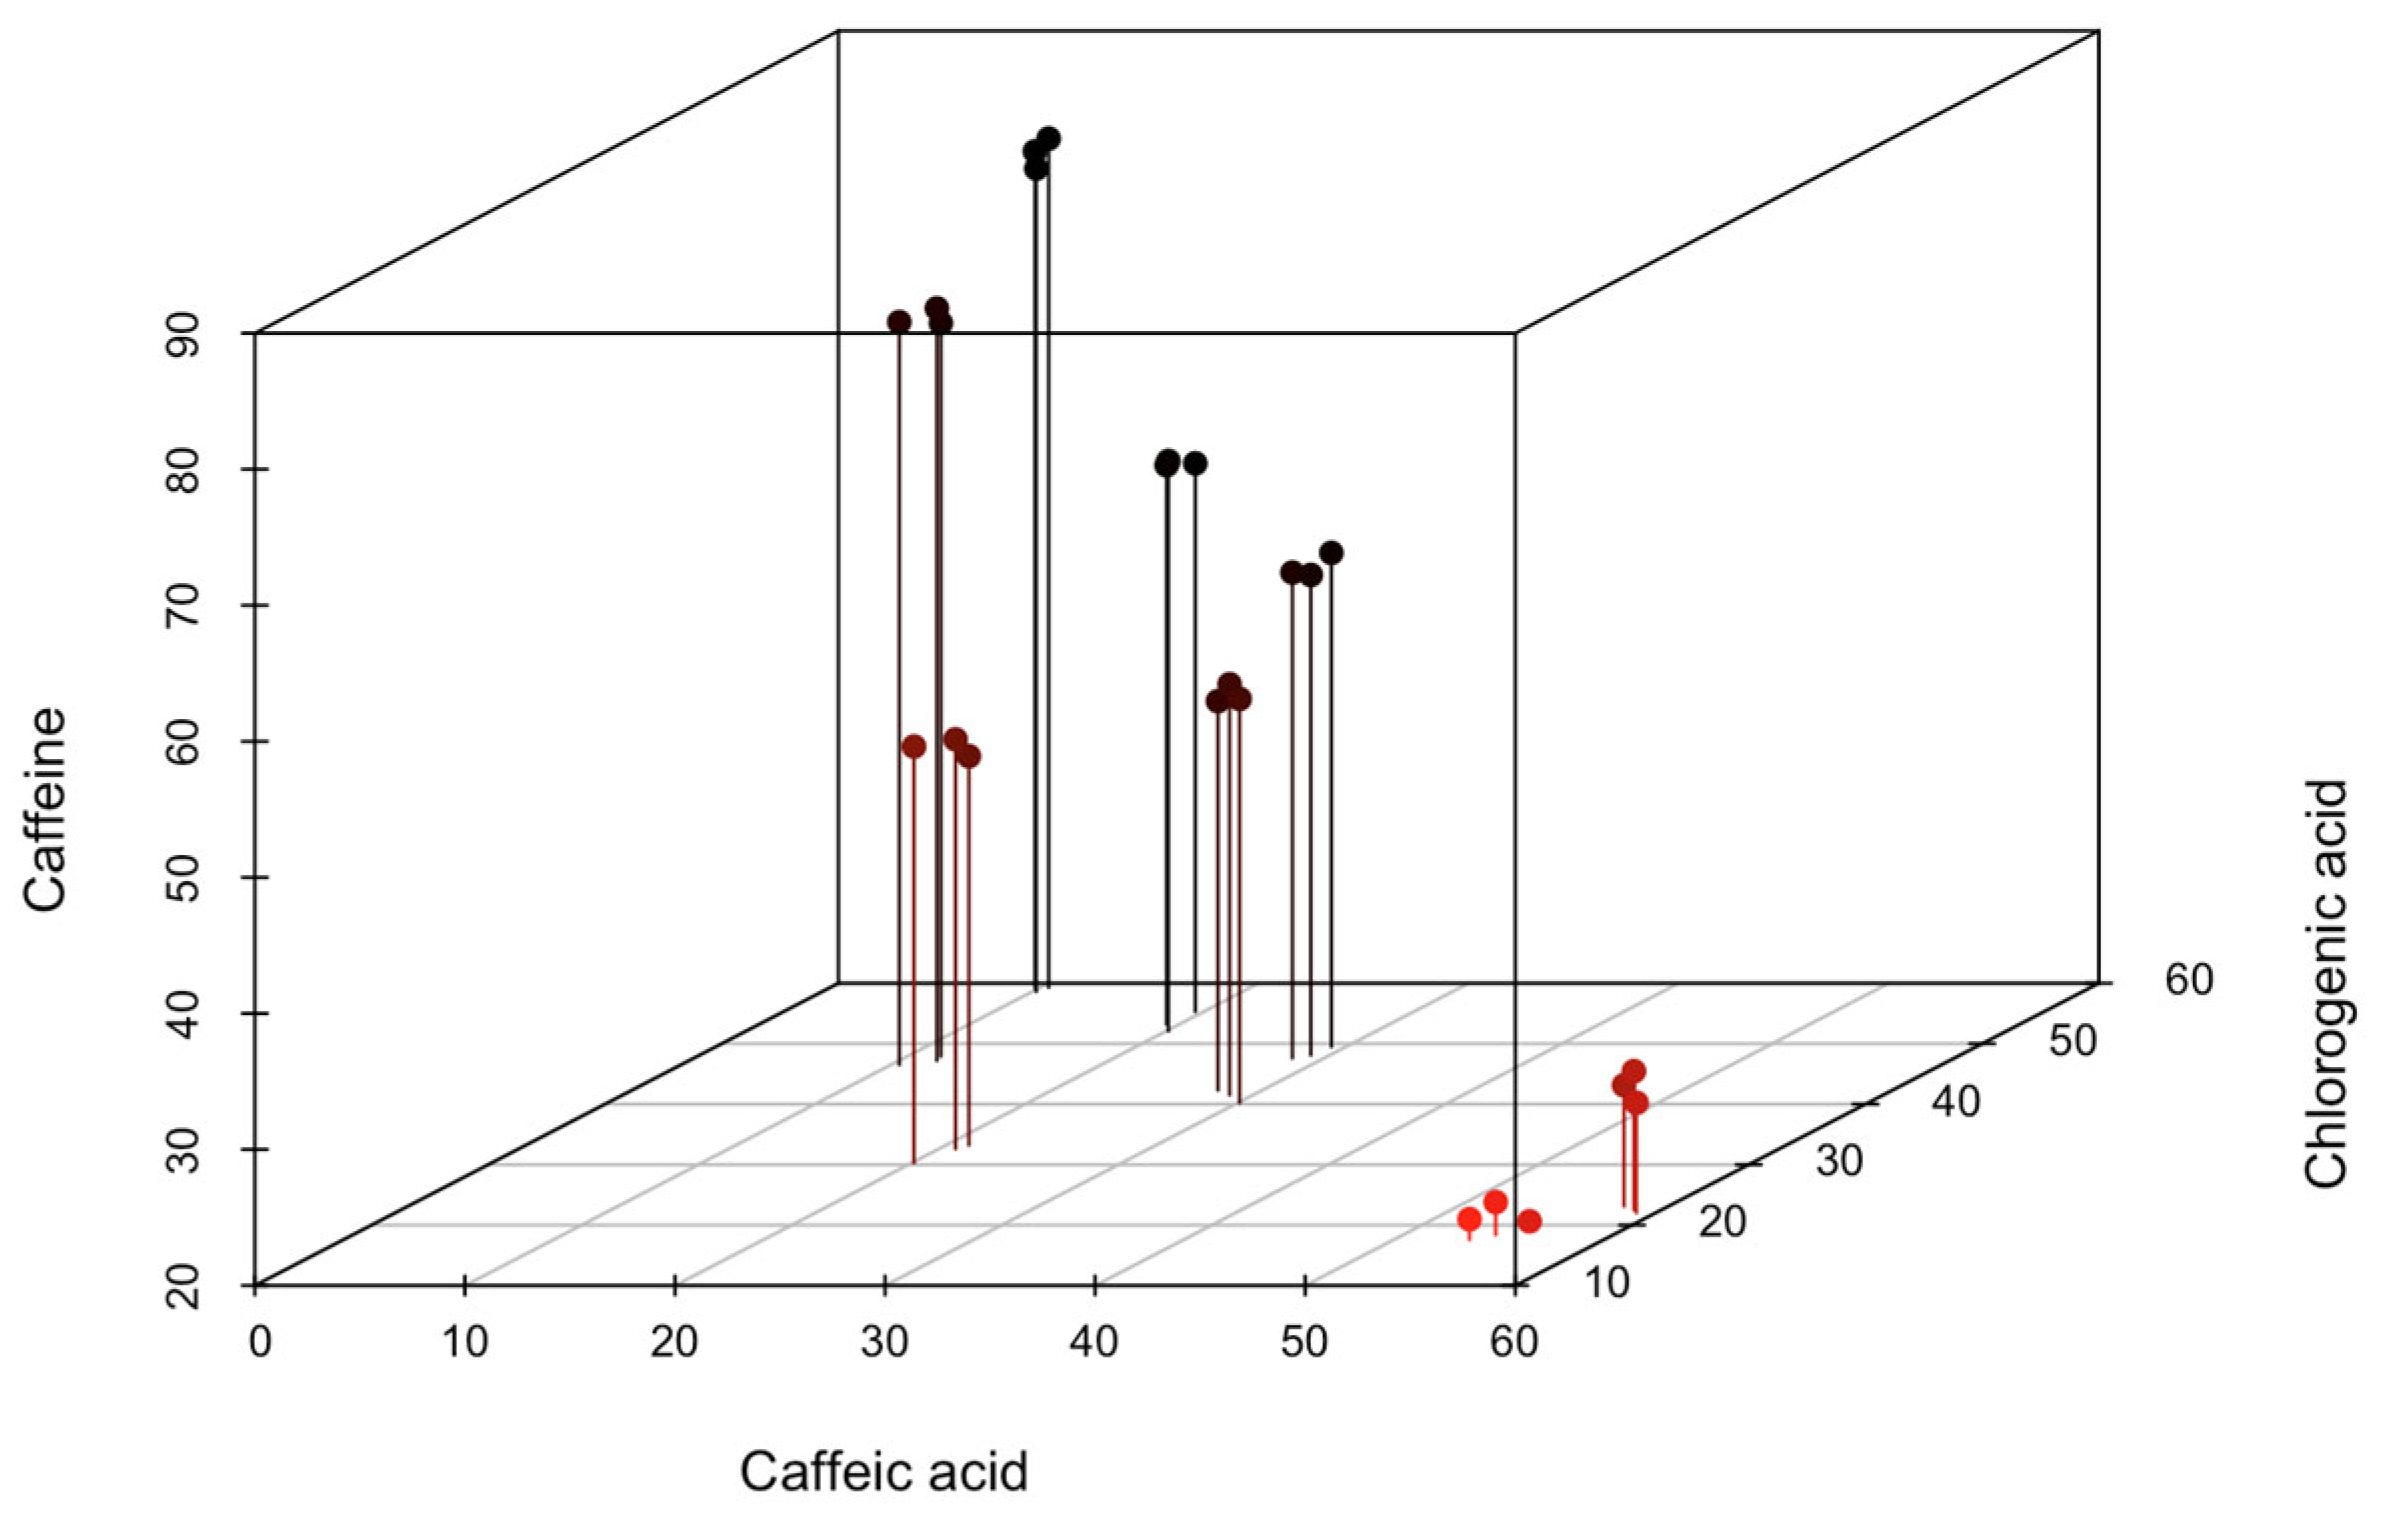
A three-dimensional scatter plot represented the relationship between caffeine, chlorogenic acid, and caffeic acid (Figure 6). Samples subjected to light roasting clustered in the region had high caffeine and chlorogenic acid content but low caffeic acid content. Conversely, dark roasted samples occupied the opposite position in the plot space. Samples of green and medium roasted coffee beans were located in intermediate positions, indicating the gradual nature of the observed changes in the chemical profile during the roasting process. The determined mutual relationships between the studied bioactive compounds suggest that the coffee roasting process leads to systematic changes in its chemical composition, where the degradation of some compounds is closely linked to the formation of others, implying that the thermal stability of phenolic acids differs significantly during roasting. While chlorogenic acid content generally decreases with roasting, other phenolic acids may increase or remain stable. These changes affect the overall antioxidant properties and potential health benefits of coffee. Understanding these relationships is crucial for optimizing the roasting process to obtain the desired chemical profile of the final product, ensuring the desired taste and functional food characteristics [40,41].
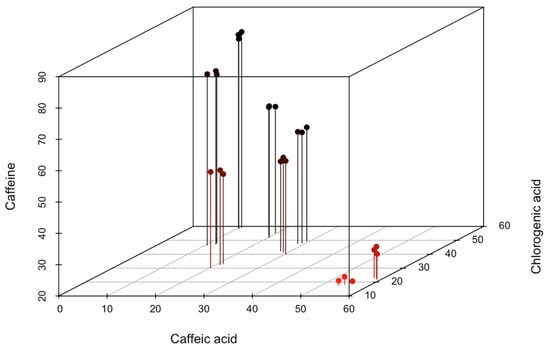
Figure 6.
Dependence of caffeine content on caffeic and chlorogenic acids in coffee beans at different roasting degrees.
4. Conclusions
This study elucidated the effects of coffee roasting on the content of bioactive compounds in coffee beans from two Ethiopian regions. These findings demonstrate that coffee variety is a critical determinant of the profiles of these bioactive compounds, underscoring the inherent diversity in the chemical composition of coffee beans from different geographical origins.
The degree of roasting was found to significantly impact the content of these bioactive compounds, with light roasting preserving higher concentrations than medium and dark roasting. This emphasizes optimizing the roasting process to maintain the desired levels of beneficial compounds in the final coffee product. The observed positive correlation between caffeine and chlorogenic acid and the negative correlation between caffeine and caffeic acid suggests that the thermal stability of these compounds varies during roasting. This indicates a complex interplay between different classes of polyphenolic compounds and their transformations under the influence of heat.
A noteworthy phenomenon was the positive correlation between flavonoids in both coffee varieties, which may indicate the co-dependent occurrence of these compounds and shared regulatory mechanisms. Similarly, the positive correlations between free phenolic acids, such as caffeic and ferulic acids, suggest common pathways of synthesis and accumulation during the roasting process.
The findings of this study have significant implications for optimizing coffee roasting to enhance the functional and sensory properties of the final product. By elucidating the intricate relationships between bioactive compounds and their response to roasting, coffee producers and researchers can develop strategies to maximize the desirable qualities of coffee, ensuring that consumers can benefit from a beverage that is not only palatable but also rich in beneficial compounds. Further investigation into the underlying biochemical and genetic mechanisms governing the composition of coffee beans will undoubtedly contribute to the advancement of the coffee industry and elucidation of the potential health benefits of coffee.
Author Contributions
Conceptualization, K.R.-S. and A.P.-B.; Methodology, K.R.-S., A.P.-B. and K.S.-S.; Validation, A.P.-B.; Formal analysis, K.R.-S., A.P.-B. and L.S.-M.; Investigation, A.P.-B.; Resources, K.R.-S. and M.B.; Data curation, K.R.-S. and M.B.; Writing—original draft, K.R.-S., A.P.-B., M.B. and L.S.-M.; Writing—review & editing, K.S.-S.; Visualization, K.R.-S.; Supervision, K.R.-S., A.P.-B. and M.B.; Project administration, L.S.-M. and T.S. All authors have read and agreed to the published version of the manuscript.
Funding
This research received no external funding.
Data Availability Statement
The original contributions presented in this study are included in the article. Further inquiries can be directed to the corresponding author(s).
Conflicts of Interest
The authors declare no conflict of interest.
References
- Wang, Y.; Ho, C.T. Polyphenolic Chemistry of Tea and Coffee: A Century of Progress. J. Agric. Food Chem. 2009, 57, 8109–8114. [Google Scholar] [CrossRef] [PubMed]
- Bolka, M.; Emire, S. Effects of coffee roasting technologies on cup quality and bioactive compounds of specialty coffee beans. Food Sci. Nutr. 2020, 8, 6120–6130. [Google Scholar] [CrossRef]
- Rostagno, M.A.; Celeghini, R.M.S.; Debien, I.C.N.; Nogueira, G.C.; Meireles, M.A.A. Phenolic Compounds in Coffee Compared to Other Beverages. In Coffee in Health and Disease Prevention; Elsevier: Amsterdam, The Netherlands, 2015; pp. 137–142. [Google Scholar]
- Nuhu, A.A. Bioactive Micronutrients in Coffee: Recent Analytical Approaches for Characterization and Quantification. ISRN Nutr. 2014, 2014, 384230. [Google Scholar] [CrossRef] [PubMed]
- Hu, G.; Peng, X.; Gao, Y.; Huang, Y.; Li, X.; Su, H.; Qiu, M. Effect of roasting degree of coffee beans on sensory evaluation: Research from the perspective of major chemical ingredients. Food Chem. 2020, 331, 127329. [Google Scholar] [CrossRef]
- Franca, A.S.; Oliveira, L.S.; Oliveira, R.C.S.; Agresti, P.C.M.; Augusti, R. A preliminary evaluation of the effect of processing temperature on coffee roasting degree assessment. J. Food Eng. 2009, 92, 345–352. [Google Scholar] [CrossRef]
- Wang, X.; Lim, L.T. Physicochemical Characteristics of Roasted Coffee. In Coffee in Health and Disease Prevention; Elsevier: Amsterdam, The Netherlands, 2015; pp. 247–254. [Google Scholar]
- Farah, A.; Donangelo, C.M. Phenolic compounds in coffee. Braz. J. Plant Physiol. 2006, 18, 23–36. [Google Scholar] [CrossRef]
- Opitz, S.; Smrke, S.; Goodman, B.; Keller, M.; Schenker, S.; Yeretzian, C. Antioxidant Generation during Coffee Roasting: A Comparison and Interpretation from Three Complementary Assays. Foods 2014, 3, 586–604. [Google Scholar] [CrossRef]
- Mestanza, M.; Mori-Culqui, P.L.; Chavez, S.G. Changes of polyphenols and antioxidants of arabica coffee varieties during roasting. Front. Nutr. 2023, 10, 1078701. [Google Scholar] [CrossRef]
- Frankowski, J.; Przybylska-Balcerek, A.; Graczyk, M.; Niedziela, G.; Sieracka, D.; Stuper-Szablewska, K. The Effect of Mineral Fertilization on the Content of Bioactive Compounds in Hemp Seeds and Oil. Molecules 2023, 28, 4870. [Google Scholar] [CrossRef]
- PN-ISO 10095:1997; Coffee—Determination of Caffeine Content: A Method Using High-Performance Liquid Chromatography. ISO: Geneva, Switzerland, 1997.
- Dąbrowska-Molenda, M.; Szwedziak, K.; Zabłudowska, Ż. Analysis of caffeine content in selected types of coffee. Postępy Tech. Przetwórstwa Spożywczego 2019, 2, 69–71. [Google Scholar]
- Vignoli, J.A.; Viegas, M.C.; Bassoli, D.G.; Benassi Mde, T. Roasting process affects differently the bioactive compounds and the antioxidant activity of arabica and robusta coffees. Food Res. Int. 2014, 61, 279–285. [Google Scholar] [CrossRef]
- Ameca, G.M.; Cerrilla, M.E.O.; Córdoba, P.Z.; Cruz, A.D.; Hernández, M.S.; Haro, J.H. Chemical composition and antioxidant capacity of coffee pulp. Ciência Agrotecnologia 2018, 42, 307–313. [Google Scholar] [CrossRef]
- Farah, A. Coffee Constituents. In Coffee; Wiley: Hoboken, NJ, USA, 2012; pp. 21–58. [Google Scholar]
- Moreira, A.S.P.; Nunes, F.M.; Simões, C.; Maciel, E.; Domingues, P.; Domingues, M.R.M.; Coimbra, M.A. Data on coffee composition and mass spectrometry analysis of mixtures of coffee related carbohydrates, phenolic compounds and peptides. Data Brief. 2017, 13, 145–161. [Google Scholar] [CrossRef]
- Erskine, E.; Gültekin Subaşı, B.; Vahapoglu, B.; Capanoglu, E. Coffee Phenolics and Their Interaction with Other Food Phenolics: Antagonistic and Synergistic Effects. ACS Omega 2022, 7, 1595–1601. [Google Scholar] [CrossRef] [PubMed]
- Wu, H.; Lu, P.; Liu, Z.; Sharifi-Rad, J.; Suleria, H.A.R. Impact of roasting on the phenolic and volatile compounds in coffee beans. Food Sci. Nutr. 2022, 10, 2408–2425. [Google Scholar] [CrossRef]
- Saud, S.; Salamatullah, A.M. Relationship between the Chemical Composition and the Biological Functions of Coffee. Molecules 2021, 26, 7634. [Google Scholar] [CrossRef] [PubMed]
- Jeszka-Skowron, M.; Frankowski, R.; Zgoła-Grześkowiak, A. Comparison of methylxantines, trigonelline, nicotinic acid and nicotinamide contents in brews of green and processed Arabica and Robusta coffee beans—Influence of steaming, decaffeination and roasting processes on coffee beans. LWT 2020, 125, 109344. [Google Scholar] [CrossRef]
- Haile, M.; Bae, H.M.; Kang, W.H. Comparison of the Antioxidant Activities and Volatile Compounds of Coffee Beans Obtained Using Digestive Bio-Processing (Elephant Dung Coffee) and Commonly Known Processing Methods. Antioxidants 2020, 9, 408. [Google Scholar] [CrossRef]
- Wang, X.; Peng, X.; Lu, J.; Hu, G.; Qiu, M. Ent-kaurane diterpenoids from the cherries of Coffea arabica. Fitoterapia 2019, 132, 7–11. [Google Scholar] [CrossRef]
- Gunning, Y.; Defernez, M.; Watson, A.D.; Beadman, N.; Colquhoun, I.J.; Le Gall, G.; Philo, M.; Garwood, H.; Williamson, D.; Davis, A.P.; et al. 16-O-methylcafestol is present in ground roast Arabica coffees: Implications for authenticity testing. Food Chem. 2018, 248, 52–60. [Google Scholar] [CrossRef]
- Winkel-Shirley, B. Flavonoid Biosynthesis. A Colorful Model for Genetics, Biochemistry, Cell Biology, and Biotechnology. Plant Physiol. 2001, 126, 485–493. [Google Scholar] [CrossRef] [PubMed]
- Ashihara, H.; Crozier, A. Caffeine: A well known but little mentioned compound in plant science. Trends Plant Sci. 2001, 6, 407–413. [Google Scholar] [CrossRef]
- Dixon, R.A. The ins and outs of plant specialized metabolite gene organization. Proc. Natl. Acad. Sci. USA 2025, 122, e2504934122. [Google Scholar] [CrossRef]
- Oussou, K.F.; Buyukkurt, O.K.; Guclu, G.; Kelebek, H.; Selli, S. Chlorogenic acids in different coffees. In Coffee in Health and Disease Prevention; Elsevier: Amsterdam, The Netherlands, 2025; pp. 239–252. [Google Scholar]
- Tarigan, E.B.; Wardiana, E.; Hilmi, Y.S.; Komarudin, N.A. The changes in chemical properties of coffee during roasting: A review. IOP Conf. Ser. Earth Environ. Sci. 2022, 974, 012115. [Google Scholar] [CrossRef]
- Hečimović, I.; Belščak-Cvitanović, A.; Horžić, D.; Komes, D. Comparative study of polyphenols and caffeine in different coffee varieties affected by the degree of roasting. Food Chem. 2011, 129, 991–1000. [Google Scholar] [CrossRef]
- Liu, Y.; Kitts, D.D. Confirmation that the Maillard reaction is the principle contributor to the antioxidant capacity of coffee brews. Food Res. Int. 2011, 44, 2418–2424. [Google Scholar] [CrossRef]
- Wang, Y.; Tang Ho, C. Effects of Naturally Occurring Phenolic Compounds in Coffee on the Formation of Maillard Aromas. In Nutrition, Functional and Sensory Properties of Foods; The Royal Society of Chemistry: London, UK, 2013; pp. 98–110. [Google Scholar]
- van der Werf, R.; Marcic, C.; Khalil, A.; Sigrist, S.; Marchioni, E. ABTS radical scavenging capacity in green and roasted coffee extracts. LWT Food Sci. Technol. 2014, 58, 77–85. [Google Scholar] [CrossRef]
- Sacchetti, G.; Di Mattia, C.; Pittia, P.; Mastrocola, D. Effect of roasting degree, equivalent thermal effect and coffee type on the radical scavenging activity of coffee brews and their phenolic fraction. J. Food Eng. 2009, 90, 74–80. [Google Scholar] [CrossRef]
- Duarte SMda, S.; Abreu CMPde Menezes HCde Santos MHdos Gouvêa, C.M.C.P. Effect of processing and roasting on the antioxidant activity of coffee brews. Ciência E Tecnol. Aliment. 2005, 25, 387–393. [Google Scholar] [CrossRef]
- Cheng, B.; Furtado, A.; Smyth, H.E.; Henry, R.J. Influence of genotype and environment on coffee quality. Trends Food Sci. Technol. 2016, 57, 20–30. [Google Scholar] [CrossRef]
- Mengesha, D.; Retta, N.; Woldemariam, H.W.; Getachew, P. Changes in biochemical composition of Ethiopian Coffee arabica with growing region and traditional roasting. Front. Nutr. 2024, 11, 1390515. [Google Scholar] [CrossRef] [PubMed]
- Oestreich-Janzen, S. Chemistry of Coffee. In Comprehensive Natural Products II; Elsevier: Amsterdam, The Netherlands, 2010; pp. 1085–1117. [Google Scholar]
- Mehaya, F.M.; Mohammad, A.A. Thermostability of bioactive compounds during roasting process of coffee beans. Heliyon 2020, 6, e05508. [Google Scholar] [CrossRef] [PubMed]
- Somporn, C.; Kamtuo, A.; Theerakulpisut, P.; Siriamornpun, S. Effects of roasting degree on radical scavenging activity, phenolics and volatile compounds of Arabica coffee beans (Coffea arabica L. cv. Catimor). Int. J. Food Sci. Technol. 2011, 46, 2287–2296. [Google Scholar] [CrossRef]
- Ferraz, M.B.; Farah, A.; Iamanaka, B.T.; Perrone, D.; Copetti, M.V.; Marques, V.X.; Vitali, A.A.; Taniwaki, M.H. Kinetics of ochratoxin A destruction during coffee roasting. Food Control 2010, 21, 872–877. [Google Scholar] [CrossRef]

Disclaimer/Publisher’s Note: The statements, opinions and data contained in all publications are solely those of the individual author(s) and contributor(s) and not of MDPI and/or the editor(s). MDPI and/or the editor(s) disclaim responsibility for any injury to people or property resulting from any ideas, methods, instructions or products referred to in the content. |
© 2025 by the authors. Licensee MDPI, Basel, Switzerland. This article is an open access article distributed under the terms and conditions of the Creative Commons Attribution (CC BY) license (https://creativecommons.org/licenses/by/4.0/).