Abstract
Organoclays have been used in drug adsorption processes due being cheap and environmentally friendly materials with a good cost benefit for the water treatment industry. The present work evaluated the adsorption of chlorhexidine, an antimicrobial agent, on the organophilic clay Cloisite 30B by using a 23 fractional factorial design. The main and interactive factors studied were the initial chlorhexidine concentration (0.4 and 0.6 mmol/L), adsorbent mass (0.3 and 0.5 g), and contact time (1 and 6 h). The organophilic clay Cloisite 30B was characterized by XRD and FTIR. To evaluate the impact of pH on the adsorption process, a range from 1 to 13 was used, in increments of one pH unit. The chlorhexidine adsorption parameters used the following adsorption conditions: an initial pH of 6, 200 rpm and a reaction temperature of 25 °C. Kinetic data followed the pseudo-second order model, while equilibrium data fit best to the Sips isotherm, suggesting high affinity and capacity. The maximum removal efficiency reached 95.77%, mainly influenced by the initial chlorhexidine concentration. These findings demonstrate the potential of organoclay for removing pharmaceutical contaminants from water pre-treatment of industrial effluents.
Keywords:
organoclays; Cloisite 30B; drug; chlorhexidine; factorial design; adsorption; kinetic; isotherms 1. Introduction
The intensification of industrial processes, coupled with accelerated population growth, has markedly increased the anthropogenic load of potentially toxic substances into aquatic ecosystems, jeopardizing water security and ecosystem services. This scenario is particularly concerning given the escalating water demand of the strategic sector, including the agribusiness, pharmaceutical, and food processing industries, which contribute directly or indirectly to the discharge of recalcitrant micropollutants into the environment. Among these, pharmaceuticals stand out due to their high usage rates, persistence, and bioactivity even at trace concentrations [1].
Pharmaceuticals are increasingly categorized as emerging contaminants (ECs) owing to their lipophilic character, low biodegradability, and potential for bioaccumulation and pseudo-persistence in environmental matrices. Environmental monitoring studies have reported concentrations of active pharmaceutical ingredients (APIs) ranging from ng/L to low µg/L in surface waters across urban and peri-urban regions [2]. These compounds typically enter aquatic environments via incomplete human or veterinary metabolism, hospital and domestic effluents, and the improper disposal of expired medications. Given that conventional wastewater treatment plants (WWTPs) were not engineered to address such contaminants, removal efficiencies for APIs such as chlorhexidine are often below 20–30% [3], amplifying ecological risks and complicating reuse strategies.
To mitigate these impacts, several advanced treatment technologies have been investigated, including advanced oxidation processes (AOPs), membrane separation, biological degradation, and chemical precipitation. While each approach presents distinct advantages, they are often constrained by high operational costs, complex infrastructure, high energy demands, or the generation of hazardous byproducts. In contrast, adsorption technologies have emerged as a cost-effective, scalable, and technically simple alternative, particularly suitable for decentralized or modular applications in resource-constrained settings [4,5,6].
Adsorption is governed by physical and/or chemical interactions between the adsorbate and the surface or pores of a solid-phase adsorbent. The efficacy of this process is influenced by multiple parameters, including the initial contaminant concentration, solution pH, adsorbent dosage, and temperature, as well as the surface area, porosity, and surface chemistry of the adsorbent [7]. Within this context, there is growing scientific and technological interest in the development of low-cost, high-performance adsorbents, particularly those derived from naturally abundant or waste-derived precursors, in alignment with circular economy principles [8].
Clays and their modified derivatives, including organo-functionalized montmorillonites, have attracted considerable attention as versatile adsorbent platforms due to their high cation exchange capacity, surface reactivity, and structural tunability. Among these, Cloisite 30B, a quaternary ammonium-modified montmorillonite, has shown promise in diverse sorption applications. One key advantage of organoclays over carbon-based materials is their lower cost.
However, despite its recognized organophilic character and intercalation capacity, its application for the removal of cationic pharmaceutical species such as chlorhexidine remains underexplored in the literature, particularly in terms of nonlinear kinetic and isotherm modeling under environmentally relevant conditions [9,10,11].
Therefore, this study aims to evaluate the performance of Cloisite 30B as a sustainable and efficient adsorbent for the removal of chlorhexidine in aqueous media. Its specific objectives include the following: (i) structural characterization of the organoclay before and after adsorption; (ii) investigation of the influence of pH and operational parameters on adsorption performance; and (iii) kinetic and equilibrium modeling using nonlinear approaches to elucidate the adsorption mechanism. By addressing these objectives, the work contributes to the strategic valorization of modified clays for pharmaceutical pollutant removal, supporting the development of advanced materials for wastewater treatment in line with environmental, economic, and regulatory imperatives [12,13].
This study explores the application of organoclay as a cost-effective and environmentally sustainable adsorbent for the removal of chlorhexidine from aqueous media under batch conditions. The investigation encompasses a comprehensive assessment of pH’s influence on adsorption efficiency, as well as detailed kinetic and equilibrium analyses. Adsorption kinetics were evaluated using nonlinear formulations of the pseudo-first order (PFO) and pseudo-second order (PSO) models, while equilibrium data were fitted to a suite of nonlinear isotherm models, including Langmuir, Freundlich, Sips, Temkin, and Redlich–Peterson. The findings underscore the viability of repurposing organoclay as a functional material for advanced wastewater treatment, with promising implications for the mitigation of pharmaceutical contaminants in aquatic environments.
2. Materials and Methods
2.1. Materials
The Cloisite 30B nanoclay, employed as the adsorbent in the experimental protocols, was procured from Southern Clay Products, headquartered in Gonzales, TX, USA. The active pharmaceutical compound utilized in the preparation of the synthetic effluent was chlorhexidine, sourced from a commercial supplier and applied in its as-received form, without undergoing further treatment or purification.
Table 1 presents the main physicochemical properties of the chlorhexidine (Sigma-Aldrich, St. Louis, MO, USA), used in this study.

Table 1.
Chlorhexidine drug properties.
2.2. Characterizations
X-ray Diffraction (XRD): The synthesized materials were characterized using a SHIMADZU XRD-6000 diffractometer (Kyoto, Japan), operating with a Cu Kα radiation source (λ = 1.5406 Å), under an accelerating voltage of 40 kV and a current of 30 mA. Diffraction patterns were acquired over a 2θ range of 3° to 50°, with a scanning rate of 2°/min and a step size of 0.02°, employing a continuous goniometric sweep for high-resolution phase identification.
Fourier Transform Infrared Spectroscopy (FTIR): FTIR analyses were conducted using a VERTEX 70 spectrophotometer (Bruker, Bremen, Germany), operating within the spectral range of 4000 to 500 cm−1. Sample pellets were prepared by homogenizing 0.0070 g of clay with 0.10 g of spectroscopic-grade KBr, followed by compression under a load of 5 tons for 30 s to form translucent disks suitable for infrared transmission measurements.
2.3. Influence of pH
To evaluate the impact of pH on the adsorption process, a series of flasks were prepared containing 0.5 g of organoclay and 50 mL of chlorhexidine solution at a concentration of 0.06 mmol/L. The pH of each solution was individually adjusted across a range from 1 to 13, in increments of one pH unit. The suspensions were subjected to agitation on a shaking table at 200 rpm for 1 h at a controlled temperature of 25 °C. Following this period, the mixtures were filtered, and the resulting filtrates were analyzed via UV-Vis spectrophotometry to determine the amount of chlorhexidine adsorbed per mmol of clay [14].
2.4. Adsorption Tests
The adsorption assays employed chlorhexidine as the target compound, so fixed-volume solutions (50 mL) were prepared within 125 mL Erlenmeyer flasks containing the organoclay Cloisite 30B as the adsorbent phase. The experimental conditions were defined according to a 23 factorial design, varying the following three independent variables: adsorbent mass (0.3 and 0.5 g), initial chlorhexidine concentration (0.4 and 0.6 mmol/L), and contact time (1 and 6 h). All tests were performed under constant agitation at 200 rpm using a shaking table, and maintained at a controlled temperature of 25 °C.
Post-Adsorption Analysis: Upon completion of the predetermined contact time, the samples were filtered to separate the solid phase, and the residual concentration of chlorhexidine in the supernatant was quantified via UV-Vis spectrophotometry. Based on the obtained absorbance data, the adsorption capacity (qeq) and removal efficiency (%Remo) were calculated using the following equations [15]:
where C0 (mmol/L) is the initial concentration of the drug, Cf (mmol/L) is the final concentration after the contact time, V (L) is the volume of the solution, and m (g) is the mass of the adsorbent.
The evaluation of the kinetic models was performed using statistical goodness-of-fit metrics, including the coefficient of determination (R2) and the adjusted R2, to ensure robust interpretation of model accuracy and predictive capability [16,17,18,19].
2.5. Kinetic Study
Kinetic adsorption experiments were conducted using 150 mL of chlorhexidine solution at a concentration of 0.05 mmol/L and 1.5 g of organoclay. The suspensions were agitated on a shaking table at 200 rpm and maintained at a constant temperature of 25 °C. The pH was not adjusted, remaining at the native value of the solution, as prior investigations demonstrated minimal influence of this parameter on the adsorption kinetics.
Aliquots were withdrawn at predetermined time intervals ranging from 0 to 30 min. All measurements were performed in duplicate, and the residual chlorhexidine concentration (Cf) was quantified via UV-Vis spectrophotometry.
2.6. Adsorption Isotherms
To construct the adsorption isotherm, chlorhexidine solutions with initial concentrations ranging from 0.004 to 2.0 mmol/L were prepared. For each experimental run, 150 mL of the respective solution was combined with 1.5 g of organoclay and subjected to agitation on a shaking table at 200 rpm for 60 min at a controlled temperature of 25 °C. The pH of the suspensions was maintained at a constant value, in accordance with prior findings indicating negligible impact on adsorption performance. Following the equilibration period, the mixtures were filtered, and the residual chlorhexidine concentrations were quantified via UV-Vis spectrophotometry.
3. Results
3.1. Characterization
3.1.1. X-Ray Diffraction
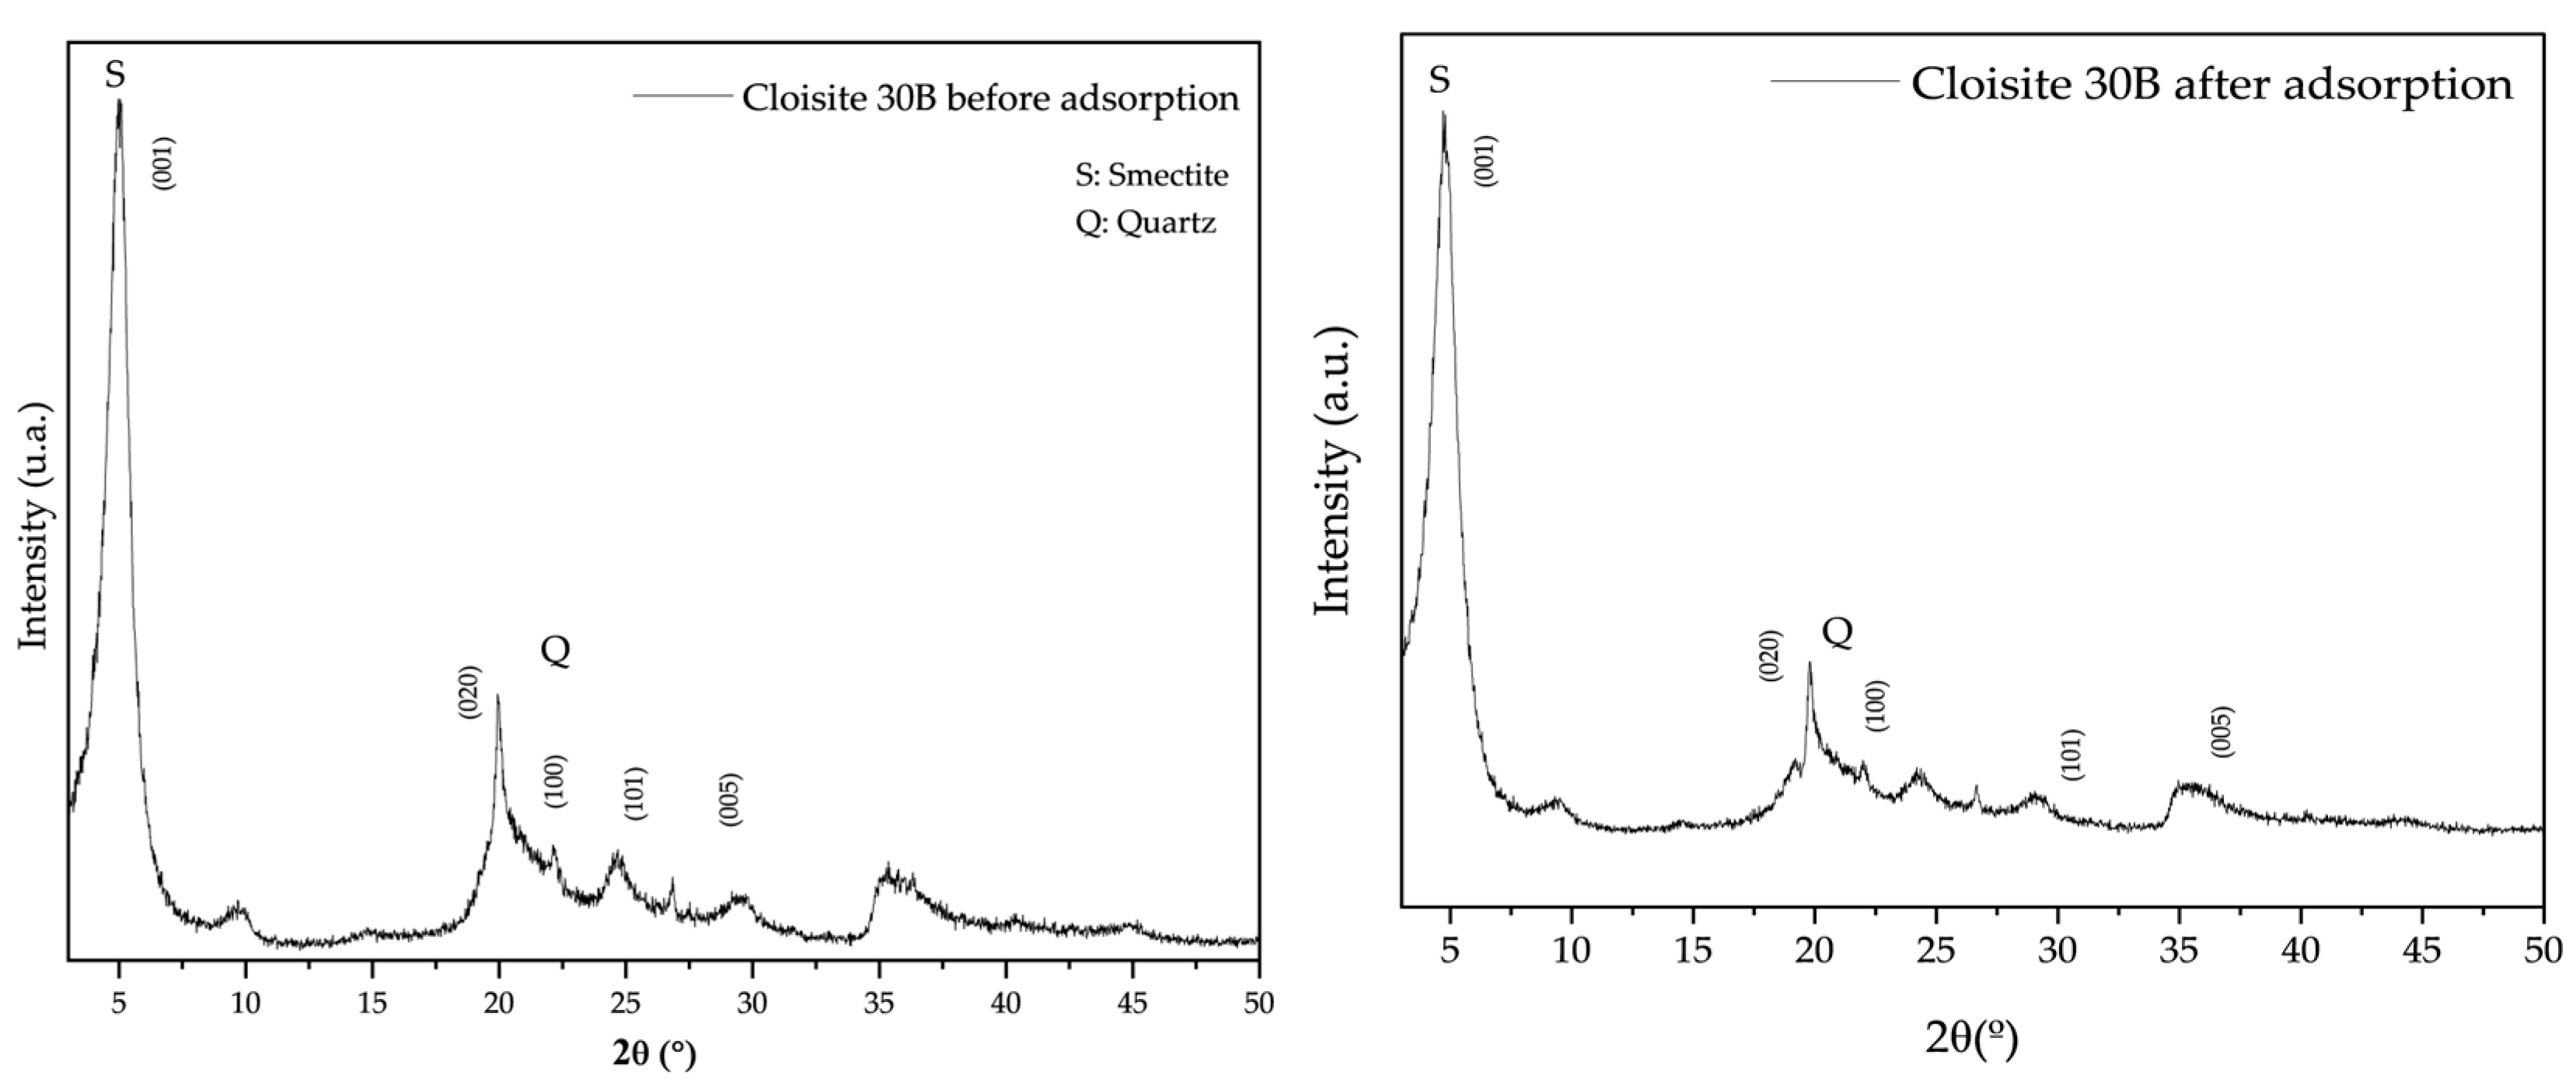
Figure 1 shows the diffractograms of organoclay before and after the chlorhexidine adsorption process.
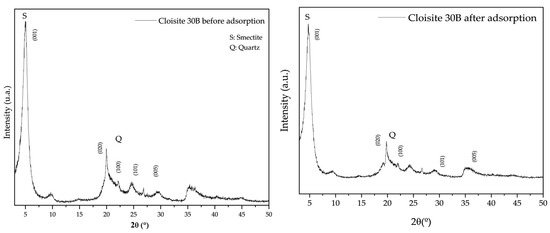
Figure 1.
Diffractogram of organoclay Cloisite 30B before and after adsorption.
In the untreated organoclay, a prominent diffraction peak corresponding to the basal plane (001) is observed at a 2θ angle, indicative of interlayer spacing (d001) of 17.73 Å (1.773 nm), consistent with values reported in the literature for smectite-type clays [12,20,21,22]. In addition to the basal reflection, secondary diffraction peaks are also present, which are attributed to mineral impurities of non-smectite origin, such as quartz [23,24].
The selection of Cloisite 30B as the organoclay adsorbent is strategically justified by its expanded basal spacing relative to natural clays, which enhances its affinity and interaction with organic molecules. This structural feature is evidenced in the diffractogram by a shift toward lower diffraction angles, signifying an increased interlayer distance that facilitates molecular intercalation.
Following chlorhexidine adsorption, the basal peak exhibited a shift to 1.855 nm, indicating a modest expansion of the clay lamellae. Nevertheless, the preservation of the primary diffraction reflections and the lack of significant changes in peak intensities demonstrate that the crystalline structure of Cloisite 30B remained intact, thereby maintaining its chemical stability. These findings imply that the adsorption process predominantly occurred at the surface or the outer regions of the lamellae, with minimal intercalation into the clay interlayers.
The orientations of organic chains within clay minerals were first proposed by the authors of [25]. Depending on the layer charge (i.e., the interlayer cation density or the packing density of alkylammonium ions) and the chain length of the organic cation, various molecular arrangements can form within the interlayer spaces. Additionally, surface geometry and the degree of ion exchange may also influence these configurations.
3.1.2. Fourier Transform Infrared Spectroscopy
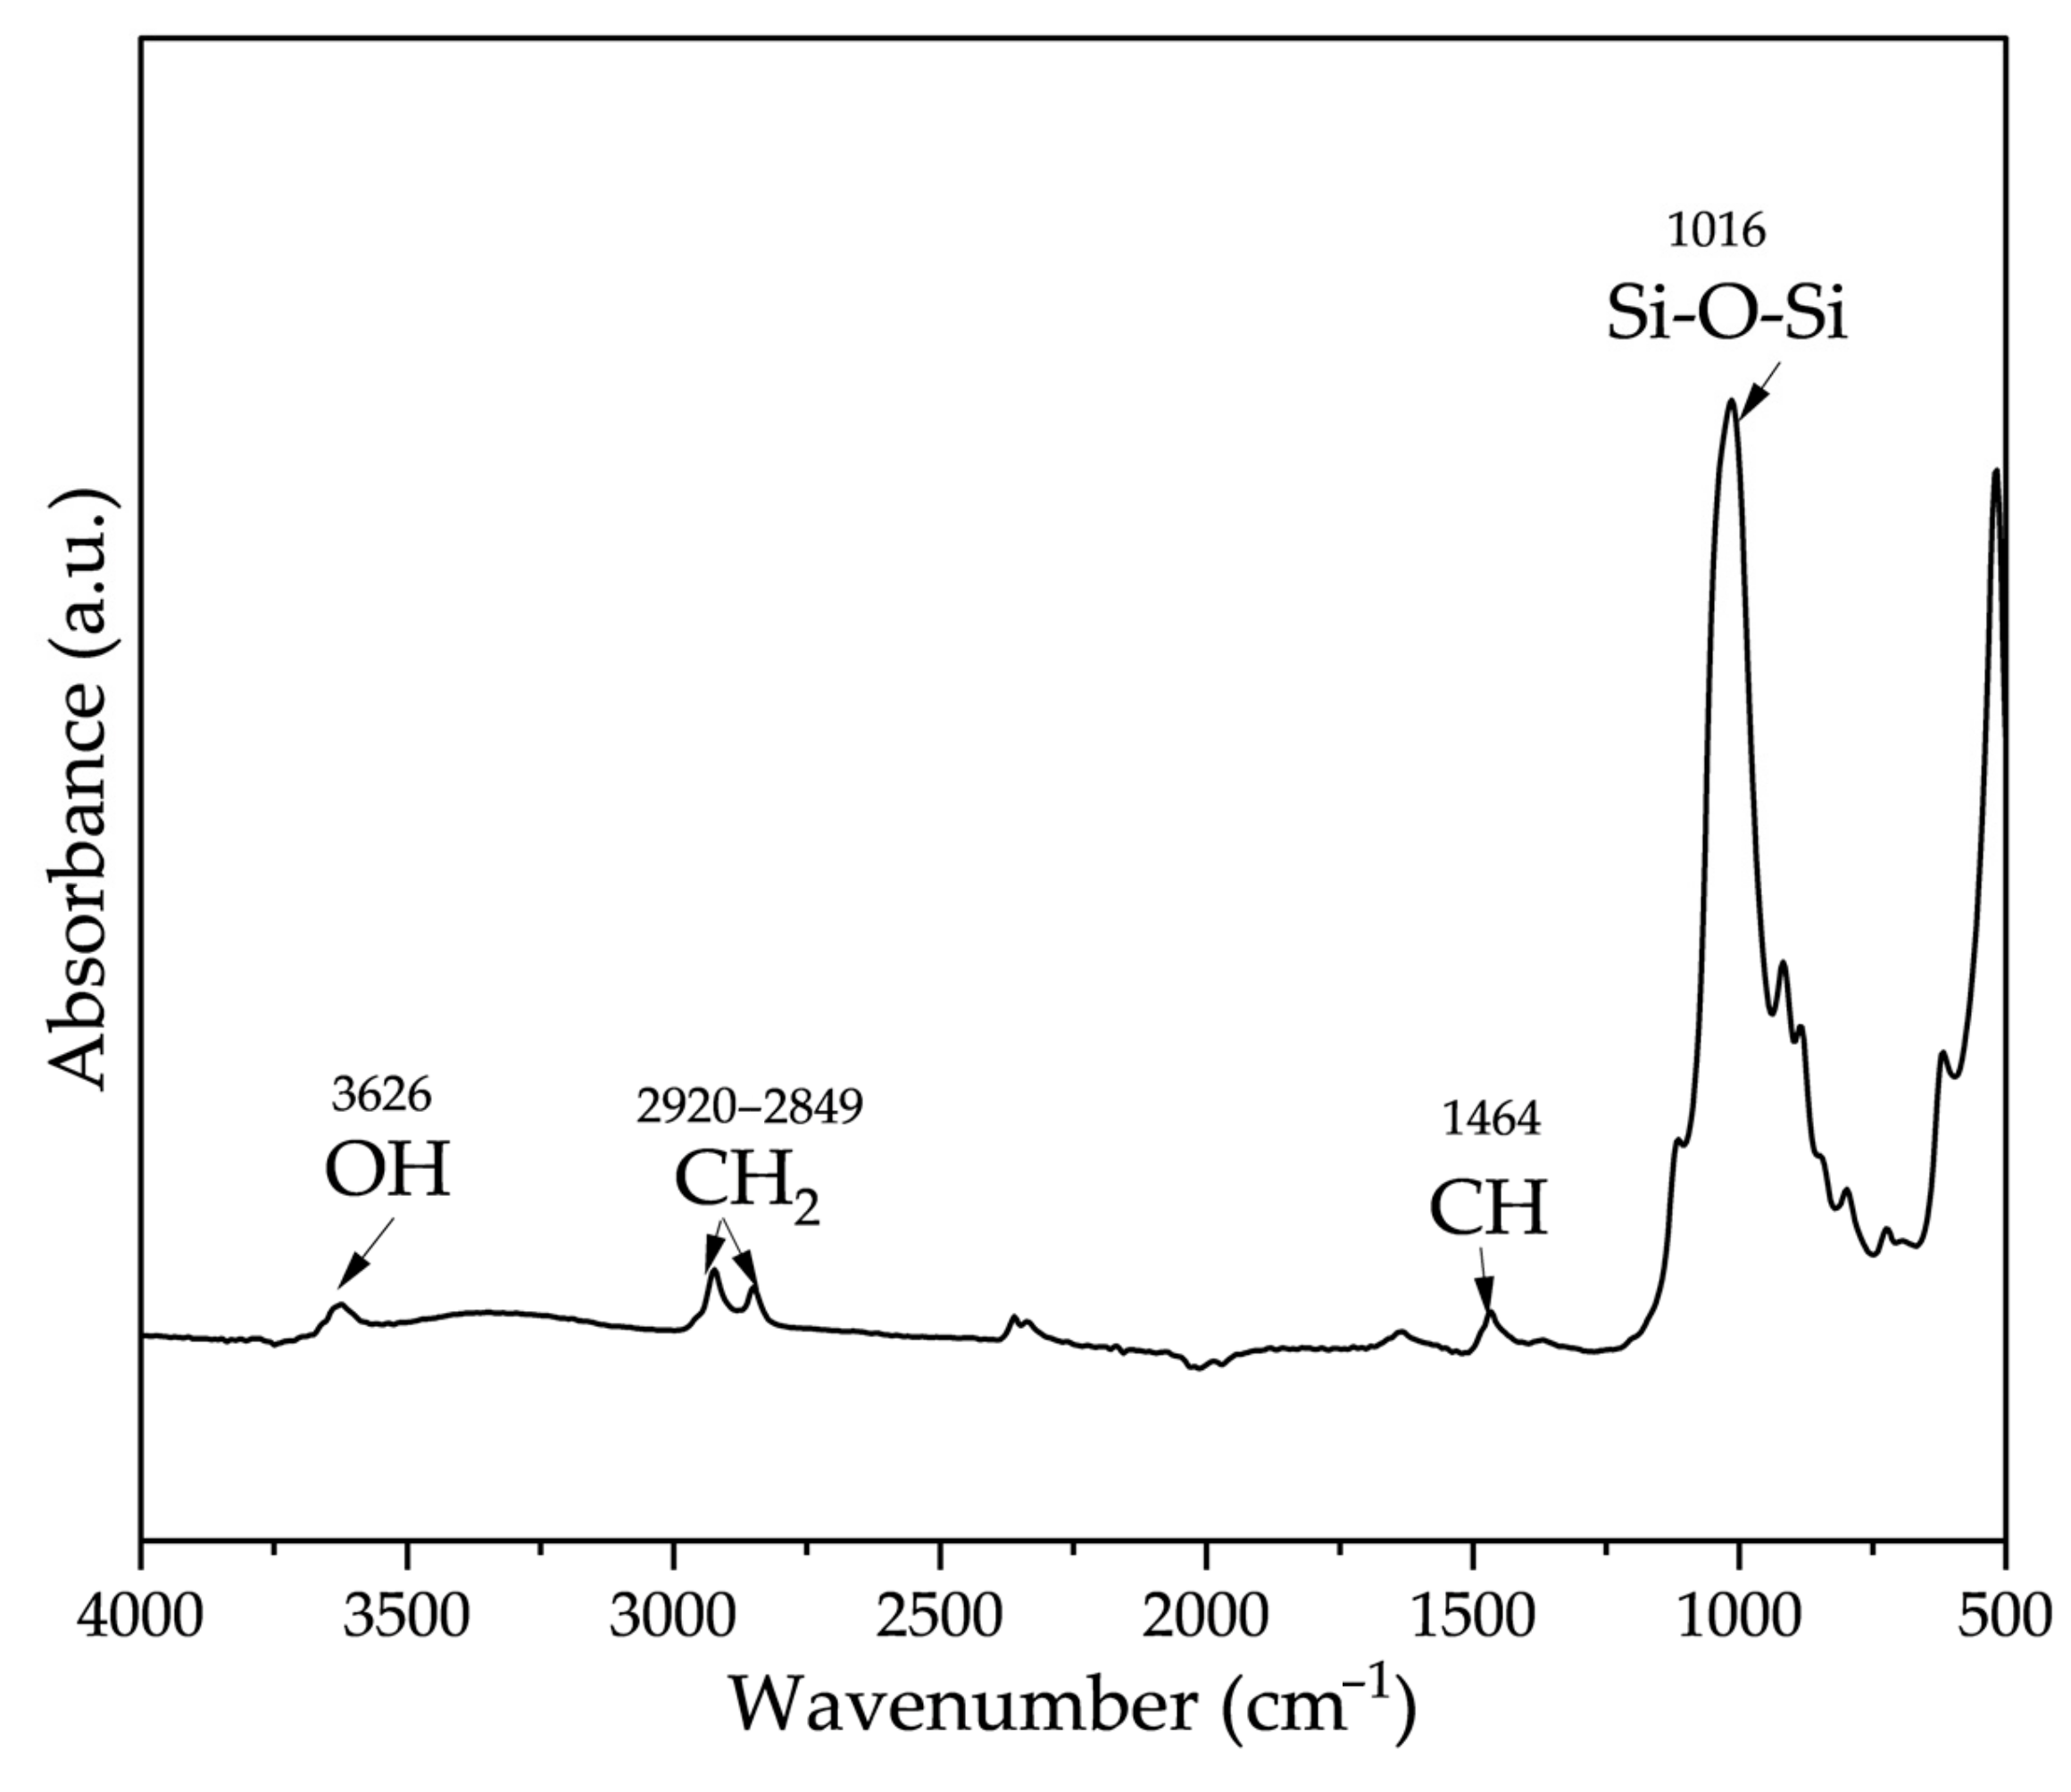
Figure 2 shows the infrared spectrum of organoclay.

Figure 2.
Infrared spectrum of Cloisite 30B clay.
A distinct absorption band appears at approximately 3626 cm−1, corresponding to the stretching vibrations of the structural hydroxyl groups inherent to the clay crystal lattice [26,27,28]. Additionally, the broad band centered around 3400 cm−1 is associated with the stretching vibrations of hydroxyl groups from physically adsorbed water molecules within the smectite interlayers [26,29].
The absorption bands observed at 2920 cm−1 and 2849 cm−1 are attributed, respectively, to the asymmetric and symmetric stretching vibrations of methylene (–CH2) groups originating from the organic cations of the quaternary ammonium salt employed in the organophilization of Cloisite 30B [26,30]. Furthermore, the presence of a band at 1464 cm−1, corresponding to the C–H bending vibrations of the alkylammonium groups, corroborates the successful modification of the clay, confirming its organophilic character.
In the spectral region around 1016 cm−1, a band attributed to the stretching vibrations of Si–O–Si bonds within the silicate framework is observed. Additionally, the absorption bands between 915 and 521 cm−1 correspond to vibrational modes associated with the octahedral sheets of montmorillonite, confirming the presence of aluminosilicate components characteristic of the smectite mineral structure [31,32].
These findings unequivocally validate the mineralogical composition and organophilic nature of Cloisite 30B, as demonstrated by the distinct spectral bands corresponding to both the inorganic clay matrix and the incorporated organic functional groups within its structure.
3.2. Adsorption Results
3.2.1. Influence of pH
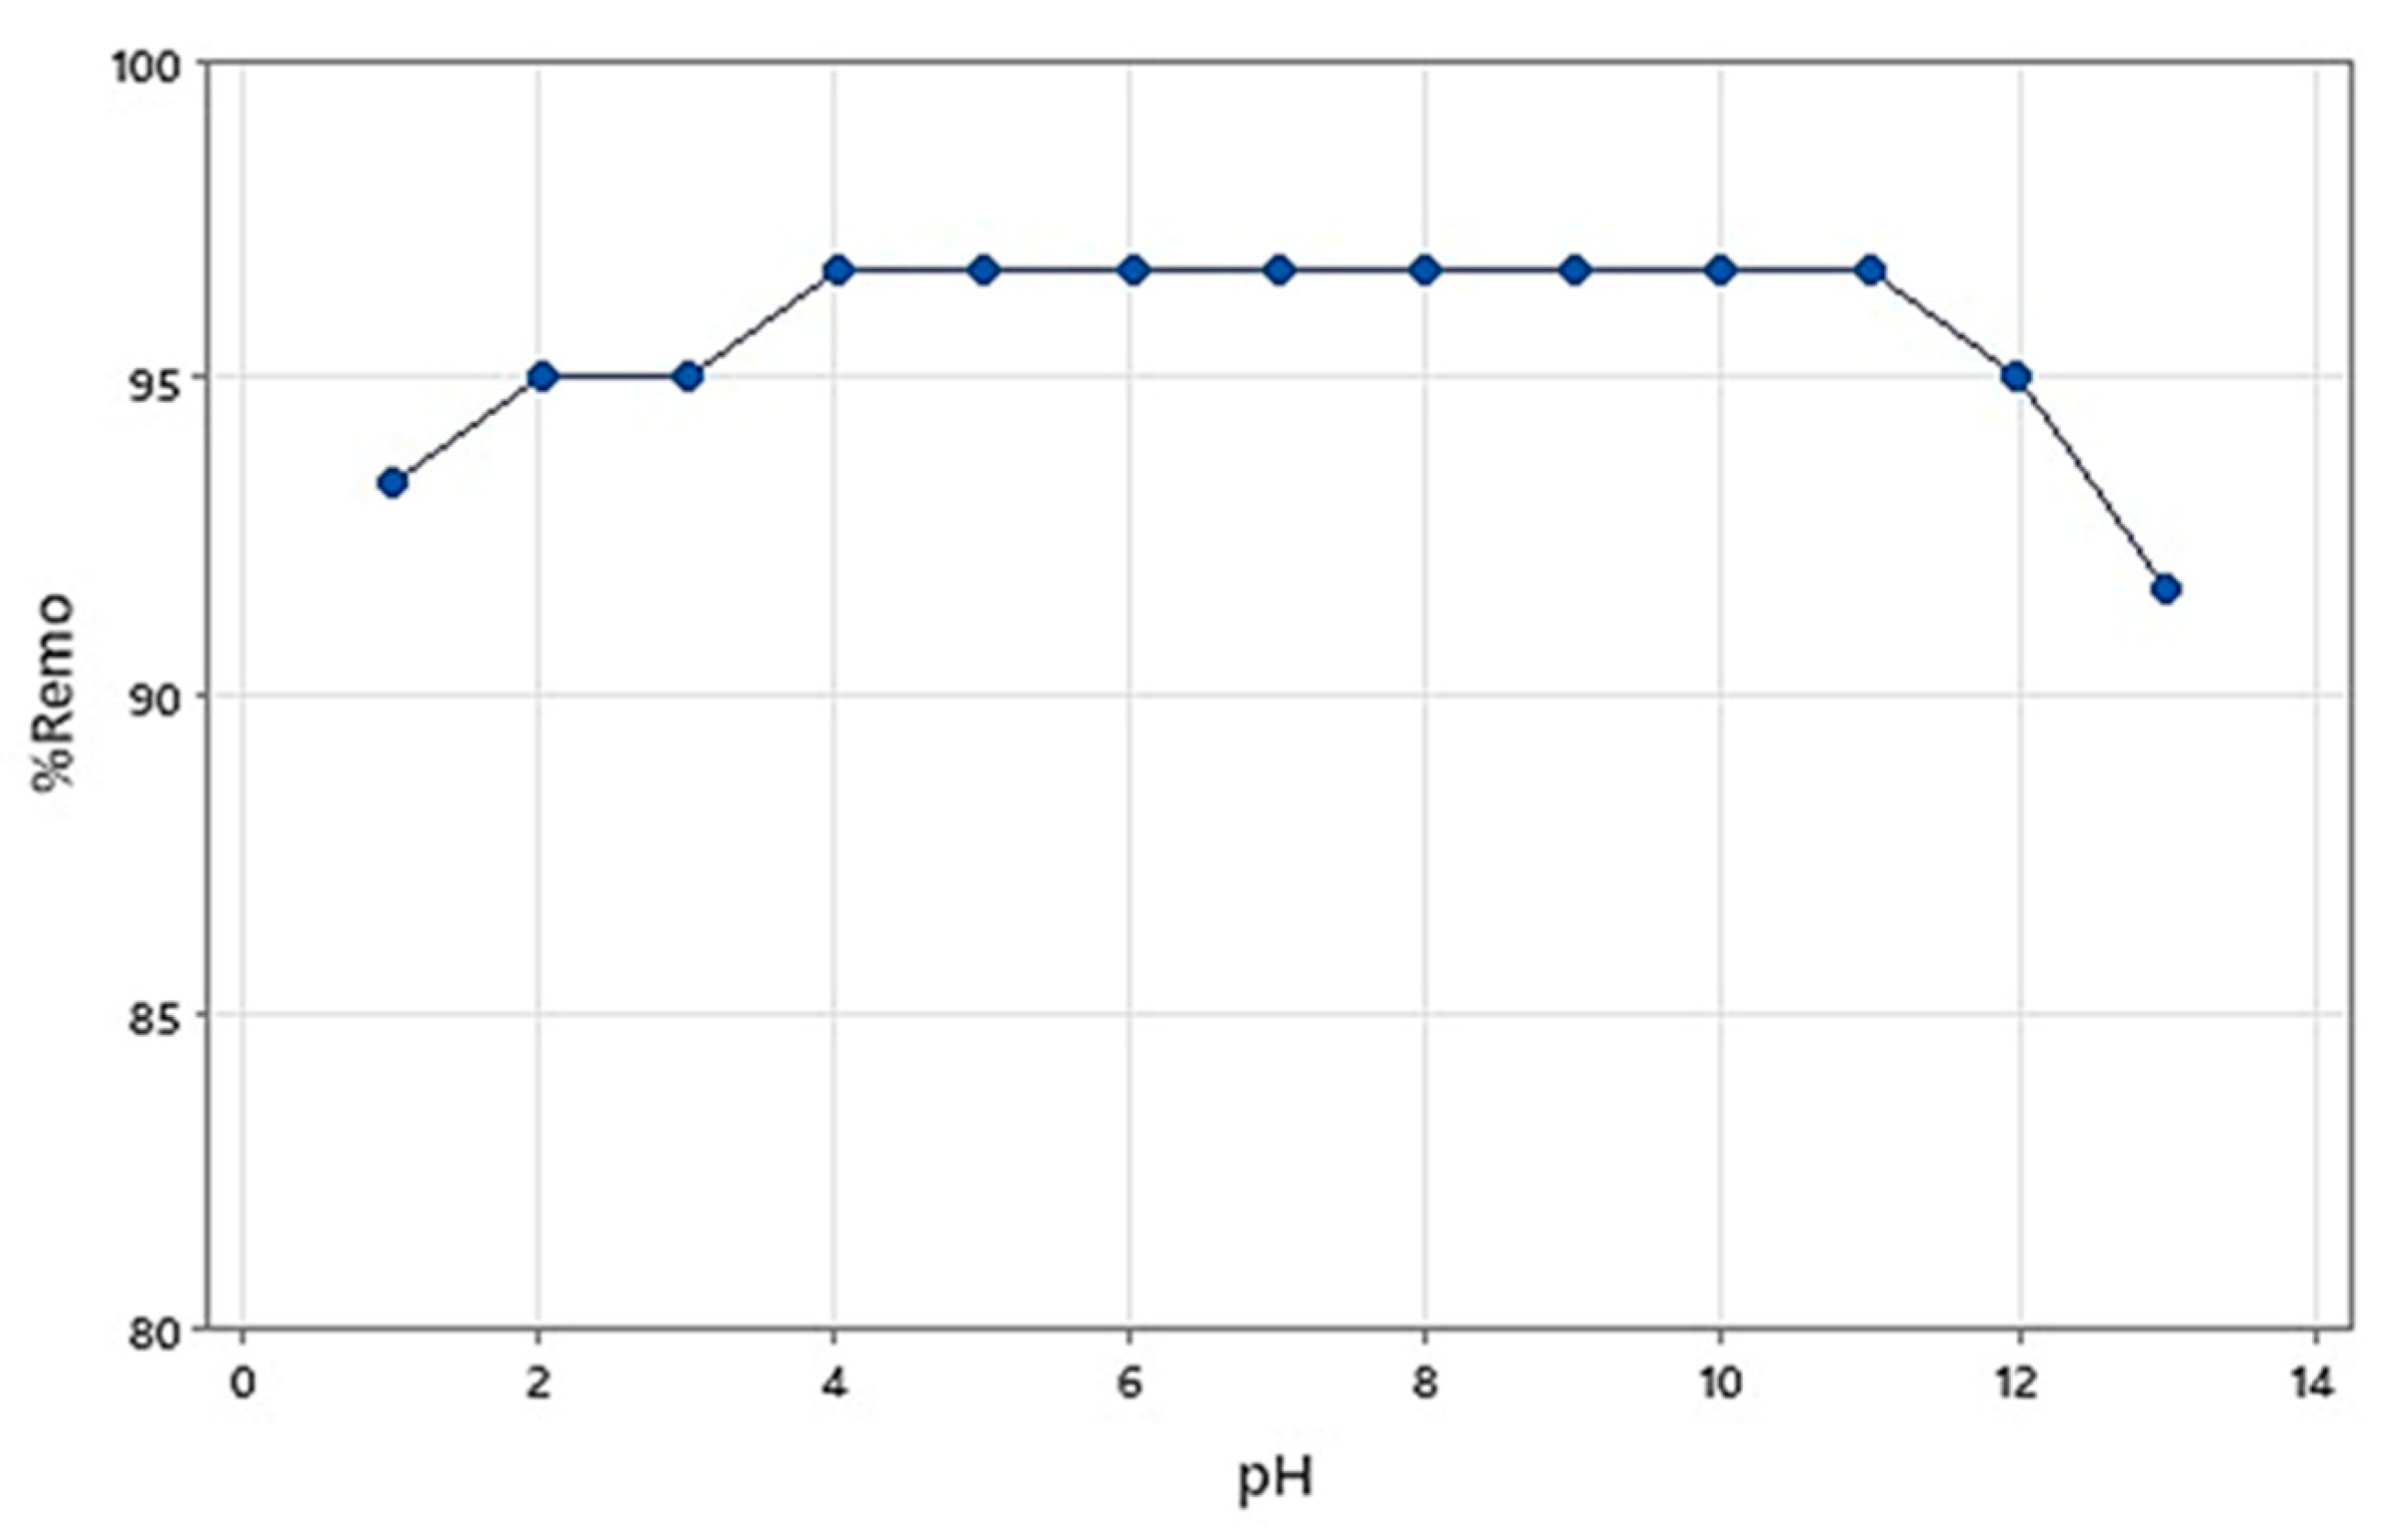
The assessment of the solution pH constitutes a critical parameter in elucidating adsorption mechanisms, as it directly impacts the chemical equilibrium of ionizable functional groups on the adsorbent surface. Variations in pH markedly influence the electrostatic interactions between the adsorbent and adsorbate, potentially altering the efficacy of the contaminant removal process [33]. In this investigation, the process efficiency was quantified by the removal percentage (%Remo).
Figure 3 illustrates the experimental results depicting the variation in chlorhexidine removal efficiency as a function of pH.
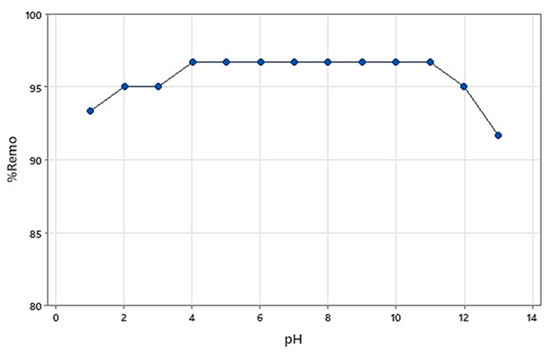
Figure 3.
%Remo of chlorhexidine versus pH.
Within the pH range of 4 to 11, the removal percentage (%Remo) remained consistently stable at 96.67%, demonstrating that pH exerted no significant effect on the efficiency of the chlorhexidine adsorption process.
The lack of significant fluctuations in the %Remo response is further substantiated by the coefficient of variation (CV) analysis, as detailed in Table 2. The CV, defined as the ratio of the standard deviation to the mean and expressed as a percentage, serves as a robust statistical metric to assess experimental precision and to compare the relative variability across distinct data sets [34,35,36].
Table 2.
Analysis of coefficient of variation of pH test for chlorhexidine.
As presented in Table 2, the coefficient of variation (CV) was calculated at 1.67%, reflecting minimal data dispersion and, therefore, high experimental reproducibility. These results confirm that pH variations within the tested range do not significantly impact chlorhexidine adsorption, underscoring the robustness and stability of the adsorption system with respect to this parameter.
3.2.2. Adsorption Tests
Table 3 details the experimental design matrix employed for the 23 factorial study, specifying the lower (−1) and upper (+1) levels of the three independent variables investigated—contact time (h), adsorbent mass (mmol), and the initial drug concentration in the solution (Ci).
Table 3.
Matrix used for 23 factorial design.
The experimental outcomes corresponding to the outlined design matrix are summarized in Table 4, representing the adsorption tests of chlorhexidine conducted according to the 23 factorial design.
Table 4.
Results of 23 factorial experimental design for organoclay.
The analysis of the experimental matrix indicates that Test 8 exhibited the highest removal efficiency (%Remo), achieving 95.77%. This optimum performance was recorded under the conditions of maximum adsorbent mass (0.5 g), elevated initial chlorhexidine concentration (0.57 mmol/L), and extended contact time (6 h). Conversely, Test 4, conducted with the same adsorbent mass and contact time but a substantially lower initial drug concentration (0.043 mmol/L), yielded a %Remo of 93.16% and an adsorption capacity (qeq) of 0.0040 mmol/g. Despite the high removal percentage, this was the lowest among the eight experimental runs, underscoring the significant influence of the initial chlorhexidine concentration on the process’s performance.
To rigorously validate this observation, a comprehensive statistical analysis was performed, evaluating both main effects and interactions among the studied factors.
Regarding the equilibrium adsorption capacity (qeq), the highest values were consistently observed at the lowest adsorbent dosage tested (0.1 g). This inverse relationship suggests that the specific adsorption capacity diminishes as the adsorbent concentration increases, a trend well-documented in the literature. Similar behaviors have been reported in studies investigating cephalexin adsorption on activated carbon derived from walnut shells, as well as the adsorption of amoxicillin and other β-lactam antibiotics on biomass-based activated carbons [37,38].
The decrease in adsorption capacity with increasing adsorbent dosage can be attributed primarily to particle agglomeration phenomena at higher concentrations, which reduce the effective surface area accessible for adsorption, thereby compromising process efficiency [39,40,41,42,43,44]. Additionally, an excess of adsorbent may result in a higher proportion of unused active sites, decreasing the amount adsorbed per unit of mass [37].
3.2.3. Statistical Analysis
Chlorhexidine Removal Percentage (%Remo)
Table 5 displays the estimated effects derived from the 23 factorial design, analyzing the percentage removal (%Remo) of chlorhexidine as a function of the following independent variables: adsorbent mass, contact time, and initial drug concentration.
Table 5.
Effects of 23 factorial design on percentage of removal as function of organoclay mass, time, and concentration of chlorhexidine.
The results demonstrate that, at a 5% significance level (p < 0.05), only the initial concentration factor exerted a statistically significant effect on the response variable. Therefore, it can be concluded that, among the evaluated parameters, the initial concentration of the chlorhexidine solution is the sole factor significantly influencing the adsorption process’s efficiency.
Equation (3) depicts the linear regression model derived from the experimental data, incorporating the coefficients of statistically significant main effects and interactions. This model demonstrated the best fit, as evidenced by the metrics in Table 5, accounting for 77.70% of the observed variability (R2 = 0.7770). Additionally, the p-value exceeding 0.05 confirms the model’s adequacy in accurately representing the response behavior.
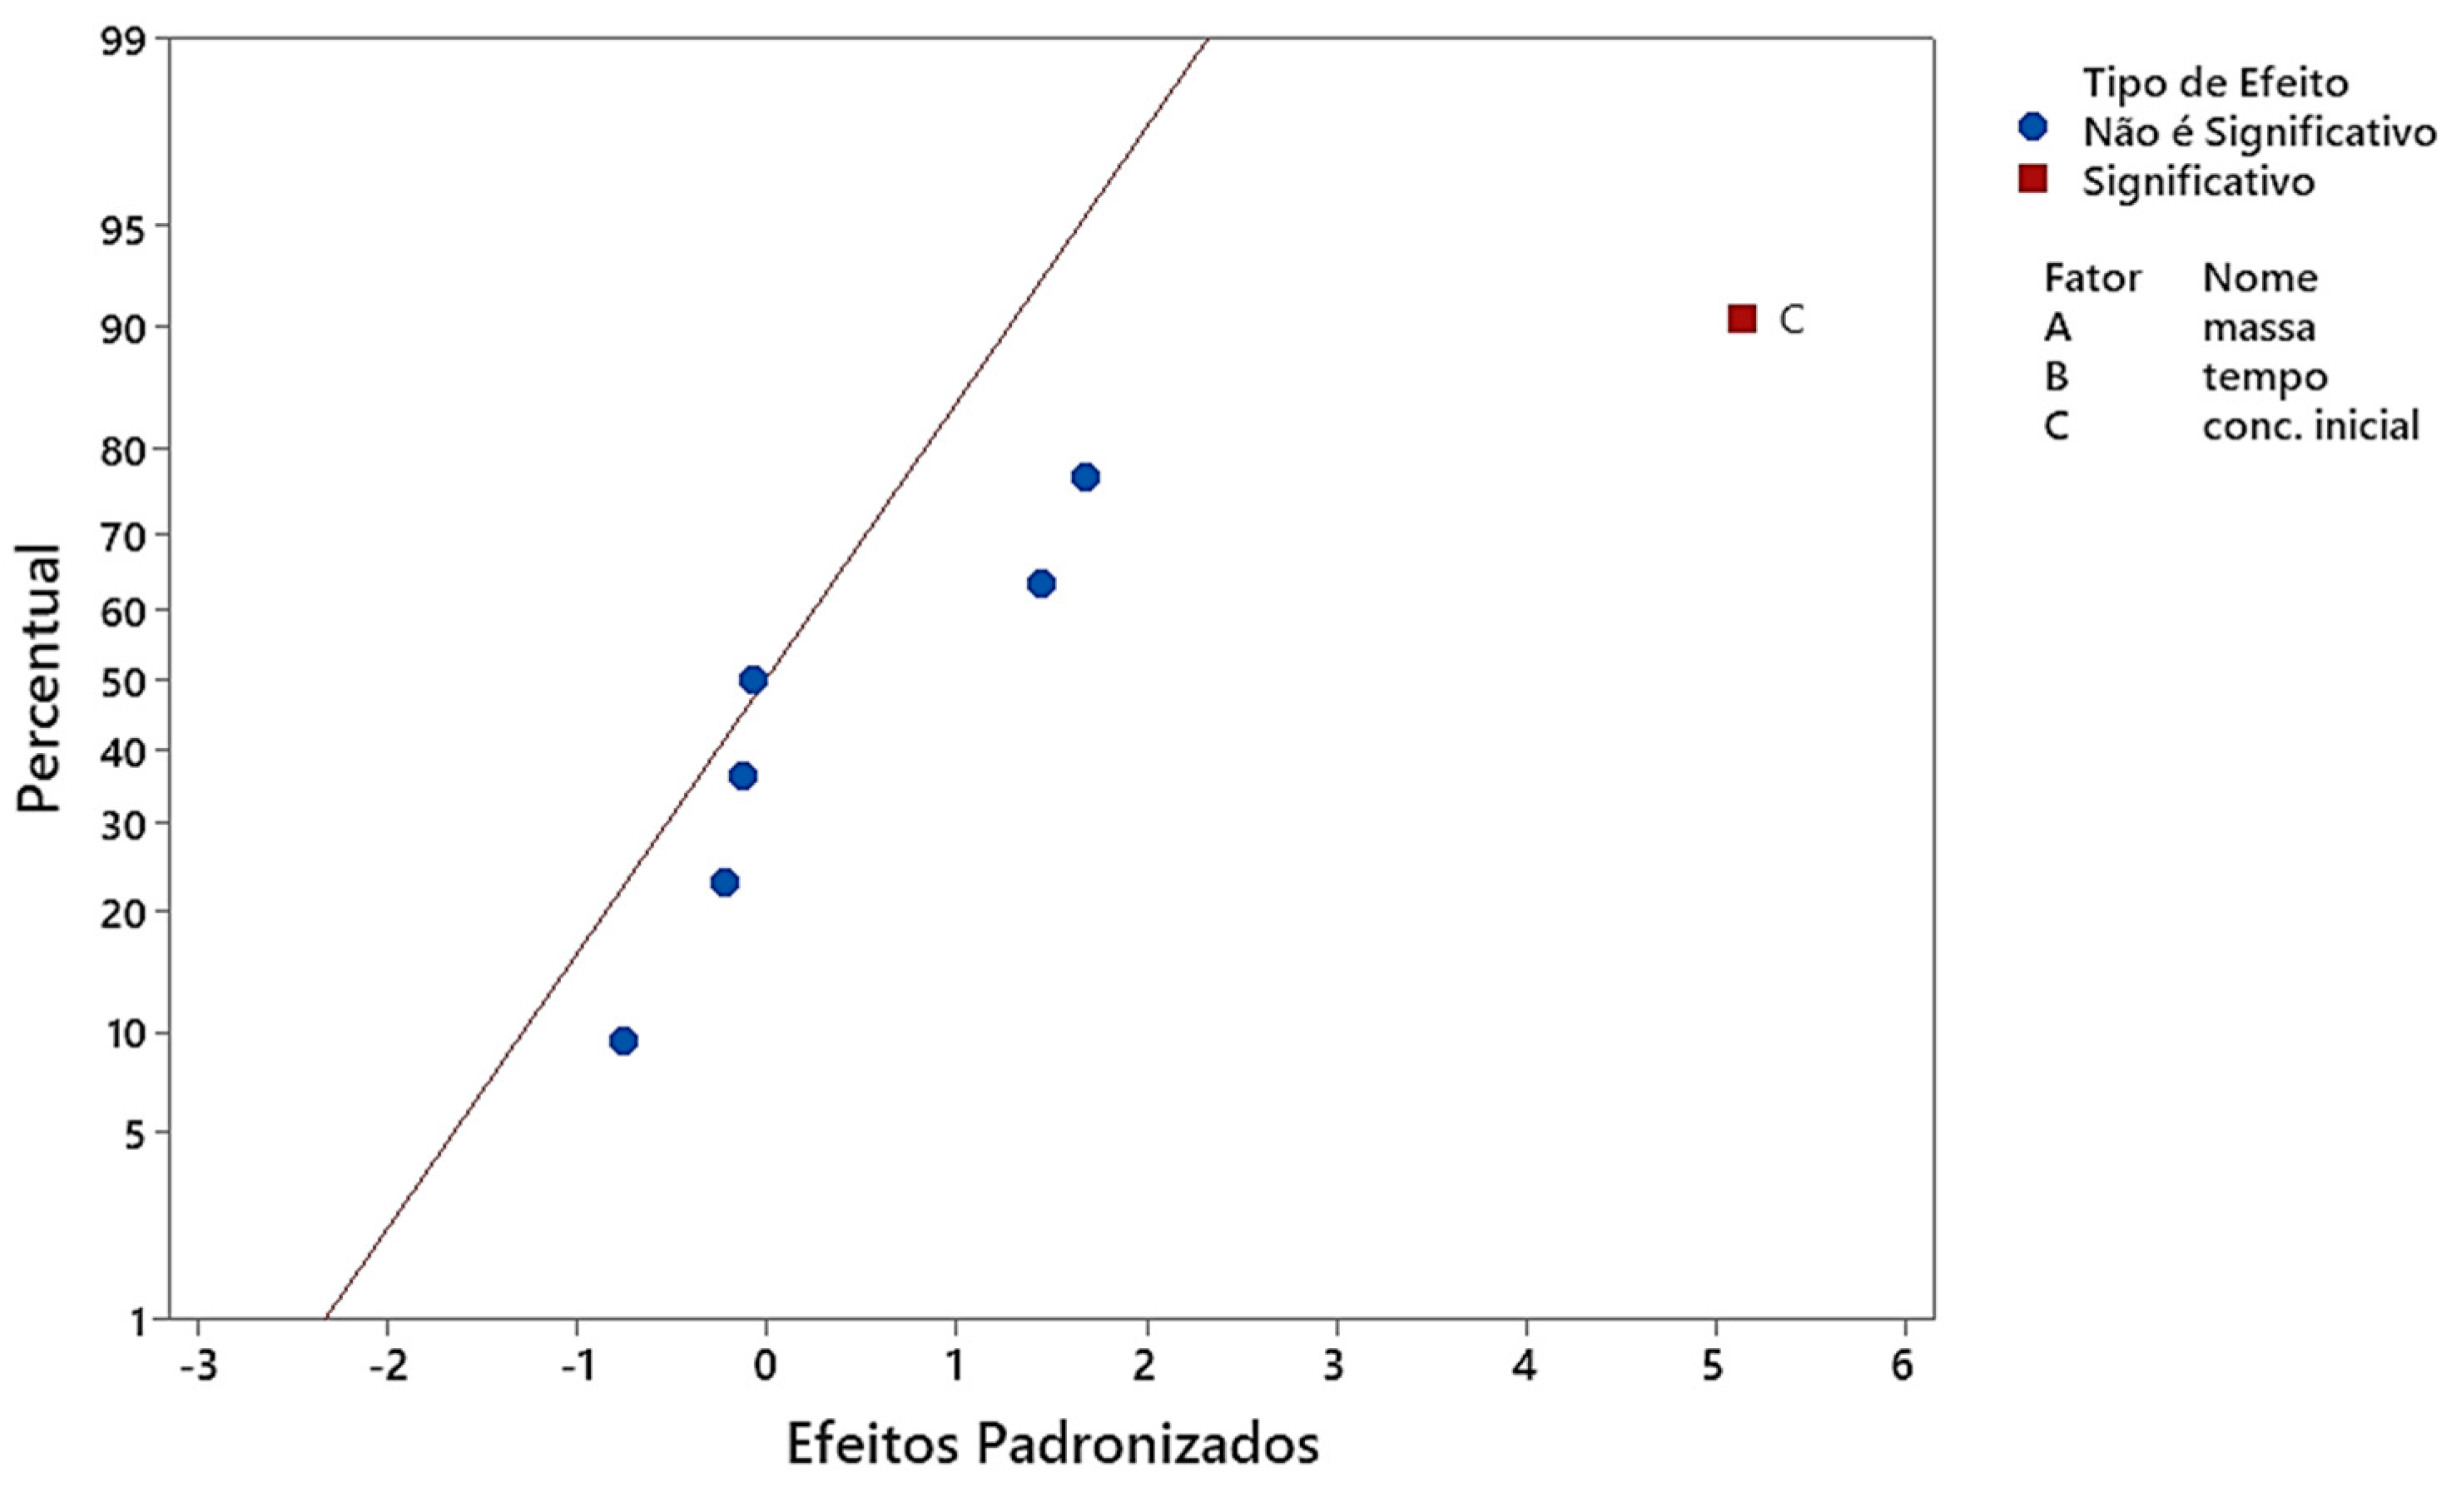
Figure 4 illustrates a standardized Pareto chart of the effects (initial concentration, mass, and time) on the response (removal efficiency).

Figure 4.
Prediction quality of regression model derived from experimental data regarding organoclay’s chlorhexidine removal efficiency (%Remo).
As illustrated in Figure 4, the normal probability plot of the effects facilitates the assessment of statistical significance by depicting the standardized effects relative to the reference line of the normal distribution. Effects positioned farther from the zero baseline are deemed statistically significant at the 5% significance threshold.
Within this framework, the initial concentration factor (denoted as “C”) exhibits a positive and statistically significant standardized effect, situated to the right of the reference line. This positioning indicates that an increase in the initial chlorhexidine concentration positively influences the removal percentage.
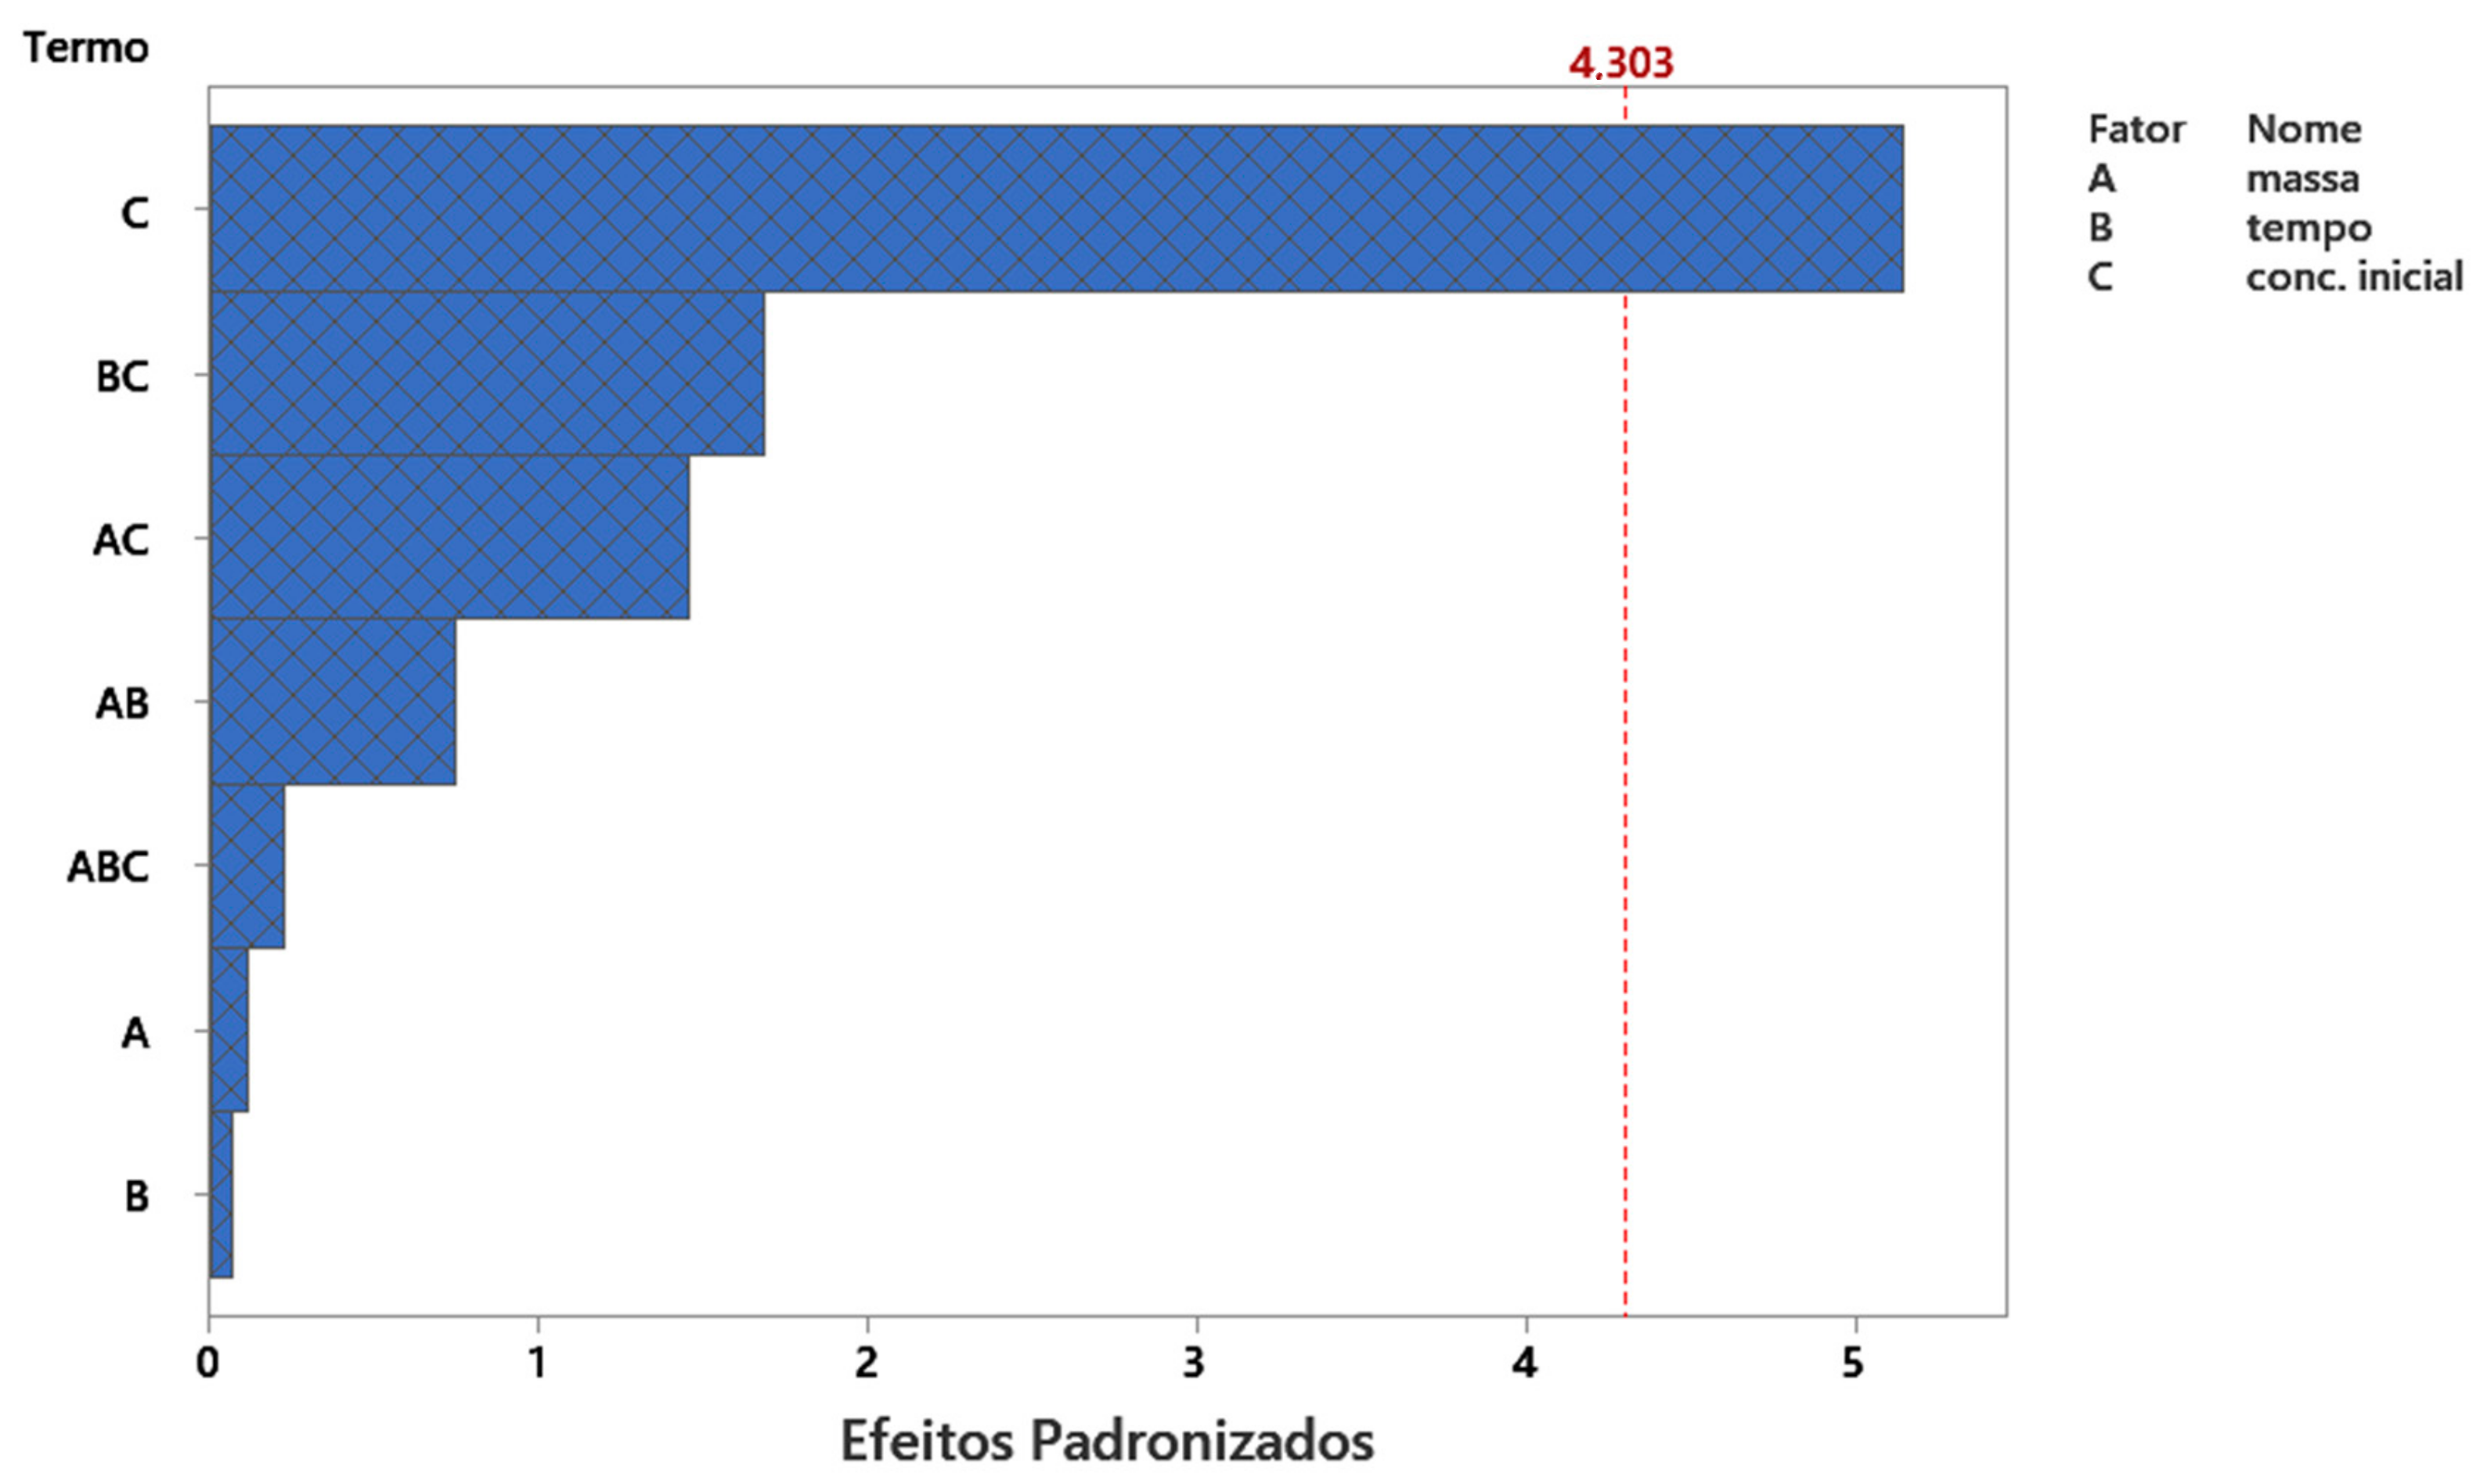
Figure 5 displays a Pareto chart of standardized effects for the removal percentage (%Remo) response variable.

Figure 5.
Pareto chart of standardized effects of initial concentration, time, and adsorbent mass of organoclay on chlorhexidine removal efficiency (%Remo).
This graph presents the absolute values of the standardized effects, ordered in descending magnitude, alongside the statistical significance threshold (critical value of 4.303), corresponding to a 5% significance level (α = 0.05). The reference line delineates the cutoff above which effects are deemed statistically significant.
As illustrated in Figure 5, only the effect related to the initial concentration factor (denoted as C) surpasses the significance line, indicating that it is the sole factor exerting a statistically significant influence on the %Remo response in the chlorhexidine adsorption process. This finding aligns with prior statistical analyses and reinforces the conclusion that the initial drug concentration is the primary driver of process efficiency when utilizing Cloisite 30B as the adsorbent.
Adsorption Capacity (qeq)
Table 6 details the estimated effects of the 23 factorial design on the equilibrium adsorption capacity (qeq) of chlorhexidine, taking into account the following independent variables: adsorbent mass, contact time, and initial solution concentration.
Table 6.
Effects of factorial design on percentage of removal as function of mass of organoclay, time, and concentration of chlorhexidine.
The data indicate that, at a 5% significance level (p < 0.05), both contact time and initial concentration exerted a statistically significant effect on the qeq response. Therefore, it can be affirmed that these two factors substantially influence the efficiency of chlorhexidine’s adsorption onto Cloisite 30B.
Equation (4) presents the linear regression model incorporating the statistically significant coefficients of the main factors (adsorbent mass, contact time, and initial concentration) as well as their interactions, as detailed in Table 6.
This model exhibited strong predictive capability, accounting for 98.00% of the variability in the experimental data (R2 = 0.9800) with a p-value exceeding 0.05, thereby confirming its statistical validity.
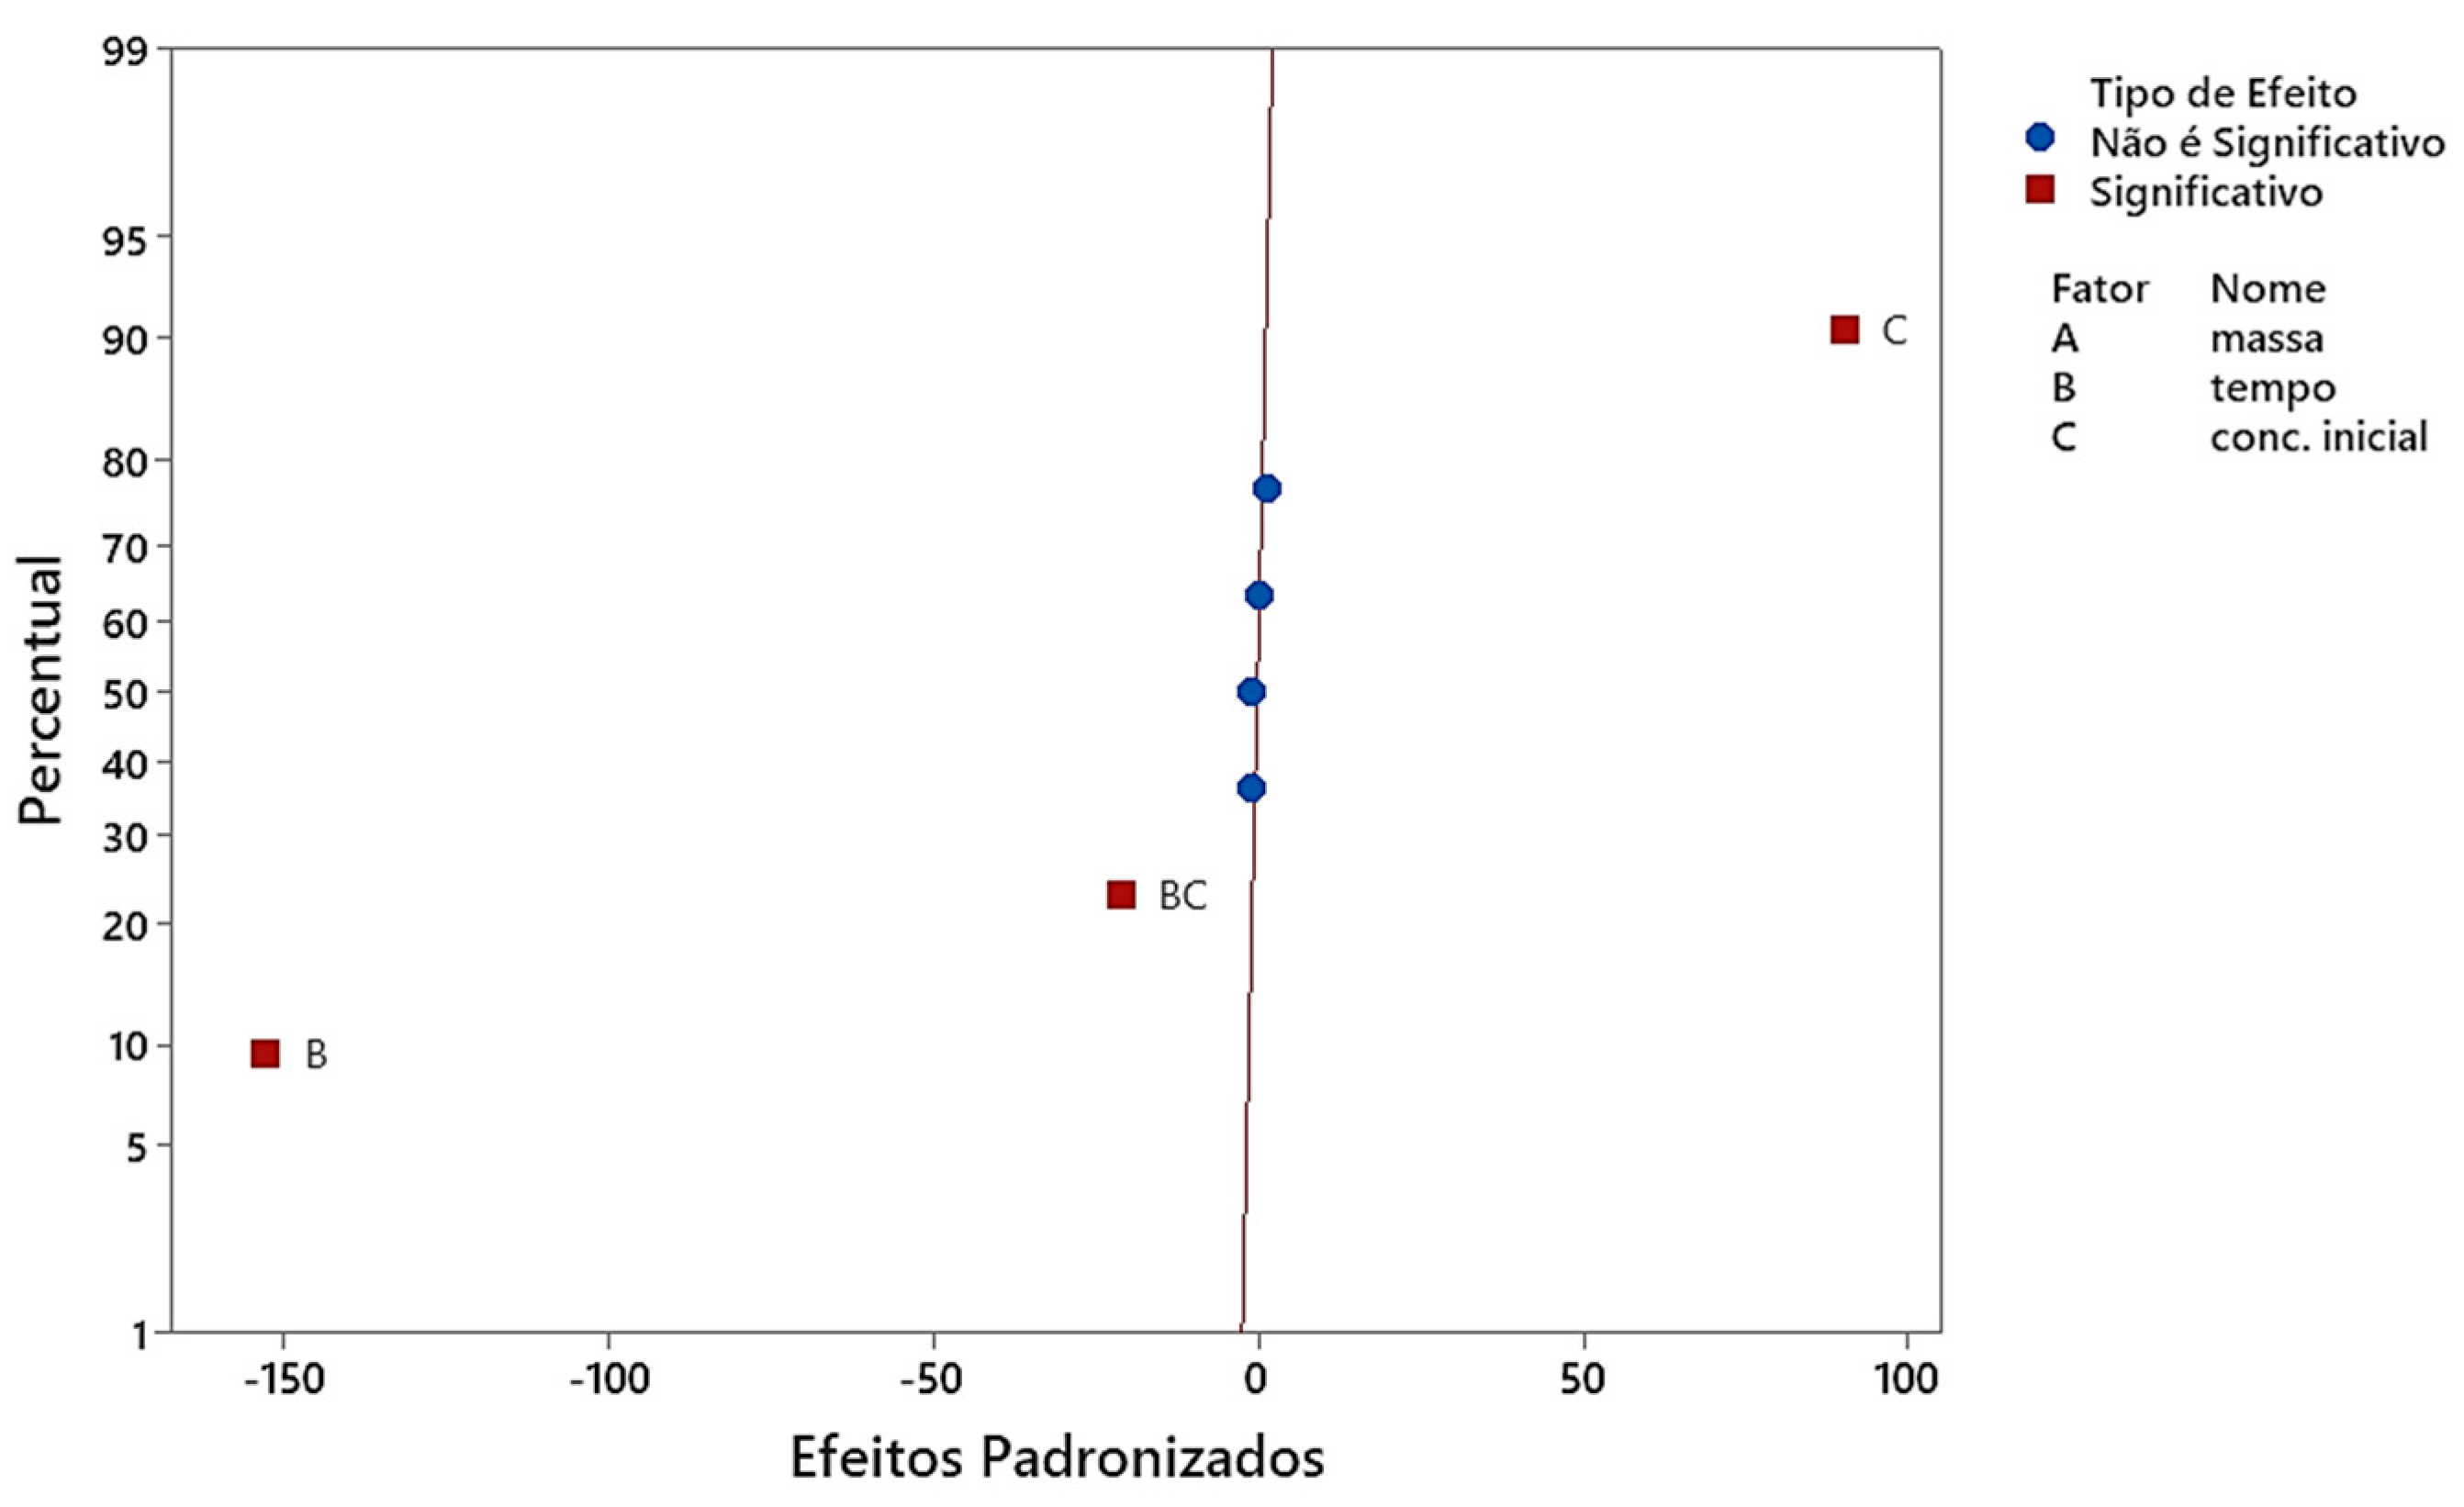
Figure 6 depicts a normal probability plot of the standardized effects, enabling the identification of statistically significant factors by examining their deviation from the reference line of the normal distribution.
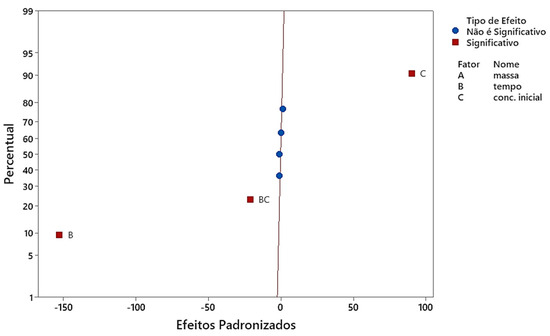
Figure 6.
Prediction quality of regression model using experimental data for organoclay. Removal capacity at equilibrium, qeq. Line indicates regression bands created with 95% confidence level.
As illustrated in Figure 6, the factors time (B), initial concentration (C), and their interaction (BC) exhibit substantial deviation from the normal distribution reference line, indicating statistical significance at the 5% confidence level. Notably, the initial concentration (C) exerts a positive effect, positioned to the right of the plot, whereas the time factor (B) displays a negative effect, situated to the left. The interaction term (BC) also demonstrates statistical relevance, underscoring its important contribution to the model’s behavior.
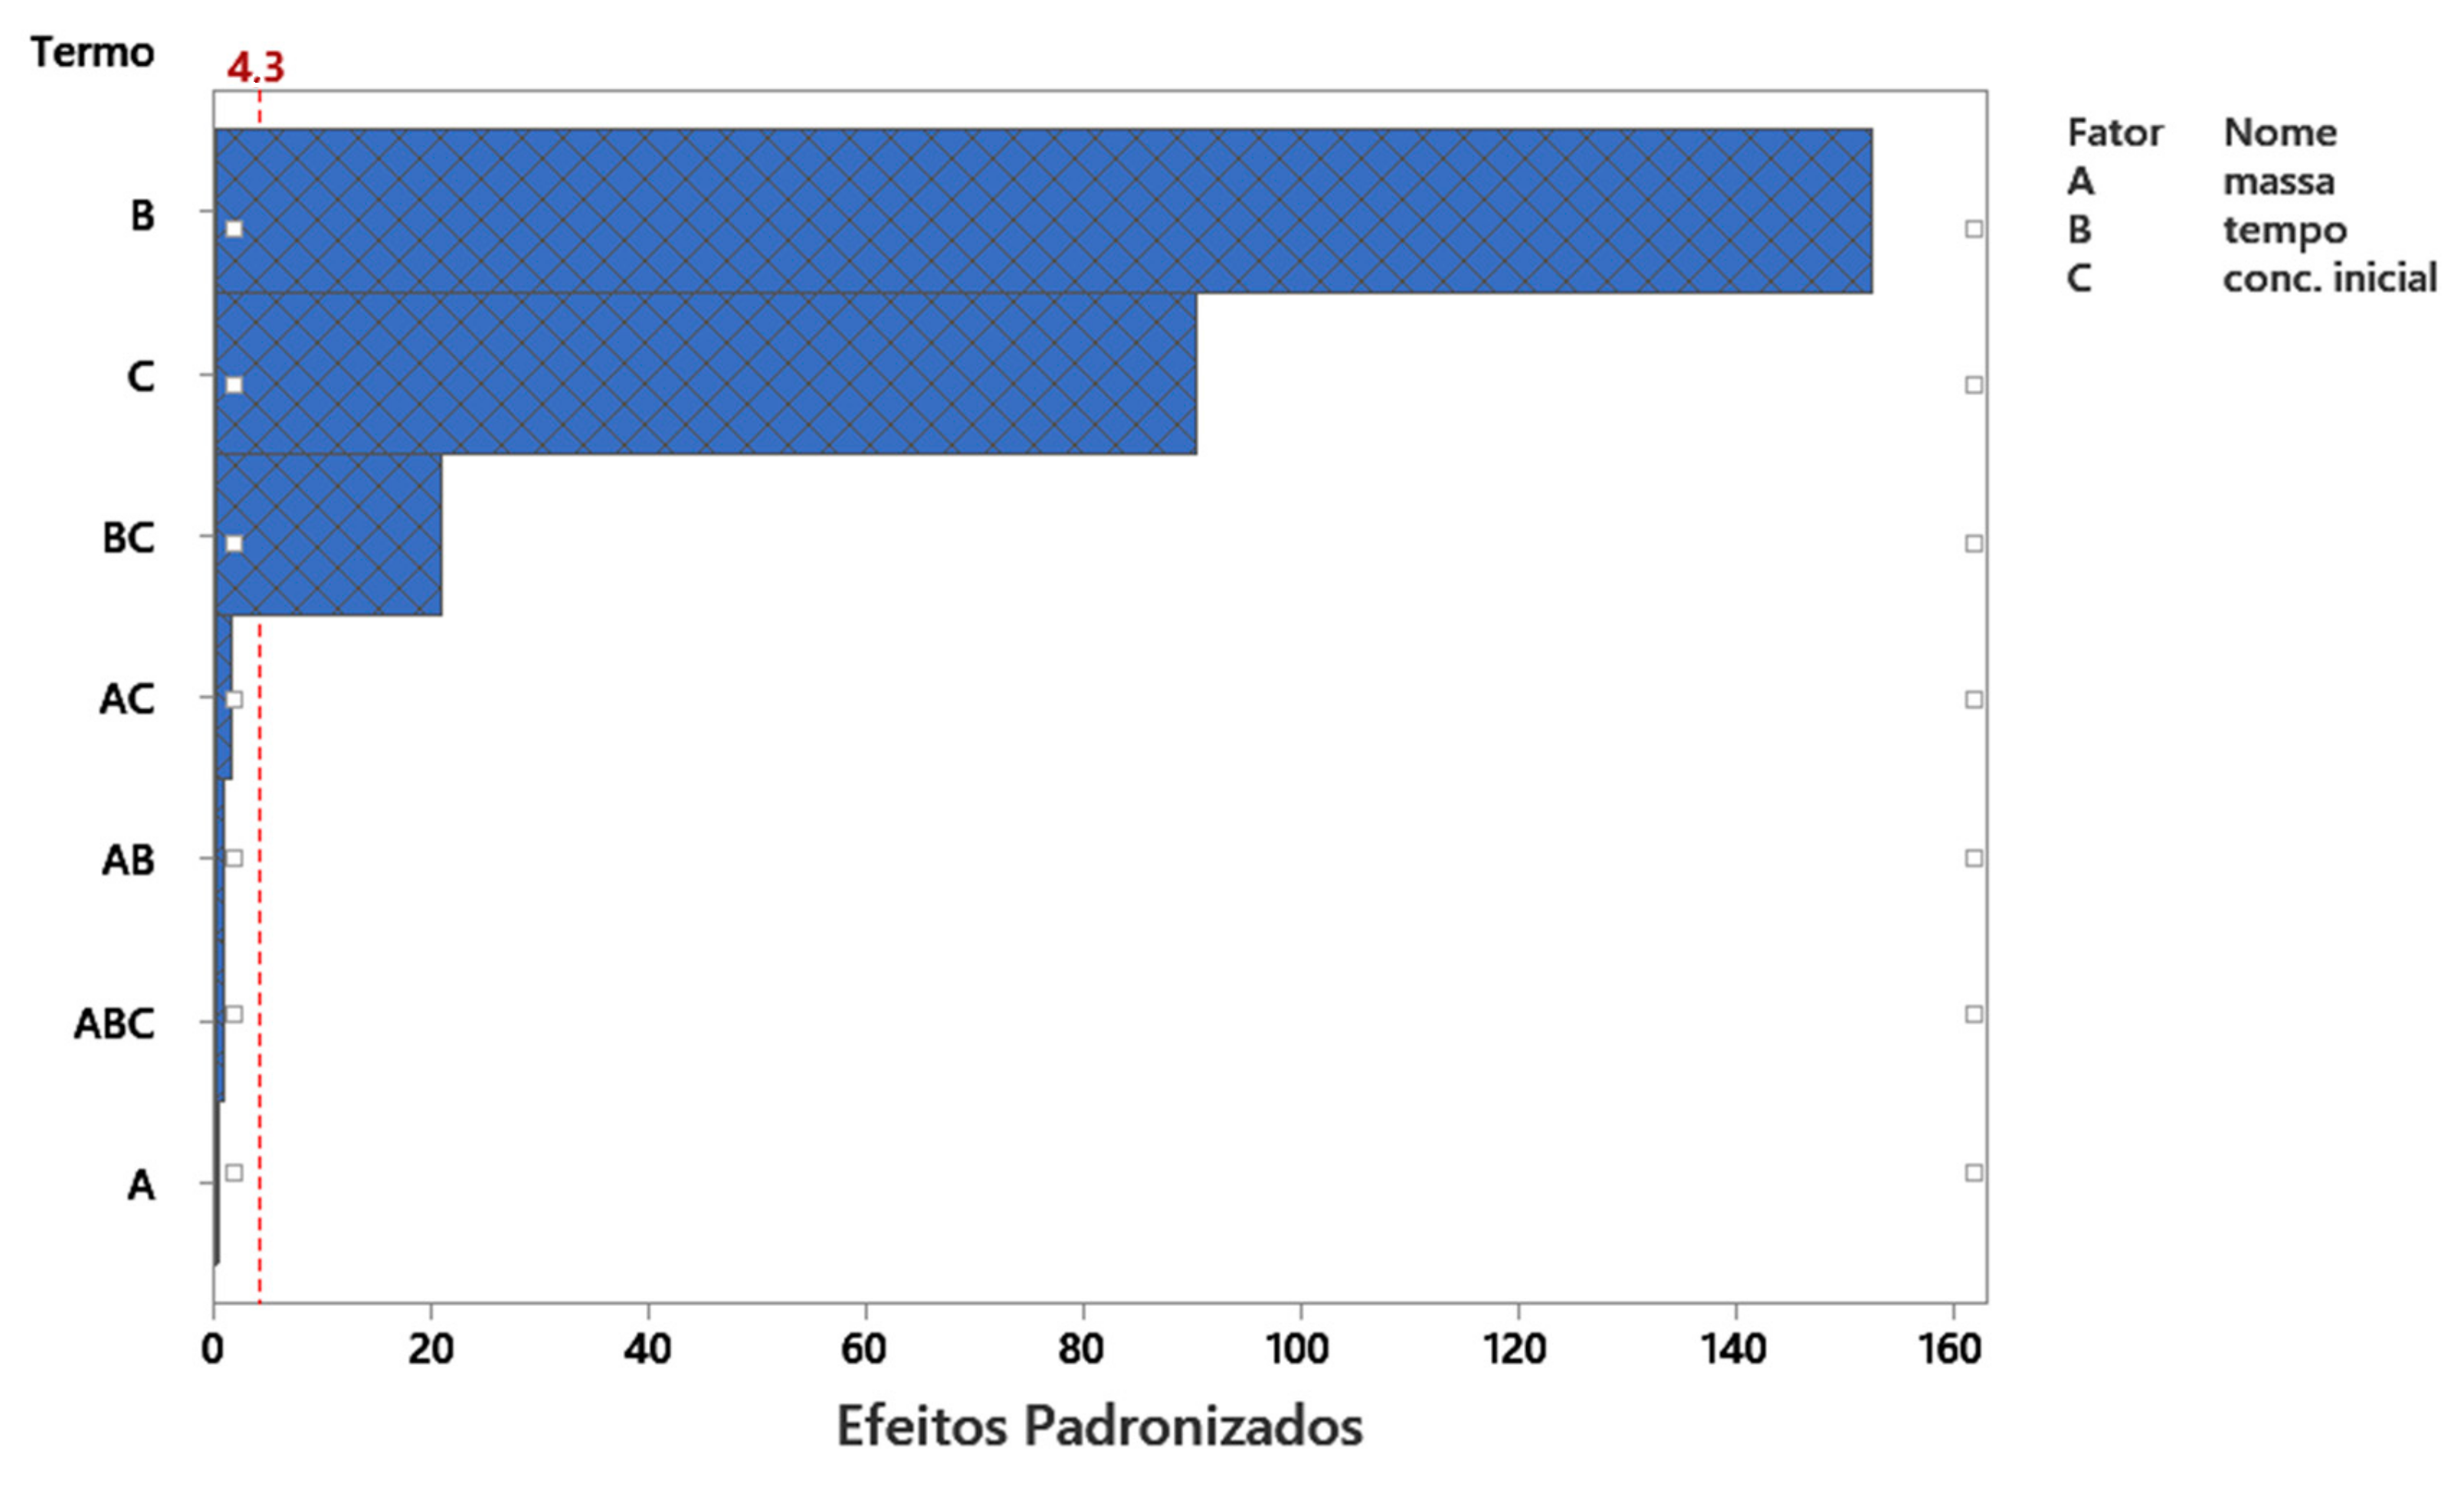
Figure 7 displays a Pareto chart of the effects (initial concentration, time, and adsorbent mass) on the response (adsorption capacity).

Figure 7.
Pareto chart of standardized effects of initial concentration, time, and adsorbent mass of organoclay on adsorption capacity, qeq.
In this chart, the standardized effects are arranged in descending order of magnitude and compared against the statistical significance threshold (critical value = 4.3). The bars representing the factors time (B), initial concentration (C), and their interaction (BC) exceed this reference line, confirming their statistical relevance within the model. These findings are consistent with prior analyses and underscore the fact that all three terms significantly impact the adsorption capacity (qeq) of chlorhexidine onto organoclay.
3.2.4. Adsorption Kinetics
To elucidate the kinetics of RB dye’s adsorption onto bauxite residue, the pseudo-first order (PFO) and pseudo-second order (PSO) models [44,45] were applied. These kinetic models are represented by Equations (5) and (6), shown below.
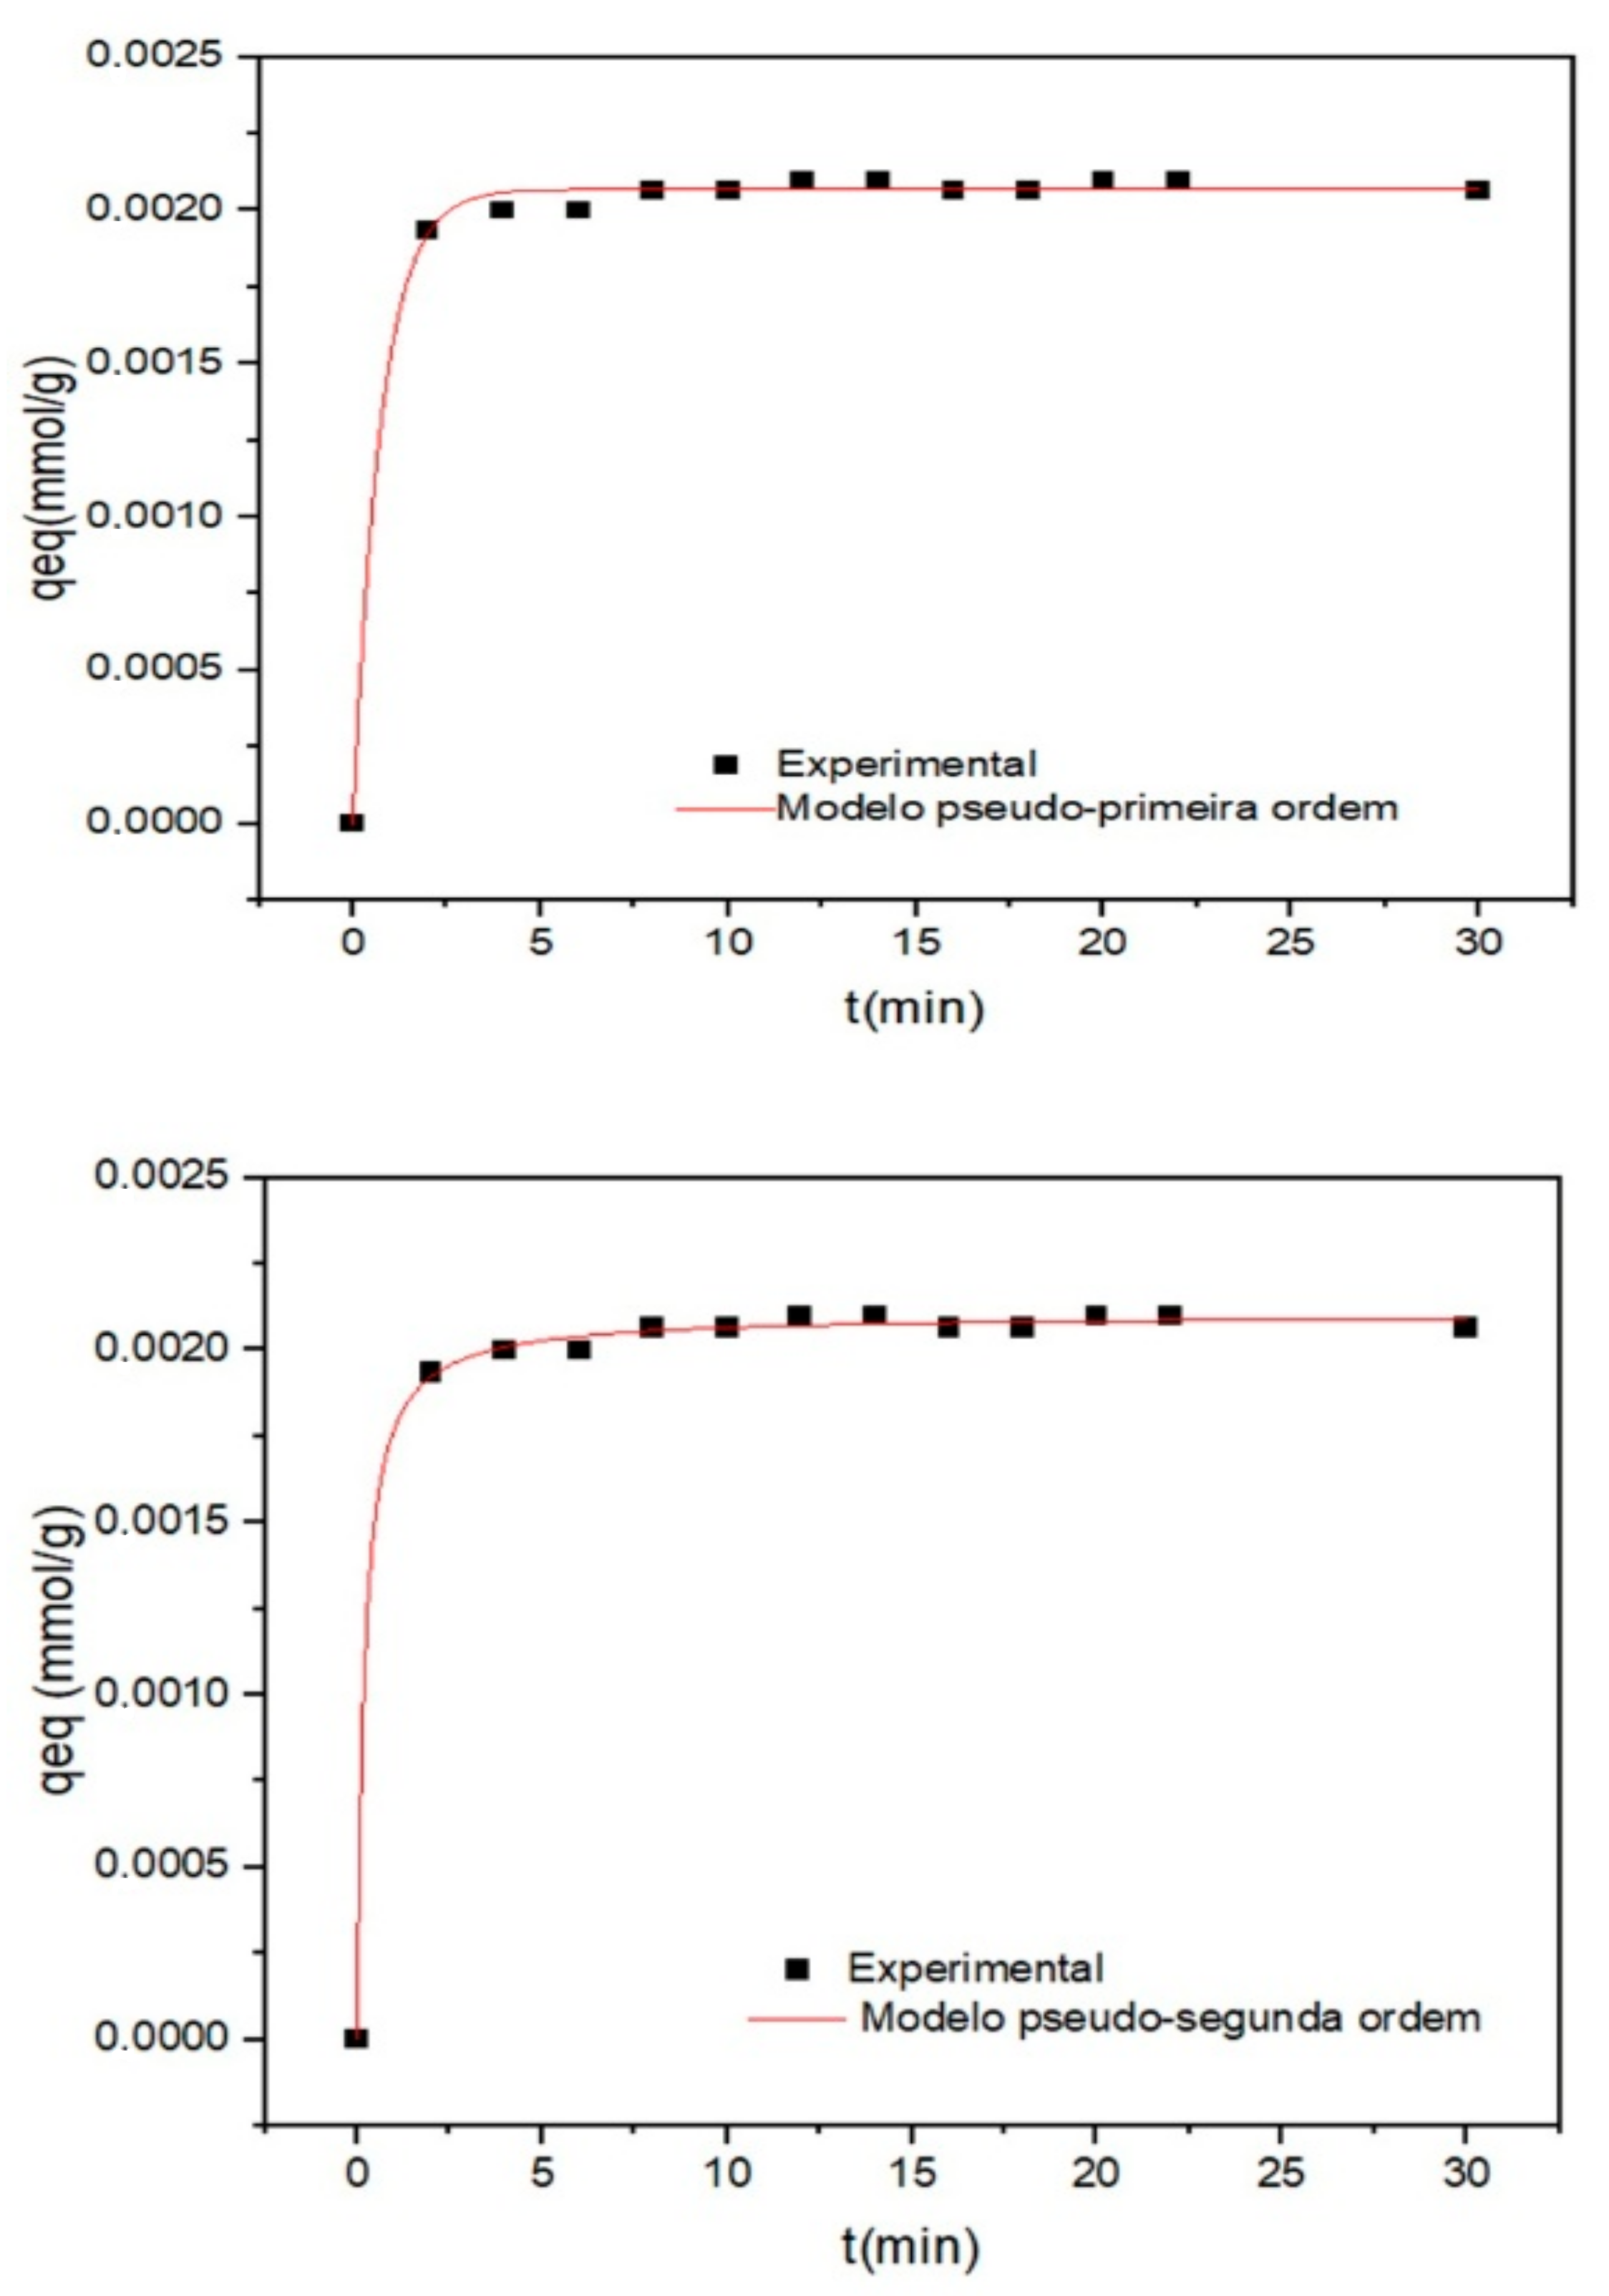
The application of nonlinear kinetic models, specifically the pseudo-first order (PFO) and pseudo-second order (PSO) models, enabled a quantitative understanding of the adsorption dynamics, as evidenced by the trends illustrated in the kinetic plots (Figure 8).
where k1: the adsorption rate constant of the pseudo-first order model (min); k2: the adsorption rate constant of the pseudo-second order model (g/mmol.min); qe: the amount of drug adsorbed at equilibrium (mmol/g); qt: the amount of drug adsorbed at time t (mmol/g).
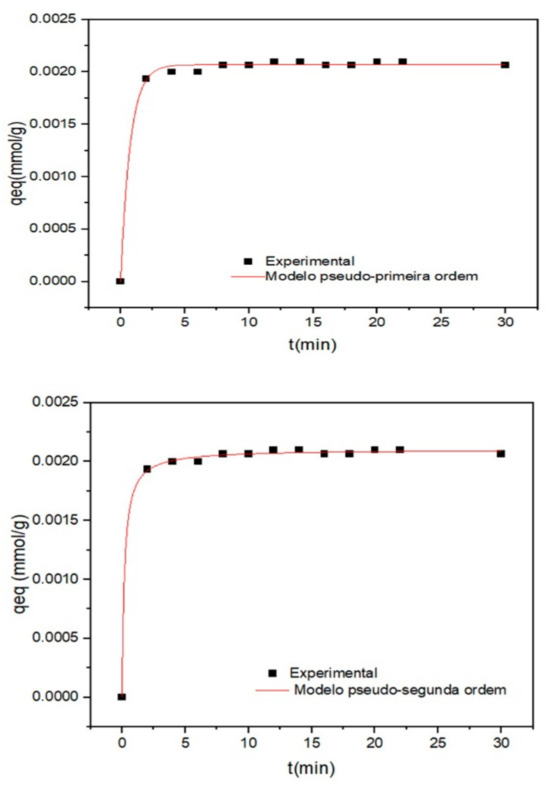
Figure 8.
Adsorption kinetics of chlorexidine onto organoclay, including nonlinear adjustments for PFO and PSO models.
Both kinetic models employed to evaluate the adsorption process exhibited a satisfactory alignment with the experimental data. This quality of fit is evidenced by the congruence between the experimental and modeled curves, as well as by the high coefficients of determination obtained, as detailed below.
Table 7 presents the parameters obtained for the kinetic fits of Cloisite 30B.
Table 7.
Parameters obtained for pseudo-first order and pseudo-second order models for kinetic tests.
An analysis of the determination coefficients (R2) presented in Table 7 indicates that, although the differences are subtle, the pseudo-second order (PSO) model offers the best fit to the experimental data. This model implies that the adsorption process involves electron sharing or exchange between the adsorbate and the adsorbent, suggesting a chemisorption mechanism in which chlorhexidine interacts with the active sites of the organoclay through electronic interactions.
Supporting this interpretation, previous studies investigating the adsorption of pharmaceutical compounds such as ibuprofen and ketoprofen onto porous carbonaceous materials have demonstrated the suitability of the pseudo-second order model for describing drug adsorption kinetics [46]. These kinetic findings reinforce the notion that the rate-limiting step is governed by the number of active sites available and the amount of chemical species adsorbed at equilibrium [47].
3.2.5. Adsorption Isotherms
Various isotherm models, namely Langmuir, Freundlich, Sips, Temkin, and Redlich–Peterson, were employed to investigate the interaction mechanisms between the drug and the surface of the organoclay. The corresponding equations underpinning these models are presented below as Equations (7)–(11) [48,49,50].
The Langmuir equation is as follows:
where qeq: the amount of drug adsorbed per gram of adsorbent at equilibrium (mg/g); qmax: the maximum adsorption capacity (mg/g); kL: the drug/organoclay interaction constant (L/mg); Ce: the drug concentration at equilibrium (mg/L).
Freundlich isotherm model:
where qeq: the amount of solute adsorbed (mg/g); Ce: the equilibrium concentration in the solution (mg/L); n: the constant related to surface heterogeneity; KF: the Freundlich adsorption capacity constant (mg/L), (L/g)−1.
Temkin isotherm model:
where A: the Temkin equilibrium constant (L/g); b: the Temkin equations constant (L/g); B: the constant of adsorption heat (J/mol).
Redlich–Peterson isotherm model:
where A: the Redlich–Peterson isotherm constant (L/g); B: the constant (L/mg); β: the exponent that lies between 0 and 1; Ce: the equilibrium liquid-phase concentration of the adsorbent (mg/L); qeq: the equilibrium adsorbate loading on the adsorbent (mg/g).
Sips isotherm model:
where qeq: the amount of drug adsorbed per gram of adsorbent at equilibrium (mg/g); qmax: the maximum adsorption capacity (mg/g); KS: the equilibrium constant (L/mg) γ; Ce: the drug concentration at equilibrium (mg/L); : the system heterogeneity parameter.
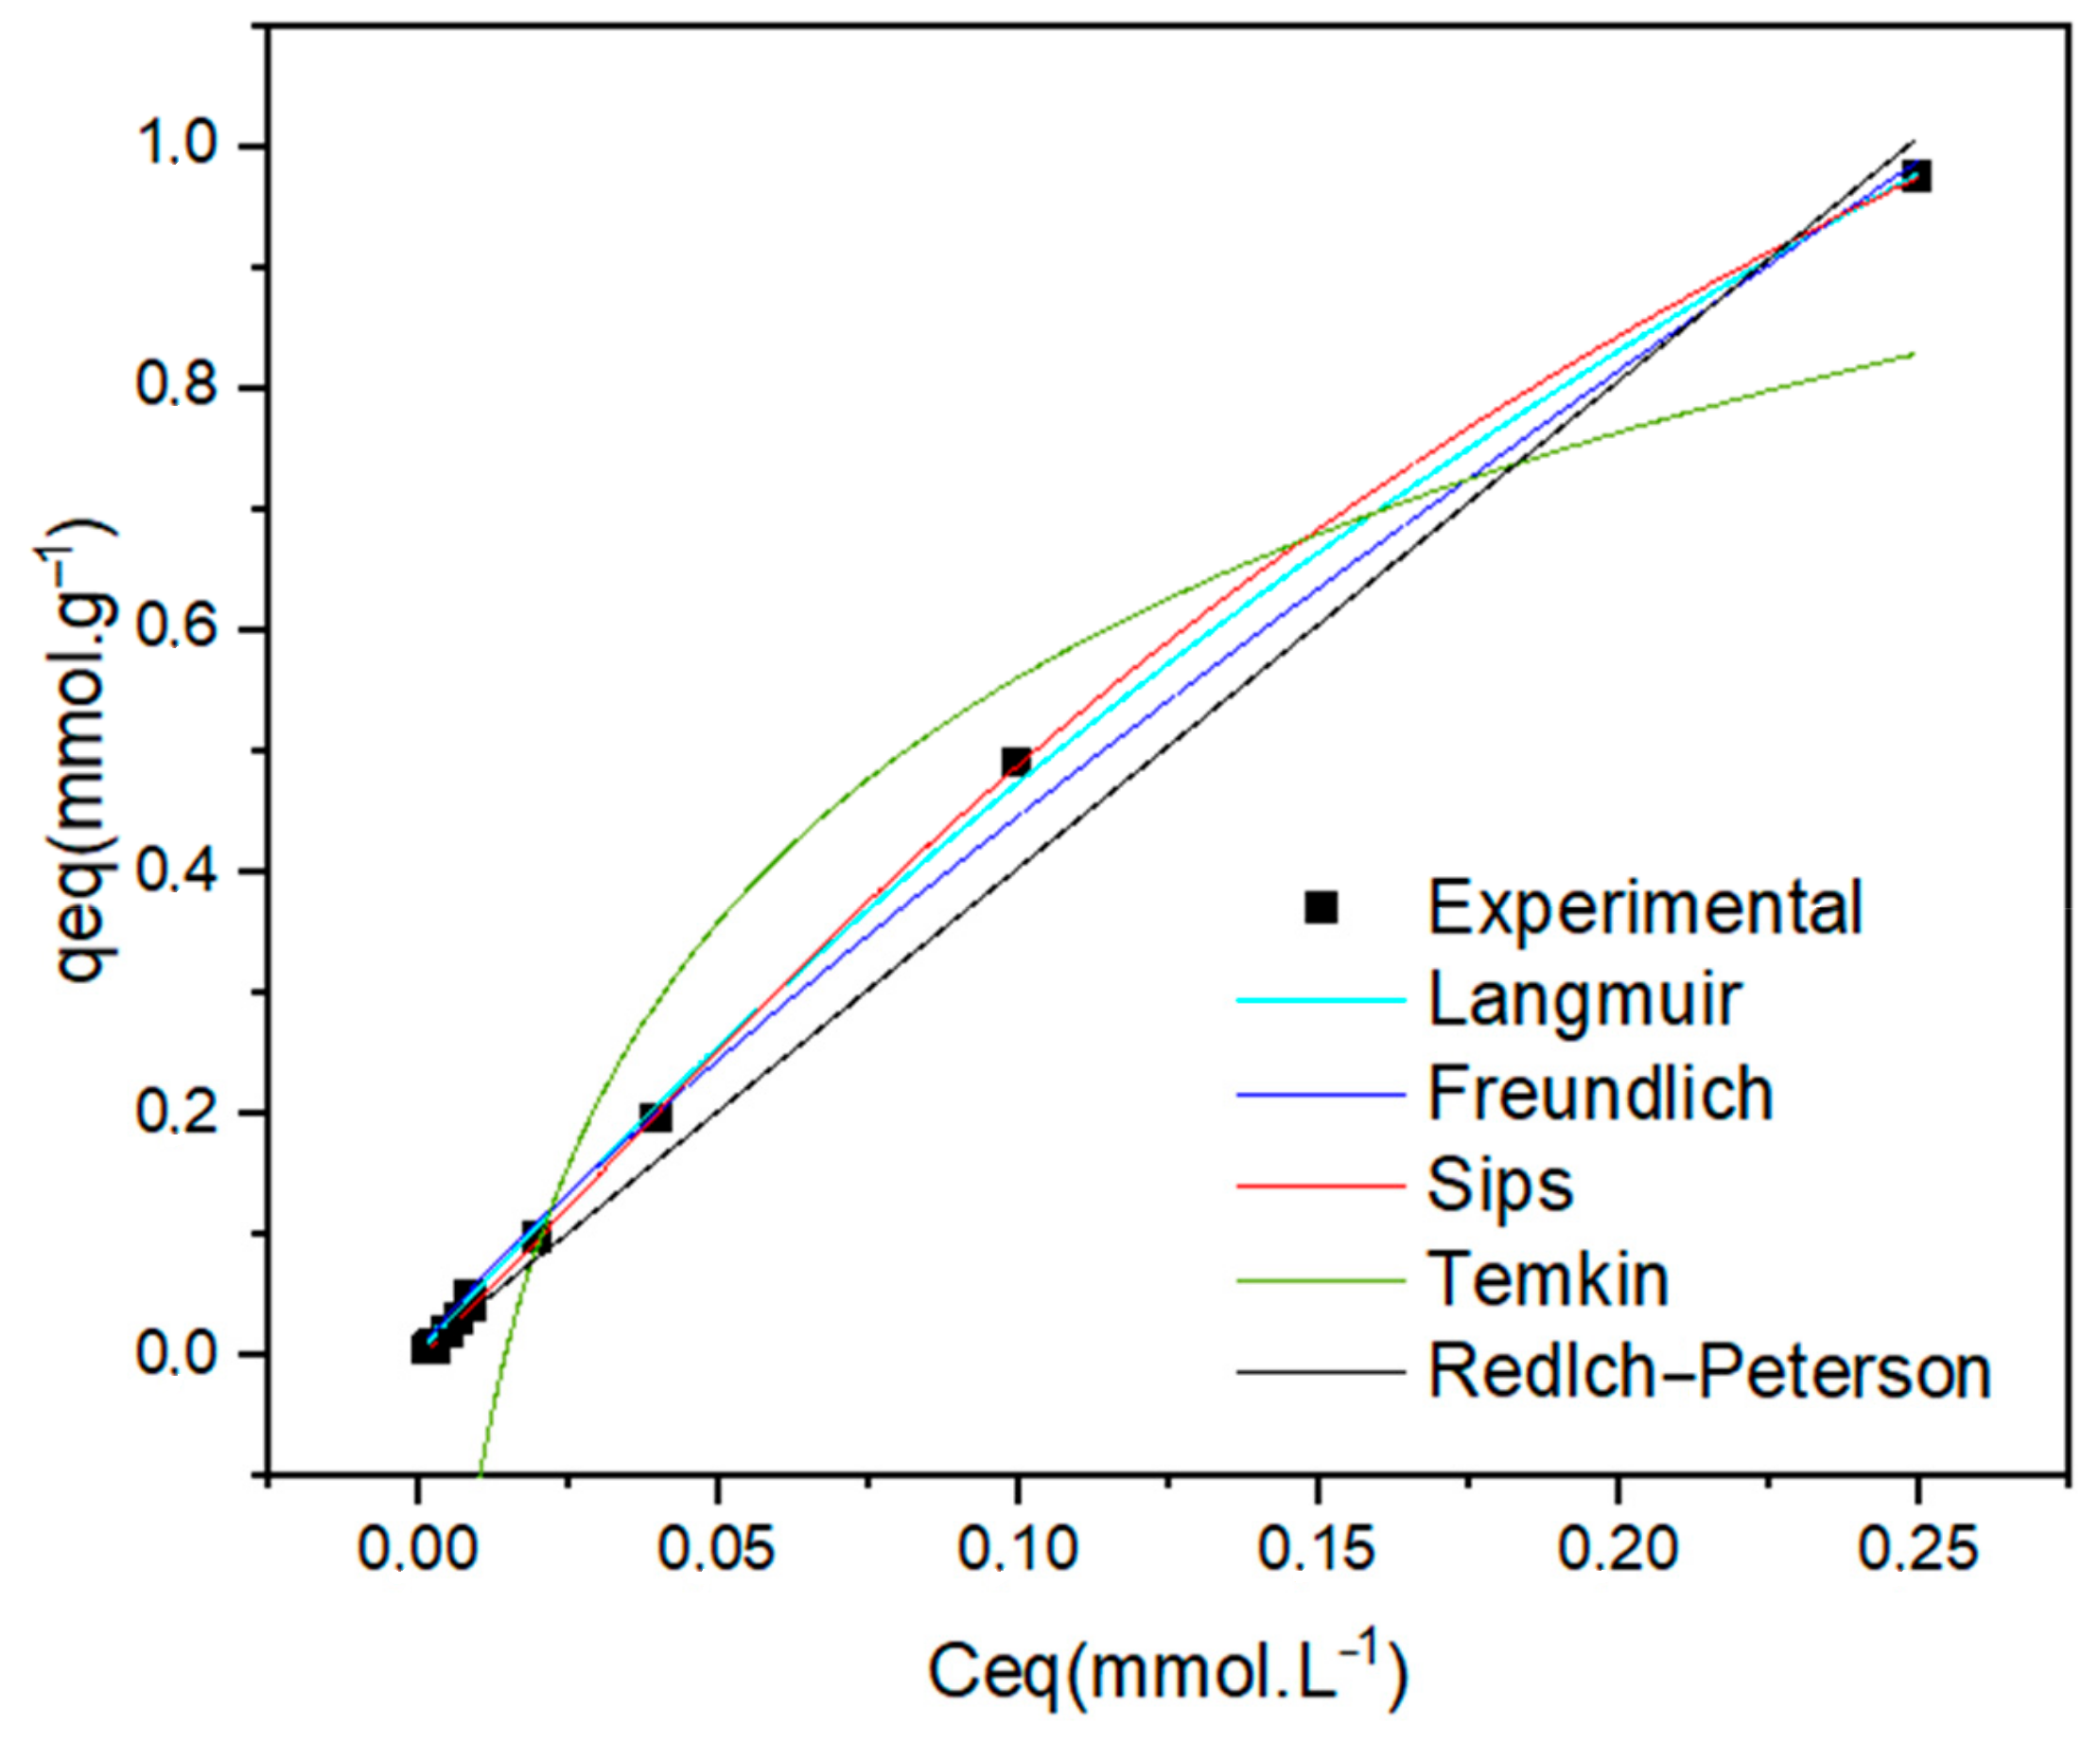
The behavior of the chlorhexidine adsorption system using organoclay in response to variations in drug concentration was assessed through the analysis of adsorption isotherm curves. The experimental data were fitted to nonlinear isotherm models, Langmuir, Freundlich, Sips, Temkin, and Redlich–Peterson, whose respective profiles are illustrated in Figure 9.
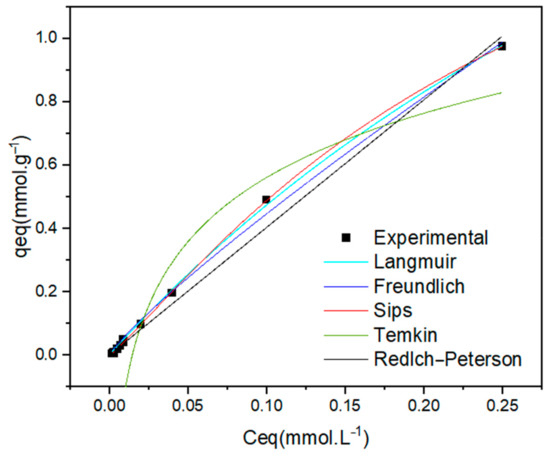
Figure 9.
Chlorhexidine adsorption isotherm and adjustment of nonlinear models of Langmuir, Freundlich, Sips, Temkin, and Redlich–Peterson. (Experimental conditions: 1.5 g, 25 °C; pH = 6; 200 rpm).
The adjustment parameters of the models, obtained by nonlinear regression using OriginPro software, version 8.0® (OriginLab Corporation, Northampton, MA, USA), are presented in Table 8.
Table 8.
Parameters obtained for nonlinear Langmuir, Freundlich, Temkin, Redlich–Peterson, and Sips equations for chlorhexidine.
The analysis of the experimental data revealed that the Sips isotherm model provided the best fit for chlorhexidine adsorption, exhibiting the highest coefficient of determination (R2 = 0.9998) and coming closest to unity out of all the models assessed. The excellent agreement of the Sips model underscores the heterogeneous nature of the adsorbent surface and indicates that the adsorption mechanism predominantly involves monolayer formation, wherein each active site accommodates a single adsorbate molecule [51,52].
Furthermore, the Sips model parameter n > 1n > 1, along with the separation factor RL within the range of 0 to 1, indicates that the adsorption of chlorhexidine onto the organoclay was favorable across the investigated concentration range. These parameters highlight the system’s high affinity and efficiency during drug removal, even at low initial concentrations, thereby reinforcing the potential of organoclay as an effective adsorbent for the remediation of aqueous solutions contaminated with bioactive compounds.
3.2.6. Efficacy of Adsorbents During Chlorhexidine Removal
In this study, organoclay was employed as a low-cost adsorbent, positioning itself as a more economically viable alternative to advanced materials such as ZIF-8 and Fe3O4@graphene nanoplatelet nanocomposites [53,54]. The adoption of organoclay enabled a notable reduction in overall process costs without significantly compromising adsorption performance under the defined operating conditions. To contextualize and benchmark the adsorption efficiency of the developed material, Table 9 provides a comparative overview of the maximum adsorption capacities (qmax) reported in the recent literature.
Table 9.
Efficacy of adsorbents during chlorhexidine removal.
Organoclay, a hybrid phyllosilicate material modified to gain organophilic properties, exhibited a modest adsorption capacity (qmax = 4.590 mg/g) under rapid equilibrium conditions (10 min). Its performance suggests strong potential for fast adsorption scenarios in low-concentration systems.
ZIF-8 (Zeolitic Imidazolate Framework-8), a metal–organic framework with intrinsic microporosity and high surface area, demonstrated superior performance with qmax = 30.96 mg/g. This highlights its structural affinity and adsorptive superiority under prolonged contact times (1 h), even at relatively low mass loading.
The Fe3O4@Graphene Nanocomposite, tailored for multi-pollutant removal, showed variable performance across different pharmaceutical contaminants. Its highest adsorption capacity was recorded for Diclofenac sodium (14.30 mg/g), underscoring its relevance in treating complex wastewater matrices with diverse emerging contaminants.
From a process engineering perspective, this comparative framework supports strategic decision-making during the design of advanced adsorption systems, particularly when balancing response time, adsorbent dosage, and target compound specificity. It underscores the necessity of aligning material selection with contaminant profiles and operational targets—a cornerstone in the customization of water purification solutions under emerging circular economy paradigms.
4. Conclusions
Adsorption was evaluated by multifactorial design, considering variables such as pH, contact time, dosage, and initial concentration. High removal efficiencies were obtained throughout the pH range (maximum of 95.77%), with rapid equilibrium and kinetic adjustment to the pseudo-second order model. The equilibrium data best fitted the Sips model, indicating surface heterogeneity and mono- and multilayer adsorption.
Organoclay showed advantages over conventional adsorbents, such as high efficiency, structural stability, and consistent performance under different conditions. Its scalable synthesis and tunable surface chemistry reinforce its potential for the removal of bioactive micropollutants such as chlorhexidine. Future studies should address regeneration, long-term stability, and life cycle analyses.
Author Contributions
Conceptualization, A.K.F.d.S.; methodology, A.K.F.d.S. and A.V.S.M.; validation, A.K.F.d.S.; formal analysis, A.K.F.d.S.; investigation, A.K.F.d.S.; resources, M.G.F.R.; data curation, A.K.F.d.S.; writing—original draft preparation, A.K.F.d.S. and A.V.S.M.; writing—review and editing, M.G.F.R., T.L.A.B. and W.B.R.; visualization, M.G.F.R.; supervision, M.G.F.R. and W.B.R.; project administration, M.G.F.R.; funding acquisition, M.G.F.R. All authors have read and agreed to the published version of the manuscript.
Funding
This research was funded by the Coordenação de Aperfeiçoamento de Pessoal de Nível Superior (CAPES) grant 88882.455464/2019-01 and the Conselho Nacional de Desenvolvimento Científico e Tecnológico (CNPq).
Data Availability Statement
The original contributions presented in this study are included in the article. Further inquiries can be directed to the corresponding author.
Acknowledgments
The authors express their sincere gratitude to the Conselho Nacional de Desenvolvimento Científico e Tecnológico (CNPq) and the Coordenação de Aperfeiçoamento de Pessoal de Nível Superior (CAPES) for their financial support. A.V.S.M. acknowledges funding from CNPq, and A.K.F.d.S. gratefully acknowledges support from CAPES. The authors also thank the Laboratory of Multifunctional Materials and Nanocomposites (LAMMEN-ECT/UFRN) for their valuable assistance with the FTIR analyses.
Conflicts of Interest
The authors declare no conflicts of interest.
References
- Liyanage, C.P.; Yamada, K. Impact of Population Growth on the Water Quality of Natural Water Bodies. Sustainability 2017, 9, 1405. [Google Scholar] [CrossRef]
- Damstra, T.; Barlow, S.; Bergman, A.; Kavlock, R.; Kraak, G. Global Assessment of the State-of-Science of Endocrine Disruptors; International Programme on Chemical Safety: Research Triangle Park, NC, USA, 2002. [Google Scholar]
- Romano, L.E. Desenvolvimento de Metodologia para Determinação de Diclofenaco em Águas Superficiais. Master’s Thesis, Universidade Estadual do Oeste do Paraná, Cascavel, Brazil, 2018. [Google Scholar]
- Singh, B.J.; Chakraborty, A.; Sehgal, R. A systematic review of industrial wastewater management: Evaluating challenges and enablers. J. Environ. Manag. 2023, 348, 119230. [Google Scholar] [CrossRef] [PubMed]
- Silva, J.A. Advanced Oxidation Process in the Sustainable Treatment of Refractory Wastewater: A Systematic Literature Review. Sustainability 2025, 17, 3439. [Google Scholar] [CrossRef]
- Yacouba, Z.A.; Mendret, J.; Lesage, G.; Zaviska, F.; Brosillon, S. Removal of organic micropollutants from domestic wastewater: The effect of ozone-based advanced oxidation process on nanofiltration. J. Water Process Eng. 2021, 39, 101869. [Google Scholar] [CrossRef]
- Zhao, X.; Zheng, M.; Gao, X.; Zhang, J.; Wang, E.; Gao, Z. The application of MOFs-based materials for antibacterials adsorption. Coord. Chem. Rev. 2021, 440, 213970. [Google Scholar] [CrossRef]
- Jagtap, S.; Yenkie, M.K.; Labhsetwar, N.; Rayalu, S. Fluoride in drinking water and defluoridation of water. Chem. Rev. 2012, 112, 2454–2466. [Google Scholar] [CrossRef]
- Guo, Y.X.; Liu, J.H.; Gates, W.P.; Zhou, C.H.C. Organo-Modification of Montmorillonite. Clays Clay Miner. 2021, 68, 601–622. [Google Scholar] [CrossRef]
- Wei, R.; Mo, Y.; Fu, D.; Liu, H.; Xu, B. Organo-Montmorillonite Modified by Gemini Quaternary Ammonium Surfactants with Different Counterions for Adsorption toward Phenol. Molecules 2023, 28, 2021. [Google Scholar] [CrossRef]
- Perelomov, L.; Gertsen, M.; Burachevskaya, M.; Hemalatha, S.; Vijayalakshmi, A.; Perelomova, I.; Atroshchenko, Y. Organoclays Based on Bentonite and Various Types of Surfactants as Heavy Metal Remediants. Sustainability 2024, 16, 4804. [Google Scholar] [CrossRef]
- Mahmoudian, M.; Abdali, A.; Eskandarabadi, S.M.; Nozad, E.; Enayati, M. The performance of an efficient polymer and Cloisite 30B derivatives in the adsorption desulfurization process. Polymer Bull. 2021, 78, 795–812. [Google Scholar] [CrossRef]
- Kausar, A.; Ahmad, I.; Aldaghri, O.; Ibnaouf, K.H.; Eisa, M.H. Nanoclay-Reinforced Nanocomposite Nanofibers—Fundamentals and State-of-the-Art Developments. Minerals 2023, 13, 817. [Google Scholar] [CrossRef]
- Sousa, A.K.F. Remoção de Fármacos por Adsorção Utilizando Argila Organofílica Comercial (Cloisite 30B). Ph.D. Thesis, Universidade Federal de Campina Grande, Campina Grande, Brazil, 2023. [Google Scholar]
- Yu, F.; Ma, J.; Wang, J.; Zhang, M.; Zheng, J. Magnetic Iron Oxide Nanoparticles Functionalized Multi-walled Carbon Nanotubes for Toluene, Ethylbenzene and Xylene Removal from Aqueous Solution. Chemosphere 2016, 146, 162–172. [Google Scholar] [CrossRef] [PubMed]
- Bagdonavicius, V.; Nikulin, M.S. Chi-squared goodness-of-fit test for right censored data. Int. J. App. Math. Stat. 2011, 24, 1–11. [Google Scholar]
- Guedidi, H.; Reinert, L.; Soneda, Y.; Bellakhal, N.; Duclaux, L. Adsorption of ibuprofen from aqueous solution on chemically surface-modified activated carbon cloths. Arab. J. Chem. 2017, 10, S3584–S3594. [Google Scholar] [CrossRef]
- Serafin, J.; Dziejarski, B. Application of isotherms models and error functions in activated carbon CO2 sorption processes. Micropor. Mesopor. Mater. 2023, 354, 112513. [Google Scholar] [CrossRef]
- Martín-Lara, M.A.; Blázquez, G.; Calero, M.; Almendros, A.I.; Ronda, A. Binary biosorption of copper and lead onto pine cone shell in batch reactors and in fixed bed columns. Int. J. Miner. Process. 2016, 148, 72–82. [Google Scholar] [CrossRef]
- Leite, I.F.; Raposo, C.M.O.; Silva, S.M.L. Caracterização estrutural de argilas bentoníticas nacional e importada: Antes e após o processo de organofilização para utilização como nanocargas. Cerâmica 2008, 54, 303–308. [Google Scholar] [CrossRef]
- Strankowska, J.; Piszczyk, Ł.; Strankowski, M.; Danowska, M.; Szutkowski, K.; Jurga, S.; Kwela, J. Molecular dynamics studies of polyurethane nanocomposite hydrogels. Eur. Phys. J. Spec. Top. 2013, 222, 2179–2186. [Google Scholar] [CrossRef]
- Patrício, A.C.L.; Da Silva, M.M.; De Sousa, A.K.F.; Mota, M.F.; Rodrigues, M.G.F. SEM, XRF, XRD, nitrogen adsorption, fosters swelling and capacity adsorption Characterization of Cloisite 30 b. Mater. Sci. Forum 2012, 727–728, 1591–1595. [Google Scholar] [CrossRef]
- Wang, C.C.; Juang, L.C.; Lee, C.K.; Hsu, T.C.; Lee, J.F.; Chao, H.P. The effects of exchanged cation, compression, heating and hydration on textural properties of bulk bentonite and its corresponding purified montmorillonite. J. Colloid Interface Sci. 2004, 280, 27–35. [Google Scholar] [CrossRef]
- Xi, Y.; Ding, Z.; He, H.; Frost, R.L. Structure of organoclays—An X-ray diffraction and thermogravimetric analysis study. J. Colloid Interface Sci. 2004, 277, 116–120. [Google Scholar] [CrossRef] [PubMed]
- Lagaly, G.; Weiss, A. Determination of the layer charge in mica-type layer silicates. In Proceedings of the International Clay Conference, Tokyo, Japan, 5–10 September 1969; pp. 61–80. [Google Scholar]
- Bora, M.; Ganguli, J.N.; Dutta, D.K. Thermal and spectroscopic studies on the decomposition of [Ni{di(2-aminoethyl)amine}2]- and [Ni(2,2′:6′,2″-terpyridine)2]-Montmorillonite intercalated composites. Thermochim. Acta 2000, 346, 169–175. [Google Scholar] [CrossRef]
- Ghosh, K.; Gaikwad, L.V.; Kalal, R.K.; Kulkarni, P.A.; Kumar, A.; Banerjee, S.; Gupta, M. Light weight HTPB-clay nanocomposites (HCN) with enhanced ablation performance as inhibition materials for composite propellant. Def. Technol. 2020, 17, 559–570. [Google Scholar] [CrossRef]
- Madejová, J. FTIR techniques in clay mineral studies. Vib. Spectrosc. 2003, 31, 1–10. [Google Scholar] [CrossRef]
- Xi, Y.; Ding, Z.; He, H.; Frost, R.L. Infrared spectroscopy of organoclays synthesized with the surfactant octadecyltrimethylammonium bromide. Spectrochim. Acta Part A Mol. Biomol. Spectrosc. 2004, 61, 515–525. [Google Scholar] [CrossRef]
- Kozak, M.; Domka, L. Adsorption of the quaternary ammonium salts on montmorillonite. J. Phys. Chem. Solids 2003, 65, 441–445. [Google Scholar] [CrossRef]
- Mendioroz, S.; Pajares, J.A.; Benito, I.; Pesquera, C.; Gonzalez, F.; Blanco, C. Texture evolution of montmorillonite under progressive acid treatment: Change from H3 to H2 type of hysteresis. Langmuir 1987, 3, 676–681. [Google Scholar] [CrossRef]
- Madejová, J.; Janek, M.; Komadel, P.; Herbert, H.-J.; Moog, H.C. FTIR analyses of water in MX-80 bentonite compacted from high salinary salt solution systems. Appl. Clay Sci. 2002, 20, 255–271. [Google Scholar] [CrossRef]
- Bernal, V.; Erto, A.; Giraldo, L.; Moreno-Piraján, J.C. Effect of Solution pH on the Adsorption of Paracetamol on Chemically Modified Activated Carbons. Molecules 2017, 22, 1032. [Google Scholar] [CrossRef]
- Brown, C.E. Coefficient of variation. In Springer eBooks; Springer: Berlin/Heidelberg, Germany, 1998; pp. 155–157. [Google Scholar] [CrossRef]
- Khare, V.; Khare, C.; Nema, S.; Baredar, P. Data visualization and descriptive statistics of solar energy system. In Elsevier eBooks; Springer: Berlin/Heidelberg, Germany, 2022; pp. 33–75. [Google Scholar] [CrossRef]
- Cottis, R.A. Electrochemical noise for corrosion monitoring. In Elsevier eBooks; Springer: Berlin/Heidelberg, Germany, 2021; pp. 99–122. [Google Scholar] [CrossRef]
- Nazari, G.; Abolghasemi, H.; Esmaieli, M. Batch adsorption of cephalexin antibiotic from aqueous solution by walnut shell-based activated carbon. J. Taiwan Inst. Chem. Eng. 2015, 58, 357–365. [Google Scholar] [CrossRef]
- Pouretedal, H.R.; Sadegh, N. Effective removal of Amoxicillin, Cephalexin, Tetracycline and Penicillin G from aqueous solutions using activated carbon nanoparticles prepared from vine wood. J. Water Process Eng. 2014, 1, 64–73. [Google Scholar] [CrossRef]
- Sadaf, S.; Bhatti, H.N. Batch and fixed bed column studies for the removal of Indosol Yellow BG dye by peanut husk. J. Taiwan Inst. Chem. Eng. 2013, 45, 541–553. [Google Scholar] [CrossRef]
- Gkika, D.A.; Tolkou, A.K.; Katsoyiannis, I.A.; Kyzas, G.Z. The Adsorption-Desorption-Regeneration pathway to a circular economy: The role of waste-derived adsorbents on chromium removal. Sep. Purif. Technol. 2025, 368, 132996. [Google Scholar] [CrossRef]
- Karimi, M.; Shirzad, M. Sustainable industrial process design for derived CO2 adsorbent from municipal solid wastes: Scale-up, techno-economic and parametric assessment. Sustain. Mater. Technol. 2024, 41, e01091. [Google Scholar] [CrossRef]
- Ozcan, D.O.; Hendekci, M.C.; Ovez, B. Enhancing the adsorption capacity of organic and inorganic pollutants onto impregnated olive stone derived activated carbon. Heliyon 2024, 10, e32792. [Google Scholar] [CrossRef]
- Alkhaldi, H.; Alharthi, S.; Alharthi, S.; AlGhamdi, H.A.; AlZahrani, Y.M.; Mahmoud, S.A.; Amin, L.G.; Al-Shaalan, N.H.; Boraie, W.E.; Attia, M.S.; et al. Sustainable polymeric adsorbents for adsorption-based water remediation and pathogen deactivation: A review. RSC Adv. 2024, 14, 33143–33190. [Google Scholar] [CrossRef]
- Lagergren, S.K. About the theory of so-called adsorption of soluble substances. Sven Vetenskapsakad Handingarl 1898, 24, 1–39. [Google Scholar]
- Ho, Y.S.; Mckay, G. Pseudo-second order model for sorption processes. Process Biochem. 1999, 34, 451–465. [Google Scholar] [CrossRef]
- Streit, A.F.M.; Collazzo, G.C.; Druzian, S.P.; Verdi, R.S.; Foletto, E.L.; Oliveira, L.F.S.; Dotto, G.L. Adsorption of ibuprofen, ketoprofen, and paracetamol onto activated carbon prepared from effluent treatment plant sludge of the beverage industry. Chemosphere 2020, 262, 128322. [Google Scholar] [CrossRef]
- Ho, Y.S.; Mckay, G. Kinetic Models for the Sorption of Dye from Aqueous Solution by Wood. Process Saf. Environ. Prot. 1998, 76, 183–191. [Google Scholar] [CrossRef]
- Bulut, E.; Ozacar, M.; Sengil, I.A. Adsorption of malachite green onto bentonite: Equilibrium and kinetic studies and process design. Microporous Mesoporous Mater. 2008, 115, 234–246. [Google Scholar] [CrossRef]
- Ayawei, N.; Ebelegi, A.N.; Wankasi, D. Modelling and Interpretation of Adsorption Isotherms. J. Chem. 2017. [Google Scholar] [CrossRef]
- Sadeghalvad, B.; Khosravi, S.; Azadmehr, A.R. Nonlinear Isotherm and Kinetics of Adsorption of Copper from Aqueous Solutions on Bentonite. Russ. J. Phys. Chem. A 2016, 90, 2285–2291. [Google Scholar] [CrossRef]
- Ruthven, D.M. Principles of Adsorption & Adsorption Process; John Wiley Sons: Hoboken, NJ, USA, 1984. [Google Scholar]
- Sips, R. On the Structure of a Catalyst Surface. J. Chem. Phys. 1948, 16, 490–495. [Google Scholar] [CrossRef]
- Oliveira, H.M.F.; Silva, A.S.; Barbosa, T.L.A.; Rodrigues, M.G.F. Sustainable Synthesis of Zeolitic Imidazolate Framework-8 Nanoparticles and Application in the Adsorption of the Drug Chlorhexidine. Catal. Res. 2023, 3, e2301012. [Google Scholar] [CrossRef]
- Al-Khateeb, L.A.; Hakami, W.; Salam, M.A.; Sanari, J.A.; El-Shaheny, R.; El-Maghrabey, M. Solid phase-fabrication of magnetically separable Fe3O4@graphene nanoplatelets nanocomposite for efficient removal of NSAIDs from wastewater. Perception of adsorption kinetics, thermodynamics, and extra-thermodynamics. Anal. Chim. Acta 2022, 1223, 340158. [Google Scholar] [CrossRef]
Disclaimer/Publisher’s Note: The statements, opinions and data contained in all publications are solely those of the individual author(s) and contributor(s) and not of MDPI and/or the editor(s). MDPI and/or the editor(s) disclaim responsibility for any injury to people or property resulting from any ideas, methods, instructions or products referred to in the content. |
© 2025 by the authors. Licensee MDPI, Basel, Switzerland. This article is an open access article distributed under the terms and conditions of the Creative Commons Attribution (CC BY) license (https://creativecommons.org/licenses/by/4.0/).