Abstract
This study links the traditional use of celery (Apium graveolens L.) and parsley (Petroselinum crispum L.) roots in Balkan cuisine and herbal medicine, along with the longstanding role of turmeric (Curcuma longa L.) rhizome in Ayurvedic and Asian medicinal practices, with modern technological approaches to develop a functional food formulation. A series of blend variations were evaluated for total phenolic content, antioxidant capacity, and sensory quality. The incorporation of turmeric significantly enhanced the antioxidant potential of celery–parsley mixtures. Celery–parsley–turmeric root blend (CPT6), comprising equal parts, was identified as optimal, exhibiting high total phenolic content (9.56 mg gallic acid equivalent/g), strong antioxidant activities, and a favourable sensory profile rated as “very good” (3.58 average score). CPT6 further demonstrated promising biofunctional properties, including potent α-amylase and α-glucosidase inhibition activities (72% and 80%, respectively), alongside moderate antihypertension activity (ACE) (62%) and hydroxymethylglutaryl coenzyme A (HMG-CoA) reductase inhibition (55%). Chemometric analyses (PCA) and machine learning modelling (ANN) confirmed the significant role of turmeric proportion in enhancing both bioactivity and consumer acceptability. This research highlights the synergy between tradition and technology in creating novel, multifunctional food ingredients suited for functional food and nutraceutical applications.
Keywords:
celery; parsley; turmeric; roots; bioactivity; sensory profile; chemometric; machine learning modelling 1. Introduction
Spices constitute a distinct category of food products that play a significant role in human nutrition. Although they are consumed in relatively small quantities, due to their pronounced sensory properties, which include strong flavour, aroma, and occasionally colour, they are widely incorporated into various foods and culinary preparations, occupying a unique place within the food industry. Even small amounts can have a significant impact on a dish’s overall sensory profile, influencing not just taste but also aroma and appearance. Instead of overpowering the primary ingredients, their use aims to enhance or complement their natural qualities. Excessive use can lead to sensory imbalance or undesired flavour masking. Beyond their individual use, spices are frequently combined into blends tailored to accommodate diverse tastes and complement specific dishes.
Turmeric (Curcuma longa L.) has been utilised for various purposes since ancient times. In culinary applications, it serves as a popular spice, valued for its flavour-enhancing and colouring properties. Its use is particularly prominent in South Asian cuisine, where it is a key component of curry powder. In Western cuisine, it finds application in sauces, mustard blends, and pickled products. Additionally, turmeric tea is widely consumed in some areas of Japan [1]. The rhizome of turmeric is rich in bioactive compounds, primarily curcumin (70–75%), demethoxycurcumin (10–25%), and bisdemethoxycurcumin (5–10%), all of which belong to the class of phenolic compounds. These constituents are not only responsible for turmeric’s distinctive yellow colour but also exhibit variability in composition depending on soil conditions, geographic origin, and processing methods [2]. Furthermore, the turmeric rhizome demonstrates significantly higher levels of phenolic compounds and antioxidant activity compared to celery root (Apium graveolens L.) and parsley root (Petroselinum crispum L.) [3,4].
Celery root, knob celery, turnip rooted celery or celeriac (Apium graveolens L.) is a strain of celery and native to Europe and parts of Asia. It is found growing wild in all temperate zones. It is much better for flavouring in general cookery and for eating as a cooked vegetable. The plant produces a large, beet-like root, which is used as a vegetable and spice; the stem and leaves are discarded. In ancient times, the plant was cultivated as a medicinal crop, and it has only recently been used as a food source [5]. Parsley (Petroselinum crispum L.) is predominantly cultivated in temperate and subtropical regions of Europe and western Asia, including the Mediterranean. Its leaves, seeds, and roots, harvested from specific plant varieties, are extensively utilised in culinary applications [6].
Spices have been recognised for a long time for their medicinal properties, functioning as tonics, carminatives, antispasmodics, antihelmintics, and many other purposes [7]. They are known as a rich source of phytochemicals, including phenolic compounds, carotenoids, sterols, glucosinolates, and sulphur-containing compounds [8]. Among these, polyphenols—a diverse group of secondary plant metabolites—hold particular significance. Polyphenols are categorised into several classes, such as phenolic acids, flavonoids (including flavonols, flavones, flavanols, and proanthocyanidins), stilbenes, and lignans. These compounds offer numerous health benefits, notably exhibiting antioxidant, anticancer, antimutagenic, antimicrobial, and other bioactive properties [9].
Celery and parsley roots have traditionally been utilised as spices in the culinary practices of countries on the Balkan Peninsula. At the same time, turmeric rhizomes are commonly employed in Asian and South American cuisines. Based on the above, it is expected that the addition of turmeric will significantly enhance both the antioxidant potential and the sensory profile of celery and parsley, whether used individually or in combination. The combination of the aforementioned spices may yield a novel formulation with superior biological properties, especially enhanced antioxidant capacity. Such a product could serve various applications, including usage as a spice, tea blend, dietary supplement, and more. In this context, the objective of this study was to optimise the antioxidant potential and sensory attributes of a blend comprising these herbs, enhance the nutritional value of the celery and parsley roots mixture by the addition of turmeric, and analyse the composition of the final product. Furthermore, based on the data obtained on the polyphenolic content and antioxidant activity of individual samples and their combinations with other herbs, it will be possible to evaluate the presence of interaction effects, specifically whether there is a significant enhancement in these parameters. In their study, Hossain et al. [10] demonstrated a synergistic effect in a spice mixture containing celery, parsley, thyme, basil, sage, and turmeric, as evidenced by a higher total phenolic content compared to the sum of individual samples. In contrast, this effect was not observed in a mixture composed of celery, parsley, thyme, basil, and sage, without turmeric.
Previous studies have separately assessed the bioactivity of turmeric rhizomes, parsley, or celery roots. In contrast, this research pioneers the optimisation of a multi-root functional spice blend by simultaneously considering its antioxidant, sensory, and health-promoting functional properties through advanced chemometric and machine learning modelling.
2. Materials and Methods
2.1. Plant Material
For this study, celery and parsley root samples were sourced from a local market, while turmeric rhizome samples were purchased from a health food store. All samples were collected in Banja Luka, Bosnia and Herzegovina (44°46′ N, 17°11′ E). The preparation and drying of the celery and parsley roots, as well as the turmeric rhizomes, were carried out following previously established methods [11]. Briefly, celery root samples were dried in a convective oven dryer at 90 °C, while parsley roots and turmeric rhizomes were dried using the freeze-drying method. The samples were dried to a moisture content of less than 13%. These samples were utilised to create various formulations as defined by the experimental design (DOE).
2.2. Experimental Design
A Simplex-Lattice design was used for the experimental design of the component blends. In this design, a three-component blend was considered, with each component having four equally spaced levels (i.e., 0, 0.333, 0.667, and 1). The possible blends of the three components with these proportions create a 3 × 3 simplex-lattice, resulting in the 10 blending coordinates (Table 1).

Table 1.
Blends of the three components used in the experiment.
2.3. Determination of the Chemical Composition of Samples
Chemical composition of samples was determined according to standard AOAC methods [12]: crude proteins (AOAC 920.87, , crude fat by Soxhlet method (AOAC 945.16), and ash content (AOAC 923.03). All results are expressed on g/100 g of sample (%).
2.4. Analysis of Sensory Compliance Quality and Descriptive Sensory Analysis
2.4.1. Preparation of Samples for Sensory Analysis
Aqueous extracts of samples (CO, PO, and TO) were prepared by heating 2.50 g of powdered sample in 1000 mL of water at 70 °C for 30 min [13]. These aqueous extracts were utilised to prepare experimental samples with varying mass fractions of plant materials, as shown in Table 2.
Table 2.
Content of each plant component in aqueous extract (g/100 mL).
Twenty millilitres of each sample were transferred into coded glass bottles (200 mL volume) with screw caps and served at room temperature, leaving sufficient headspace to permit equilibrium of vapour pressure and evaporation of aromatic components from the tested sample, as well as enough space for individual sensory analysis. All samples were prepared on the same day when the sensory analysis was performed to ensure the freshness of the samples. The procedure allowed evaluators to use reference solutions of 0.08% celery, parsley, and turmeric, as the lowest concentrations of samples used during sensory analysis. Each evaluator was provided with reference samples alongside a set of test samples, with the evaluation process carried out without replication.
The number of participants for establishing products’ sensory profile was determined according to the ISO 13299 Standard [14], which recommends that a descriptive panel have 8 to 12 trained assessors. Participants in the sensory analysis were 12 students and staff (10 female and 2 male) from the Faculty of Technology, University of Banja Luka (FT.UNIBL), Bosnia and Herzegovina. They were selected assessors and trained according to prescribed standard procedures for carrying out descriptive analysis [14,15,16,17].
2.4.2. Sensory Analysis
Sensory evaluation of celery, parsley, and turmeric powders, as well as their blends, was analysed using a descriptive method to compare their quality. Key attributes (smell and aroma, taste, and mouthfeel) were analysed based on the identified intensity. At the same time, the intensities of taste modalities (sweet, salty, sour, and bitter) and mouthfeel (bland, refreshing/cooling, stinging, metallic impression, astringent) were also evaluated. The scores for the intensity of key attributes ranged from 5 (very intensive) to 1 (very mild). The compliance of the sensory quality of smell, aroma, and taste of the samples (products) was evaluated in the range from 5 (excellent) to 1 (poor).
The assessment was carried out in individual sensory booths under prescribed conditions [18] in the Laboratory for Sensory Analysis of Food at FT.UNIBL. Assessors worked in groups of 4 or 5 assessors.
The set of key product’s sensory attributes, for experimental purposes, was prepared based on preliminary sensory analysis of samples and using literature data [13,19,20,21].
The procedure defined the order of sample delivery and individual sensory analysis, including reference solutions of celery, parsley, and turmeric; CP7 and CP9; CT8 and CT5; PT3 and PT2; CPT6; and CO, PO, and TO. The analysis of the 10-sample set lasted approximately 1 h, with shorter breaks for the assessors’ rest. The evaluators were provided with white paper napkins, a glass of drinking water (from the public supply, 20–23 °C), a spittoon, a pen, a specially designed evaluation sheet (File S1), and detailed assessment instructions (File S2). Odour analysis was conducted using the retronasal method. The retronasal method of assessing odour was realised following the standard procedure by ingesting an aqueous solution. Panellists were instructed to take 5–10 mL of the tested sample into the mouth with a tablespoon, and to analyse the sample odour, keeping the sample in a closed mouth. White bread and drinking water were used to refresh the palate and restore sensory perception. Quality assessments and rating of key products’ sensory attributes included: colour and shade of colour; smell and aroma (retronasal method); taste and mouthfeel. The selected sensory characteristics for the samples were described by the appropriate attributes, and the intensity by descriptors for which appropriate codes were assigned, as presented in the instructions for assessment (File S2), for easier recording in the evaluation sheet (File S1).
2.5. Determination of Sample Colour
The colour of the samples was measured in triplicate using the Minolta Chroma metre CR-400 (Konica Minolta Sensing Inc., Tokyo, Japan) equipped with the CR-A50 adapter designed for powder sample analysis. The measurements were conducted under D-65 standard illumination, with a 2° standard observer viewing angle and an 8 mm diameter contact surface. Before measurements, the instrument was calibrated using a white reference standard. The colour parameters were recorded following the CIELab colour system (CIE, 1976), which includes L* (lightness, ranging from 0 for black to 100 for white), a* (the red/green axis, where positive values indicate red and negative values indicate green), b* (the yellow/blue axis, where positive values indicate yellow and negative values indicate blue). Additionally, colour saturation (C*, chroma) and the hue angle (h) were determined to provide a comprehensive assessment of colour characteristics.
2.6. Mineral Composition
Wet digestion of the sample in a microwave digestion device (Start D, Milestone, Sorisole (BG), Italy) was performed using a mixture of 67% nitric acid (6–7 mL) and 30% hydrogen peroxide (2 mL). The content of different minerals was determined using atomic emission spectrometry (ICP-OES), using an OPTIMA 8000 instrument (Perkin Elmer, Waltham, MA, USA). The calibration of the instrument was performed using the Instrument Calibration Standard 2 (Perkin Elmer, USA). All the chemicals and reagents used were of analytical grade. The results are expressed in milligrams of mineral per kilogram of sample (mg/kg).
2.7. Extraction Process
Dried celery, parsley, and turmeric samples were ground in a laboratory mill (Knifetec 1095 Sample Mill, Foss A/S, Hillerød, Denmark), and blends of samples were made according to Table 1. Five grams of powder were mixed with 50 mL of 80% ethanol in the ratio of 1:10 (w/v). After that, the solution was ultrasonicated (WUC-A03H, Witeg Labortechnik, Wertheim, Germany) for 90 min [22] and filtered through Whatman no. 4 (Sigma-Aldrich Chemie GmbH, Taufkirchen, Germany) in a volumetric flask and filled with solvent up to 50 mL. The liquid extract was wrapped with aluminium foil and kept at 4 °C until analysis. To evaluate the antimicrobial, antidiabetic, antihypertensive, and antihypercholesterolemic activities of the CPT6 sample, the liquid extract was evaporated under reduced pressure at a temperature not exceeding 40 °C and then dried in a vacuum desiccator until a constant weight was achieved.
2.8. Total Phenolics (TP) Content
The total phenolic content of the samples was determined spectrophotometrically using the Folin–Ciocalteu method [23]. Briefly, 1.5 mL of 0.2 N Folin–Ciocalteu reagent, 1.5 mL of 7.5% NaHCO3, and 0.2 mL of extract solution were mixed. After vortexing and half an hour at room temperature in a dark place, the absorbance was measured at 765 nm (JenWay 6305, Beacon Road, Stone, Staffordshire, UK) with a blank test. A standard curve was prepared with gallic acid, and the results are expressed as milligrams of gallic acid equivalents per gram of sample (mg GAE/g).
2.9. Antioxidant Activity Tests
The antioxidant activities were assessed using 2,2-diphenyl-1-picrylhydrazyl (DPPH), 2,2′-azino-bis-(3-ethylbenzothiazoline-6-sulphonic acid (ABTS), and FRAP tests. The ability of the samples to scavenge DPPH radicals was evaluated using the method described by Liyana-Pathirana and Shahidi [24]. The results are expressed as micromoles of Trolox equivalents per gram of sample (μmol Trolox/g). For the calibration curve, Trolox is used in a concentration range of 4.99–79.90 μmol/L. The ability to scavenge ABTS radicals was assessed following the method of Re et al. [25]. The results are expressed in μmol Trolox/g. For the calibration curve, Trolox is used in a concentration range of 0.99884–15.98144 μmol/L. Finally, the FRAP assay was conducted as described by Benzie and Strain [26]. The results are expressed as micromoles of ferrous ion equivalents per gram of sample (μmol Fe2+/g).
2.10. HPLC Analysis
Quantification was performed using external standards for individual phenolic compounds (e.g., gallic acid, caffeic acid, ferulic acid, p-coumaric acid, and apigenin), with calibration curves constructed for each (R2 > 0.99). The extraction of phenolic compounds from the plant blend was carried out using 80% ethanol (v/v) in a 1:10 (w/v) ratio. This extract was used for subsequent HPLC analysis. Chromatographic separation was conducted using a binary solvent system: mobile phase A (acetonitrile) and mobile phase B (1% formic acid in water), with a linear gradient as follows: 0–10 min: 10–25% A; 10–20 min: 25–60% A; 20–30 min: 60–70% A. The column was re-equilibrated at initial conditions for 10 min. The flow rate was set at 1 mL/min. Quantification of individual phenolic compounds in a selected blend of aromatic root herbs was performed by high-resolution liquid chromatography (High-Performance Liquid Chromatography, HPLC) on Shimadzu Prominence equipment (Shimadzu, Kyoto, Japan), which contains an LC-20AT binary pump, CTO-20A thermostat, and SIL-20A automatic dispenser connected to a DAD detector. The separation was performed on a Luna C-18 RP column, 5 µm and 250 × 4.6 mm (Phenomenex, Torrance, CA, USA), which was protected by a C18 precolumn, 4 × 30 mm (Phenomenex, Torrance, CA, USA). The column was equilibrated to the initial condition of 10% A for 10 min, with an additional 5 min for stabilisation. All samples and solvents were filtered before analysis through 0.45 µm pore size membrane filters (Millipore, Bedford, MA, USA). Results are presented in micrograms of individual phenolic compounds per 100 g of sample (μg/100 g).
2.11. Determination of Minimal Inhibitory Concentration Against a Wide Range of Microorganisms
The antimicrobial activity of the herbal root blend was evaluated by determining the minimum inhibitory concentration (MIC) using the broth dilution method, following the guidelines of the Clinical and Laboratory Standards Institute [27] with minor modifications. The tested microorganisms included Staphylococcus aureus (ATCC 25923), Bacillus subtilis (ATCC 6633), Listeria monocytogenes (ATCC 19115), Escherichia coli (ATCC 25922), Salmonella Typhimurium (ATCC 14028), Pseudomonas aeruginosa (ATCC 27853), Candida albicans (ATCC 10231), and Aspergillus niger (ATCC 16404). Microbial suspension (prepared in Mueller–Hinton broth (for bacteria) or Sabouraud dextrose broth (for fungi)) adjusted to 0.5 McFarland standard (~1.5 × 10⁸ CFU/mL for bacteria; ~1 × 10⁶ CFU/mL for fungi). All plates were incubated at 37 °C for 24 h for bacteria and at 28 °C for 48 h for fungi. The MIC was defined as the lowest concentration of the sample at which no visible microbial growth was observed. All tests were performed in triplicate.
2.12. Health-Promoting Properties
According to the in vitro evaluation methods described by Vučetić et al. [28], three assays were included in the determination of health-promoting properties: antidiabetic activity, antihypertensive activity, and antihypercholesterolemic activity. In brief, α-amylase and α-glucosidase inhibition were measured using standard protocols: for α-amylase, 90 µL of enzyme (0.1 µg/mL), 80 µL starch, and 10 µL extract (5 mg/mL) or acarbose were incubated at 37 °C for 10 min. The reaction was stopped with hydrochloric acid and Lugol’s solution; absorbance was read at 620 nm; for α-glucosidase, buffer, enzyme (0.1 U/mL), dry extract (de) (20 µg/mL) or acarbose, and substrate were incubated, then Na2CO3 was added; absorbance was measured at 400 nm. ACE inhibition was assessed by incubating 50 µL of ACE with the extract at 37 °C, followed by substrate addition. After 30 min, the reaction was stopped with hydrochloric acid, and hippuric acid was extracted and measured at 228 nm. Captopril served as a control. HMG-CoA reductase inhibition was evaluated by mixing the extract with NADPH and the enzyme. Absorbance at 340 nm was recorded every 20 s for 10 min at 37 °C to assess enzyme activity.
2.13. Statistical Analysis
The normality of the data distribution was evaluated using the Shapiro–Wilk and Anderson–Darling tests. The results revealed that most variables did not deviate significantly from a normal distribution, with p-values greater than 0.05. The results are expressed as mean values deviation (n = 3) with corresponding standard deviations. Differences between sample means were evaluated using Tukey’s HSD test. Statistical analysis included descriptive statistics and ANOVA analysis.
2.13.1. Correlation Analysis and Principal Component Analysis (PCA)
Principal Component Analysis (PCA) and correlation analysis (CA) were conducted to interpret and structure the results, aiming to highlight differences and identify groupings among the tested samples. The initial variables were transformed into a set of linearly uncorrelated variables, known as principal components (PCs), through eigenvalue decomposition. All experimental data were evaluated through comprehensive statistical analysis, including descriptive statistics, PCA analysis, and Pearson’s correlation analysis, using the STATISTICA 10.0 software package (StatSoft Inc., Tulsa, OK, USA).
2.13.2. Standard Scores (SS) Evaluation
The samples were ranked by comparing the raw data from each assay to the extreme values, following the methodology outlined by Brlek et al. [29]. This ranking process applied criteria: “the higher, the better” for parameters such as total phenolics content, antioxidant activity (assessed by DPPH, ABTS, and FRAP tests), and sensory compliance quality scores, as defined in Equation (1).
where presents the normal score for parameter x, where xi represents the raw data.
In this ranking approach, equations were used to compare the raw data (denoted as xi) to the respective extreme values. The SS value was calculated by averaging the normalised scores of each sample across multiple measurements, providing a distinctive value that integrates data from various measurement methods.
2.13.3. Artificial Neural Network (ANN) Analysis
In this study, a three-layer multi-layer perceptron (MLP) model was employed for modelling, as it has been demonstrated to effectively approximate nonlinear functions in previous research [11]. Artificial Neural Networks (ANNs) were selected for this study due to their proven ability to model complex, nonlinear relationships between input variables and responses. Unlike traditional statistical methods, ANNs can learn from data patterns without requiring explicit assumptions about the underlying data distribution, making them particularly suitable for modelling multifactorial formulations and predicting bioactive and sensory outcomes in food systems. A three-layer MLP (multi-layer perceptron) was chosen based on its widespread effectiveness in approximating nonlinear relationships, as supported by prior studies in similar food formulation and predictive modelling contexts. This architecture, comprising an input layer, one hidden layer, and an output layer, was initially selected based on the literature and subsequently retained after testing various neuron counts in the hidden layer [28].
The ANN was structured with a feedforward design and trained using the backpropagation algorithm. To train the model, the experimental data were randomly split into two subsets: a training set, comprising 70% of the data, and a testing set, comprising the remaining 30%. During the training phase, the network was iteratively exposed to the input data [30], as outlined in Equation (2).
To optimise the ANN model, the Broyden–Fletcher–Goldfarb–Shanno (BFGS) algorithm, an iterative method for solving unconstrained nonlinear optimisation problems, was employed. The training process consisted of 100,000 epochs, corresponding to the total number of training steps. The weights and biases of the hidden and output layers were represented by the matrices W1, B1, W2, and B2, respectively. These weights were determined during the ANN learning process, where optimisation procedures were applied to minimise the error between the network’s output and the experimental values [31].
To evaluate the performance of the constructed nonlinear models, several standard statistical tests were conducted, including the coefficient of determination (r2), reduced chi-square (χ2), mean bias error (MBE), root mean square error (RMSE), mean percentage error (MPE), sum of squared errors (SSE), and average absolute relative deviation (AARD). These widely used metrics were calculated as shown in Equations (3)–(8) [32].
where were experimental values and where the model predicted values, N and n, are the number of observations and constants, respectively.
3. Results and Discussion
3.1. Proximate Composition, Compliance of Sensory Quality and Colour Parameters of Samples
The proximate composition, colour attributes, and sensory compliance quality scores of the samples are presented in Table 3. Statistical evaluations reveal significant differences in the chemical composition and colour parameters of the samples.
Table 3.
Proximate composition, compliance of sensory quality, and colour parameters of samples.
The protein content in spices can vary considerably, ranging from 4.5% in rosemary leaves to 31.5% in scallions, while fat content ranges from 0.6% in garlic to 42.6% in scallions. The ash content, which indicates the proportion of mineral substances, can vary from 2.3% in marjoram to 16.7% in basil leaves. These variations highlight the diverse nutritional profiles of spices. Additionally, some spices are notable for their significant levels of vitamins and minerals, which further contribute to their nutritional value [33].
The lowest protein content was observed in the TO sample (4.76%), while the highest protein content was found in the CO sample (13.88%). Our findings for turmeric were lower than those reported by Olayinka [34], but higher than those in the study of Enemor et al. [35], who found a protein content of 2.15%. The protein content in parsley roots was slightly higher compared to the results of Petropoulos et al. [36], who reported values ranging from 4.78% to 6.56%. Similarly, the highest ash content was observed in the CO sample (11.39%), while the lowest was found in the TO sample (5.83%). This value for turmeric aligns with literature reports, where the ash content is generally in the range from 2.51% to 7.55% [37]. The variation in ash content may be influenced by the drying method used in our study. The ash content in the PO sample was 7.74%, which was slightly higher than the values reported by Petropoulos et al. [36], ranging from 4.18% to 5.56%. In contrast, the TO sample exhibited the highest fat content at 7.88%, while the lowest fat content was found in the CO sample at 0.96%. The fat content in the PO sample was 1.83%, which aligns with the literature data from Petropoulos et al. [36], who reported values between 0.51% and 2.60%. The fat content in the turmeric sample was lower than the values reported by Olayinka [34] (5.61%), Enemor et al. [35] (5.32%), and Parmar et al. [38], whose reported fat contents ranged from 5.72% to 6.70%, depending on the drying temperature of the rhizomes.
Regarding colour parameters, lightness (L*) was lowest in the TO sample (68.15) and highest in the CO sample (84.64), suggesting that the mass fractions of these components may affect the lightness of the blend in which they are included. The a* values, representing the green/red spectrum, decreased from 12.72 in the TO sample to negative values in PO, CP7, CP9, and CO samples (- −0.42 to −0.26), indicating a shift towards green tones with the addition of celery and parsley to turmeric. The b* values, indicating the blue-yellow spectrum, were also highest in the TO sample (62.01) and lowest in the CO sample (19.27), reflecting a decrease in yellowness with decreasing turmeric content in blends. Chroma (C*) values followed a similar pattern, with the highest chroma in the TO sample (63.30) and the lowest in the CO sample (19.27). On the other hand, hue angle (h) varied from 78.41° in the TO sample to 90.77° in the CO sample. Overall, the statistical analysis underscores significant variations in protein, ash, and fat content, and colour attributes across the different blends, highlighting the influence of each component on the nutritional and visual properties of the formulations.
Sensory properties of a new food product are very important quality parameters and greatly influence consumer interest and sales frequency. Aromatic components are generally present in relatively small amounts in food products, expressed in mg/kg, or even lower concentrations that can be detected by the human olfactory system [39]. Dried herbs are commonly used as additions to dishes, either to enhance their existing characteristics or to impart a new, more appealing aroma [40]. By evaluating the compliance of sensory quality of aqueous solutions of aromatic herbs, certain differences were identified, as presented in Table 3. Descriptive sensory analysis facilitated the identification of key sensory attributes for various products, enabling the development of a precise sensory profile for each food product. Descriptive analysis was employed to assess the intensity of key attributes in blends prepared with three aromatic root herbs used in the experiment at varying proportions. Additionally, the compliance of smell, aroma, and taste was evaluated and scored, following the prescribed procedure and using the scale in the range from 5 (excellent) to 1 (poor), presented in Files S1 and S2.
Sample PT2 received the highest average overall sensory quality score (4.42), followed closely by sample CT5 (4.25), with samples PO (4.17) and TO (4.00) ranking next. However, the differences among these samples were not statistically significant (p > 0.05).
The PT2 sample offered a pleasant combination of a refreshing (2.30) and mildly irritating (2.00) mouthfeel. Its overall aroma was harmonious, characterised by a subtle yet noticeable smell and flavour of parsley root (2.22) and a faintly unpleasant oil aroma (2.00). However, it featured a pronounced aroma of turmeric rhizome (3.75) and conifer needles/resin (4.00), both derived from turmeric. The CT5 sample had a delightful and harmonious aroma, with a dominant, clear aroma of turmeric rhizome (3.82), complemented by a slightly pronounced aroma of celery root (1.67). Moderately pronounced refreshing notes of mint (2.67) and conifer needles or resin (3.00) contributed to the pleasant aroma. However, the presence of an oily aroma in the mouth is a limiting factor, which was slightly pronounced (1.50), accompanied by a refreshing mouthfeel (2.87). The PO sample exhibited a moderate parsley root aroma (3.25) and a slightly pronounced oil aroma (2.0). The taste was slightly salty (1.75) with a very mild (1.43) refreshing mouthfeel, which significantly affects the overall impression of the sensory quality of the extract of this blend. Sample TO had an intense aroma of turmeric rhizome (3.98). The moderate refreshing mouthfeel (2.71) is attributed to the harmony between these aromas and the intensely pronounced mint aroma (3.88) and conifer needles or resin aroma (2.67), with an oily mouthfeel at the end (2.50).
On the other hand, the sensory evaluation revealed that sample CP9 has the relatively lowest average rating of sensory compliance quality (2.67), but it was not statistically significantly different (p > 0.05) from samples CO (2.75), CP7 (3.25), and CT8 (3.17).
In sample CP9, the aroma of oil was identified as the most dominant (3.00), and it was complemented by slightly pronounced aromas of parsley root (2.27) and celery root (2.25). The overall impression in the mouth was rated as unpleasant, bland (2.13).
The CO sample was evaluated as a sample with an intense, pronounced, and recognisable celery root aroma (3.38); however, the dominant oily sensation in the mouth, followed by a pronounced oil aroma (3.83), sawdust aroma (1.00), and bland taste (3.00) negatively affect the general sensory impression.
The CP7 blend is recognised for its pleasant aroma, with recognisable but mild aromas of parsley root (2.55) and celery root (2.44). However, the sample was described as bland (2.00), without clearly defined taste modalities, with an oily mouthfeel present (2.50). The CT8 blend has a moderately pronounced aroma of turmeric rhizome (2.91) and a refreshing mouthfeel (1.50), which probably originates from a pronounced aroma of coniferous resin (3.0). However, the oily aroma (2.33) attributed to celery negatively affects the overall impression and leaves an unpleasant aftertaste in the mouth. A comparative view of the intensity of key sensory attributes is shown in Figure 1.
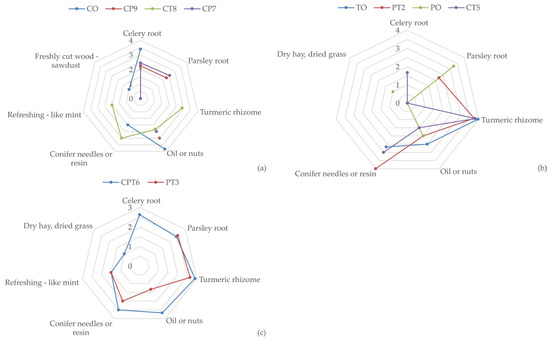
Figure 1.
Intensity of key products’ sensory attributes for: (a) CO, CP9, CT8, and CP7 samples; (b) TO, PT2, PO, and CT5 samples; and (c) CPT6 and PT3 samples; (n = 12).
Samples PT3 and CPT6 showed a quality slightly lower than very good, although not statistically significant (p > 0.05), with average scores of 3.67 and 3.58, respectively. In the PT3 blend, a mild aroma of turmeric rhizome (2.65) and a slightly less pronounced aroma of parsley root (2.50) were recorded. In the CPT6 blend sample, a mild aroma of parsley root (2.41) and celery root (2.63), as well as a mild aroma of turmeric rhizome (2.91), was detected, along with a mildly pronounced oily aroma (2.67) and an aroma of conifer needles or resin (2.50).
The combination of aromatic components in the extract of root herbs gave a pleasant aroma and impression in the mouth. A significant contribution to the overall quality of certain samples was made by turmeric, thanks to the refreshing, slightly irritating mouthfeel associated with a refreshing aroma of mint and conifer needles or resin (using sensory attributes as defined in instructions for sensory analysis, File S2). Given the different quality ratings, it can be concluded that there were certain factors that influenced such a ranking of the samples. Harmonious and pleasant aromas, especially in samples where turmeric is present, contributed to higher ratings of quality conformity. On the other hand, the pronounced oily aroma and bland taste had the effect of lowering the ratings. Samples with more pronounced refreshing characteristics, as with the PT2 blend, were rated better. Lightly pronounced or not at all pronounced refreshing notes, as in, e.g., the PO sample, had a negative impact on the evaluation. Additionally, blends with a balanced ratio of aromas and a pleasant mouthfeel (e.g., PT2 and CT5) received the highest ratings. The dominance of one aroma over another was considered a flaw by evaluators, e.g., the dominance of an oily aroma, as in the CP9 and CO blends, or the lack of defined aromas, as in the CP7 blend, which also reduced quality. All tested samples had satisfactory quality, but the intensity, harmony, and refreshing mouthfeel/aroma had the most significant impact on the sensory evaluations. In contrast, bland taste and oily aroma limited the overall perception of quality.
The colour of the samples prepared as aqueous extracts of aromatic root herbs is directly proportional to their quantity in the blend and is a consequence of the nature of the samples, that is, depending on the type and concentration of coloured substances present in the sample. All samples were prepared with a relatively low concentration of plant material, a common practice in food preparation. The colour of the PT2 sample solution was a slightly darker yellow (4.40) with a slight to clear orange shade (about 3.50).
Sample CT5 was a slightly darker yellow (4.29) with a soft orange tint and a slightly to clearly pronounced yellow/orange tint. The colour of the PO solution is described as a slightly lighter white colour (1.60) with a slightly more intense green shade (2.0) and a barely noticeable yellow shade (1.00). The colour of the TO solution is described as a slightly darker orange colour with a distinct yellow tinge, and a very slight to slightly pronounced red tinge. A sample of the CP9 blend is described as a pale yellow/white colour (1.20 and 1.00, respectively) with a very slight yellow tint and a barely perceptible grey tint (1.20).
The colour of the CO blend is described, almost in the same way as the colour of the PO solution, with a slightly light whitish colour (1.60) with barely noticeable yellow (1.29) and green tints (1.00). The colour of sample CP7 is described as a slightly lighter white with pale yellow/green tones with a barely perceptible green tint. The colour of the CT8 blend is defined as a clear yellow colour (3.23) with a slight yellow (3.33) and a very slight orange tint (1.57). The colour of the PT3 sample is described as an almost clear yellow colour (2.89) with a very slight orange tint (2.33). The colour of the aqueous solution of the CPT6 sample is described as a clear yellow colour (2.90) with a barely noticeable orange tint (1.33).
3.2. Total Phenolics and Antioxidative Activities of Samples
Total phenolic content and antioxidative activities of samples are shown in Table 4. The total phenolic content was the highest in the TO sample, consisting of only turmeric (23.44 mg GAE/g), showing a statistically significant difference (p < 0.05). The lowest content of these compounds, 0.77 mg GAE/g, was found in the PO sample, followed by the CP7 and CP9 samples, with values of 0.80 and 0.83 mg GAE/g, respectively, although not statistically significant (p > 0.05). The total phenolic content in celery root (CO sample) and parsley root (PO sample) was approximately similar. It was observed that the phenolic content in the blends increased with the proportion of turmeric. However, the addition of parsley to celery, or both parsley and celery to turmeric, resulted in a slight decrease in these compounds, without a synergistic effect. A similar trend was observed in the analysis of antioxidant activity, assessed through DPPH, ABTS, and FRAP tests. The TO sample exhibited the highest antioxidant activity, and the PO sample showed the lowest, with values comparable to those of the CP7 sample, although not statistically significant (p > 0.05).
Table 4.
Total phenolic content and antioxidative activities of samples.
3.3. Statistical Analysis
3.3.1. Standard Scores for Product Blends
The standardised score (SS) is calculated by summing up the normalised scores of each variable (total phenolic contents, DPPH, ABTS, and FRAP test, sensory compliance quality scores). Maximising the SS function allows for the determination of the optimal blend. As shown in Figure 2, the TO sample (blend no. 1) had the highest SS values.

Figure 2.
Standard scores for different blend samples.
The standard score analysis aligns well with the sensory analysis, indicating that the best SS value of 1.000 was achieved by the TO sample (blend no. 1), which had a sensory score of 4.000. Slightly better sensory analysis results were observed for the PT2 sample (blend no. 2), with a sensory score of 4.417 and an SS value of 0.745, and for the CT5 sample (blend no. 5), with a sensory score of 4.25 and an SS score of 0.706.
Although blends No. 1, 2, 3, 5, and 8 exhibited higher standard score values, the CPT6 blend (equal parts celery, parsley, and turmeric) was selected as optimal due to its balanced sensory characteristics, moderate-to-high antioxidant potential, and cultural integration of all three plant roots. From a nutritional standpoint, CPT6 preserved a favourable phenolic content (9.56 mg GAE/g) while maintaining a “very good” sensory rating (3.58). Notably, the inclusion of celery and parsley roots—both traditional ingredients in Balkan cuisine—ensures better cultural acceptance and market potential. The addition of turmeric enhanced functional properties without overpowering the blend, supporting CPT6 as a well-rounded formulation suitable for further development as a functional ingredient.
From a cultural and culinary point of view, the consumption of celery and parsley across the Balkan Peninsula is consistent with traditional dietary practices that have been sustained over time, where these herbs are ingredients of many local dishes. Conversely, turmeric does not share the same historical or cultural presence in Balkan food culture. Therefore, it is not widely used and not very well known among the local population, which also explains the low consumer acceptance. This cultural context should be taken into account when interpreting ingredient choices and consumer perceptions within the scope of this study.
3.3.2. Correlation Analysis of Antioxidative Parameters
The correlation analysis provides insights into the relationships between total phenolics (TPs), DPPH, ABTS, FRAP, and compliance of sensory quality scores. Strong positive correlations are evident between TP and antioxidant activity measures: TP is highly correlated with DPPH (r = 0.987, p = 0.000), ABTS (r = 0.985, p = 0.000), and FRAP (r = 0.989, p = 0.000), indicating that higher phenolic content is associated with increased antioxidant activity. Sensory compliance quality scores show a moderate correlation with TP (r = 0.641, p = 0.046), suggesting a statistically significant but weaker relationship, where higher TP levels might contribute to perceived sensory qualities. DPPH also correlates strongly with ABTS (r = 0.987, p = 0.000) and FRAP (r = 0.987, p = 0.000), highlighting consistency among these antioxidant assays. Additionally, DPPH has a moderate correlation with sensory scores (r = 0.658, p = 0.039), implying a potential influence of antioxidant activity on sensory attributes. ABTS shows a very strong correlation with FRAP (r = 0.992, p = 0.000), affirming the alignment between these two measures in evaluating antioxidant capacity. ABTS also has a moderate correlation with sensory scores (r = 0.667, p = 0.035), suggesting that ABTS-detected antioxidant properties may affect sensory perception. Finally, FRAP is moderately correlated with sensory scores (r = 0.682, p = 0.030), indicating that higher ferric reducing activity might enhance sensory characteristics.
3.3.3. Principal Component Analysis (PCA)
PCA was performed on the data to provide a clearer view of the similarities among samples based on their investigated properties, including TP, DPPH, ABTS, FRAP, and sensory compliance quality scores. This multivariate statistical approach enabled differentiation of samples mixed under various production conditions. The PCA biplot, which illustrates relationships among samples, showed that the first two principal components explained 99.28% of the total variance in the data (Figure 3). The analysis revealed a distinct clustering pattern among the samples, highlighting differences related to the investigated parameters.
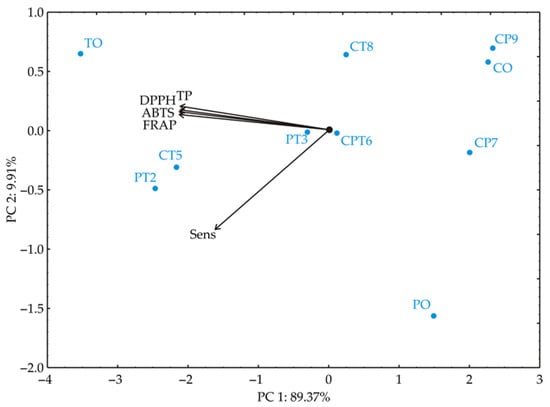
Figure 3.
Principal component biplot for blend samples based on their antioxidative properties (TP, DPPH, ABTS, and FRAP) and sensory compliance quality scores (Sens). TO—turmeric, PT—parsley/turmeric blend, PO—parsley, CT—celery/turmeric blend, CPT—celery/parsley/turmeric blend, CO—celery.
Total phenolics (TP) have a negative loading score of −21.6% (based on correlation), in the first principal component PC1, DPPH has −21.8%, ABTS has −21.9%, and FRAP has −22.0%, indicating strong negative associations with this factor across these antioxidant parameters. Sensory compliance quality scores (Sens); however, have a lower loading score of −12.7% on PC1, suggesting a weaker association with this factor in comparison to the antioxidant parameters. The sensory compliance quality score (Sens) exhibits a very high negative loading of −87.0% (based on correlation) to the second principal component, PC2, indicating that it is the dominant contributor to this factor, distinct from the other variables. Meanwhile, the antioxidant parameters exhibit lower positive loadings on PC2. The samples are clustered based on their values along PC1. Samples PO, CP7, CP9, and CO, which show the lowest values for total phenolics (TP), DPPH, ABTS, and FRAP, are positioned on the right side of the biplot. In contrast, samples TO, PT2, and CT5, which show higher values for these parameters, are located on the left side of the biplot. Sample PO displays a distinct deviation towards PC2, likely due to its low content of phenolic compounds and weak antioxidant activity. Samples PT3 and CPT6 are positioned near the coordinate origin, indicating that they had minimal influence on the variability of the data.
PCA of the chemical and colour parameters was performed to clarify sample similarities among proteins, ash and fat content, and colour parameters (L*, a*, b*, C*, h). The PCA biplot revealed that the first two components explained 98.81% of the total variance, showing a distinct clustering pattern and highlighting differences among samples (Figure 4).
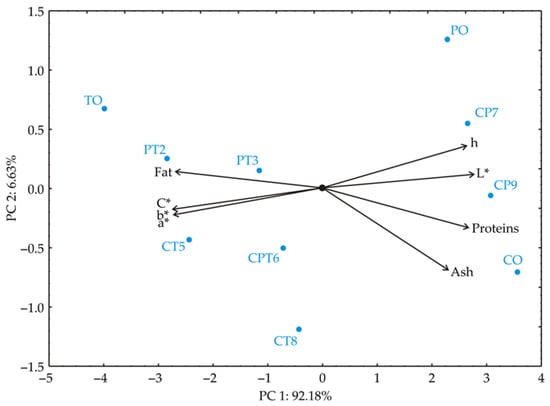
Figure 4.
Principal component biplot for blend samples based on their chemical properties (proteins, fat, ash) and colour parameters (L*, a*, b*, C*, h).
For the first principal component PC1, high positive loadings are observed in L* (13.4%, based on correlations), protein content (12.6%), and h (12.2%), indicating a strong association with these parameters. Negative loadings in PC1 are found in a (−13.1%), b (−13.3%), C (−13.3%), and fat content (−12.8%), suggesting these properties vary in the opposite direction from the positive-loading parameters. The second principal component (PC2) shows a strong negative loading for ash content (−55.7%). Positive loadings in PC2 are noted in h colour parameter (14.3%), protein content (−12.8%), and a* (−5.9%), showing associations distinct from those in PC1. This analysis highlights that ash content and h are significant contributors to variance, differentiating sample groups based on these principal components. Samples TO, PT2, PT3, CT5, and CPT6 are positioned on the left side of the biplot, indicating that they are primarily influenced by variables such as fat content, a*, b*, and chroma (C). Sample TO is located on the far left side of PC1, most likely as a result of its elevated fat content and significant differences in colour parameters relative to the other samples. Samples CP9 and CO are situated on the right side of PC1, likely due to their high protein and ash content. These samples are rich in protein and ash (which represents the mineral matter), while exhibiting lower values for fat and chroma. Samples PO and CP7 are positioned in the upper right quadrant of the biplot, indicating a strong influence of the hue (h) and lightness (L) variables. Additionally, their similar protein and fat content further distinguishes them from the other samples. On the other hand, samples PT2, PT3, CT5, CPT6, and CT8 are grouped closer to the centre of the biplot, suggesting that they have balanced values across all variables, without exhibiting pronounced extremes. This positioning indicates that these samples are less distinctive compared to those at the extremes of the biplot.
3.3.4. ANOVA
Table 5 summarises the ANOVA analysis of various chemical and antioxidative properties (TP, DPPH, ABTS, FRAP, proteins, ash, and fat) and colorimetric parameters (e.g., L*, a*, b*, C*, and h) for celery, parsley, and turmeric blends, for linear (L) and quadratic (Q) terms in the second order polynomial model. According to the ANOVA analysis, the statistically significant values suggest that the quadratic term particularly influences turmeric’s colour parameters (a*, b*, C*, and h), alongside its antioxidant capacity (DPPH), highlighting distinct effects of turmeric in the analysis. The quadratic term of celery content is also influential in DPPH calculation. The model fit is strong across most parameters, with R2 values close to 1.000, for TP (0.998), DPPH (0.998), ABTS (0.995), FRAP (0.994), proteins, ash, and fat (all 1.000), and colour parameters L*, a*, b*, C*, and h (0.995 to 0.984). Adjusted R2 values are similarly high: TP (0.995), DPPH (0.994), ABTS (0.986), FRAP (0.983), and colour parameters (ranging from 0.984 to 0.953), though sensory compliance quality scores show a lower adjusted R2 of 0.591, indicating less explained variability.
Table 5.
ANOVA analysis of the second-order polynomial model of the antioxidative, chemical quality, and colorimetric parameters.
3.3.5. Artificial Neural Network (ANN) Model
In this study, multiple Artificial Neural Network (ANN) models were developed to predict output variables for various chemical and antioxidative properties (TP, DPPH, ABTS, FRAP, proteins, ash, and fat) and colorimetric parameters (e.g., L*, a*, b*, C*, and h) for celery, parsley, and turmeric samples. The performance and structure of the ANN were significantly influenced by initial assumptions for matrix parameters, such as biases and weight coefficients, which were critical for constructing and fitting the ANN to the experimental data. Additionally, the number of neurons in the hidden layer affected the model’s performance. To mitigate random correlations from initial assumptions and weight initialisation, 100,000 topologies were tested.
The training cycle for the ANN model was conducted over 100 epochs, with the corresponding results, including training accuracy and error (loss). Training accuracy steadily increased with each cycle until stabilising around the 50th to 60th epoch. Extending the training beyond 60 epochs risked overfitting. Therefore, to maintain high model accuracy while avoiding overfitting, a training cycle of 50 epochs was deemed optimal for most output variables.
The performance of the ANN models was evaluated, and it was determined that the optimal number of neurons in the hidden layers for predicting the output variables ranged from 3 to 10, as shown in Table 6. This configuration resulted in high coefficient of determination values during the training cycle, as presented in Table 6.
Table 6.
Performance of the ANN model.
Table 6 provides a summary of performance metrics and architecture details for each MLP model, showing that all models achieved perfect test r2 values (1.000), indicating strong predictive accuracy on unseen data. Training r2 values vary, with most models also near 1.000, while TP (0.978), DPPH (0.991), ABTS (0.953), FRAP (0.980), and Sens (0.811) show slightly lower values, suggesting some differences in fit quality across variables. Training and test errors reveal that variables such as Fat (error: 0.000) fit precisely, whereas models like DPPH (26.873), ABTS (439.146), and FRAP (296.648) have notably higher training errors but much lower test errors, indicating improved generalisation. Activation functions were tailored per variable, with Logistic and Tanh activations for nonlinear patterns, Exponential for exponential relationships (e.g., Proteins and h), and identity for simpler linear transformations in output layers for variables like ABTS and FRAP. Hidden neuron counts were optimised to capture complexity, with simpler models (3 neurons) for FRAP and a*, and more complex structures (up to 10 neurons) for variables such as ABTS and Ash, to balance flexibility and avoid overfitting. This tuning of neurons and activations resulted in effective models, though further adjustment might enhance fit for certain variables with high training errors, like ABTS.
Table 7 presents statistical test results for several parameters, demonstrating varied model performance and data characteristics. TP has a χ2 of 2.516, RMSE of 1.484, SSE of 17.613, and an r2 of 0.963, indicating a strong model fit, while MPE and AARD are both at 36.322, showing moderate relative error. DPPH exhibits higher error metrics, with a χ2 of 49.497, RMSE of 6.581, SSE of 346.480, and AARD of 89.772. However, its r2 of 0.987 suggests a robust fit despite some prediction variability. ABTS stands out with a χ2 of 906.020, RMSE of 28.156, SSE of 6342.139, and AARD of 94.755, reflecting significant prediction error, while the r2 of 0.945 indicates a reasonable but less precise model fit. FRAP has a χ2 of 540.000, RMSE of 21.737, and SSE of 3779.999, with an r2 of 0.982, indicating strong predictive accuracy, though a high negative MBE (−15.448) suggests underestimation.
Table 7.
Verification of the ANN model.
Sensory analysis has the lowest r2 of 0.611, with a χ2 of 0.103, RMSE of 0.300, and SSE of 0.720, highlighting the need for model improvement. Proteins show exceptional accuracy, with a χ2 of 0.007, RMSE of 0.079, SSE of 0.050, and r2 of 0.999. Ash has a χ2 of 0.040, RMSE of 0.187, SSE of 0.281, and an r2 of 0.976, indicating reliable performance. Fat achieves an r2 of 1.000, with minimal error (χ2 and SSE close to 0), suggesting perfect prediction accuracy.
For colour parameters, L* has a χ2 of 0.045, RMSE of 0.199, SSE of 0.316, and an r2 of 0.999, indicating a very good model. a*, b*, C*, and h also achieve r2 values of 1.000, with low χ2 and RMSE values (e.g., RMSE for a* is 0.117 and for b* is 0.170), suggesting near-perfect predictive accuracy. The distribution metrics reveal some asymmetry; for example, b* shows a high positive skew (2.170) and kurtosis (5.598), indicating a right-skewed distribution with heavy tails, while TP has a slight skew (0.050) and a negative kurtosis (−1.511), indicating a lighter-tailed distribution. Overall, while most parameters exhibit strong model fits and low errors, Sens and ABTS may benefit from further model refinement to reduce prediction error and improve accuracy.
3.4. HPLC Analysis of Phenolic Compounds in Optimal Blend
The contents of individual phenolic compounds in the selected CPT6 mixture are presented in Table 8. Six different phenolic acids were identified in the sample, with p-hydroxybenzoic acid being the most dominant, at a concentration of 85.75 μg/100 g. Flavonoids, a group of polyphenolic compounds, are characterised by a wide range of biological activities, including antioxidant, anti-inflammatory, and anticancer effects [41]. Apigenin is a flavone that is a characteristic compound of celery and parsley [42]. The content of apigenin in this blend was 37.56 μg/100 g.
Table 8.
Phenolic compound contents in the selected sample were identified and quantified by the HPLC method.
3.5. Mineral Composition of Optimal Blend
The mineral content analysed in the selected sample CPT6 is presented in Table 9. Among the macroelements, phosphorus was the most abundant (3716.50 mg/kg), followed by calcium, potassium, magnesium, and sodium. Regarding microelements, zinc had the highest concentration (80.27 mg/kg), while manganese and iron were measured at 59.76 mg/kg and 37.53 mg/kg, respectively. Transition metals, including iron, manganese, and zinc, are crucial for mitochondrial metabolism, energy production, protection against oxidative stress, protein transcription regulation, and immune system function [43]. Deficiencies in micronutrients such as iron (Fe), zinc (Zn), calcium (Ca), and other essential minerals can lead to life-threatening conditions (e.g., iron deficiency can cause anaemia). However, selecting the appropriate foods can help prevent these deficiencies to a significant extent [44].
Table 9.
Content of individual mineral substances in the selected sample CPT6.
3.6. Antimicrobial Properties of Optimal Blend
In view of the antimicrobial properties of the optimal sample, the minimal inhibitory concentration (MIC) of the CPT6 sample against various microorganisms comprising Gram-positive and Gram-negative bacteria and fungal strains is evaluated and presented in Table 10. Indeed, the CPT6 sample showed promising antibacterial activities against Bacillus subtilis, with a MIC value of 1.56 mg/mL, Listeria monocytogenes with a MIC value of 3.125 mg/mL, and Salmonella Typhimurium with a MIC value of 3.125 mg/mL. It showed moderate activity against Staphylococcus aureus (MIC = 100 mg/mL) and Candida albicans (MIC = 100 mg/mL). Escherichia coli and Pseudomonas aeruginosa were resistant, with MICs > 100 mg/mL. The antifungal activity against Aspergillus niger was relatively low, with a detected MIC value of 100 mg/mL.
Table 10.
Minimal inhibitory concentration of the CPT6 sample against the spectrum of microorganisms.
Therefore, these results indicate that the CPT6 sample exhibits selective antimicrobial activity, which is highly inhibitive against selected Gram-positive bacteria. In contrast, Gram-negative bacteria and fungal strains tested are less affected. This could be related to the intrinsic resistance mechanisms in Gram-negative bacteria, including the presence of an outer membrane, which restricts the permeability of most antimicrobial agents. The relatively elevated MIC values observed for the CPT6 blend imply that, although the blend does exhibit antimicrobial activity, its overall potency remains modest in comparison to conventional synthetic antimicrobials. This outcome aligns with expectations, particularly given that Gram-negative bacteria like E. coli and P. aeruginosa possess inherent resistance mechanisms, most notably, an outer membrane enriched with lipopolysaccharides that functions as a selective barrier, impeding the entry of many hydrophobic phytochemicals [45]. Furthermore, active efflux systems such as AcrAB-TolC contribute to resistance by expelling antimicrobial agents from the bacterial interior, thereby reducing their intracellular accumulation and efficacy [46]. The obtained results (Table 10) suggest that further purification and fractionation of the CPT6 extract may enhance its bioactivity and help circumvent barriers to antimicrobial penetration and potential application in antimicrobial treatments.
Although the scientific literature lacks information about tested activity for CPT6 samples, turmeric oil samples have been tested in recent research. Namely, the obtained results of the CPT6 sample are in close agreement with the ones reported by Odo et al. [47] who analysed the antibacterial potential of turmeric extract and found that it exhibited potent inhibition of Bacillus subtilis. At the same time, it did not act against E. coli and P. aeruginosa with a MIC > 100 mg/mL. Additionally, a similar trend was noticed in the work of Beshiru et al. [48] where the MICs of C. longa crude extract range from ethanol extract (0.03125–0.5 mg/mL) and acetone extract (0.0625–0.5 mg/mL). It can be emphasised that in its selectivity, Gram-positive bacterial strains are significantly more inhibited by turmeric than Gram-negative strains. This is especially so because curcuminoids, by their nature, which are hydrophobic, show more affinity with the peptidoglycan-rich cell wall of Gram-positive bacteria. Gram-negative bacteria, with an outer membrane that serves as a permeability barrier, efficiently render a large amount of plant antimicrobial compounds poorly effective [49]. This also receives support from the earlier observation that this study shows limited antifungal activities, whereas, from Alam et al. [50], turmeric essential oil showed a reasonable zone of inhibition against the test fungal strains (up to 29 mm) with the MIC values recorded between 3.9 and 7.81 µg/mL. According to the results of Latinović et al. [11], ethanolic extracts of celery and parsley did not exhibit antibacterial activity against Staphylococcus aureus. However, the CPT6 sample analysed in this study demonstrated significant MIC values against this bacterium, indicating that the addition of turmeric powder to the celery and parsley powder mixture significantly enhanced their antibacterial properties. Although the CPT6 sample exhibited selective antimicrobial activity against Gram-positive bacteria, the observed MIC values against Gram-negative strains (>100 mg/mL) suggest relatively low potency. Future research should focus on fractionation of the CPT6 blend to isolate highly active constituents and explore advanced delivery strategies such as nanoencapsulation to enhance antimicrobial efficacy, especially against resistant bacterial strains.
3.7. Health-Improving Potentials of the CPT6 Sample
Further analysis of the biofunctional properties, such as antidiabetic, antihypertensive, and antihypercholesterolemic activities of the CPT6 sample, has been presented in Table 11. Indeed, the sample evidenced a potent anti-diabetic potential by showing strong inhibitions against α-amylase with 72% inhibition (6.5 mg ACAE/gde) and α-glucosidase with 80% inhibition (6.8 mg ACAE/gde). In that case, high inhibition of α-glucosidase may suggest the possible role of the CPT6 sample in the management of postprandial blood glucose levels for the prevention of hyperglycemia.
Table 11.
Health-improving potentials of the CPT6 sample.
It demonstrated antihypertensive activity, with 62% inhibition of ACE, and thus could potentially modulate blood pressure. ACE inhibition indicates the CPT6 sample supports cardiovascular health through the regulation of the renin–angiotensin system. Additionally, there was 55% inhibition of HMG-CoA reductase (HMGCR), the rate-limiting enzyme in cholesterol biosynthesis, by the CPT6 sample, indicating its potential role in managing cholesterol levels and hypercholesterolemia.
Other than antimicrobial action, the extract exhibited significant antidiabetic, antihypertensive, and antihypercholesterolemic activities. In particular, it showed 72% inhibition against α-amylase and 80% inhibition against α-glucosidase, showing that it has great potential to help in postprandial blood glucose control. Furthermore, it exhibited an ACE inhibiting activity of 62% and HMGCR inhibiting activity of 55%, thus suggesting its possible action on regulating blood pressure and reduction in cholesterol levels. These results closely relate to those reported by other studies. The metabolic effects that carbonised curcumin derivatives have been targeted by Roney et al. [51] showing potential for inhibition of α-glucosidase, confirming that turmeric serves as a source of natural products with antidiabetic action. In corroboration, Yao et al. [52] and Zhuang et al. [53] presented the antihypertension potential of curcumin, which is a reasonable base for further testing the CPT6 sample as an individual agent or in synergistic effects with other ACE inhibitors. Furthermore, turmeric has been shown to exhibit some lipid-lowering properties in the study by Boretti [54]; however, here it inhibited HMG-CoA reductase activities consistent with a 55% inhibition recorded within this study.
It follows that the CPT6 sample is promising in the circles of bioactivity, in particular for antimicrobial applications, mainly in metabolic health disorders. The potency of selective antibacterial action against Gram-positive pathogens and high enzymatic inhibition related to diabetes, hypertension, and hypercholesterolemia underlines its potential as a functional bioactive compound. Further studies are therefore necessary to explain the mechanism of action and evaluate in vivo efficacy. The results of this study suggest that an extract of a blend of celery and parsley roots, along with turmeric rhizome, exhibits selective antimicrobial activity and provides specific benefits for metabolic health. Gram-positive bacteria are inhibited effectively when contrasted with their relatively poor efficacy against Gram-negative species and fungi, in tune with previous reports on turmeric bioactivities. On the other hand, antidiabetic, antihypertensive, and lipid-lowering activity is in tandem with recent scientific findings. With these data, further processing of a blend of celery, parsley, and turmeric into nutraceuticals, functional foods, or complementary therapies would be possible to counteract resistance to antimicrobials and metabolic disorders. The observed bioactivities could be mechanistically attributed to the synergistic effects of major phytochemicals present in CPT6. Curcuminoids from turmeric, notably curcumin, are known to inhibit carbohydrate-hydrolysing enzymes and modulate the renin-angiotensin system, while apigenin from celery and parsley may contribute to HMG-CoA reductase inhibition and antioxidant defence. These interactions offer a biochemical basis for the antidiabetic, antihypertensive, and hypocholesterolemic effects observed.
3.8. Application Potential
Compared to the literature, the selected CPT6 formulation demonstrated competitive or superior bioactivity. For example, recent research into functional food ingredients based on plant bioactivities has reported similar trends in antioxidant, antidiabetic, and antimicrobial activities. Zhang et al. [55] demonstrated that nano-encapsulated curcumin systems exhibited strong α-amylase inhibitory effects and potent antioxidant capacities, comparable to the CPT6 formulation developed in this study, although their encapsulated delivery method provided superior bioavailability. Similarly, Awari et al. [56] investigated Berberis aristata root powder, observing moderate α-amylase inhibition and antibacterial properties against Gram-positive bacteria, consistent with the selective antimicrobial action observed for CPT6. Long et al. [57] fortified durum wheat pasta with turmeric residue powder, reporting significant enhancement of antioxidant levels, although without substantial antimicrobial effects against Gram-negative strains, aligning with the limitations found in the present work. Furthermore, the integration of protein hydrolysates from brewers’ spent grain, as discussed by Bazsefidpar et al. [58], revealed promising antidiabetic properties, yet CPT6 achieves similar bioactivity using a natural multi-root approach without the need for enzymatic hydrolysis. Sarkar et al. [59] emphasised the phenolic-linked inhibition of carbohydrate-digesting enzymes using turmeric and other botanicals, directly supporting the mechanistic hypothesis proposed for CPT6. Lastly, Hawash et al. [60] showed that traditional herbal blends could offer multi-targeted bioactivities, a strategy also reflected in the CPT6 multifunctionality, with potent antioxidant, antidiabetic, and moderate antimicrobial activities. These comparisons underscore the competitive performance of CPT6 and reinforce its potential as a multifunctional ingredient for future functional food applications. Additionally, based on its multifunctional bioactivity and favourable sensory profile, CPT6 is particularly suited for application as a functional tea powder targeted at individuals managing type 2 diabetes and metabolic syndrome. The blend’s strong antioxidant and α-glucosidase inhibitory properties suggest promising potential for inclusion in specialised dietary regimens and nutraceutical formulations.
One more step toward the implementation is in specific mathematical tools used for the study evaluation. In contrast to the majority of previous studies, which predominantly relied on conventional statistical methods, this research integrates advanced computational approaches, including Principal Component Analysis (PCA) and Artificial Neural Network (ANN) modelling, to optimise the formulation. The ANN model allowed for predictive analysis of the sensory and bioactive outcomes based on formulation variables, providing a more robust understanding of ingredient interactions. Such an application of machine learning tools to enhance formulation strategy represents a methodological advancement not employed in the recent turmeric and root blend studies discussed above, adding an innovative dimension to the development of multifunctional functional foods.
While this study provides valuable insights into the functional and sensory properties of celery–parsley–turmeric blends, certain limitations should be acknowledged. First, all plant materials have a specific geographical origin, which may limit the generalizability of the findings due to regional variations in composition. Second, the sensory evaluation was conducted with a panel of 12 trained assessors from a single institution, which may not fully reflect broader consumer preferences. Additionally, while the blending design enabled a systematic exploration of formulation effects, only 10 formulations were tested, and the study focused on a single preparation method (aqueous extraction). Future research should validate these findings across different geographical sources, consumer populations, and preparation formats (e.g., dry blends, capsules, or culinary use scenarios).
Building on the promising results of this study, future research should explore the long-term stability of the CPT6 formulation, particularly its bioactive compound retention and sensory integrity under different storage conditions. Additionally, large-scale consumer studies across different demographic and cultural groups are recommended to validate sensory preferences and market acceptance. Further work could also investigate bioavailability and in vivo efficacy of the blend’s phenolic compounds and assess its incorporation into functional food products such as soups, teas, or nutraceutical formulations.
4. Conclusions
This study examined the impact of varying the composition of root herbs (celery, parsley, and turmeric) in a blend on its chemical composition, antioxidant activity, and sensory quality. The analysis revealed that turmeric rhizomes contain significantly higher levels of phenolic compounds, approximately 28 times more, compared to celery and parsley roots. Consequently, the antioxidant activity of turmeric rhizomes was considerably higher than that of the other two samples. Adding turmeric to celery and/or parsley samples resulted in a noticeable improvement in their antioxidant activities. Furthermore, the addition of turmeric also contributed to an enhancement in the sensory quality of the celery and/or parsley blends. The results of the statistical analysis using artificial neural networks (ANN) demonstrated that ANN can effectively predict output parameters such as TP, DPPH, FRAP, proteins, ash, fat, and colour parameters (L, a*, b*, C*, and h). Although these parameters showed strong model fits and low error rates, further refinement of the model may be needed for sensory compliance quality and ABTS to reduce prediction errors and enhance accuracy. Moreover, in the CPT6 blend (composed of equal parts of celery, parsley, and turmeric), identified as the most favourable solution, among the macroelements, phosphorus was found to be the most abundant, while zinc was the most prevalent among the microelements. The dry extract of the CPT6 sample exhibited significant antidiabetic, antihypertensive, and antihypercholesterolemic activities as well as very good antimicrobial activity against Gram-positive bacteria. A blend composed of equal parts of celery, parsley, and turmeric could be used in everyday life or industry as a mixture of spices, tea blends, or functional food with potent bioactivity and health benefits. Future research should focus on the isolation and characterisation of bioactive compounds responsible for the observed effects, as well as the development of functional food or nutraceutical prototypes incorporating the CPT6 blend. These steps would support its practical application as a multifunctional ingredient in health-oriented food products.
Supplementary Materials
The following supporting information can be downloaded at: https://www.mdpi.com/article/10.3390/pr13061849/s1, File S1: Evaluation sheets; File S2: Instructions for sensory analysis.
Author Contributions
Conceptualization, S.L., J.V. and O. Š.; methodology, S.L., J.V., O.Š., S.G. and J.Č.-B.; software, L.P.; validation, L.V.; formal analysis, N.L.-K., D.C. and D.Š.; investigation, S.L., J.V., O.Š., B.P., G.V. and M.M.; resources, S.L. and L.V.; data curation, S.L.; writing—original draft preparation, S.L.; writing—review and editing, S.G., O.Š. and J.V.; visualisation, S. L. and L.P.; supervision, O.Š., J.Č.-B. and J.V.; funding acquisition, L.V. and J.V. All authors have read and agreed to the published version of the manuscript.
Funding
This work was financially supported by the Ministry of Scientific and Technological Development and Higher Education of the Republic of Srpska (Project No. 19.032/431-1-57/23) and by the Ministry of Science, Technological Development, and Innovation of the Republic of Serbia (grant numbers 451-03-136/2025-03/200134, 451-03-137/2025-03/200134, 451-03-136/2025-03/200051, and 451-03-136/2025-03/200222).
Data Availability Statement
The original contributions presented in the study are included in the article; further inquiries can be directed to the corresponding authors.
Conflicts of Interest
The authors declare no conflicts of interest. The funders had no role in the design of the study; in the collection, analyses, or interpretation of data; in the writing of the manuscript; or in the decision to publish the results.
References
- Gupta, S.C.; Sung, B.; Kim, J.H.; Prasad, S.; Li, S.; Aggarwal, B.B. Multitargeting by Turmeric, the Golden Spice: From Kitchen to Clinic. Mol. Nutr. Food Res. 2013, 57, 1510–1528. [Google Scholar] [CrossRef] [PubMed]
- de Oliveira Filho, J.G.; de Almeida, M.J.; Sousa, T.L.; dos Santos, D.C.; Egea, M.B. Bioactive Compounds of Turmeric (Curcuma longa L.). In Bioactive Compounds in Underutilized Vegetables and Legumes; Murthy, H.N., Paek, K.Y., Eds.; Springer International Publishing: Cham, Switzerland, 2021; pp. 297–318. ISBN 978-3-030-57415-4. [Google Scholar]
- Arsenov, D.; Župunski, M.; Pajević, S.; Nemeš, I.; Simin, N.; Alnuqaydan, A.M.; Watson, M.; Aloliqi, A.A.; Mimica-Dukić, N. Roots of Apium Graveolens and Petroselinum Crispum—Insight into Phenolic Status against Toxicity Level of Trace Elements. Plants 2021, 10, 1785. [Google Scholar] [CrossRef] [PubMed]
- Sepahpour, S.; Selamat, J.; Abdul Manap, M.Y.; Khatib, A.; Abdull Razis, A.F. Comparative Analysis of Chemical Composition, Antioxidant Activity and Quantitative Characterization of Some Phenolic Compounds in Selected Herbs and Spices in Different Solvent Extraction Systems. Molecules 2018, 23, 402. [Google Scholar] [CrossRef] [PubMed]
- Farooqi, A.A.; Kathiresan, C.; Srinivasappa, K.N. 17—Celeriac. In Handbook of Herbs and Spices; Peter, K.V., Ed.; Woodhead Publishing Series in Food Science, Technology and Nutrition; Woodhead Publishing: Saxton, UK, 2006; pp. 313–316. ISBN 978-1-84569-017-5. [Google Scholar]
- Ravindran, P.N. Parsley, Oregano, Thyme and Marjoram. In Handbook of Spices in India: 75 Years of Research and Development; Ravindran, P.N., Sivaraman, K., Devasahayam, S., Babu, K.N., Eds.; Springer Nature: Singapore, 2024; pp. 3185–3231. ISBN 978-981-19372-8-6. [Google Scholar]
- Shelef, L.A.; Naglik, O.A.; Bogen, D.W. Sensitivity of Some Common Food-Borne Bacteria to the Spices Sage, Rosemary, and Allspice. J. Food Sci. 1980, 45, 1042–1044. [Google Scholar] [CrossRef]
- Embuscado, M.E. Spices and Herbs: Natural Sources of Antioxidants—A Mini Review. J. Funct. Foods 2015, 18, 811–819. [Google Scholar] [CrossRef]
- El Gharras, H. Polyphenols: Food Sources, Properties and Applications—A Review. Int. J. Food Sci. Technol. 2009, 44, 2512–2518. [Google Scholar] [CrossRef]
- Hossain, M.B.; Ahmed, L.; Martin-Diana, A.B.; Brunton, N.P.; Barry-Ryan, C. Individual and Combined Antioxidant Activity of Spices and Spice Phenolics. Antioxidants 2023, 12, 308. [Google Scholar] [CrossRef]
- Latinović, S.; Vasilišin, L.; Pezo, L.; Lakić-Karalić, N.; Cvetković, D.; Ranitović, A.; Brunet, S.; Cvanić, T.; Vulić, J. Impact of Drying Methods on Phenolic Composition and Bioactivity of Celery, Parsley, and Turmeric—Chemometric Approach. Foods 2024, 13, 3355. [Google Scholar] [CrossRef]
- AOAC. Official Methods of Analysis, 15th ed.; Helrich, K., Ed.; Association of Official Analytical Chemists: Rockville, MD, USA, 1990. [Google Scholar]
- Lawless, L.J.R.; Hottenstein, A.; Ellingsworth, J. The Mccormick Spice Wheel: A Systematic and Visual Approach to Sensory Lexicon Development. J. Sens. Stud. 2012, 27, 37–47. [Google Scholar] [CrossRef]
- ISO 13299; Sensory Analysis—Methodology—General Guidance for Establishing a Sensory Profile. ISO: Geneva, Switzerland, 2016.
- ISO 4121; Sensory Analysis—Guidelines for the Use of Quantitative Response Scales. ISO: Geneva, Switzerland, 2003.
- ISO 6658; Sensory Analysis—Methodology—General Guidance. ISO: Geneva, Switzerland, 2017.
- ISO 8586; Sensory Analysis—General Guidelines for the Selection, Training and Monitoring of Selected Assessors and Expert Sensory Assessors. ISO: Geneva, Switzerland, 2012.
- ISO 8589; Sensory Analysis—General Guidance for the Design of Test Rooms. ISO: Geneva, Switzerland, 2007.
- El-Zaeddi, H.; Martínez-Tomé, J.; Calín-Sánchez, Á.; Burló, F.; Carbonell-Barrachina, Á.A. Volatile Composition of Essential Oils from Different Aromatic Herbs Grown in Mediterranean Regions of Spain. Foods 2016, 5, 41. [Google Scholar] [CrossRef]
- MacLeod, G.; Ames, J.M. Volatile Components of Celery and Celeriac. Phytochemistry 1989, 28, 1817–1824. [Google Scholar] [CrossRef]
- Petropoulos, S.A.; Daferera, D.; Polissiou, M.G.; Passam, H.C. The Effect of Water Deficit Stress on the Growth, Yield and Composition of Essential Oils of Parsley. Sci. Hortic. 2008, 115, 393–397. [Google Scholar] [CrossRef]
- Binello, A.; Grillo, G.; Barge, A.; Allegrini, P.; Ciceri, D.; Cravotto, G. A Cross-Flow Ultrasound-Assisted Extraction of Curcuminoids from Curcuma longa L.: Process Design to Avoid Degradation. Foods 2020, 9, 743. [Google Scholar] [CrossRef] [PubMed]
- Wolfe, K.; Wu, X.; Liu, R.H. Antioxidant Activity of Apple Peels. J. Agric. Food Chem. 2003, 51, 609–614. [Google Scholar] [CrossRef]
- Liyana-Pathirana, C.M.; Shahidi, F. Antioxidant Activity of Commercial Soft and Hard Wheat (Triticum aestivum L.) as Affected by Gastric pH Conditions. J. Agric. Food Chem. 2005, 53, 2433–2440. [Google Scholar] [CrossRef]
- Re, R.; Pellegrini, N.; Proteggente, A.; Pannala, A.; Yang, M.; Rice-Evans, C. Antioxidant Activity Applying an Improved ABTS Radical Cation Decolorization Assay. Free Radic. Biol. Med. 1999, 26, 1231–1237. [Google Scholar] [CrossRef]
- Benzie, I.F.; Strain, J.J. Ferric Reducing/Antioxidant Power Assay: Direct Measure of Total Antioxidant Activity of Biological Fluids and Modified Version for Simultaneous Measurement of Total Antioxidant Power and Ascorbic Acid Concentration. Methods Enzym. 1999, 299, 15–27. [Google Scholar] [CrossRef]
- CLSI (Clinical and Laboratory Standards Institute). Performance Standards for Antimicrobial Susceptibility Testing. CLSI Supplement M100, 30th ed.; CLSI: Wayne, PA, USA, 2020; ISBN 978-1-68440-067-6. [Google Scholar]
- Vučetić, A.; Šovljanski, O.; Pezo, L.; Gligorijević, N.; Kostić, S.; Vulić, J.; Čanadanović-Brunet, J. A Comprehensive Antioxidant and Nutritional Profiling of Brassicaceae Microgreens. Antioxidants 2025, 14, 191. [Google Scholar] [CrossRef]
- Brlek, T.; Pezo, L.; Voća, N.; Krička, T.; Vukmirović, Đ.; Čolović, R.; Bodroža-Solarov, M. Chemometric Approach for Assessing the Quality of Olive Cake. Fuel Process. Technol. 2013, 116, 250–256. [Google Scholar] [CrossRef]
- Šovljanski, O.; Pezo, L.; Tomić, A.; Ranitović, A.; Cvetković, D.; Markov, S. Contribution of Bacterial Cells as Nucleation Centers in Microbiologically Induced CaCO3 Precipitation—A Mathematical Modeling Approach. J. Basic. Microbiol. 2021, 61, 835–848. [Google Scholar] [CrossRef]
- Šovljanski, O.; Tomić, A.; Pezo, L.; Ranitović, A.; Markov, S. Prediction of Denitrification Capacity of Alkalotolerant Bacterial Isolates from Soil—An Artificial Neural Network Model. J. Serbian Chem. Soc. 2020, 85, 1417–1427. [Google Scholar] [CrossRef]
- Šovljanski, O.; Saveljić, A.; Aćimović, M.; Šeregelj, V.; Pezo, L.; Tomić, A.; Ćetković, G.; Tešević, V. Biological Profiling of Essential Oils and Hydrolates of Ocimum Basilicum Var. Genovese and Var. Minimum Originated from Serbia. Processes 2022, 10, 1893. [Google Scholar] [CrossRef]
- Srinivasan, K. Role of Spices Beyond Food Flavoring: Nutraceuticals with Multiple Health Effects. Food Rev. Int. 2005, 21, 167–188. [Google Scholar] [CrossRef]
- Olayinka, I.O. Proximate, Mineral Composition and Phytochemical Analyses of Turmeric (Curcuma longa) Powder. Niger. J. Anim. Prod. 2023, 874–878. [Google Scholar]
- Enemor, V.H.A.; Ogbodo, U.C.; Nworji, O.F.; Ezeigwe, O.C.; Okpala, C.O.; Iheonunekwu, G.C. Evaluation of the Nutritional Status and Phytomedicinal Properties of Dried Rhizomes of Turmeric (Curcuma longa). J. Biosci. Med. 2020, 8, 163–179. [Google Scholar] [CrossRef]
- Petropoulos, S.A.; Fernandes, Â.; Finimundy, T.C.; Polyzos, N.; Pinela, J.; Ivanov, M.; Soković, M.; Ferreira, I.C.F.R.; Barros, L. The Bioactivities and Chemical Profile of Turnip-Rooted Parsley Germplasm. Horticulturae 2022, 8, 639. [Google Scholar] [CrossRef]
- Ebru, K.; Fatıma, Y.; Gizem, G.T.; Berna, Ö.Ç.; Afife, M. Quality of Turmeric Powder in Herbal Stores: Pharmacognostical Investigations on Turmeric Powders Obtained from Herbal Stores in Istanbul, Turkey. İstanbul J. Pharm. 2021, 51, 92–97. Available online: https://iupress.istanbul.edu.tr/en/journal/ijp/article/quality-of-turmeric-powder-in-herbal-stores-pharmacognostical-investigations-on-turmeric-powders-obtained-from-herbal-stores-in-istanbul-turkey (accessed on 1 March 2025).
- Parmar, R.G.; Dabhi, M.N.; Rathod, P.J. Effect of Drying Temperature on Proximate Components of Turmeric Rhizome in Tray Dryer: Efecto de La Temperatura de Secado Sobre Los Componentes Proximales Del Rizoma de Cúrcuma En Secadero de Bandejas. S. Fla. J. Environ. Anim. Sci. 2023, 3, 174–181. [Google Scholar] [CrossRef]
- Jeleń, H. Specificity of Food Odorants. In Food Flavors: Chemical, Sensory and Technological Properties; Jeleń, H., Ed.; CRC Press: Boca Raton, FL, USA, 2012; ISBN 978-1-4398-1491-8. [Google Scholar]
- Murray, J.M.; Delahunty, C.M.; Baxter, I.A. Descriptive Sensory Analysis: Past, Present and Future. Food Res. Int. 2001, 34, 461–471. [Google Scholar] [CrossRef]
- Shen, N.; Wang, T.; Gan, Q.; Liu, S.; Wang, L.; Jin, B. Plant Flavonoids: Classification, Distribution, Biosynthesis, and Antioxidant Activity. Food Chem. 2022, 383, 132531. [Google Scholar] [CrossRef]
- Prakash, O.; Kumar, A.; Tiwari, S.; Bajpai, P. The Versatility of Apigenin: Especially as a Chemopreventive Agent for Cancer. J. Holist. Integr. Pharm. 2024, 5, 249–256. [Google Scholar] [CrossRef]
- Rozenberg, J.M.; Kamynina, M.; Sorokin, M.; Zolotovskaia, M.; Koroleva, E.; Kremenchutckaya, K.; Gudkov, A.; Buzdin, A.; Borisov, N. The Role of the Metabolism of Zinc and Manganese Ions in Human Cancerogenesis. Biomedicines 2022, 10, 1072. [Google Scholar] [CrossRef] [PubMed]
- Singh, P.; Prasad, S. A Review on Iron, Zinc and Calcium Biological Significance and Factors Affecting Their Absorption and Bioavailability. J. Food Compos. Anal. 2023, 123, 105529. [Google Scholar] [CrossRef]
- Nikaido, H. Molecular Basis of Bacterial Outer Membrane Permeability Revisited. Microbiol. Mol. Biol. Rev. 2003, 67, 593–656. [Google Scholar] [CrossRef]
- Li, X.-Z.; Nikaido, H. Efflux-Mediated Drug Resistance in Bacteria. Drugs 2004, 64, 159–204. [Google Scholar] [CrossRef]
- Odo, E.O.; Ikwuegbu, J.A.; Obeagu, E.I.; Chibueze, S.A.; Ochiaka, R.E. Analysis of the Antibacterial Effects of Turmeric on Particular Bacteria. Medicine 2023, 102, e36492. [Google Scholar] [CrossRef]
- Beshiru, A.; Igbinosa, I.H.; Salami, J.O.; Uwhuba, K.E.; Ogofure, A.G.; Azazi, G.M.; Igere, B.E.; Anegbe, B.; Evuen, U.F.; Igbinosa, E.O. Curcuma longa Rhizome Extract: A Potential Antibiofilm Agent against Antibiotic-Resistant Foodborne Pathogens. Biofouling 2024, 40, 932–947. [Google Scholar] [CrossRef]
- Adamczak, A.; Ożarowski, M.; Karpiński, T.M. Curcumin, a Natural Antimicrobial Agent with Strain-Specific Activity. Pharmaceuticals 2020, 13, 153. [Google Scholar] [CrossRef]
- Alam, S.; Chowdhury, M.N.R.; Hossain, M.A.; Richi, F.T.; Emon, N.U.; Mohammad, M.; Ahmed, N.; Taher, M.A. Antifungal Potentials of Asian Plants: Ethnobotanical Insights and Phytochemical Investigations. Chem. Biodivers. 2025, 22, e202402867. [Google Scholar] [CrossRef]
- Roney, M.; Huq, A.K.M.M.; Rullah, K.; Zamri, N.B.; Mohd Aluwi, M.F.F. Curcumin, a Bioactive Compound of Turmeric (Curcuma longa) and Its Derivatives as α-Amylase and α-Glucosidase Inhibitors. Cell Biochem. Biophys. 2024, 83, 53–71. [Google Scholar] [CrossRef]
- Yao, Y.; Wang, W.; Li, M.; Ren, H.; Chen, C.; Wang, J.; Wang, W.E.; Yang, J.; Zeng, C. Curcumin Exerts Its Anti-Hypertensive Effect by Down-Regulating the AT1 Receptor in Vascular Smooth Muscle Cells. Sci. Rep. 2016, 6, 25579. [Google Scholar] [CrossRef] [PubMed]
- Zhuang, X.; Liao, L.; Dong, X.; Hu, X.; Guo, Y.; Du, Z.; Liao, X.; Wang, L. Design, Synthesis, and Antihypertensive Activity of Curcumin-Inspired Compounds via ACE Inhibition and Vasodilation, along with a Bioavailability Study for Possible Benefit in Cardiovascular Diseases. Drug Des. Devel Ther. 2016, 10, 129–139. [Google Scholar] [CrossRef] [PubMed]
- Boretti, A. Curcumin-Based Fixed Dose Combination Products for Cholesterol Management: A Narrative Review. ACS Pharmacol. Transl. Sci. 2024, 7, 300–308. [Google Scholar] [CrossRef] [PubMed]
- Zhang, Z.; Li, X.; Sang, S.; McClements, D.J.; Chen, L.; Long, J.; Jiao, A.; Jin, Z.; Qiu, C. Polyphenols as Plant-Based Nutraceuticals: Health Effects, Encapsulation, Nano-Delivery, and Application. Foods 2022, 11, 2189. [Google Scholar] [CrossRef]
- Awari, A.; Kumar, M.; Kaushik, D.; Amarowicz, R.; Proestos, C.; Wahab, R.; Khan, M.R.; Tomasevic, I.; Oz, E.; Oz, F. Proximate Analysis and Techno-Functional Properties of Berberis Aristata Root Powder: Implications for Food Industry Applications. Foods 2024, 13, 2802. [Google Scholar] [CrossRef]
- Long, D.Q.; Doan, T.B.N.; Ton, N.M.N.; Tran, T.T.T.; Le, V.V.M. Quality of Durum Wheat Pasta Fortified with Different Ratios of Turmeric Residue Powder. J. Agric. Food Res. 2024, 16, 101220. [Google Scholar] [CrossRef]
- Bazsefidpar, N.; Ghandehari Yazdi, A.P.; Karimi, A.; Yahyavi, M.; Amini, M.; Ahmadi Gavlighi, H.; Simal-Gandara, J. Brewers Spent Grain Protein Hydrolysate as a Functional Ingredient for Muffins: Antioxidant, Antidiabetic, and Sensory Evaluation. Food Chem. 2024, 435, 137565. [Google Scholar] [CrossRef]
- Sarkar, D.; Christopher, A.; Shetty, K. Phenolic Bioactives From Plant-Based Foods for Glycemic Control. Front. Endocrinol. 2022, 12, 727503. [Google Scholar] [CrossRef]
- Hawash, M.; Jaradat, N.; Salhi, N.A.; Shatreet, B.; Asbah, A.A.; Hawash, Y.H. Assessing the Therapeutic Potential and Safety of Traditional Anti-Obesity Herbal Blends in Palestine. Sci. Rep. 2024, 14, 1919. [Google Scholar] [CrossRef]
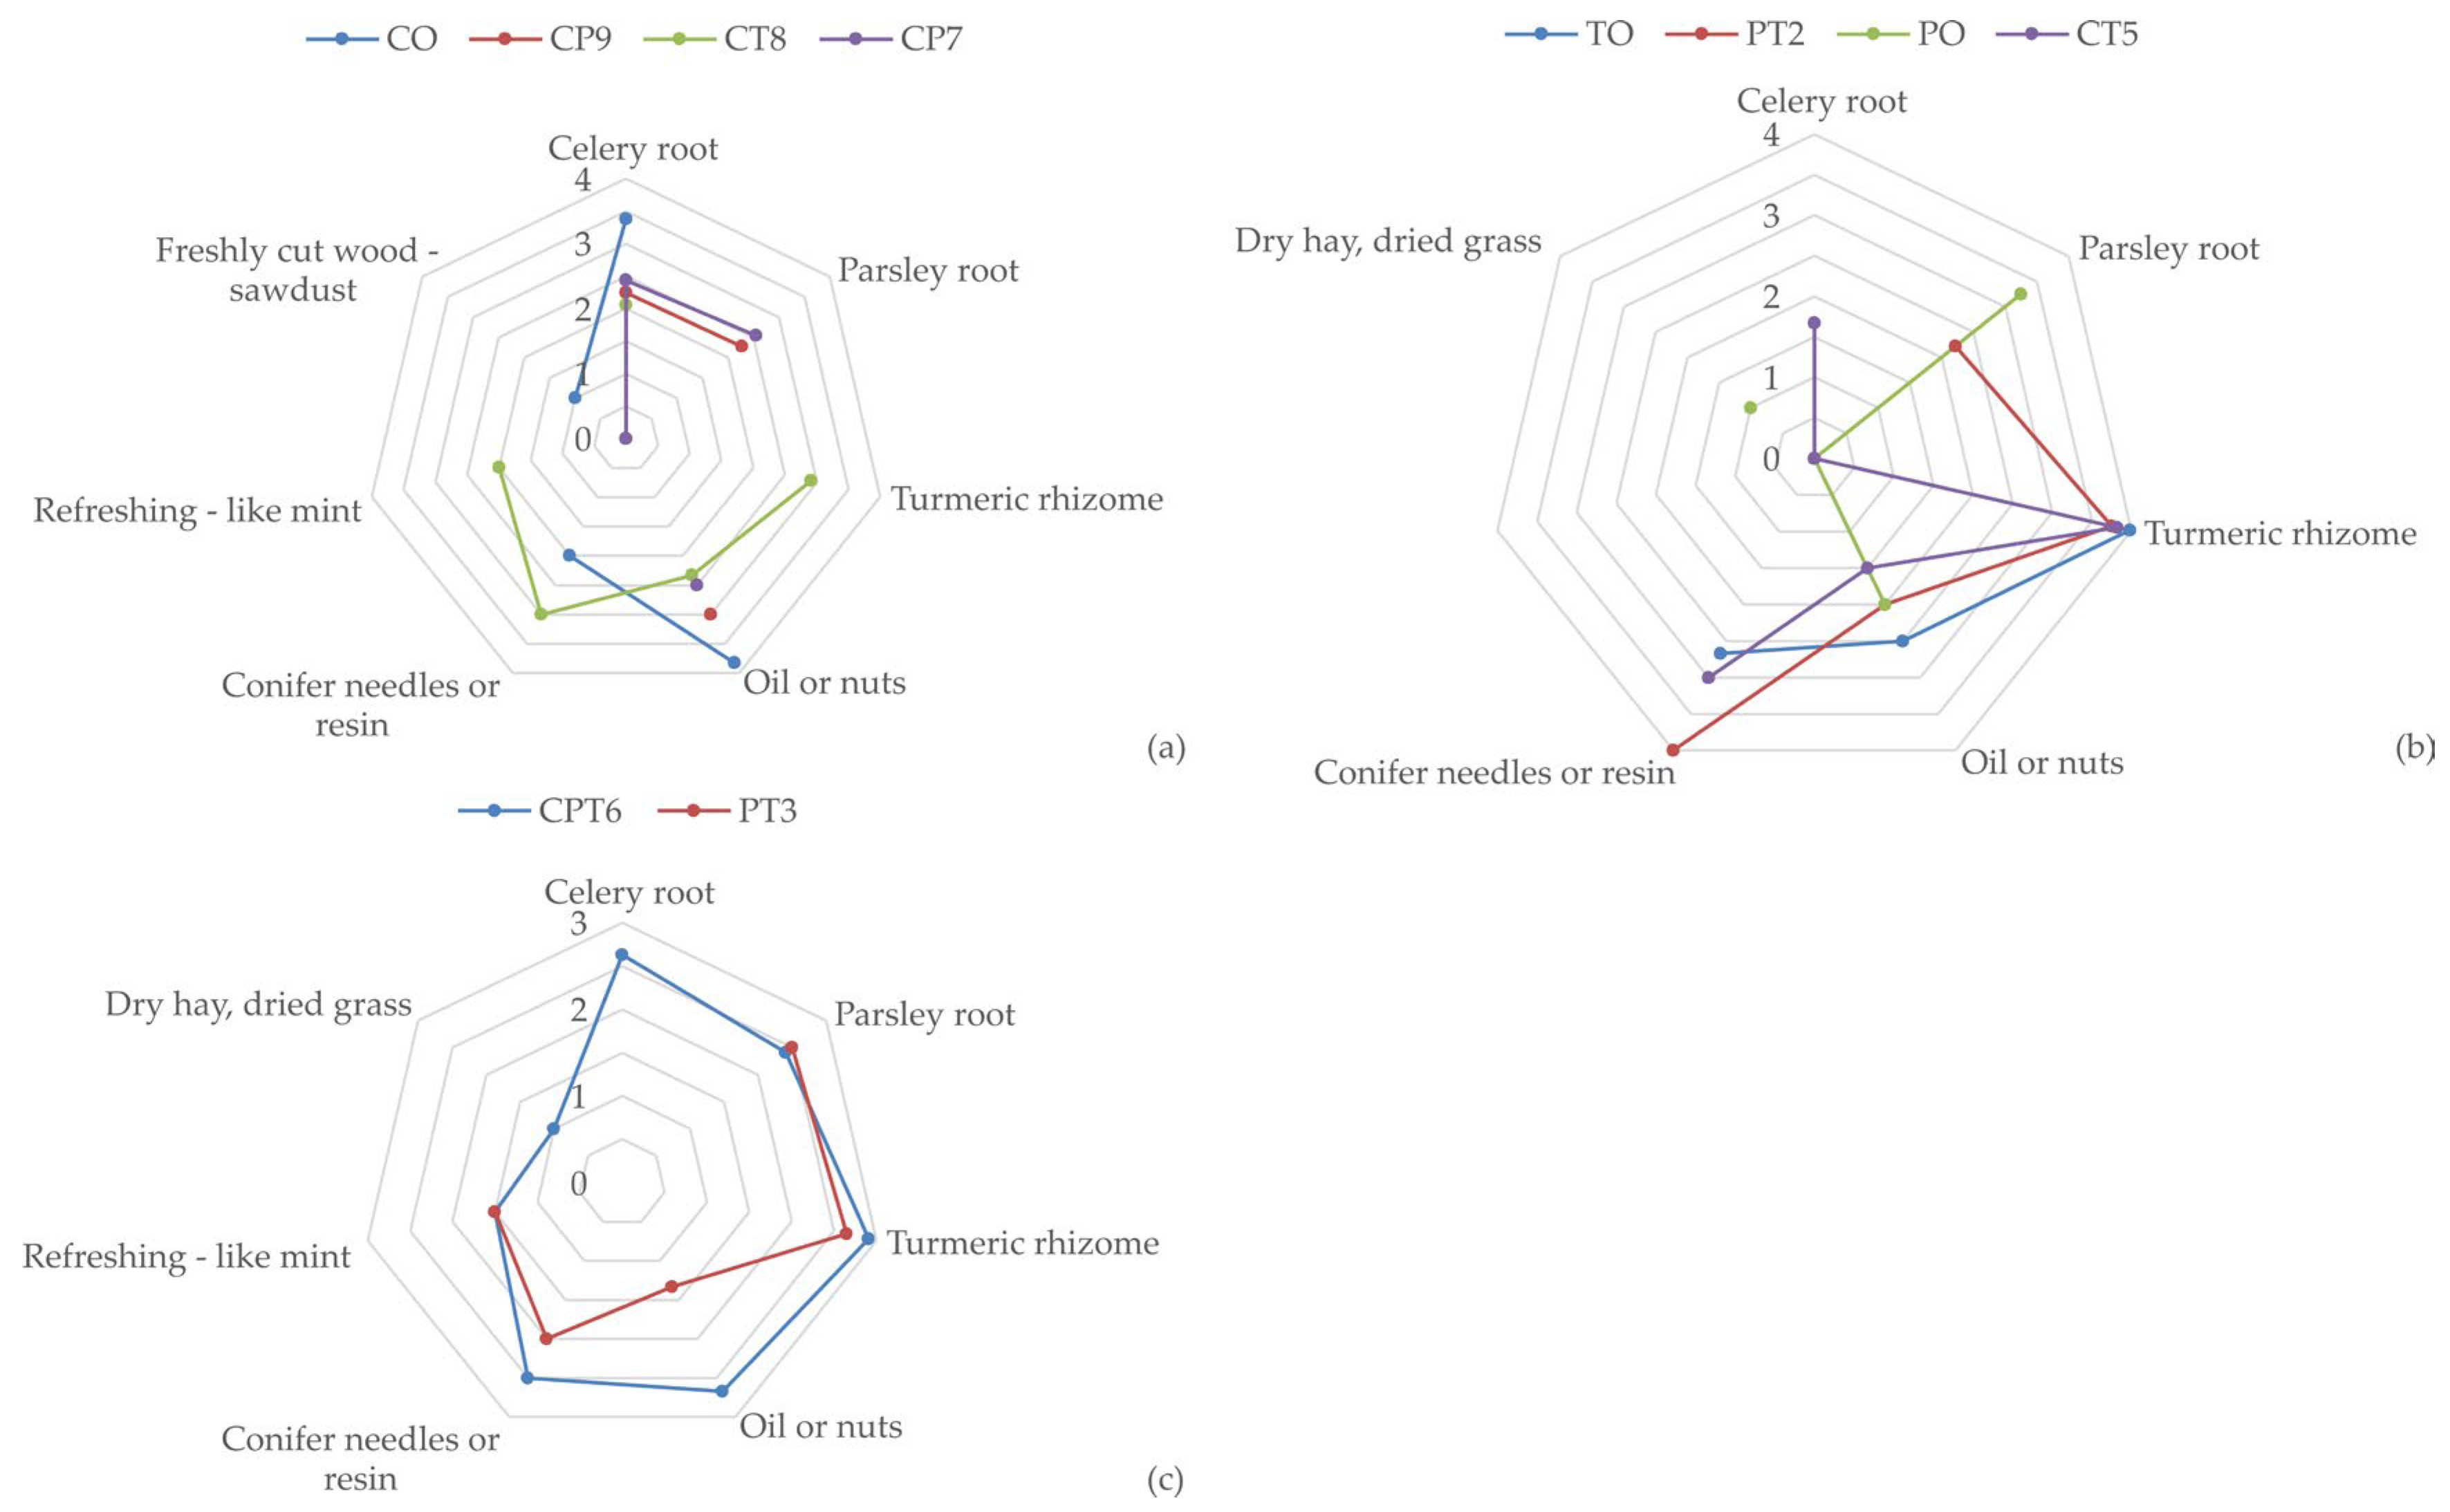
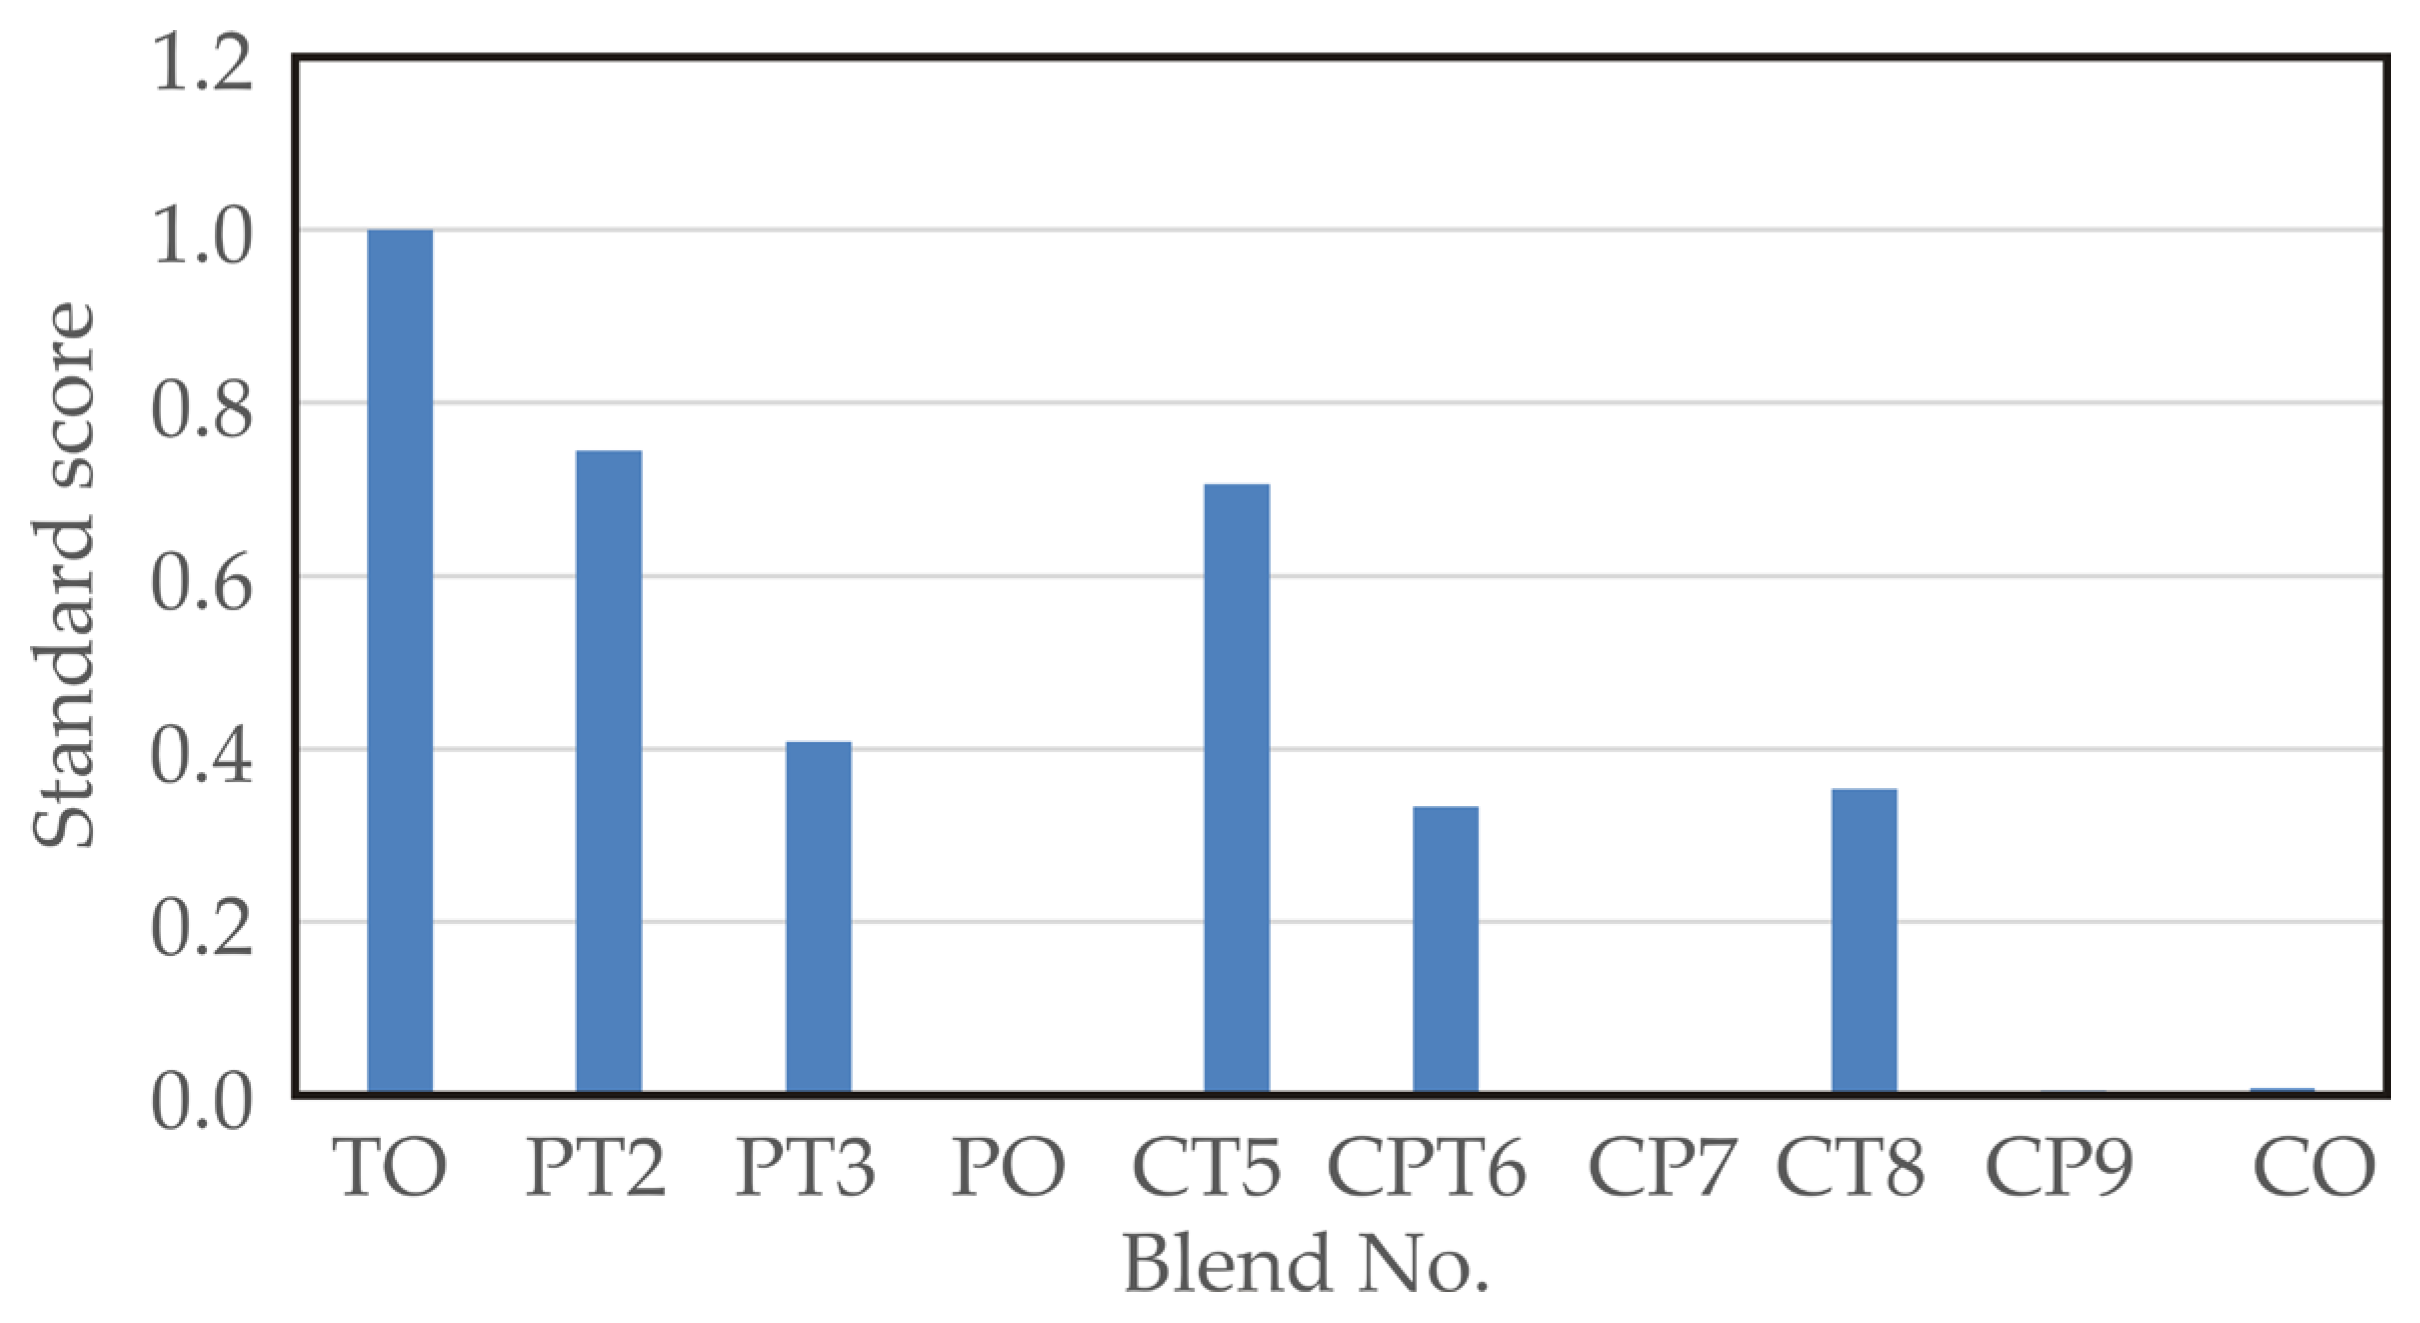
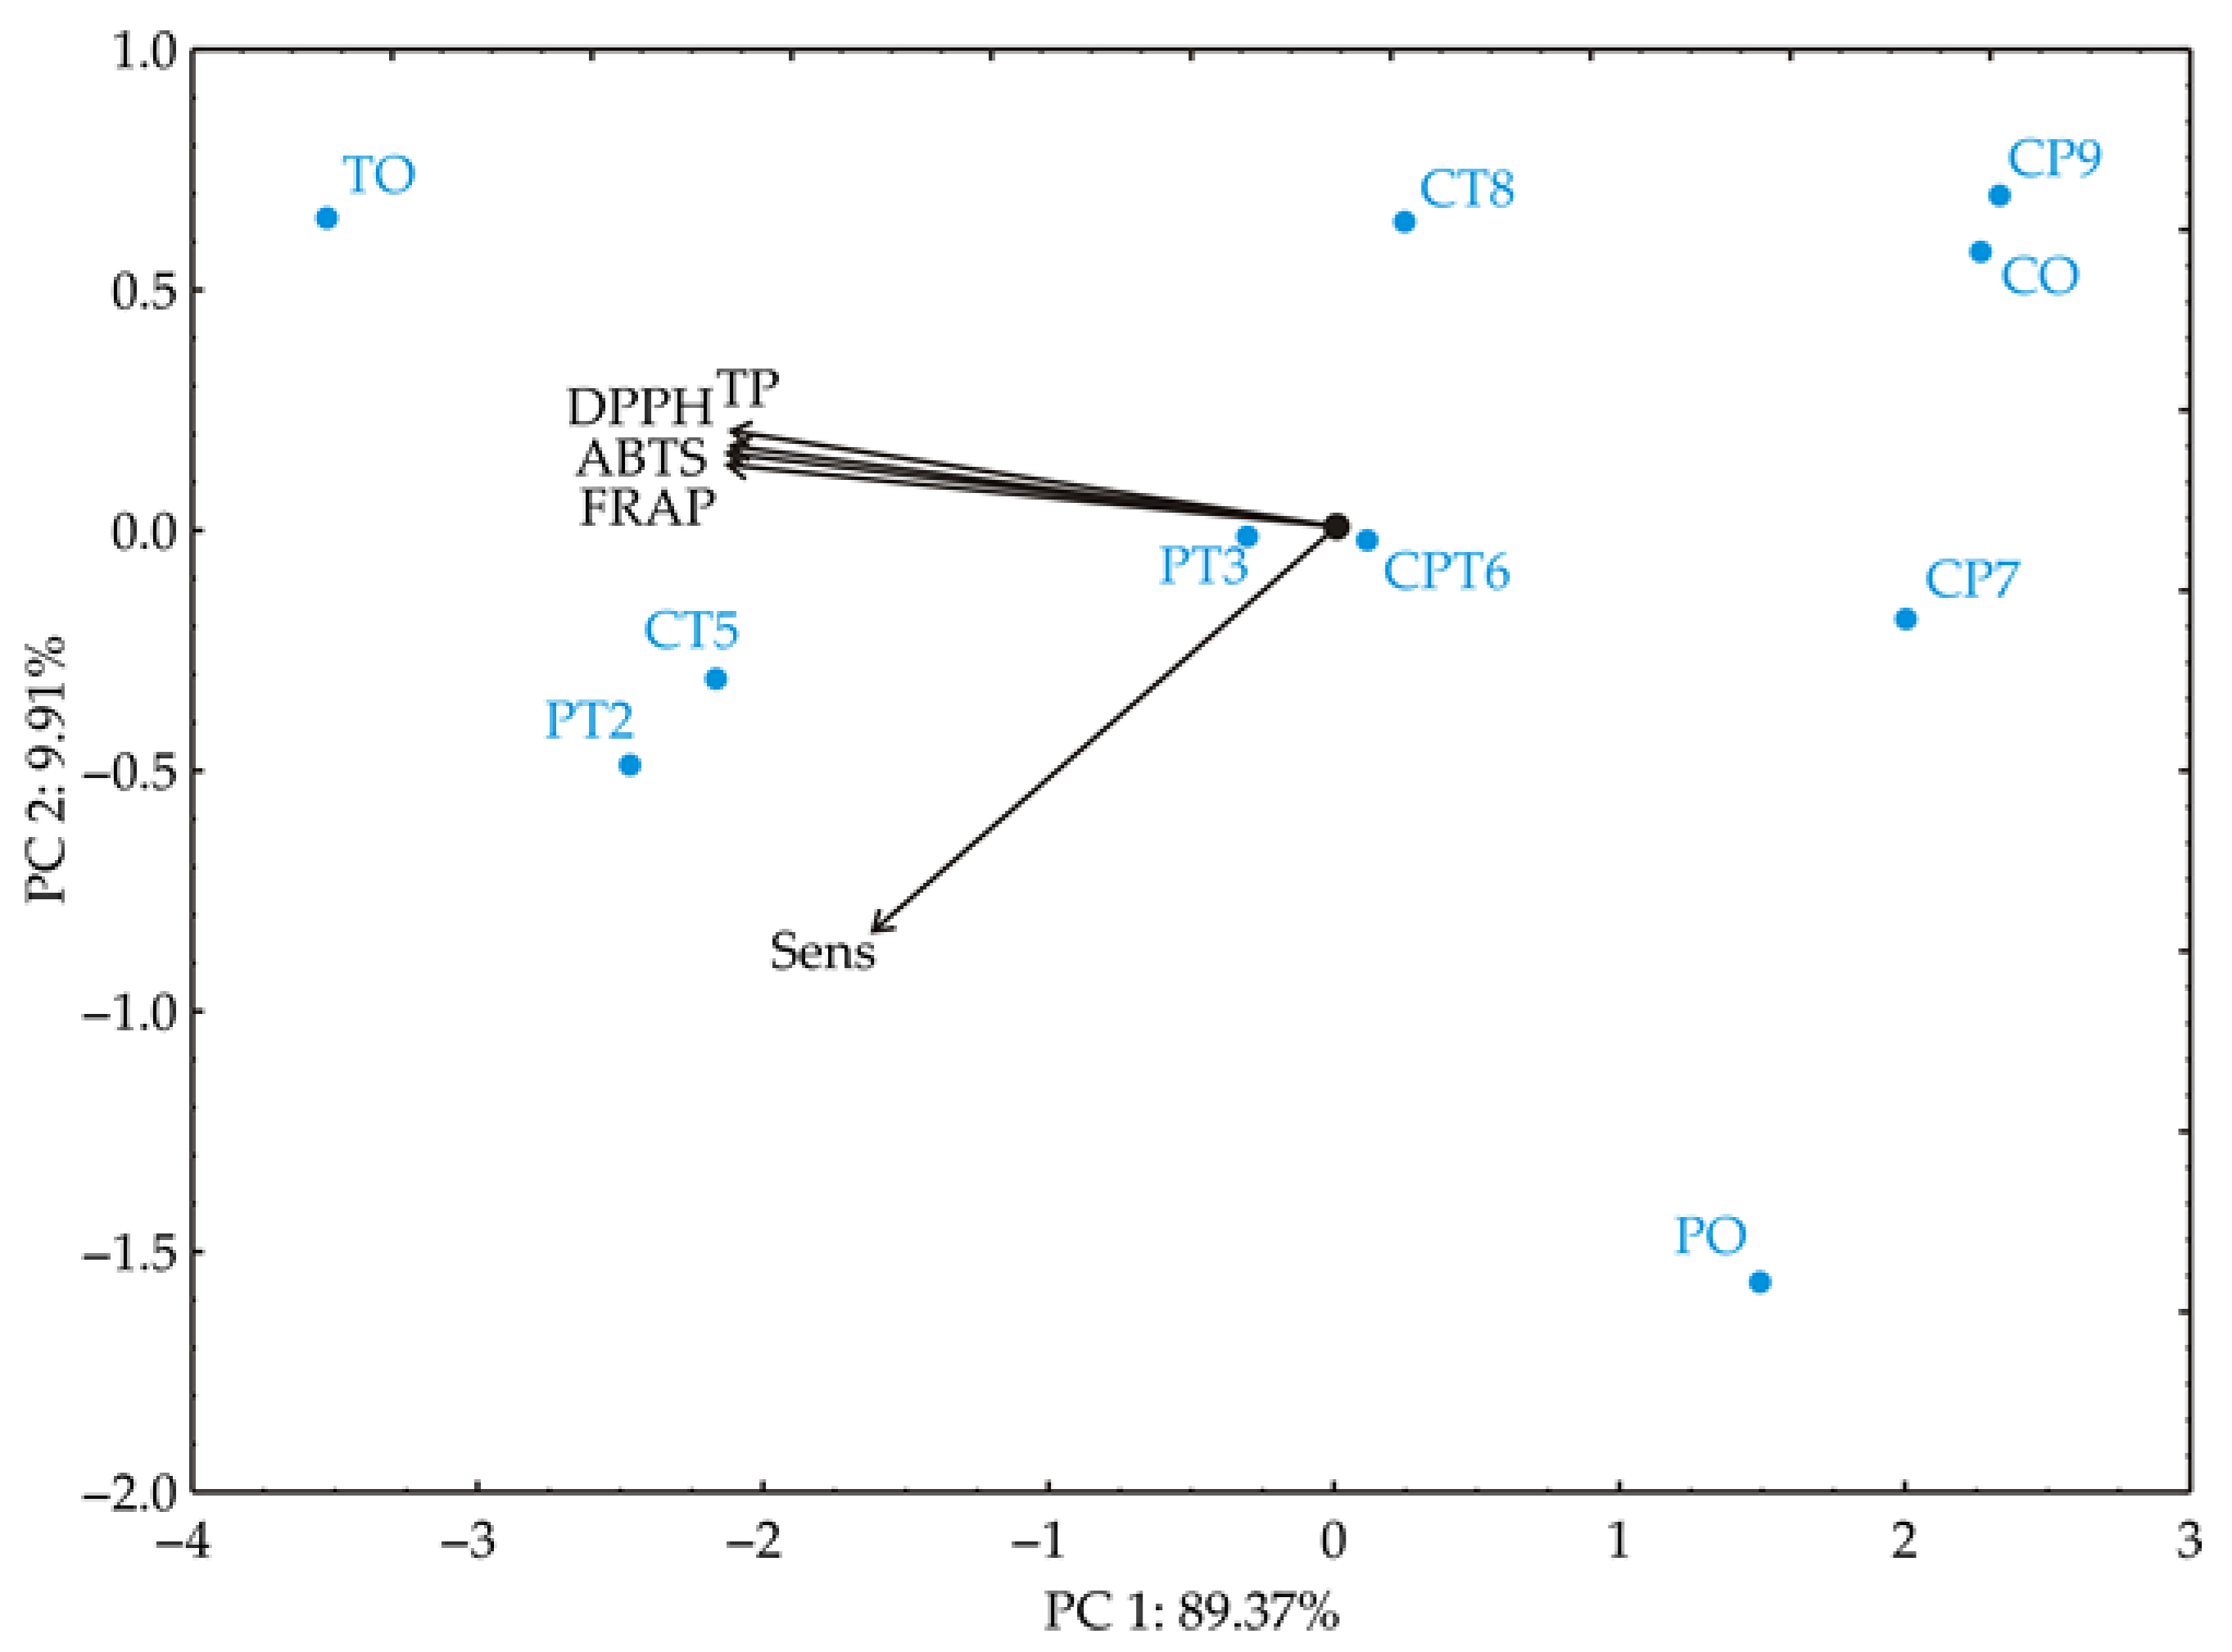
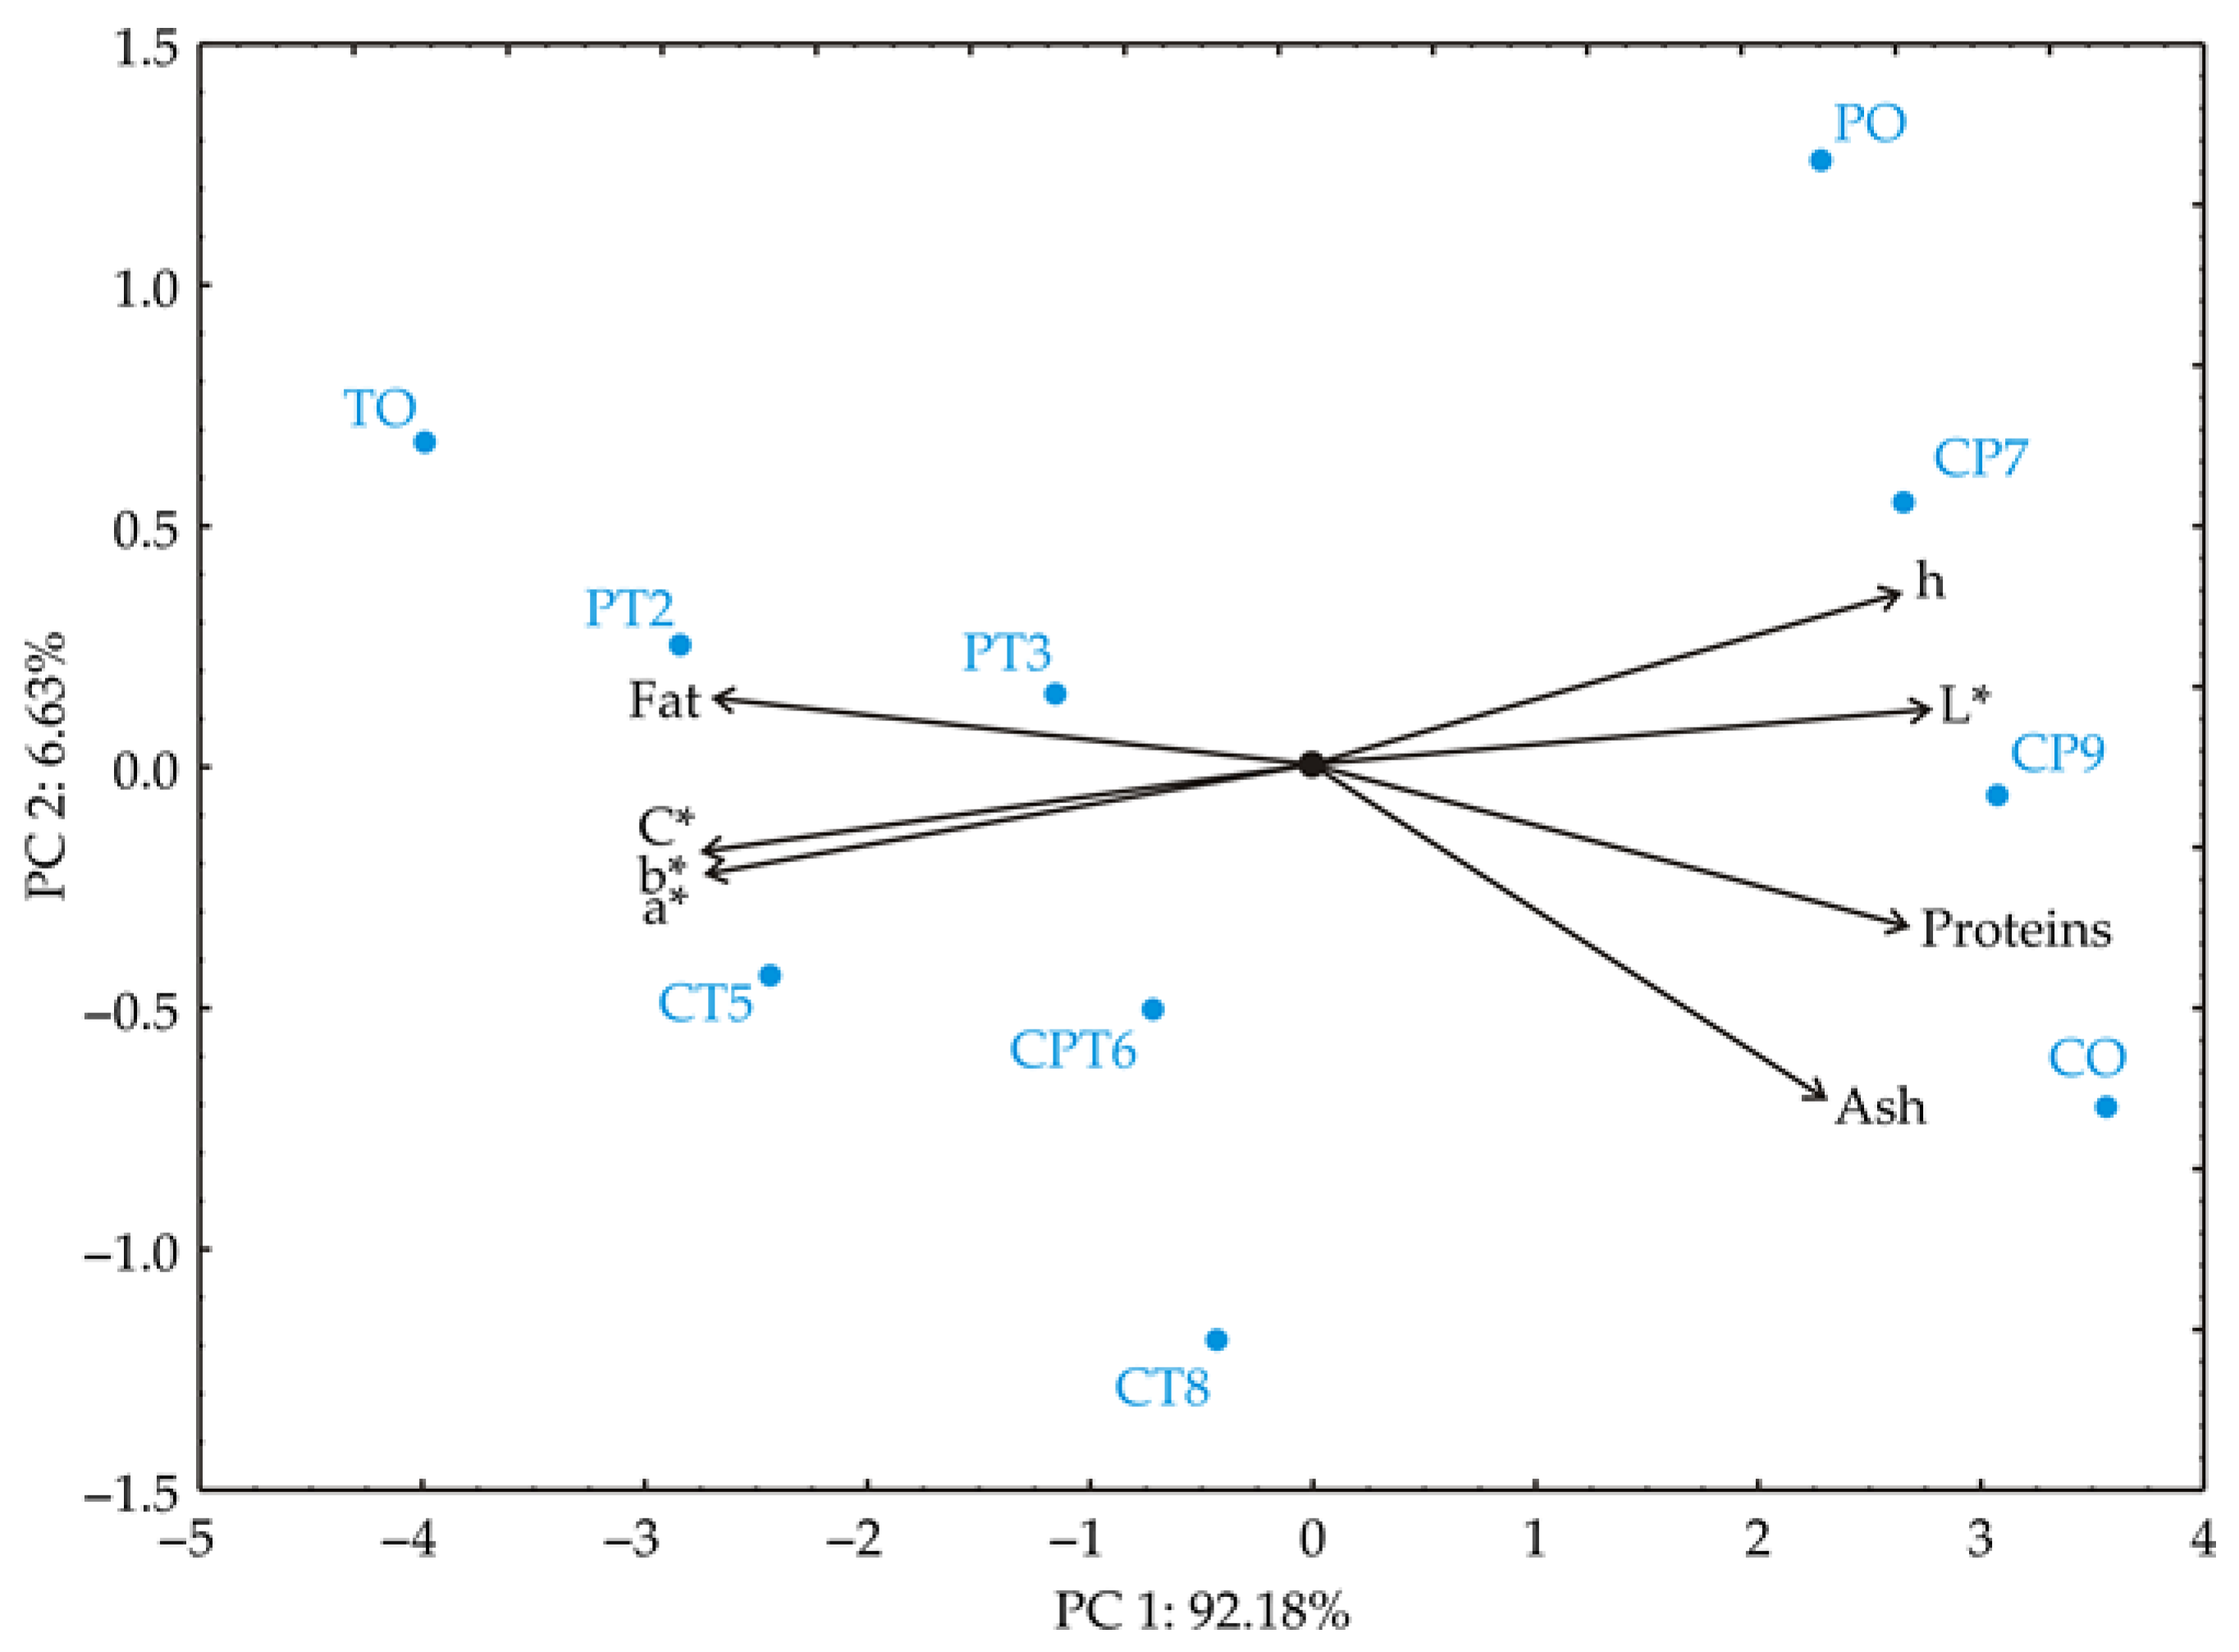
Disclaimer/Publisher’s Note: The statements, opinions and data contained in all publications are solely those of the individual author(s) and contributor(s) and not of MDPI and/or the editor(s). MDPI and/or the editor(s) disclaim responsibility for any injury to people or property resulting from any ideas, methods, instructions or products referred to in the content. |
© 2025 by the authors. Licensee MDPI, Basel, Switzerland. This article is an open access article distributed under the terms and conditions of the Creative Commons Attribution (CC BY) license (https://creativecommons.org/licenses/by/4.0/).