Abstract
Deep drawing is a common process for shaping paperboard packages. To improve performance, the paperboard is kept in a room with high humidity before treatment. The surfaces of forming tools that come into contact with the paperboard are heated. A control problem for heating moist paperboard, with evaporation from the pore surface, is considered in this paper. Micro-CT images of three different paperboards are taken, segmented, and parameterized with respect to the specific pore surface in terms of the pore surface per pore volume, pore volume fraction, fiber thickness, average surface contact area between fibers, and unsupported fiber length. Simple averaging formulas are provided to compute the effective coefficients in the coupled water-diffusion and heat-transfer problem with a phase transition. The model is validated by experimental measurements and offers an opportunity for optimal heating control to simultaneously ensure compliance of the paperboard layer, leading to small delamination at its boundary, thereby avoiding folding.
Keywords:
homogenization; heat–moisture transfer with evaporation; phase transition; homogenized latent heat; optimal heat control; paperboard MSC:
00A71; 00A72; 00A73; 74Q05; 74Q10; 74Q15; 74Q20; 74P10
1. Introduction
1.1. Physical Problem Formulation
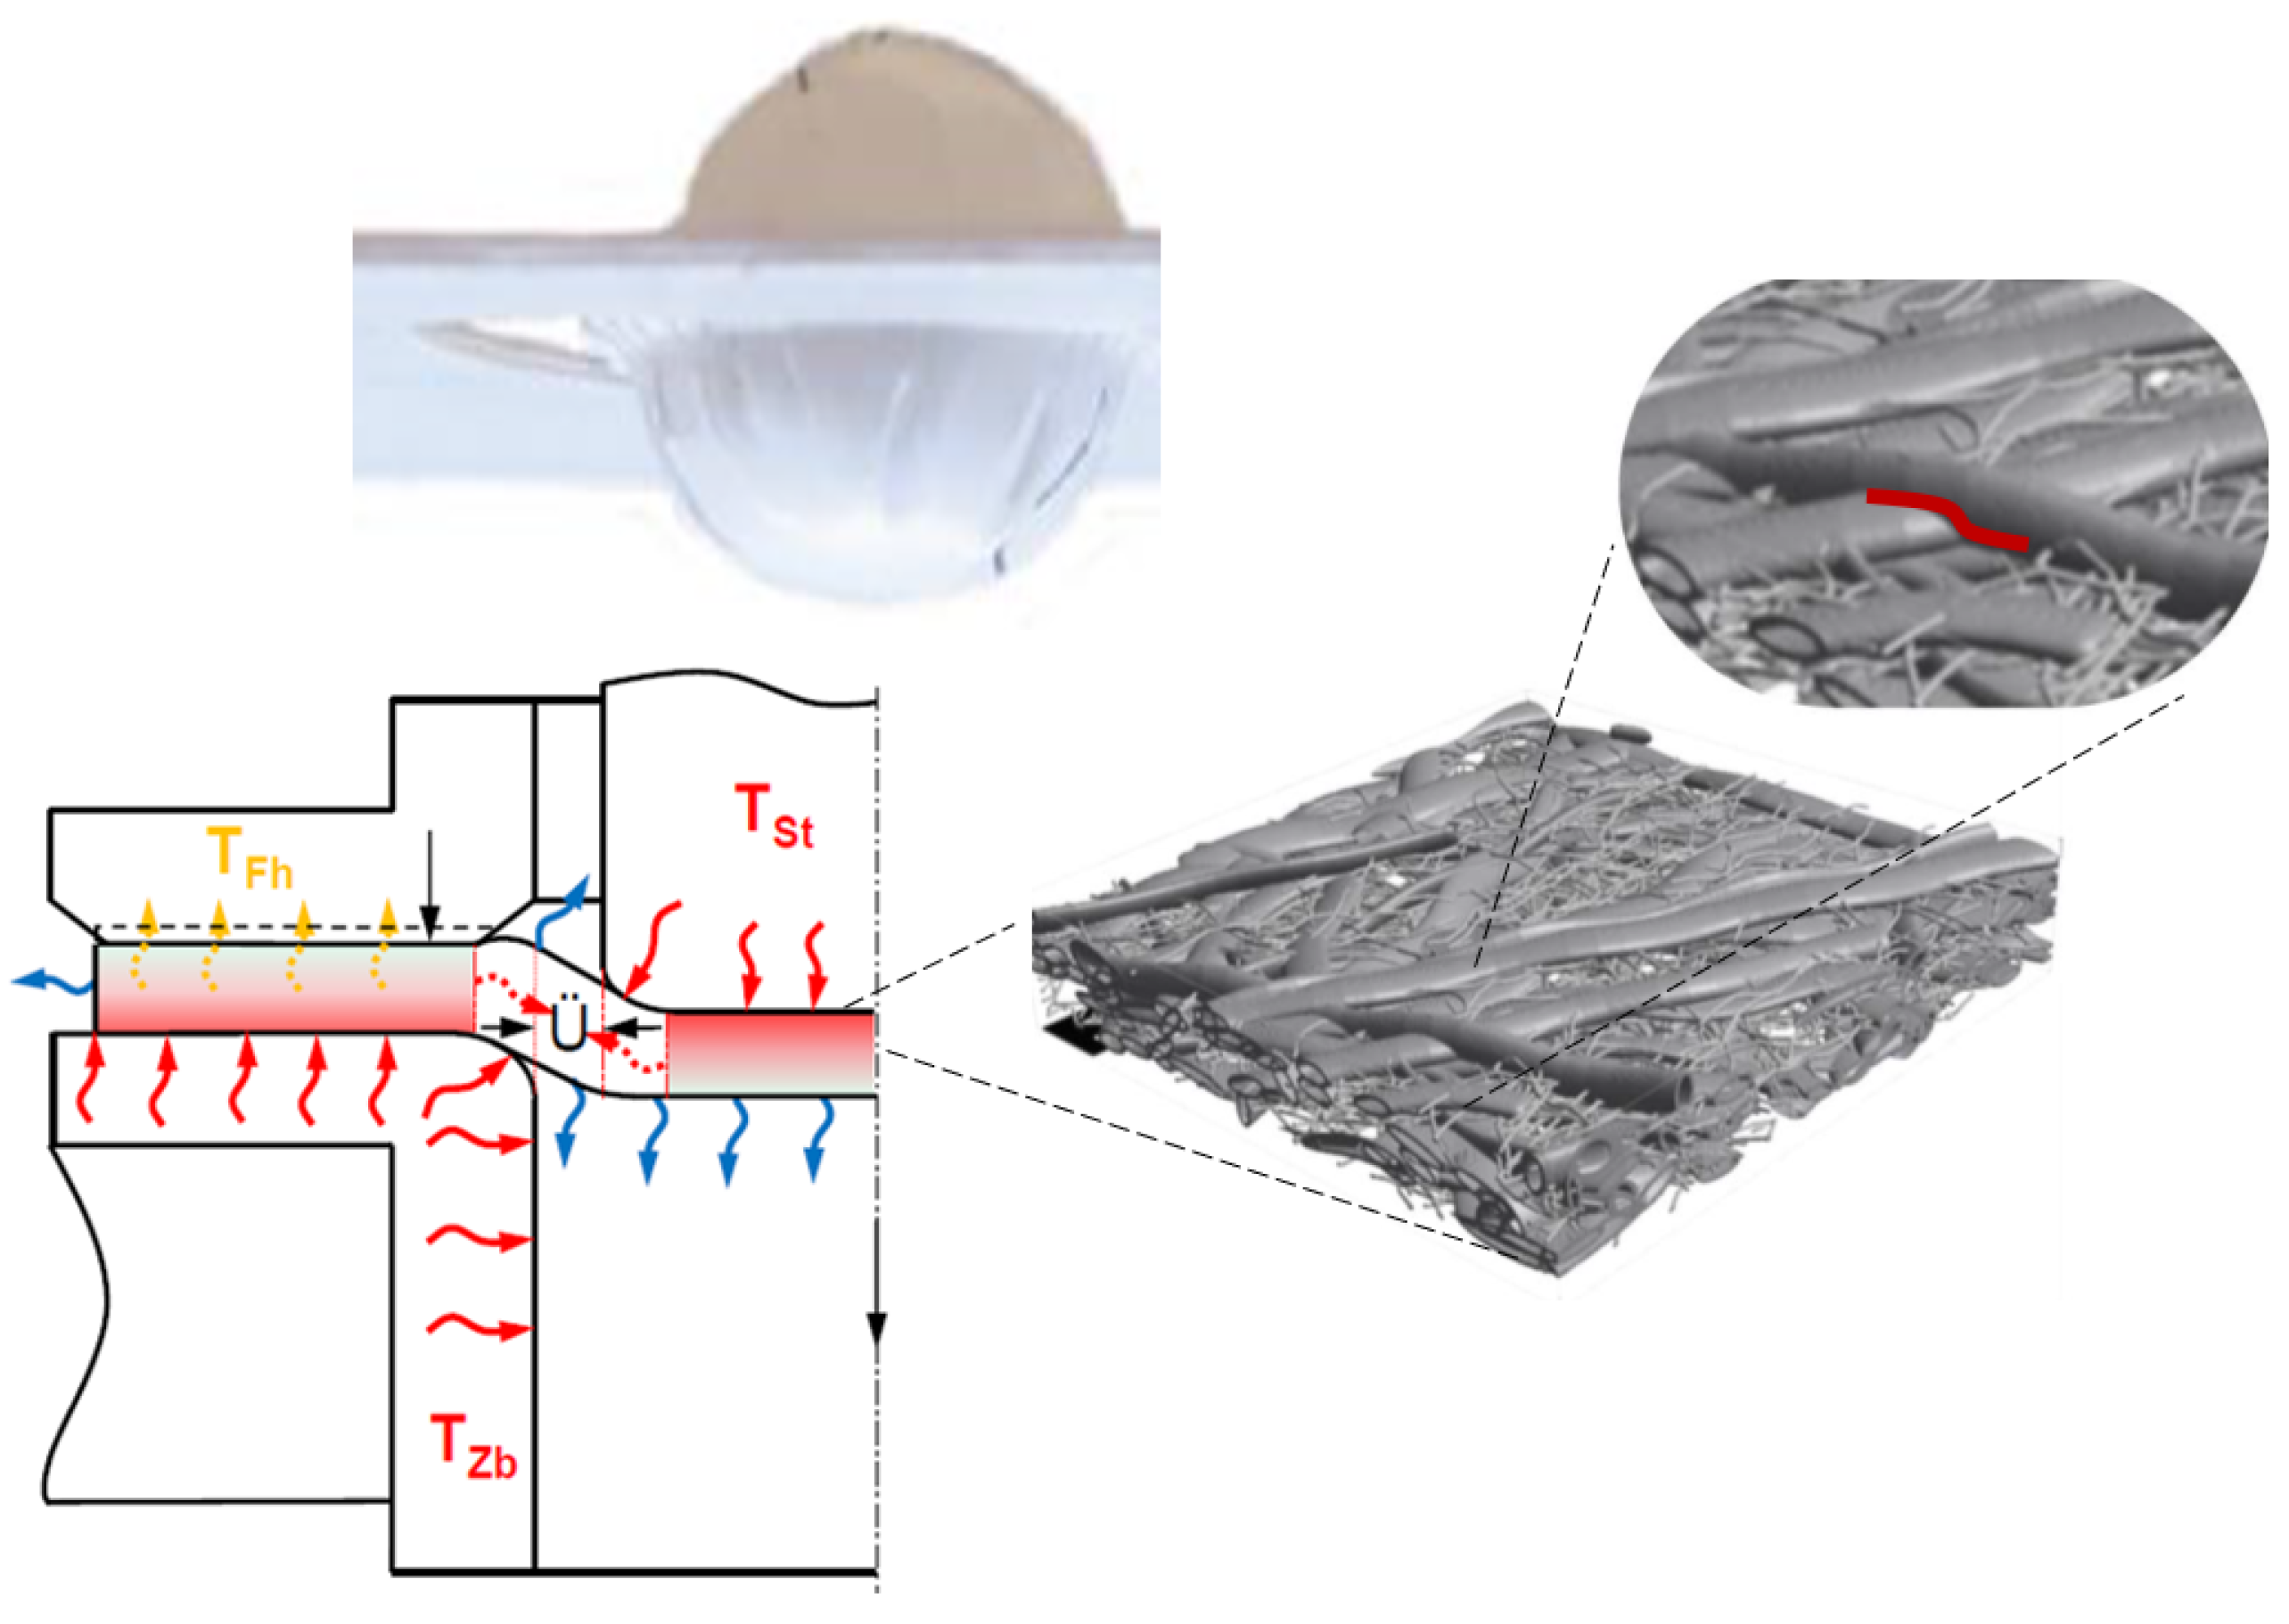
This paper is devoted to the simulation of coupled heat–moisture transport in the deep drawing process of paperboard. Paperboard usually contains an initial humidity of about 7–12%. One-side heating, shown in Figure 1, aims to reduce surface friction with the forming tools, makes the paperboard softer due to the vapor, and can improve the local delamination, which is a mechanism to avoid macroscopic buckling during the process; see [1].
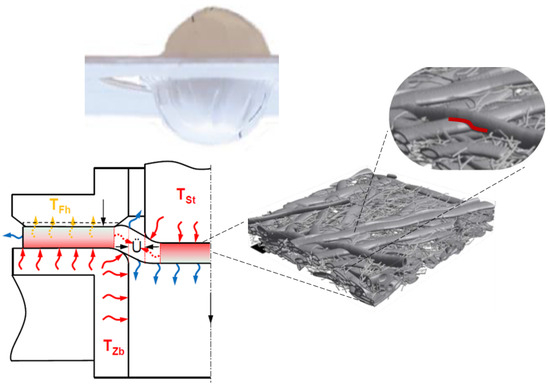
Figure 1.
Moisture- and heat-controlled deep drawing of micro-structured and porous paperboard. Virtual micro-structure model generated from μCT images (Fraunhofer ITWM).
The thermoforming process is shown schematically in Figure 1. The micro-structure of the board is reconstructed from micro-CT scans, as shown in the same figure, and it determines the effective thermal conductivity of the board. The heating temperature of the device does not change along the flat parts of the board; therefore, the thermal conduction problem with diffusion and evaporation will be reduced to a one-dimensional heat conduction problem coupled with moisture diffusion through an effective (homogenized) wall; see Figure 1.
In [2], we started with a mathematical model for heat conduction and diffusion in a porous medium with given initial and boundary conditions, the evaporation conditions on the pore boundary, and a phase transition for a given latent heat and derived the effective model that we want to apply here.
The model in [2] is essentially based on the following assumptions. The initial water content in the paperboard is small, so we assume that the water is bonded and situated almost exclusively in fibers. Under this assumption, the water transport goes through the fibers and their contact surfaces. Due to the contrast in heat conduction coefficients between the water, dry cellulose, and air, whenever water is present in the fibers, heat transfer goes in the same direction as the diffusion (in fibers and through the contact surfaces), and afterward, when the water has evaporated, the heat goes through the pores and fibers, but much more slowly.
Ref. [2] provides simple analytic computational formulas for the effective diffusion and heat conduction coefficients, which are different along and across the fibers (see Section 3).
We give a short description of the implicit numerical method, accounting for the diffusion, phase transition, and changing heat coefficient. Finally, some numerical examples for three chosen paperboards are presented in Section 7. The simulated temperature distribution coincides well with the experimentally measured curves.
1.2. State of the Art in the Heat–Moisture Transfer Modeling and the Effort of the Suggested Approach
In [3,4,5,6,7], the exchange/dissipation can be reasoned by evaporation and condensation, or adsorption of water and moisture transport inside the porous structure, between the pores and fibers, with capillary effects. In this paper, we use the effective model discussed in [3,4] and mathematically justified in [2]. The interface evaporation from the pore surfaces results in a macroscopic volume of latent heat. This depends on the initial moisture content.
In Section 3, we will mention how to compute these effective properties if the porous paperboard structure is known. The simplest way is to compute them from its porosity and anisotropy (see [8]). The simple averaging models, derived and explained in [2], that will be used here employ the algebraic and harmonic mean when going along or across the layers. As long as the fibers are moist and the pores are dry, heat mostly goes through the contact surfaces of fibers, while the air in pores is much less conductive. However, after evaporation, the strong contrast in the coefficients disappears.
We recall several computational works corresponding to mass and heat transfer [9,10,11]. In [2], we implemented a coupled model of heat–mass transfer with a phase transition due to evaporation, using the explicit finite difference method, while here, we implement the implicit one, where the phase transition is not so sharp.
2. Collection of Micro-Parameters for Simulation
Three paperboards (see Section 5) were considered for our simulation of the one-sided heating of the paperboard with an initial small moisture content. The other side is insulated for both heat and diffusive water fluxes. The paperboard occupies a strip in and the heating condition from the right is modeled as , where is the ambient temperature or the temperature of the heater, K is the convective heat-transfer coefficient, and k is the effective thermal conductivity of the paperboard across the layer. While process description constants are given in Table 1, k depends on the thermal conductivity of the cellulose, air, and water and their volume fraction; see Equation (2). It is anisotropic and depends on the paperboard structure, recalled in Table 3; see Equation (3).

Table 1.
Boundary condition constants used for the simulation.
During evaporation, it will also change. Derivation of the effective simulation model accounting for all these issues was a main topic of study in [2]. The developed macroscopic model was employed here for an efficient numerical simulation by an implicit method.
We assume that evaporation starts at the boiling temperature. The aim of the simulation is to help us understand the interplay of heat flux, the increasing temperature of the paperboard, and evaporation starting, while the paperboard cools a little due to the release of latent heat.
In this section, we collect all the necessary micro-process and micro-structure parameters for our model to simulate the heat of a moisture-containing paperboard with evaporation. The idea is to use a macroscopic model, based on the upscaling and computing of the effective coefficients from the micro-structural characteristics of the paperboards.
All physical parameters for cellulose, water, and vapor were taken from [3] and recalled in Table 2. We characterized the paperboards by their micro-structural values, such as porosity, tortuosity, averaged fiber length and thickness, which provide us with information about the averaged contact areas between fibers. In the next section, we compute the effective coefficients for the macro-simulation using these structural parameters, which were measured for all three paperboard materials by analyzing their micro-CT images; see Figure 2. One of the main parameters in the modeling of the moisture-containing structures’ heating with evaporation is , the enthalpy of vaporization, also called the heat of vaporization or latent heat of vaporization, which is the amount of energy necessary to change water from its liquid phase to its gaseous phase at a constant pressure. It quantifies the energy needed to overcome the intermolecular forces that hold the liquid molecules together and allows them to enter the gas phase.
Table 2.
Constants used in the simulations.

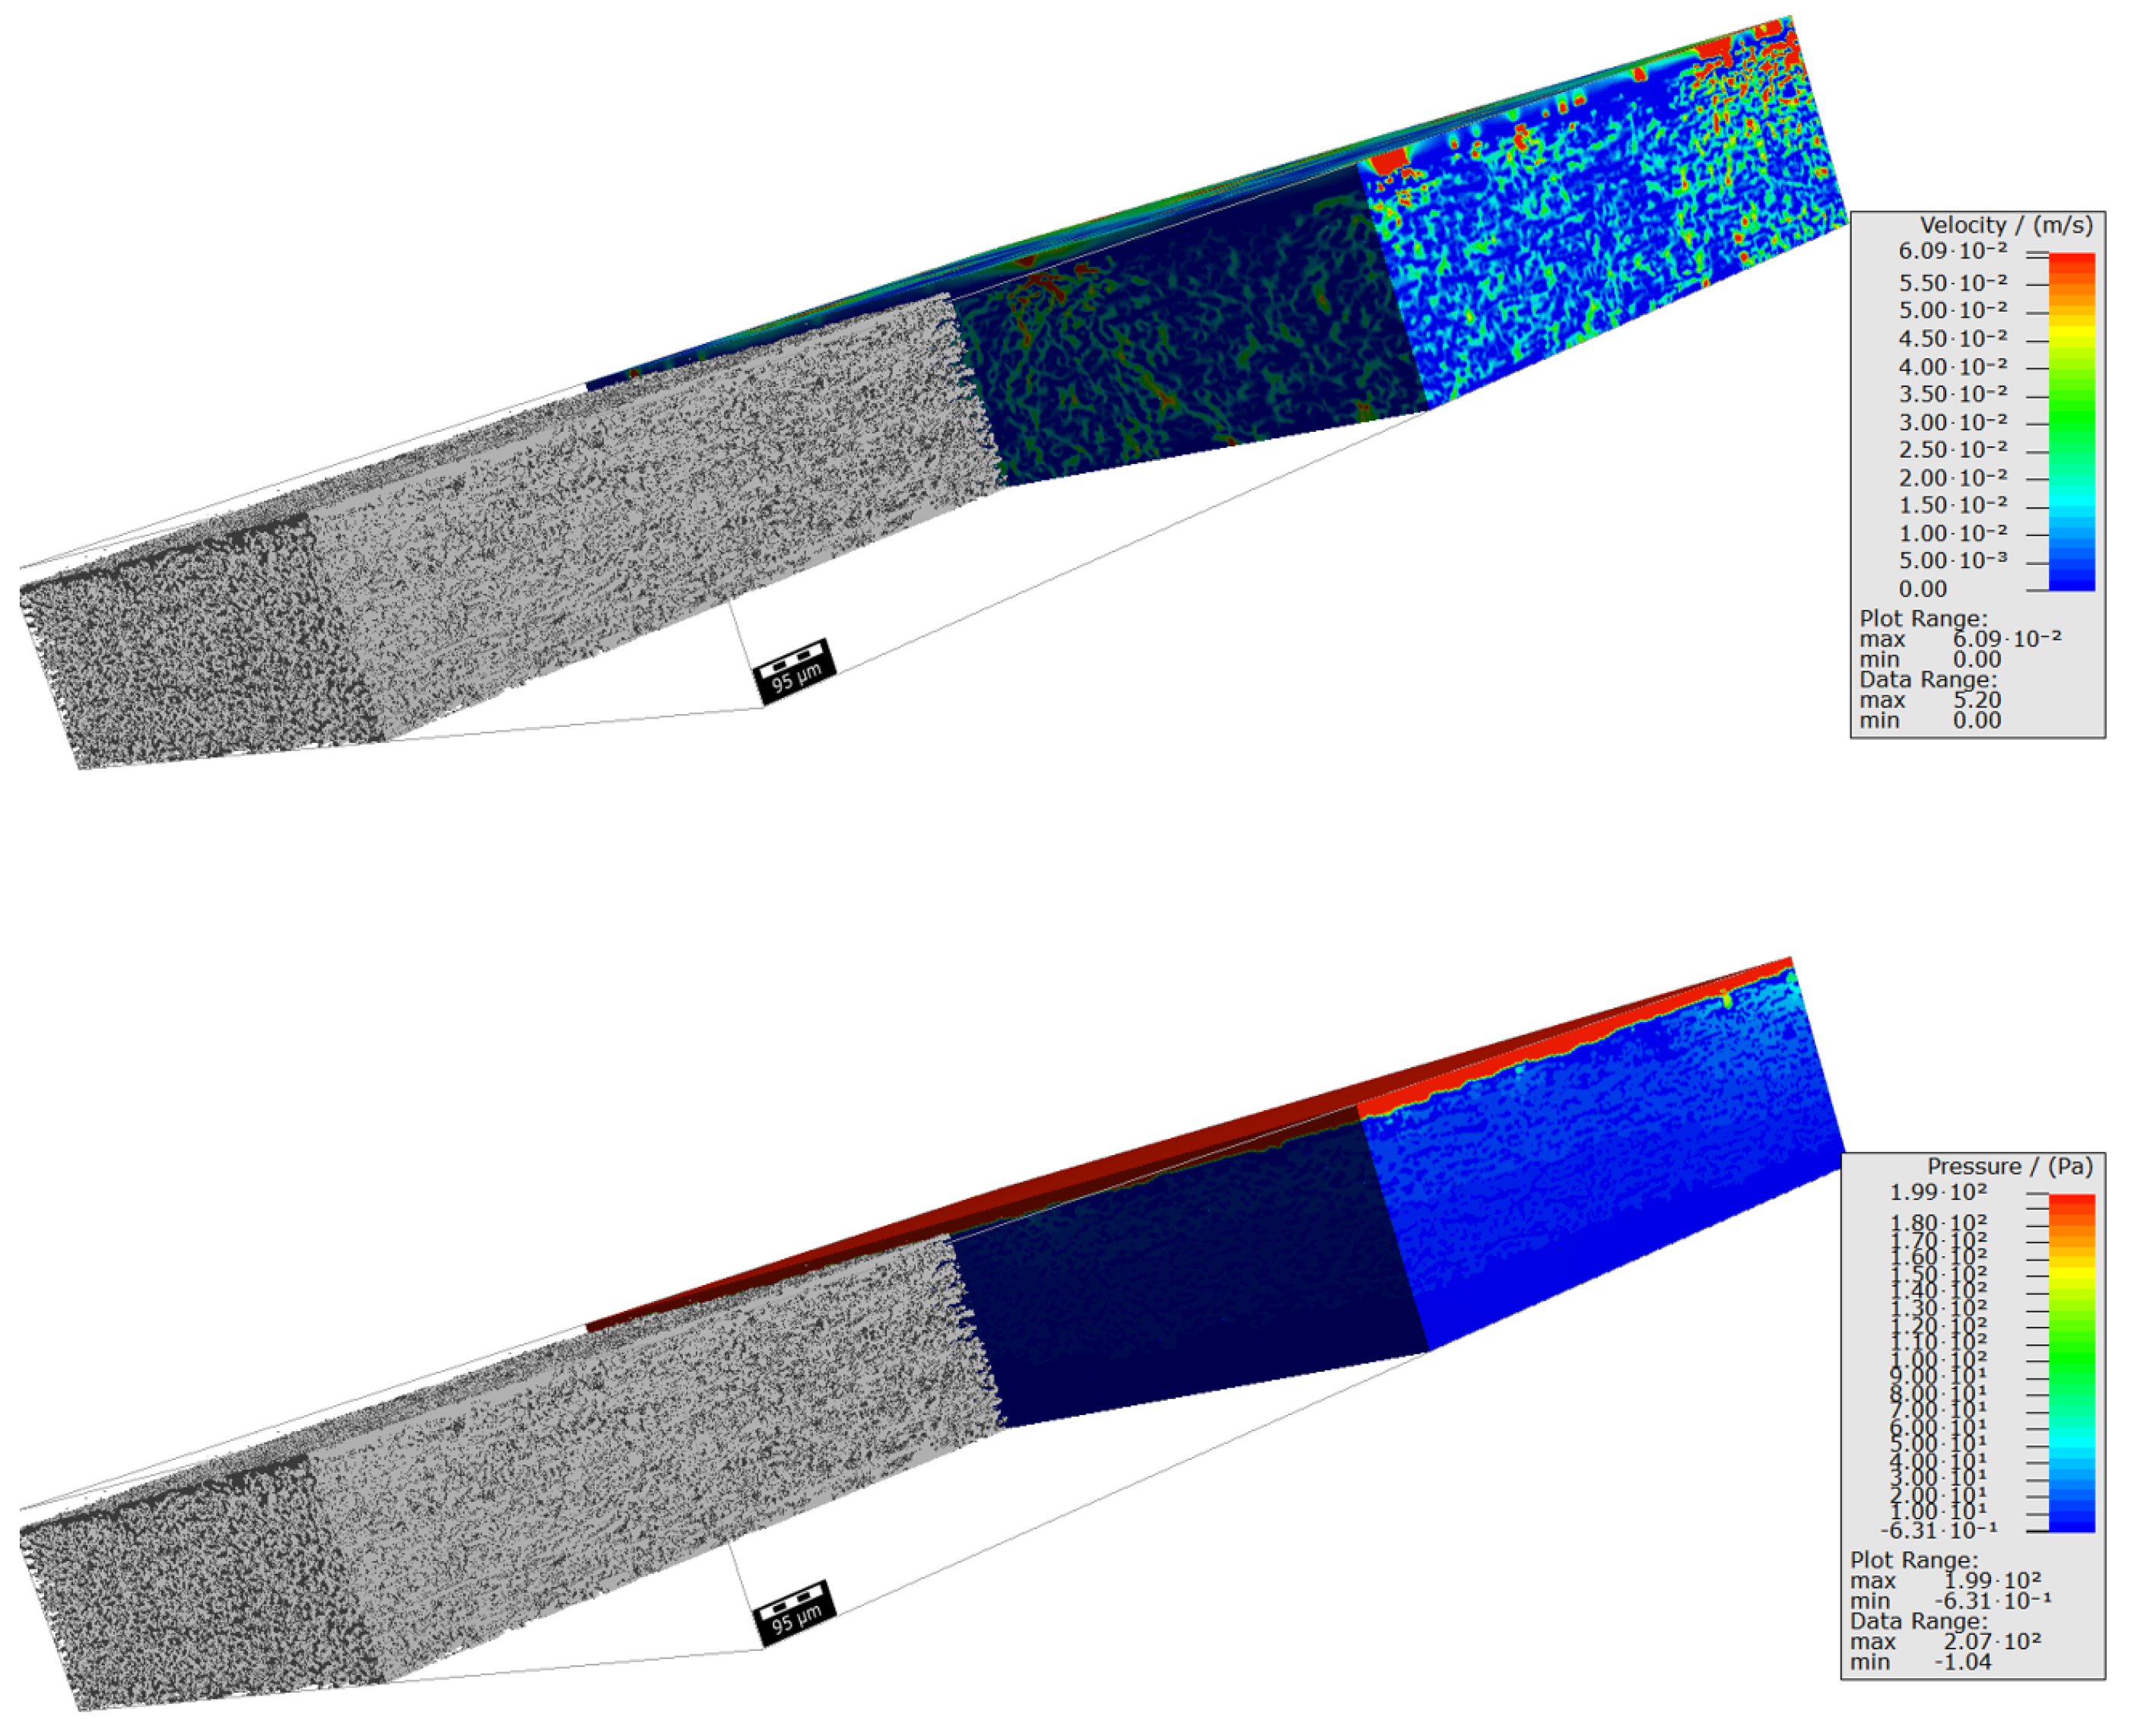
Figure 2.
Water flowing through the paperboard with a single boundary layer, as shown by micro-CT scans. The velocity is on the left and the pressure distribution is on the right.
The considered paperboard samples are distinguished with regard to their porosity , tortuosity, and average fiber thickness affecting their contact area, . Furthermore, one paperboard is homogeneous with regard to all these statistical micro-structural characteristics, while the second one has a single thin upper layer, which is almost impermeable (see Figure 2) and the last one has two such layers on both sides.
The -CT analysis of 3 chosen samples provided the statistical structural parameters for each of them, given in Table 3.
Table 3.
Structural parameters for all three considered paperboards extracted from the -CT images and used in the simulation.
All paperboards’ micro-structures can be classified by their porosity and averaged fiber cross-section.
3. Computation of the Effective Coefficients
In this section, we recall the computation of the effective properties and the homogenized problem from [2]. The heat propagation is driven by the heater, and the wet paperboard has a lower conductivity. In each porous representative volume element (RVE) of the paperboard, let the local capacity and conductivity be
The effective capacity and conductivity can be computed as the functions of by the homogenization of the real CT images of the paperboard numerically. Alternatively, one can use the Voigt–Reuss formulas as the approximation to compute the dependency of the effective parameters on the water concentration in fibers, . The capacity, c, and the heat conduction in the z direction (along the fibers) are computed as the arithmetic means of the structure with the volume fraction :
and the homogenized heat conduction, , orthogonal to the fiber direction, is calculated as the harmonic mean value. We denote the direction across the paperboard layer by x and the direction along the layer by z. Note that in the plane of fibers, the fiber distribution is also anisotropic and the fibers are situated more in the drawing direction, in which the paperboard is pulled. We clarify the in-plane anisotropy from the CT images and then interpolate in the plane between the arithmetic mean (for all fibers oriented along the heat and moisture transport directions () and all fibers across the transport directions ().
In what follows, we want to specify the effective formula for the case where the diffusive transport just goes through the fibers.
We consider the paperboard as a layered material, separated by the contact surfaces of the fibers, where the transport happens. The diffusive/conductive constants across the paperboard layer depend on the relation between a structure period (RVE) related to the pore size as well as the specific pore surface , and the contact areas between fibers. The homogenized coefficients are
We mention the z direction (along fibers) here, but our simulation is reduced to a one-dimensional direction, orthogonal to the paperboard layer. The specific pore surface and averaged contact area between fibers are obtained from the CT image analysis. The same effective diffusion constant was taken in [5], and in [2], it was derived by the asymptotic analysis of variational problems and energetic stability.
4. Effective Mathematical Model
The problem is to solve a parabolic system of two equations for the paperboard wall , which describes the diffusion of water with the mass transfer and evaporation under the latent heat, and heat conduction with unilateral heating and insulation from the left.
The macroscopic latent heat and the evaporation function enter the macroscopic equation as phase transition functions, as in [2,3].
The governing equations can be written in the following form:
where the dissipative or phase-changing term is
We add the boundary and initial conditions: We apply a heater with the temperature on the right boundary and insulate the left boundary. The initial concentration of the water in paperboards (mostly in the fibers according to our assumptions) is denoted by .
5. Numerical Method
In [2], the 1D problem of heat conduction with phase transition is analyzed and solved by the explicit finite difference method. The implicit methods are stable and do not require any stabilization. The coupled problem of heat conduction and diffusion with the phase transition is solved here by the implicit method. The considered example was computed using the values given in Table 4.
Table 4.
Mesh size parameters for the analysis of the numerical convergence.
Here, is the number of grid points across the paperboard thickness, and is the number of time steps in the simulation.
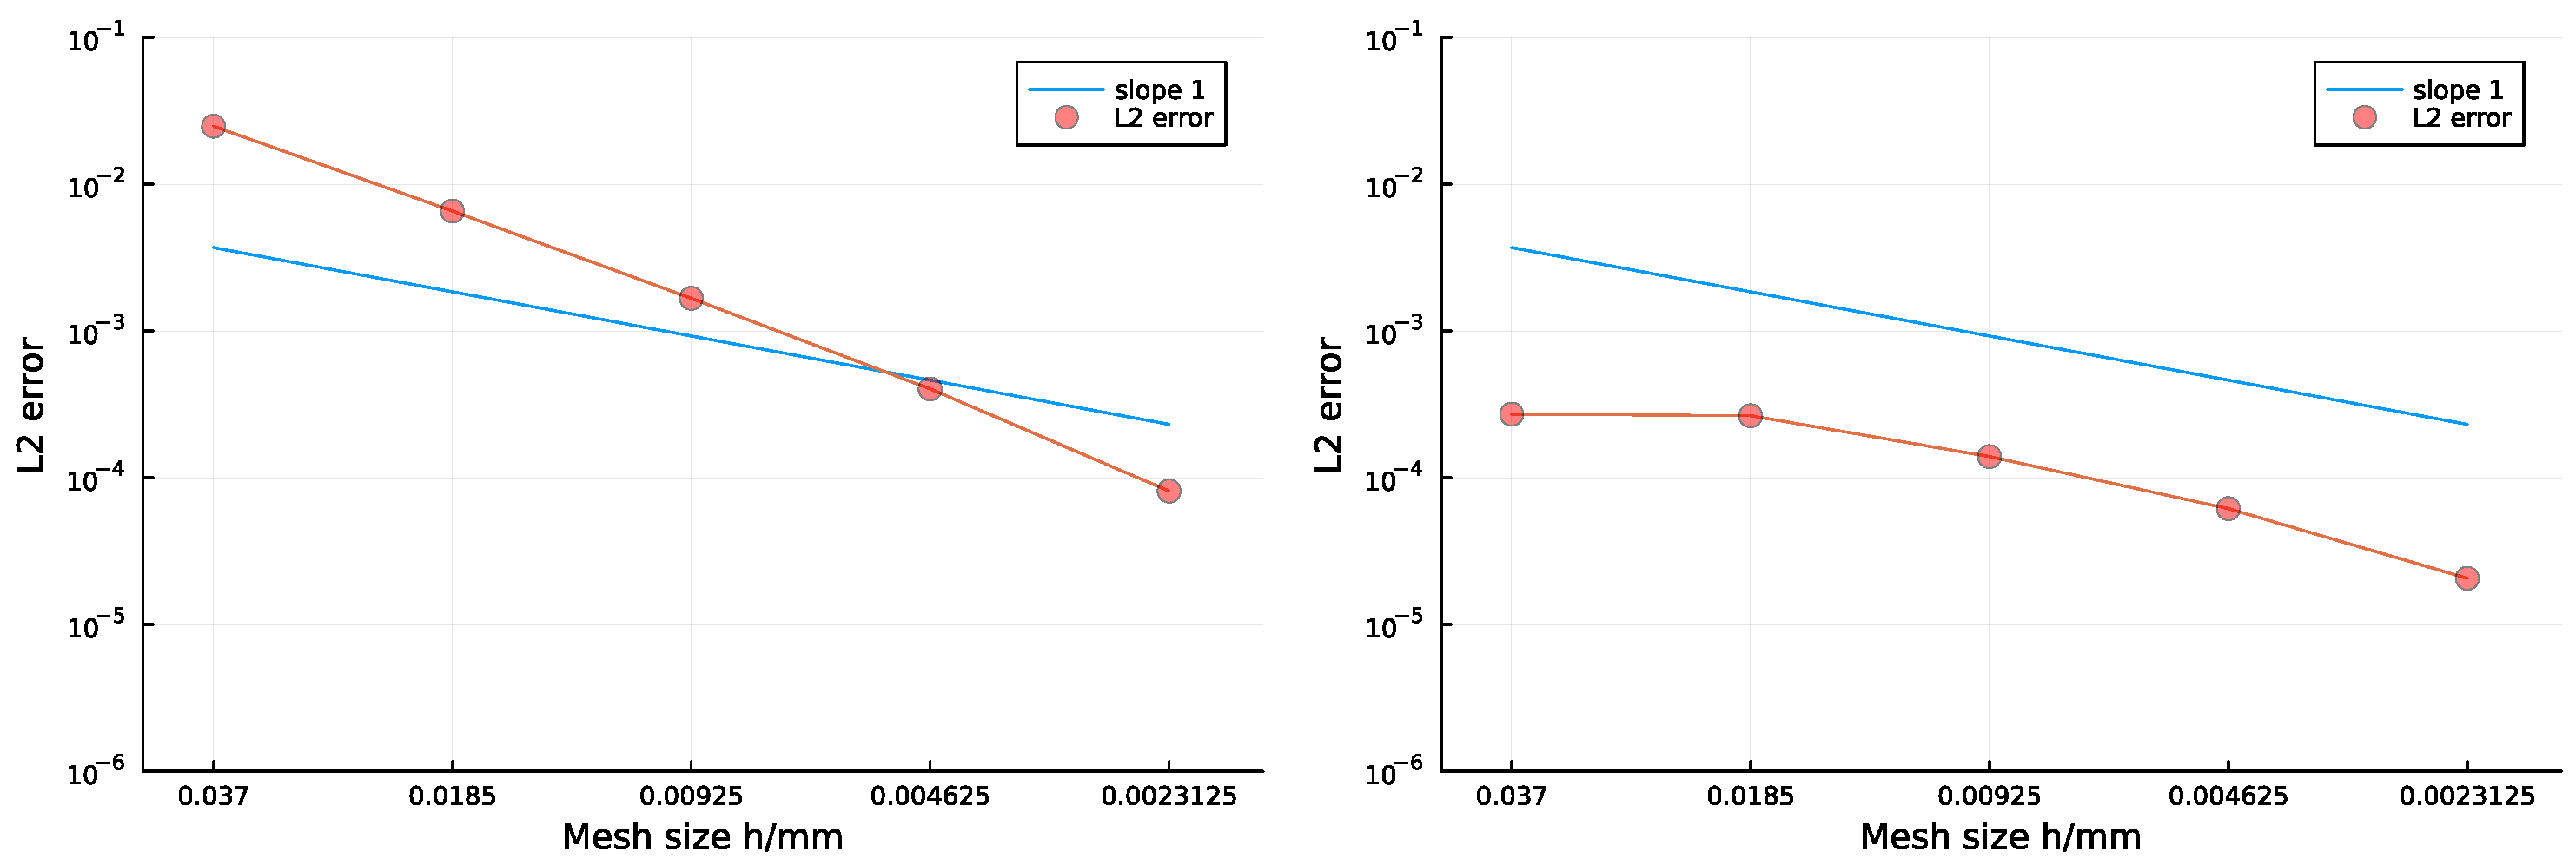
An a posteriori error estimate is given in Figure 3 for the implicit Euler approach for heat conduction (left) and the coupled diffusion–heat conduction problem with a phase transition (right).
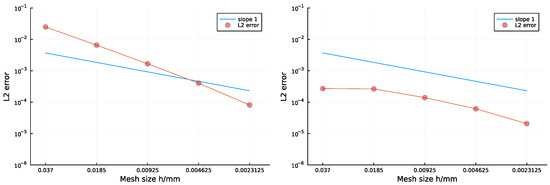
Figure 3.
Log-plot of error with , minimal s, maximal = 10,241 s. The (left) figure is just the heat conduction, while the (right) figure demonstrates the numerical error for the non-linear model, the coupled diffusion and heat conduction with evaporation.
The numerical algorithm was implemented in the programming language Julia and allowed us to combine different boundary conditions for the heat and moisture, i.e., the Dirichlet (given temperature or moisture content) with Neumann (e.g., the insulation condition for the heat or diffusion flux) and/or Robin condition (the flux from the heater to the paperboard with a jump in the temperature through the layer of the air). After starting the evaporation, the water content and the effective heat conduction coefficient also change. The program accounts for the adopted computation of the heat conduction and initial water amount for each time step.
6. Sensitivity Study with Regard to the Structural Parameters
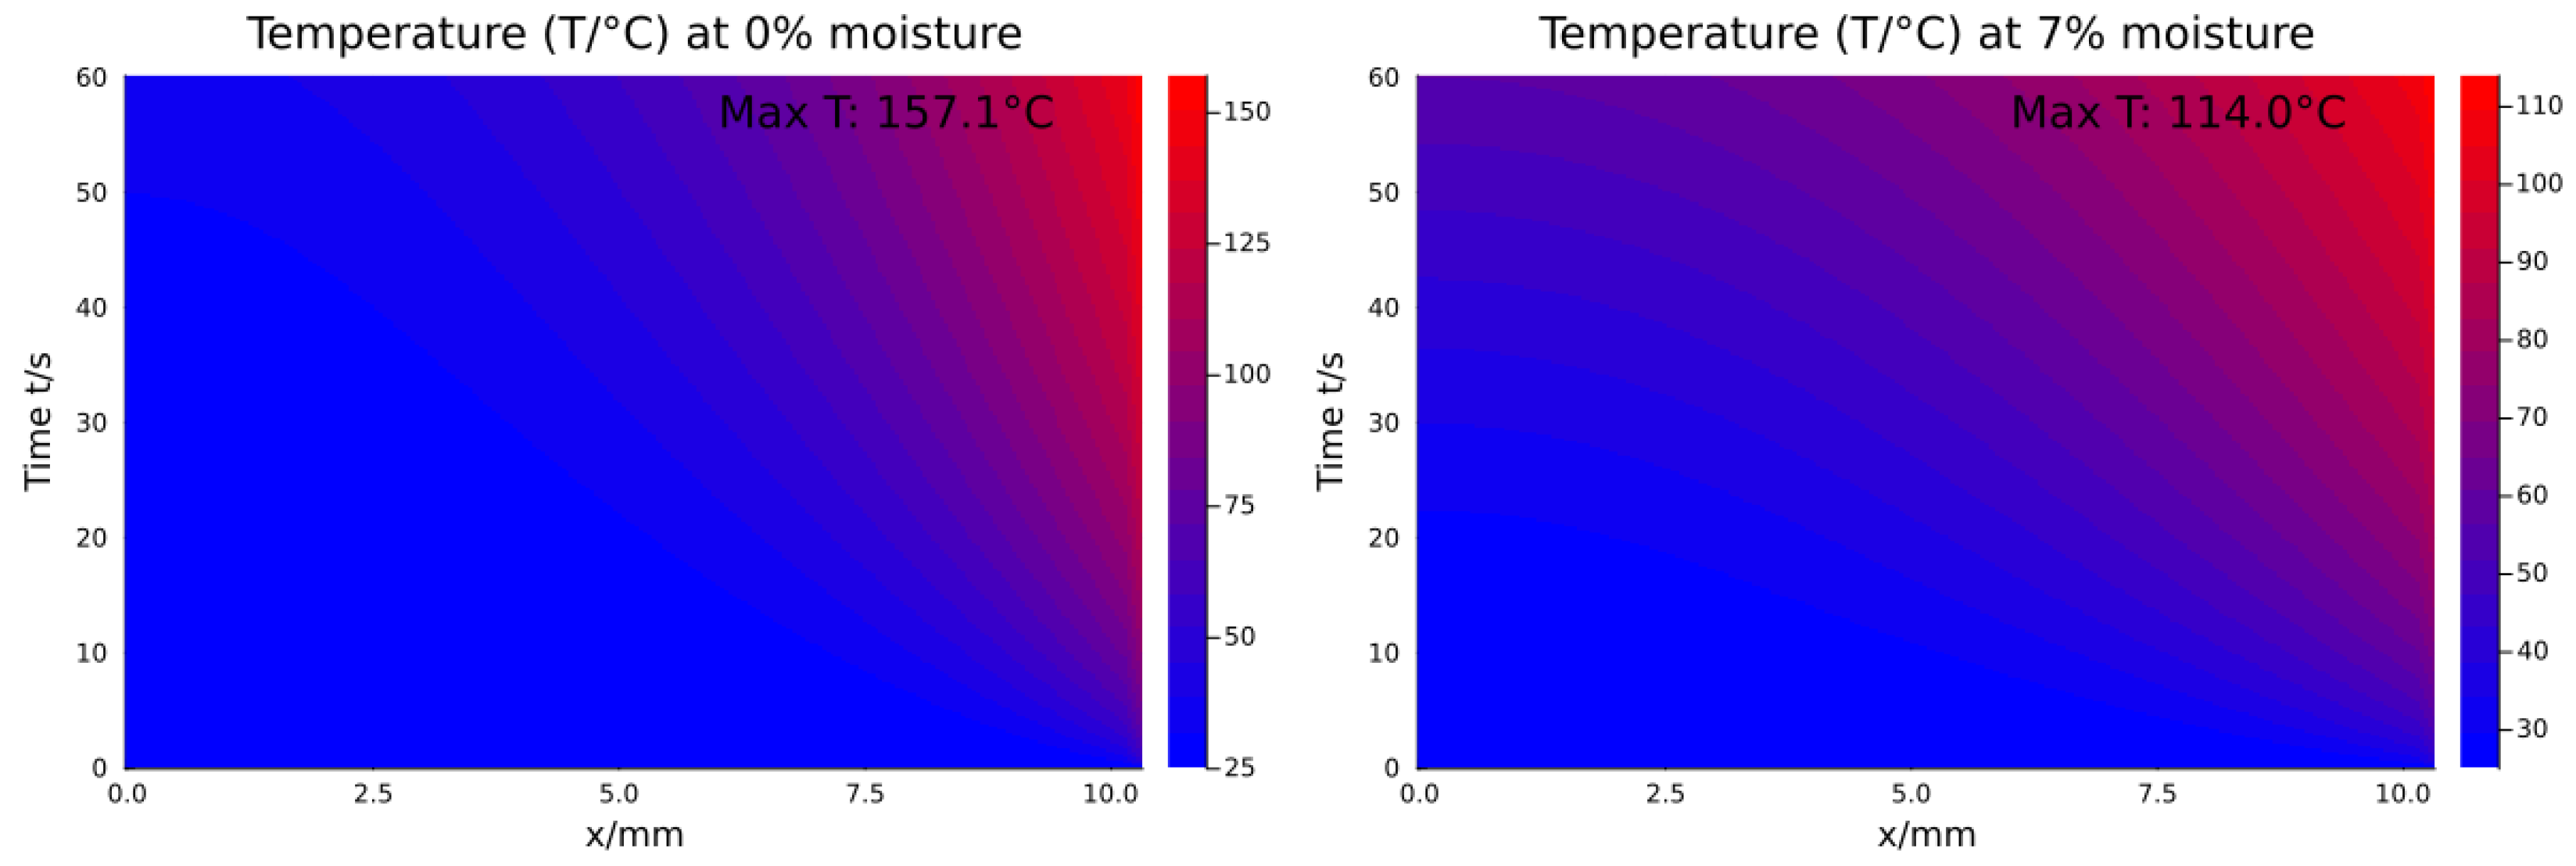
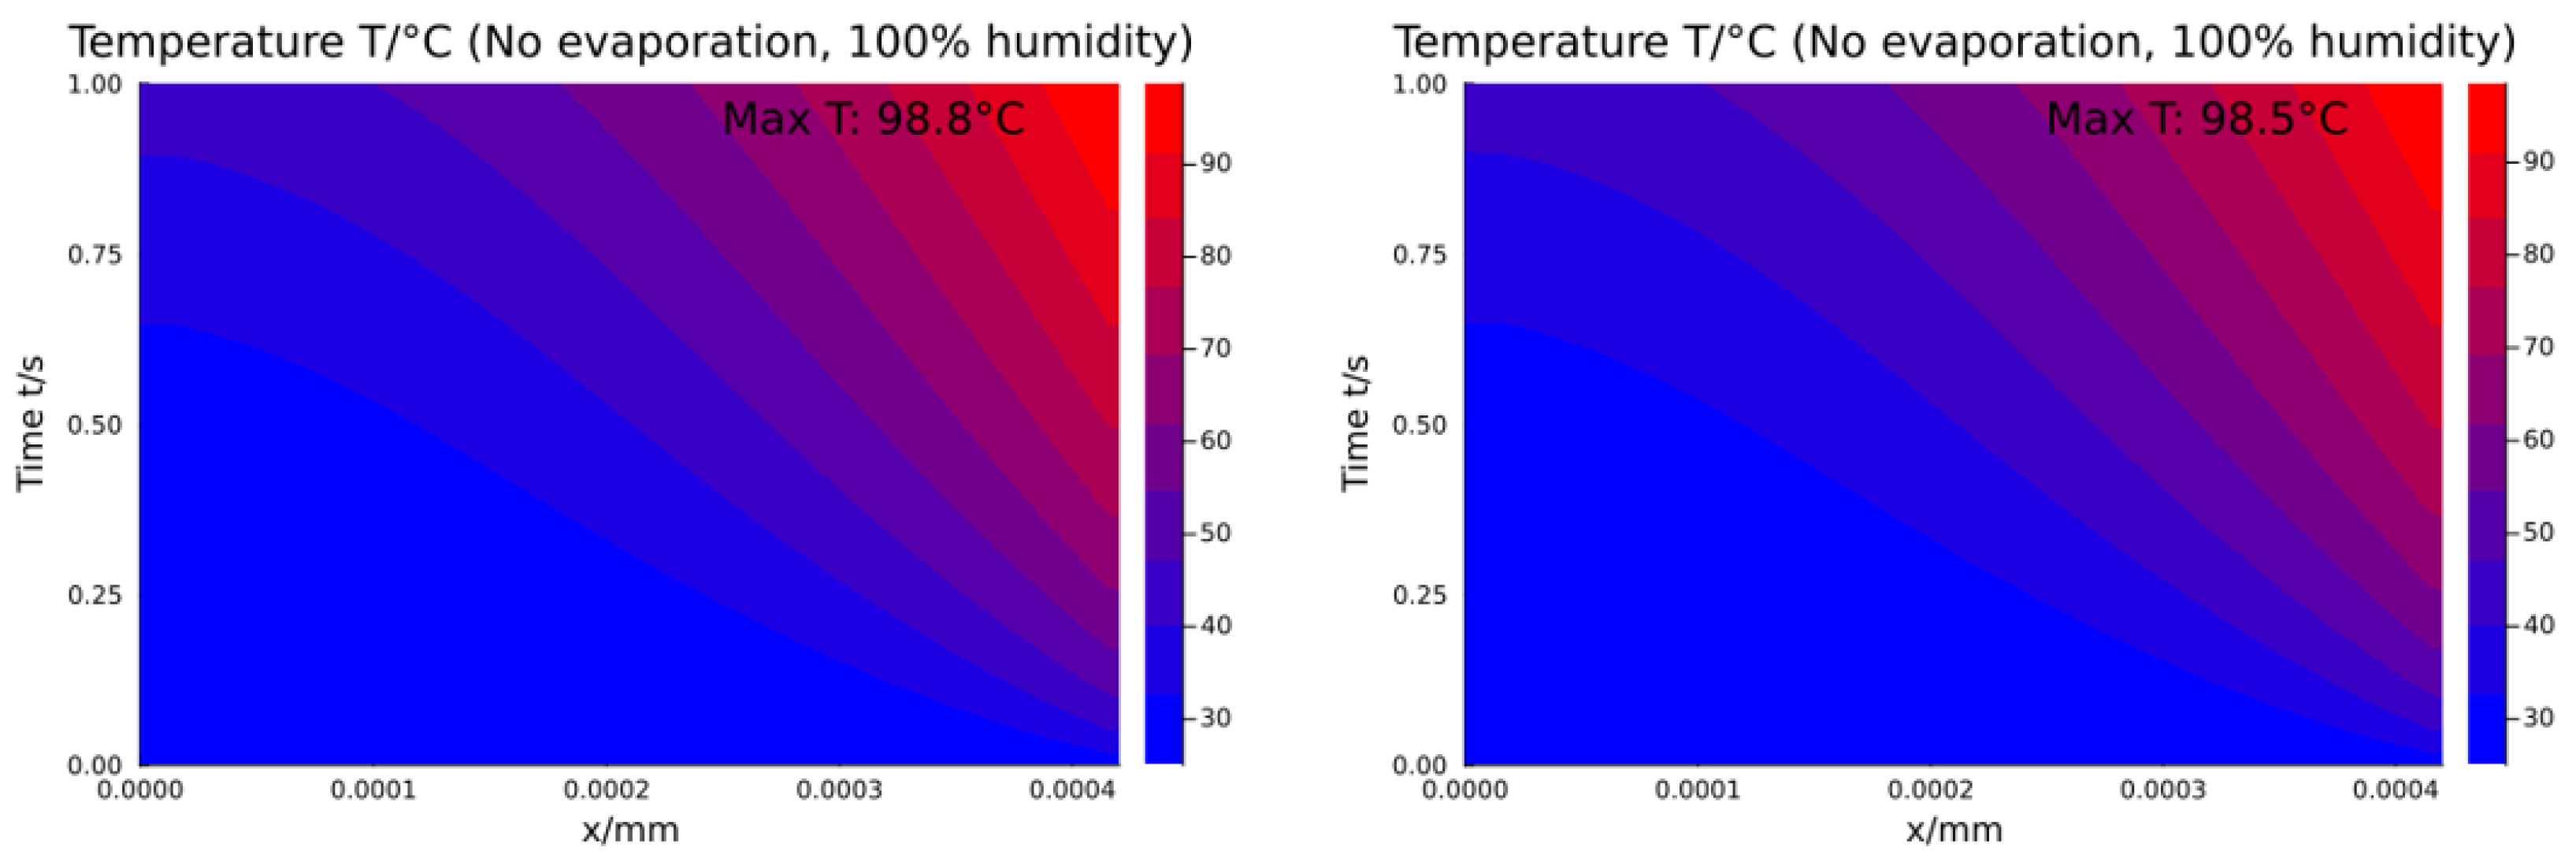
Figure 4 demonstrates the influence of the initial moisture content. The left image is without initial moisture, and in the right one, . Figure 5 and Figure 6 demonstrate the difference in temperature evolution over the wall for constantly moist (without diffusion and evaporation) and dry paperboards for all three considered paperboards. The aim here was to obtain an estimate of the difference in macroscopic heat conduction before and after the evaporation.
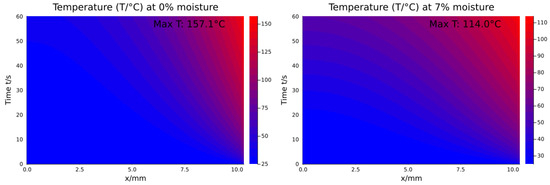
Figure 4.
Simulated evolution of the temperature through the wall for two different initial moisture contents, and . ENSOCOAT 330 has three layers with a boundary layer thickness of 0.015 mm and a porosity of 0.6557, with temperature evolution through the wall. The left temperature is higher.
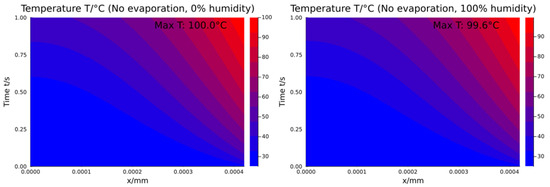
Figure 5.
Trayforma 310 has one layer with a porosity of 0.6395, with temperature evolution through the wall. The left temperature is higher.
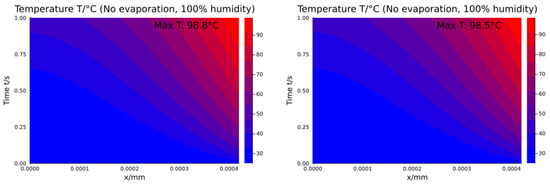
Figure 6.
Performa 250 has two layers with a boundary layer thickness of 0.01 mm and a porosity of 0.7489, with temperature evolution through the wall. The left temperature is higher.
Figure 7 demonstrates the influence of two main parameters, the porosity and the contact area between fibers, on the macroscopic moisture transport with evaporation and heat propagation. The left column of the figures shows the temperature distribution in space and time for each chosen micro-structure, while the right one demonstrates the moisture transport. Three paperboards were taken such that one micro-structural parameter was similar and another one was different. Note that the same study was performed in [2]. There, the moisture was assumed to be constant through the wall and disappeared, where the critical threshold for the evaporation temperature was reached. However, the results are quantitatively different and the phase transition is not so sharp, because of the presence of diffusion and the implicit solution algorithm.
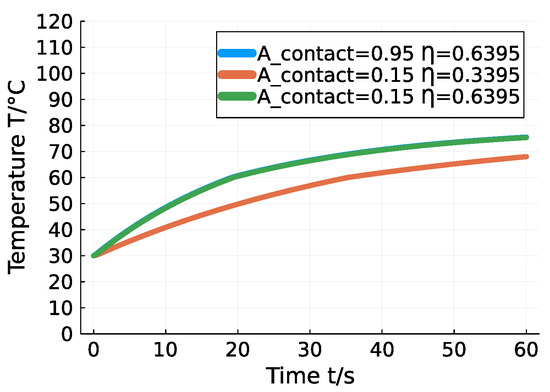
Figure 7.
Influence of the porosity and the contact area between fibers on the heat propagation.
Since the homogenized coefficients of the macroscopic problem have an explicit analytic dependency on these few micro-structural parameters, it is easy to optimize them for any desired temperature and moisture distribution profile.
Figure 7 shows that the parameter does not influence the solution at all. The explanation is that we start with homogeneously distributed moisture and then it starts to evaporate, but there is no global diffusion. In an example with a large macroscopic gradient of moisture, diffusion plays an important role.
7. Comparison Between Simulations and Measurements
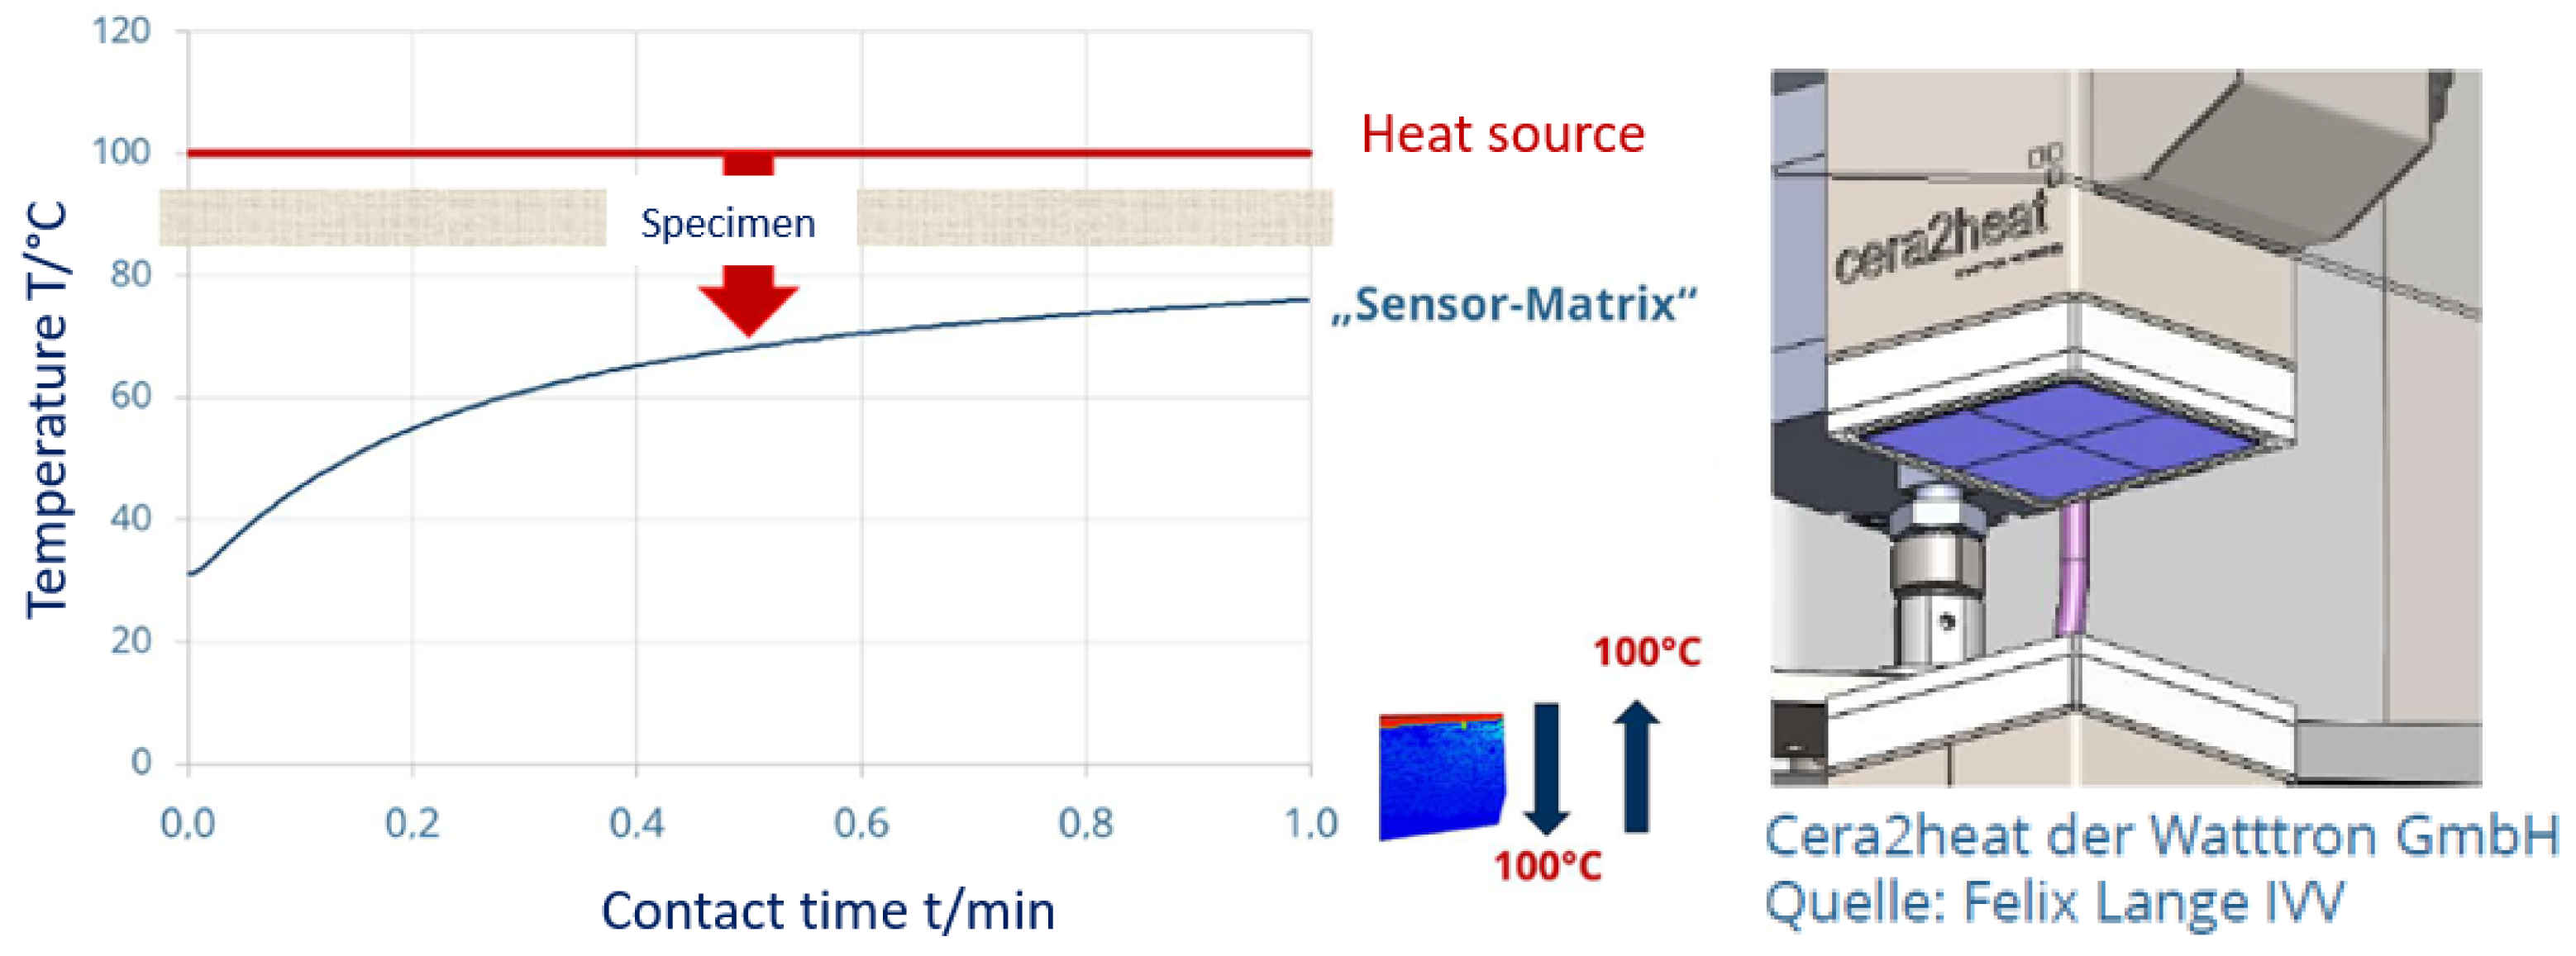
The considered experimental setting is shown in Figure 8.

Figure 8.
Experimental setting performed in Dresden.
The aim of the experiment was to measure the temperature through the wall. Three paperboards with an initial humidity in the material were heated from one side and the temperature was measured from another.
The first investigation was performed to study the influence of the initial humidity in the material on the temperature, measured on the opposite side to the heater wall.
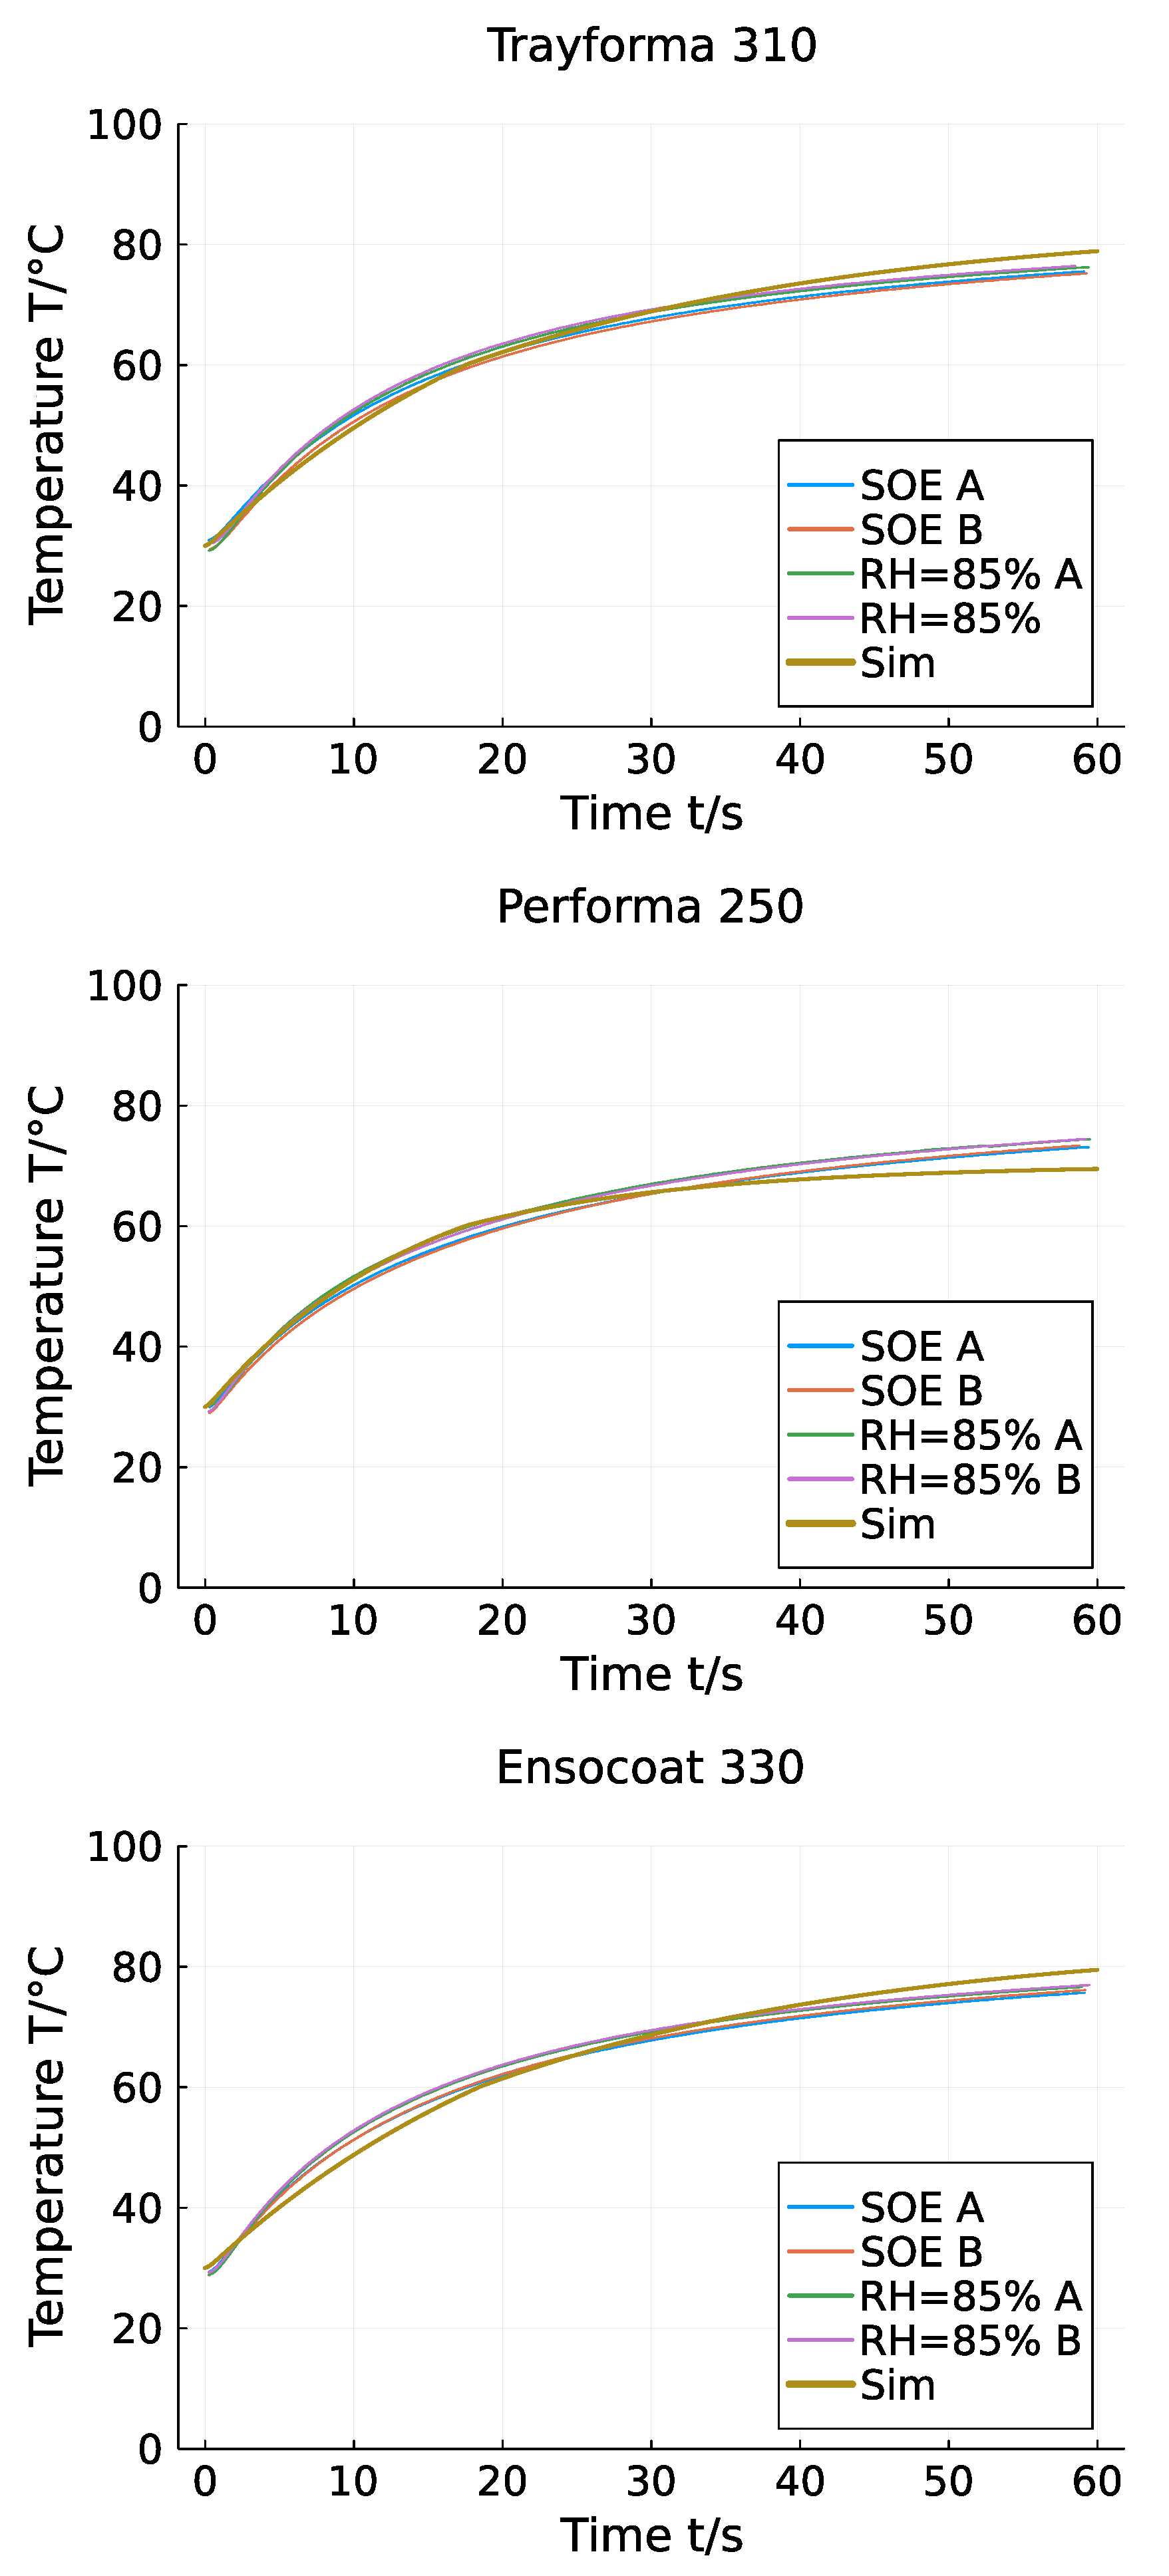
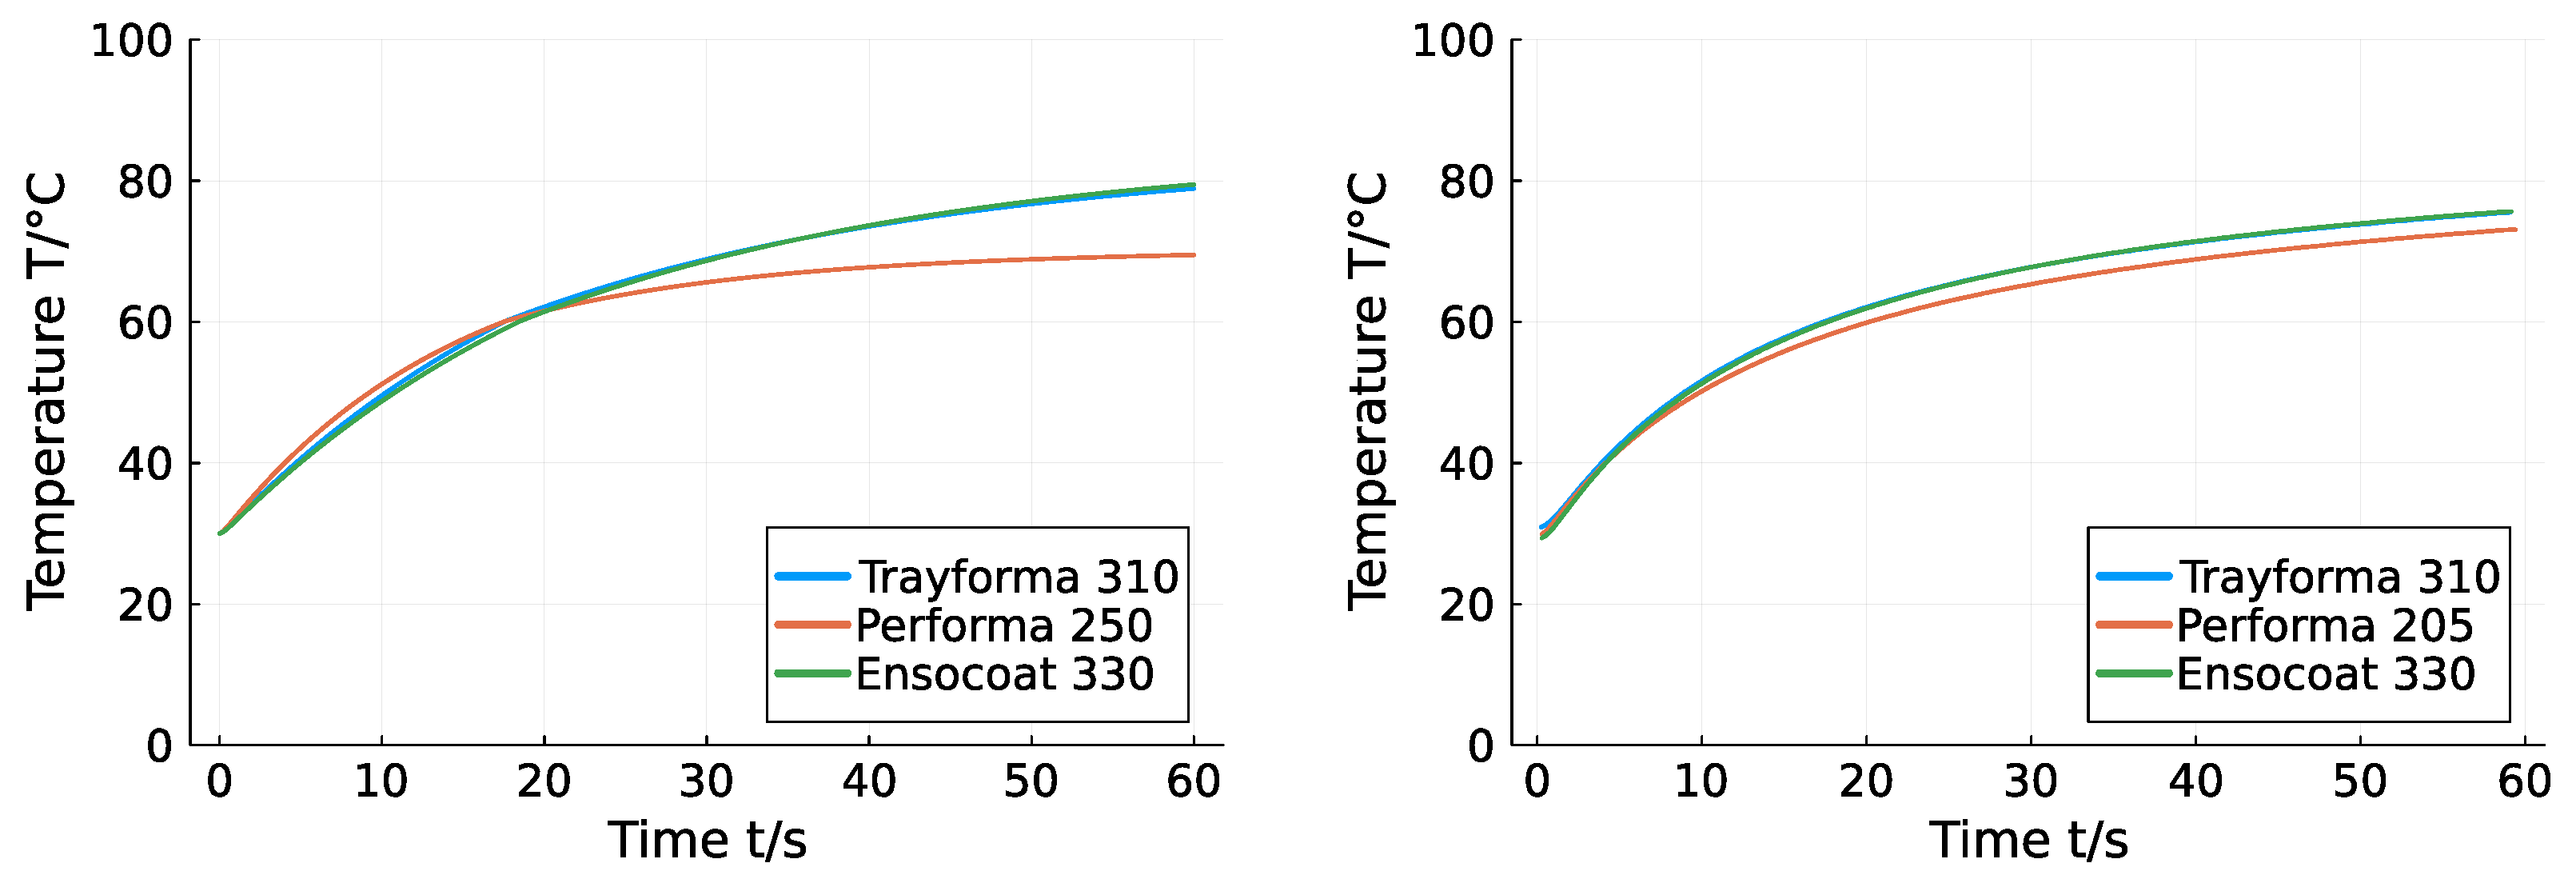
Figure 9, Figure 10 and Figure 11 demonstrate a very good agreement of the simulation results with the experimental ones for all the considered paperboards.
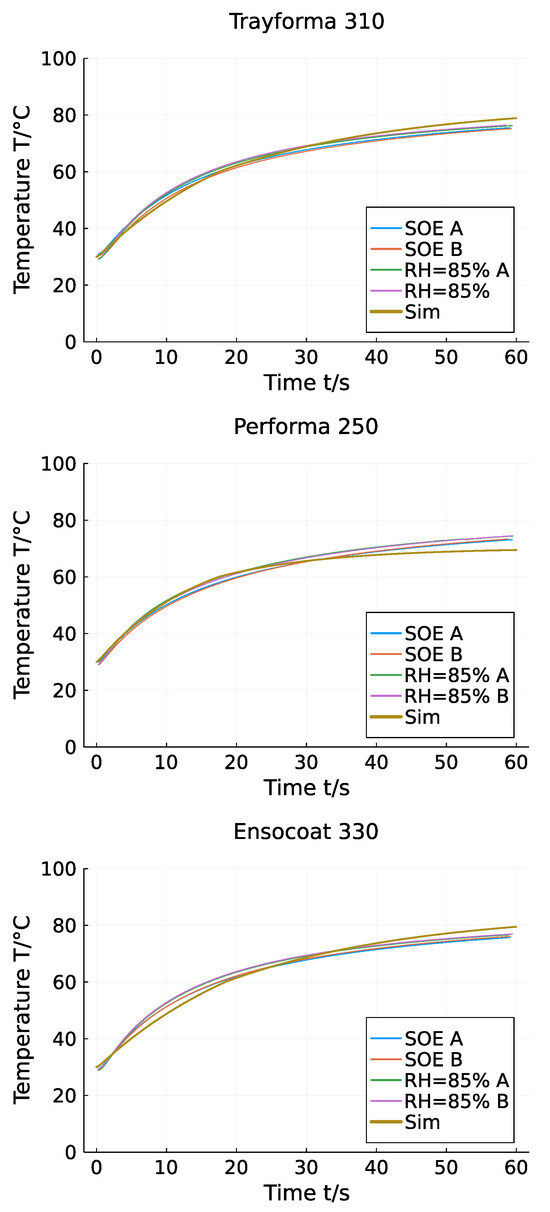
Figure 9.
Simulation vs. experiments for Trayforma 310, Performa Light 250, and Ensocoat 330 (SOE: standard operating environment; RH = 85%: relative humidity).
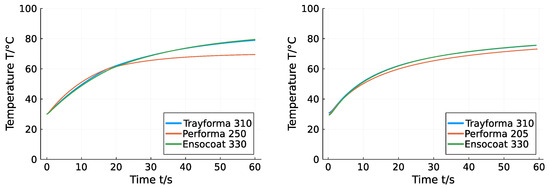
Figure 10.
Comparison of temperature in three cardboard samples: simulations (left); measurements (right).
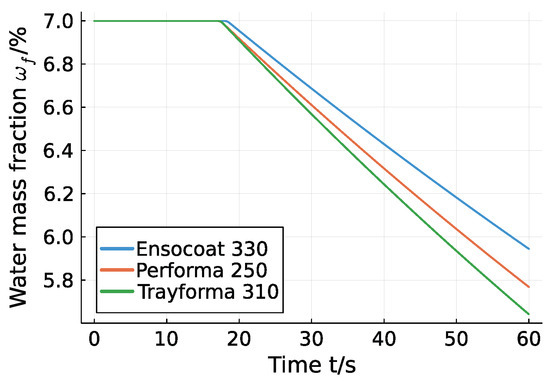
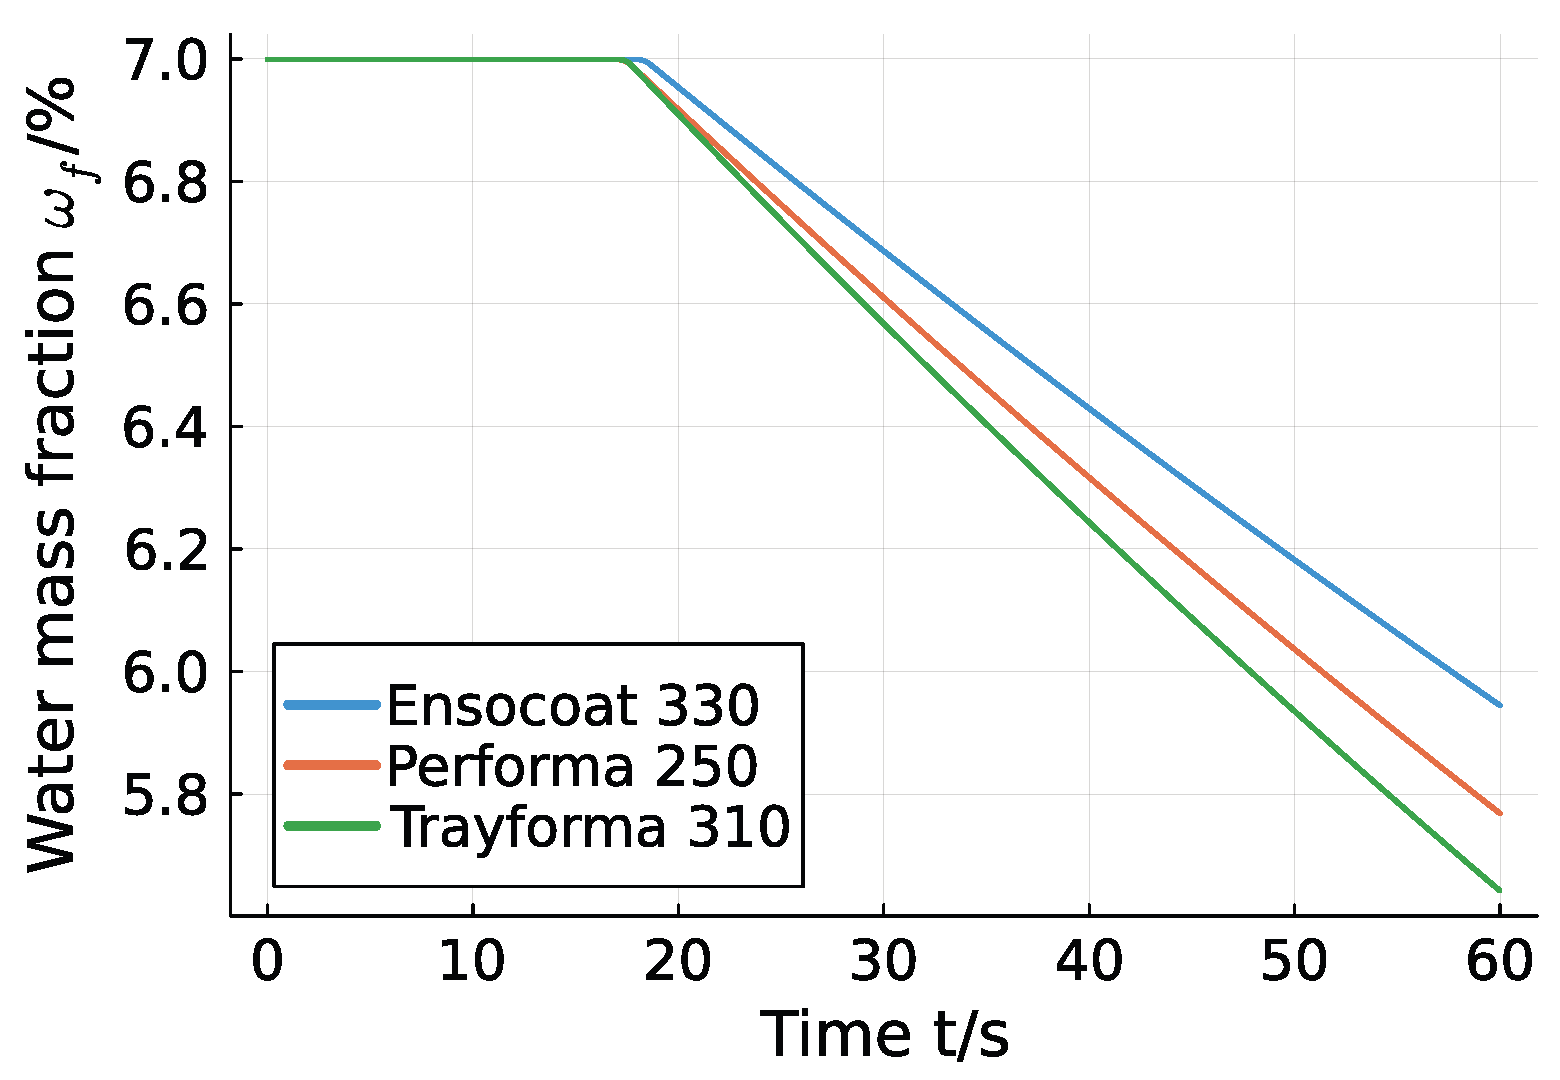
Figure 11.
Comparison of moisture evaporation in three cardboard samples.
In the measurements, the Trayforma 310 and Ensocoat 330 cardboard grades behave very similarly due to them containing the same grammage. The simulated temperatures also match for the two board grades. The Performa 250 grade exhibits lower temperatures despite its lower grammage, which may be due to a higher reflection of heat radiation from the coated surface. Further investigations are necessary for this.
8. Conclusions
In this paper, we demonstrated how well an implicit numerical algorithm for one-dimensional moisture and heat transport through the wall of a heterogeneous paperboard with a phase transition due to evaporation and latent heat release matches the measured temperature values. The experiment was performed with a heater on one side and thermal insulation on the other. The paperboard with an initial small moisture content was heated from one side and the temperature was measured from the other side. The experiment simulated the deep drawing process with paperboard, where the interplay of moisture content and its evaporation should influence the mechanical process parameters, such as the material softening due to the vapor content, temperature stress gradients due to the latent heat, and local delamination, to avoid macroscopic folds and reduce friction on metallic tools. If those mechanical dependencies were modeled and validated (see the pioneering works [1,12]), the numerical tool presented here (which is very fast) would provide an optimal heat-control tool for delamination.
Author Contributions
Methodology, J.O., M.H. and H.A.; software, V.K. and H.A.; validation, V.K.; formal analysis, J.O.; investigation, J.O. and H.S.; resources, S.R.; data curation, S.R. and H.S.; writing—original draft, J.O.; project administration, M.H.; funding acquisition, M.H. and H.A. All authors have read and agreed to the published version of the manuscript.
Funding
The research was funded by the German IGF-project Thermo-Fibre-Base in collaboration with Lehrstuhl für Verpackungsmaschinen und Verpackungstechnik, Steinbeis-Hoschschule in Berlin and RWTH in Aachen.
Data Availability Statement
The original contributions presented in this study are included in the article.
Conflicts of Interest
The authors declare no conflicts of interest.
References
- Linvill, E.; Wallmeier, M.; Östlund, S. A constitutive model for paperboard including wrinkle prediction and post-wrinkle behavior applied to deep drawing. Int. J. Solids Struct. 2017, 117, 143–158. [Google Scholar] [CrossRef]
- Orlik, J.; Khilkov, V.; Rief, S.; Andrae, H. Homogenization based heating control for moist paperboard with evaporation on the pore surface. ZAMM J. Appl. Math. Mech. 2024, 104, e202300673. [Google Scholar] [CrossRef]
- Foss, W.R.; Bronkhorst, C.A.; Bennett, K.A. Simultaneous heat and mass transport in paper sheets during moisture sorption from humid air. Int. J. Heat Mass Transf. 2003, 46, 2875–2886. [Google Scholar] [CrossRef]
- Zapata, P.A.M.; Fransen, M.; ten Thije Boonkkamp, J.; Saes, L. Coupled heat and moisture transport in paper with application to a warm print surface. Appl. Math. Model. 2013, 37, 7273–7286. [Google Scholar] [CrossRef]
- Bedane, A.H.; Ei, M.; Farmahini-Farahani, M.; Xiao, H. Theoretical modeling of water vapor transport in cellulose-based materials. Cellulose 2016, 23, 1537–1552. [Google Scholar] [CrossRef]
- Fan, J.; Wen, X. Modeling heat and moisture transfer through fibrous insulation with phase change and mobile condensates. Int. J. Heat Mass Transf. 2002, 45, 4045–4055. [Google Scholar] [CrossRef]
- Alexandersson, M.; Askfelt, H.; Ristinmaa, M. Triphasic Model of Heat and Moisture. Transp. Porous Media 2016, 112, 381–408. [Google Scholar] [CrossRef]
- Tryding, J.; Askfelt, H.; Alexandersson, M.; Ristinmaa, M. A full-range moisture sorption model for cellulose-based materials yielding consistent net isosteric heat of sorption. Dry. Technol. 2023, 41, 61–76. [Google Scholar] [CrossRef]
- Simon, J.-W. A Review of Recent Trends and Challenges in Computational Modeling of Paper and Paperboard at Different Scales. Arch. Comput. Methods Eng. 2021, 28, 2409–2428. [Google Scholar] [CrossRef]
- Linvill, E.; Östlund, S. The Combined Effects of Moisture and Temperature on the Mechanical Response of Paper. Exp. Mech. 2014, 54, 1329–1341. [Google Scholar] [CrossRef]
- Autengruber, M.; Lukacevic, M.; Füssl, J. Finite-element-based moisture transport model for wood including free water above the fiber saturation point. Int. J. Heat Mass Transf. 2020, 161, 120228. [Google Scholar] [CrossRef]
- Dondl, P.; Conti, S.; Orlik, J. Variational modeling of paperboard delamination under bending. Math. Eng. 2023, 5, 1–28. [Google Scholar] [CrossRef]


Disclaimer/Publisher’s Note: The statements, opinions and data contained in all publications are solely those of the individual author(s) and contributor(s) and not of MDPI and/or the editor(s). MDPI and/or the editor(s) disclaim responsibility for any injury to people or property resulting from any ideas, methods, instructions or products referred to in the content. |
© 2025 by the authors. Licensee MDPI, Basel, Switzerland. This article is an open access article distributed under the terms and conditions of the Creative Commons Attribution (CC BY) license (https://creativecommons.org/licenses/by/4.0/).