Abstract
Nerve agents, a highly toxic class of chemical warfare agents, pose serious risks to human health and social stability. Metal oxides are commonly used as catalysts to break down these agents through thermocatalytic decomposition. In particular, bimetallic oxide catalysts offer enhanced stability and catalytic efficiency due to their synergistic effects. In this study, CuO/ZrO2 composite catalysts with varying Cu/Zr ratios were synthesized using a secondary hydrothermal method, resulting in a hollow microsphere morphology. The catalytic efficiency of these composites in thermocatalytically decomposing dimethyl methylphosphonate (DMMP), a sarin simulant, was systematically evaluated. The findings revealed that the catalyst with a 10%Cu/Zr ratio exhibited the best performance, achieving the longest protection duration of 272 min. The hollow microsphere structure facilitated high dispersion of CuO on the ZrO2 surface, promoting strong interactions and generation of oxygen vacancies, which enhanced the catalytic activity. Furthermore, the catalytic reaction mechanism was explored by analyzing the surface characteristics of the catalyst and the resulting reaction products. This research addresses a gap in the application of CuO/ZrO2 catalysts for DMMP decomposition and provides valuable insights for the future development of catalysts for chemical warfare agent degradation.
1. Introduction
Nerve agents are highly toxic anticholinesterase compounds that disrupt the central and peripheral nervous systems by inhibiting acetylcholinesterase (AChE) through phosphorylation. This inhibition leads to the accumulation of acetylcholine at neural synapses, resulting in severe neurotoxic effects. Even at low doses, exposure can cause acute intoxication or fatality, making these agents a significant threat to human health and security [1,2]. Certain organophosphorus compounds, such as sarin, are highly toxic neurotoxic agents with significant lethality [3,4,5,6]. At present, chromium-free impregnated carbon adsorption technology is the primary technique for removing vapors of toxic chemical species like sarin. Nonetheless, challenges remain, including the complexity of the impregnation process, limited adsorption capacity, and an insufficiently understood protection mechanism [7,8,9].
Thermocatalytic decomposition involves breaking down toxic compounds into smaller, less harmful molecules through catalytic processes such as oxidation and hydrolysis. Studies have demonstrated that this method is an effective approach for degrading chemical warfare agents [10,11,12,13]. In lab-scale studies, dimethyl methylphosphonate (DMMP) is commonly employed as a simulant for sarin. Metal oxide catalysts have demonstrated strong catalytic efficiency in facilitating its decomposition [14,15,16,17]. Cao et al. [18] reported that a 10% Cu/Al2O3 catalyst protected against DMMP decomposition for up to 7.5 h at 400 °C, significantly outperforming 10% Ni/Al2O3, which lasted only 1.5 h. The morphology of metal oxide catalysts also plays a crucial role in catalytic performance. For instance, Kong et al. [19] synthesized CeO2 catalysts with the nanoparticle, nanorod, and nanocubic morphologies using a hydrothermal method and found that catalyst morphology directly influenced efficiency. Among them, 12M CeO2 nanorods exhibited the longest protection time against the thermocatalytic decomposition of DMMP. In addition, bicomponent metal oxide catalysts enhance catalytic activity by lowering activation energy through intermetallic synergistic effects. Thus, bimetallic catalysts have emerged as a key focus in the development of advanced materials for the degradation of toxic compounds [12,20]. Gao et al. [12] synthesized CuO-CeO2/γ-Al2O3 catalysts with varying compositions using the equal-volume impregnation method and evaluated their efficiency for thermocatalytic decomposition of DMMP. Their findings indicated that the catalyst with a 5% CeO2 loading gave the highest catalytic performance. This enhancement was accredited to the strength of the interaction between Cu and Ce, which facilitated the formation of surface-adsorbed oxygen, thus improving the catalyst’s decomposition efficiency. Furthermore, studies on the decomposition mechanism of DMMP by transition metal oxide catalysts suggest that DMMP molecules interact with metal oxides via P=O groups or hydrogen bonding. At elevated temperatures, the cleavage and delocalization of methoxyl and methyl groups attached to phosphorus enable the catalytic breakdown of DMMP [14,15].
ZrO2, a transition metal oxide with acidic, basic, and redox properties, serves as an efficient catalyst support. Its good thermal stability and tunable microscopic morphology enable the uniform dispersion of active constituents while providing a large specific surface area (SSA), thus enhancing catalytic performance [21,22,23,24]. In recent years, researchers have extensively studied the catalytic performance of CuO/ZrO2 catalysts, aiming to improve their overall effectiveness [25,26,27,28,29]. Basahel et al. [30] synthesized mesoporous CuO-ZrO2 catalysts through a modified sol–gel method, utilizing tetrabutylammonium bromide as a templating agent. When tested under identical reaction conditions, the 10-CuZr catalyst exhibited higher catalytic activity compared to the 20-CuZr catalyst in the benzylation of benzene. This enhancement was primarily due to the 10-CuZr catalyst’s higher concentration of easily reducible Cu2+-O-Zr4+ bonds and a greater number of active sites, attributed to its larger SSA and pore volume (PV). Suh et al. [31] proposed that the inclusion of ZrO2 promoted the formation of Cu+ ions, which modified the Cu+/Cu0 ratio on the catalyst surface. This change enhanced the catalytic activity for methanol synthesis through CO hydrogenation at low temperatures and pressure. Śliwa et al. [32] reported that ethanol adsorbed on CuO undergoes oxidation to form acetaldehyde and water, with acetaldehyde further oxidizing on Cu/Zr catalysts to generate hydrogen. As the reaction temperature rises, acetaldehyde is converted into acetic acid, which transforms into acetone at temperatures above 583 K. With a further increase in temperature, organic molecules undergo complete oxidation to CO and CO2. While CuO/ZrO2 composite catalysts have been explored for thermocatalytic decomposition, their application in the decomposition of DMMP remains unaddressed. Therefore, investigating CuO/ZrO2 catalysts for DMMP thermocatalytic decomposition is of significant importance.
In this study, CuO/ZrO2 composite catalysts with varying loading ratios were synthesized via a secondary hydrothermal method, with ZrO2 featuring a hollow microsphere morphology as the active component. For comparative analysis, CuO catalysts were synthesized via a hydrothermal method. The structural, compositional, and surface chemical characteristics of the catalysts were comprehensively examined using various characterization methods. Furthermore, the protective performance of CuO/ZrO2 catalysts with different loading ratios against DMMP degradation was evaluated. ZrO2, CuO, and CuO/ZrO2 composite catalysts with the best performance in thermocatalytic decomposition of DMMP were selected for the analysis of decomposition products, investigation of reaction mechanisms, and inference of decomposition processes. This research offers valuable insights for the development of high-performance catalysts for the thermocatalytic decomposition of DMMP, with significant potential applications in the removal of chemical warfare agents.
2. Materials and Methods
2.1. Materials
Zirconium oxychloride octahydrate (ZrOCl2·8H2O, 99.9% purity), urea (C2H4N2O, 99.9% purity), copper nitrate trihydrate (Cu(NO3)2·3H2O, 99.99% purity), and sodium hydroxide (NaOH, >98% purity) were obtained Macklin, Shanghai, China. Absolute ethanol (C2H5OH, 99.7% purity) was sourced from InnoChem, Beijing, China, while hydrochloric acid (HCl, 36.5% purity) was procured from TGREAG, Beijing, China. Analytical-grade reagents were purchased and used without any further purification.
2.2. Preparation of ZrO2 Hollow Microsphere Catalysts
To prepare ZrO2 hollow microsphere catalysts, 1.5 g of zirconium oxychloride octahydrate (ZrOCl2·8H2O) was dissolved in 60 mL of anhydrous ethanol under continuous stirring. Subsequently, 0.9 g of urea (CO(NH2)2) was introduced, and the mixture was stirred thoroughly. Concentrated hydrochloric acid (HCl) (36.5%, 15 mL) was then added dropwise till the solution turned transparent. The obtained solution was shifted to a 100 mL reactor and subjected to hydrothermal treatment in a drying chamber for 24 h at 160 °C. The product of the reaction was subjected to washing and centrifugation repeatedly until the supernatant no longer formed a white precipitate upon the addition of silver nitrate (AgNO3) solution. The obtained material was dried for 6 h at 60 °C, followed by calcination in an air atmosphere at 450 °C at a heating rate of 10 °C/min. The system was maintained as such for 4 h to yield ZrO2 hollow microspheres.
2.3. Preparation of Cu/Zr Catalysts with Different Loading Ratios (10%, 30%, 50%, 70%, and 90%)
Copper nitrate trihydrate (Cu(NO3)2·3H2O) in varying amounts (0.103 g, 0.397 g, 0.927 g, 6.568 g, and 25.332 g) was solubilized in 10 mL of deionized (DI) water and stirred thoroughly for 20 min. ZrO2 hollow microspheres (1 g) were introduced into the solution and homogenized for an additional 30 min. A 2 mol/L NaOH solution was prepared to a total volume of 50 mL and added dropwise to the mixture under continuous stirring over a 30 min duration. The suspension was transferred to a 100 mL reactor and hydrothermally treated at 160 °C for 24 h. After natural cooling to room temperature, the precipitate was washed and centrifuged three times, dried in an oven at 70 °C for 6 h, and further calcined within a muffle furnace for 4 h at 400 °C. The final products, designated as 10%Cu/Zr, 30%Cu/Zr, 50%Cu/Zr, 70%Cu/Zr, and 90%Cu/Zr, were successfully obtained.
2.4. Preparation of CuO Catalysts
Cu(NO3)2·3H2O (8.7 g) was dissolved in 10 mL of DI water and stirred thoroughly for 20 min. A 2 mol/L NaOH solution (50 mL) was then added dropwise to the mixture under continuous stirring for 30 min. The resulting suspension was processed following the same hydrothermal, washing, drying, and calcination steps as described above, yielding the final CuO catalyst.
2.5. Characterization
The crystalline structure of the synthesized materials was analyzed using X-ray diffraction (XRD) (Rigaku SmartLab SE, Saitama, Japan) over a scanning range of 5–90° and a scanning speed of 2°/min. The SSA, pore size, and PV of the specimens were determined using a fully automated specific surface and porosity analyzer (BET) (Quantachrome Autosorb IQ, Boynton Beach, FL, USA) under liquid nitrogen at a constant temperature. The microscopic morphological details and particle size of the specimens were observed using transmission electron microscopy (TEM) (JEOL JEM F200, Tokyo, Japan) and scanning electron microscopy (SEM) (TESCAN MIRA LM, Brno, Czech Republic). The elemental composition and active component loading were assessed using energy-dispersive spectroscopy (EDS). Hydrogen temperature-programmed reduction (H2-TPR) analyses were performed using a programmed-temperature chemisorption apparatus (Micromeritics AutoChem II 2920, Norcross, GA, USA). For the H2-TPR analysis, the samples were heated to 300 °C for 2 h under a helium (He) flow (50 mL/min), cooled to 50 °C, and then exposed to a 10% H2/Ar mixture (50 mL/min) for 30 min. The specimens were subsequently desorbed at 900 °C at a heating rate of 10 °C/min, maintaining a continuous 10% H2/Ar gas flow. The elemental content of the catalysts was determined using an inductively coupled plasma optical emission spectrometer (ICP-OES) (Agilent 725ES, Santa Clara, CA, USA). X-ray photoelectron spectroscopy (XPS) (Thermo Scientific K-Alpha, Waltham, MA, USA) was employed to analyze the elemental valence states of the catalysts. The binding energies were calibrated using the C 1s peak at 284.8 eV, and data fitting was performed using Avantage software. In situ diffuse reflectance infrared Fourier transform spectroscopy (DRIFTS) was recorded using a Bruker Spectrum Instruments Fourier infrared spectrometer (INVENIO S, Waltham, MA, USA) equipped with an OPERANDO-TETRA in situ diffuse reflectance system. The test resolution was 8 cm−1, a total of 64 scans were recorded, and the scanning range was set from 800 to 4000 cm−1.
2.6. Evaluation Method of DMMP Thermal Catalytic Decomposition Performance
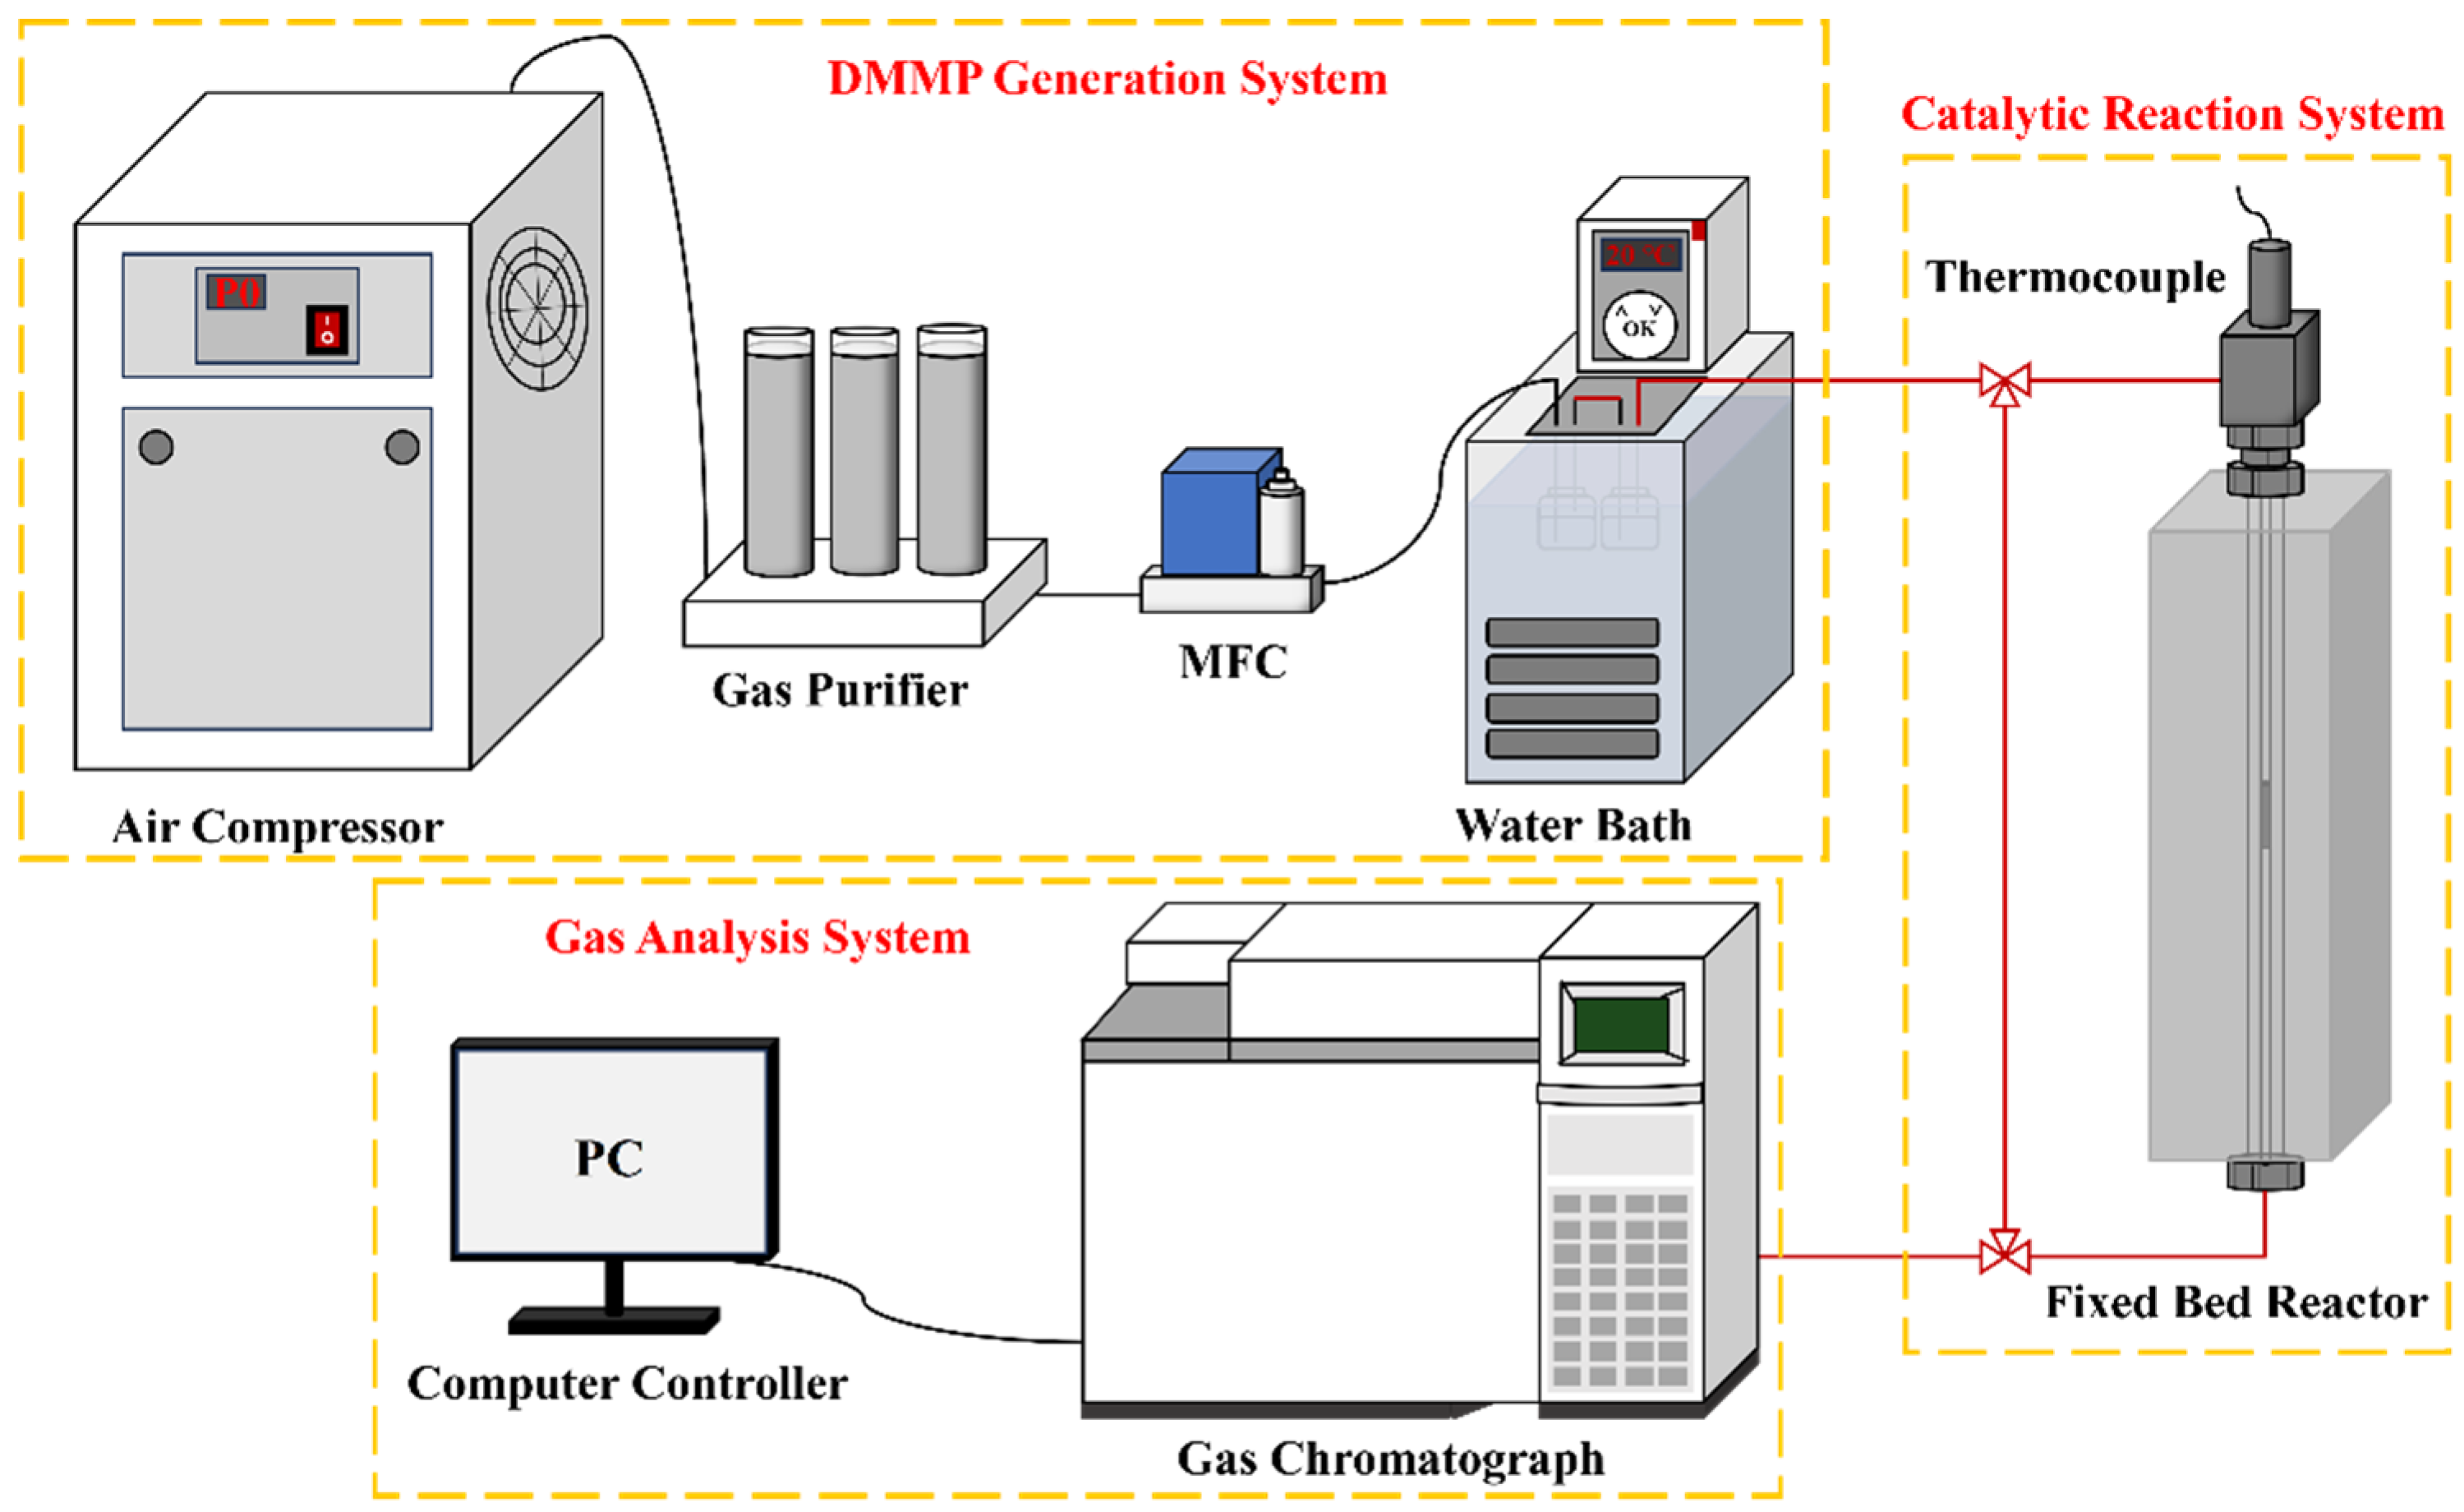
Figure 1 illustrates the thermal catalytic decomposition performance evaluation setup, which comprises three primary parts: the DMMP generation system, the catalytic reaction system, and the gas analysis system. In the DMMP generation system, air supplied by an air compressor was regulated at a 50 mL/min flow rate via a mass flow controller (MFC) and directed into two sequential generator bottles containing DMMP. The DMMP was generated through bubbling, with the generator bottles maintained in a water bath at 20 °C, yielding a DMMP concentration of 5.59 g/m3. The catalytic reaction system utilized a fixed-bed reactor, comprising a vertical quartz tube (inner diameter: 4 mm; length: 37 cm) housed within a tube-type resistance furnace with programmable temperature control. After crushing and sieving the catalyst to a particle size range of 20–40 mesh, it was placed into a quartz tube and firmly held in position at both ends using quartz wool. The reaction temperature within the fixed-bed reactor was maintained at 400 °C. The filling height of catalysts was 2.4 cm, and the gas hourly space velocity (GHSV) was maintained at 9952 h−1 throughout the catalytic evaluation. A gas chromatograph (Agilent 6890N, Santa Clara, CA, USA) furnished with a flame ionization detector (FID) and a DB-1701 analytical column comprised the gas analysis system, wherein data acquisition and processing is managed through a computer console. The thermocatalytic decomposition performance of DMMP was typically assessed based on protection time [18]. To minimize potential experimental errors, DMMP decomposition was considered complete when the decomposition rate reached or exceeded 99%. The duration for which DMMP remained fully decomposed was referred to as the protection time. The DMMP conversion rate (CVRDMMP) was determined using Equation (1).
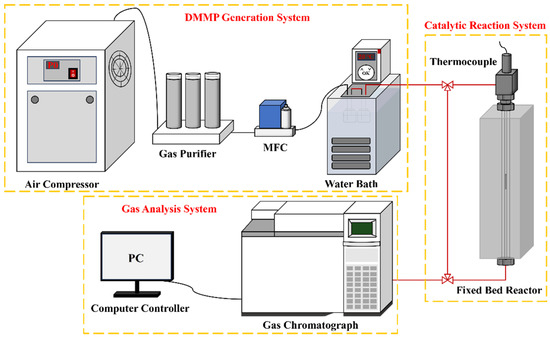
Figure 1.
Schematic diagram of the catalytic reaction evaluation device.
In Equation (1), Cout and Cin represent the DMMP concentration in the tail gas following thermocatalytic decomposition and the initial DMMP concentration at which bubbling occurs, respectively.
2.7. Thermocatalytic Decomposition Reaction Exhaust Gas Analysis
In this study, the catalytic reaction products were analyzed online employing a CATLAB catalytic microreactor (Hiden Ltd., Warrington, UK), which includes a steam generation system, a temperature-programmed reactor, and an online mass spectrometer. Prior to the experiment, helium gas (80 mL/min) was passed through the microreactor to purge the catalyst sample at 300 °C for 2 h. The catalyst loading was 100 mg. Following the experiment, the heating program was initiated, and the thermostatic water bath was maintained at 10 °C. An argon/oxygen mixture (20% O2/80% Ar) was continuously supplied at 50 mL/min to generate DMMP vapor. The temperature was gradually increased from 30 °C to 400 °C at a rate of 10 °C/min, and the tail gas concentration was analyzed using an HPR-20 online mass spectrometer (Hiden Ltd., Warrington, UK).
3. Results and Discussion
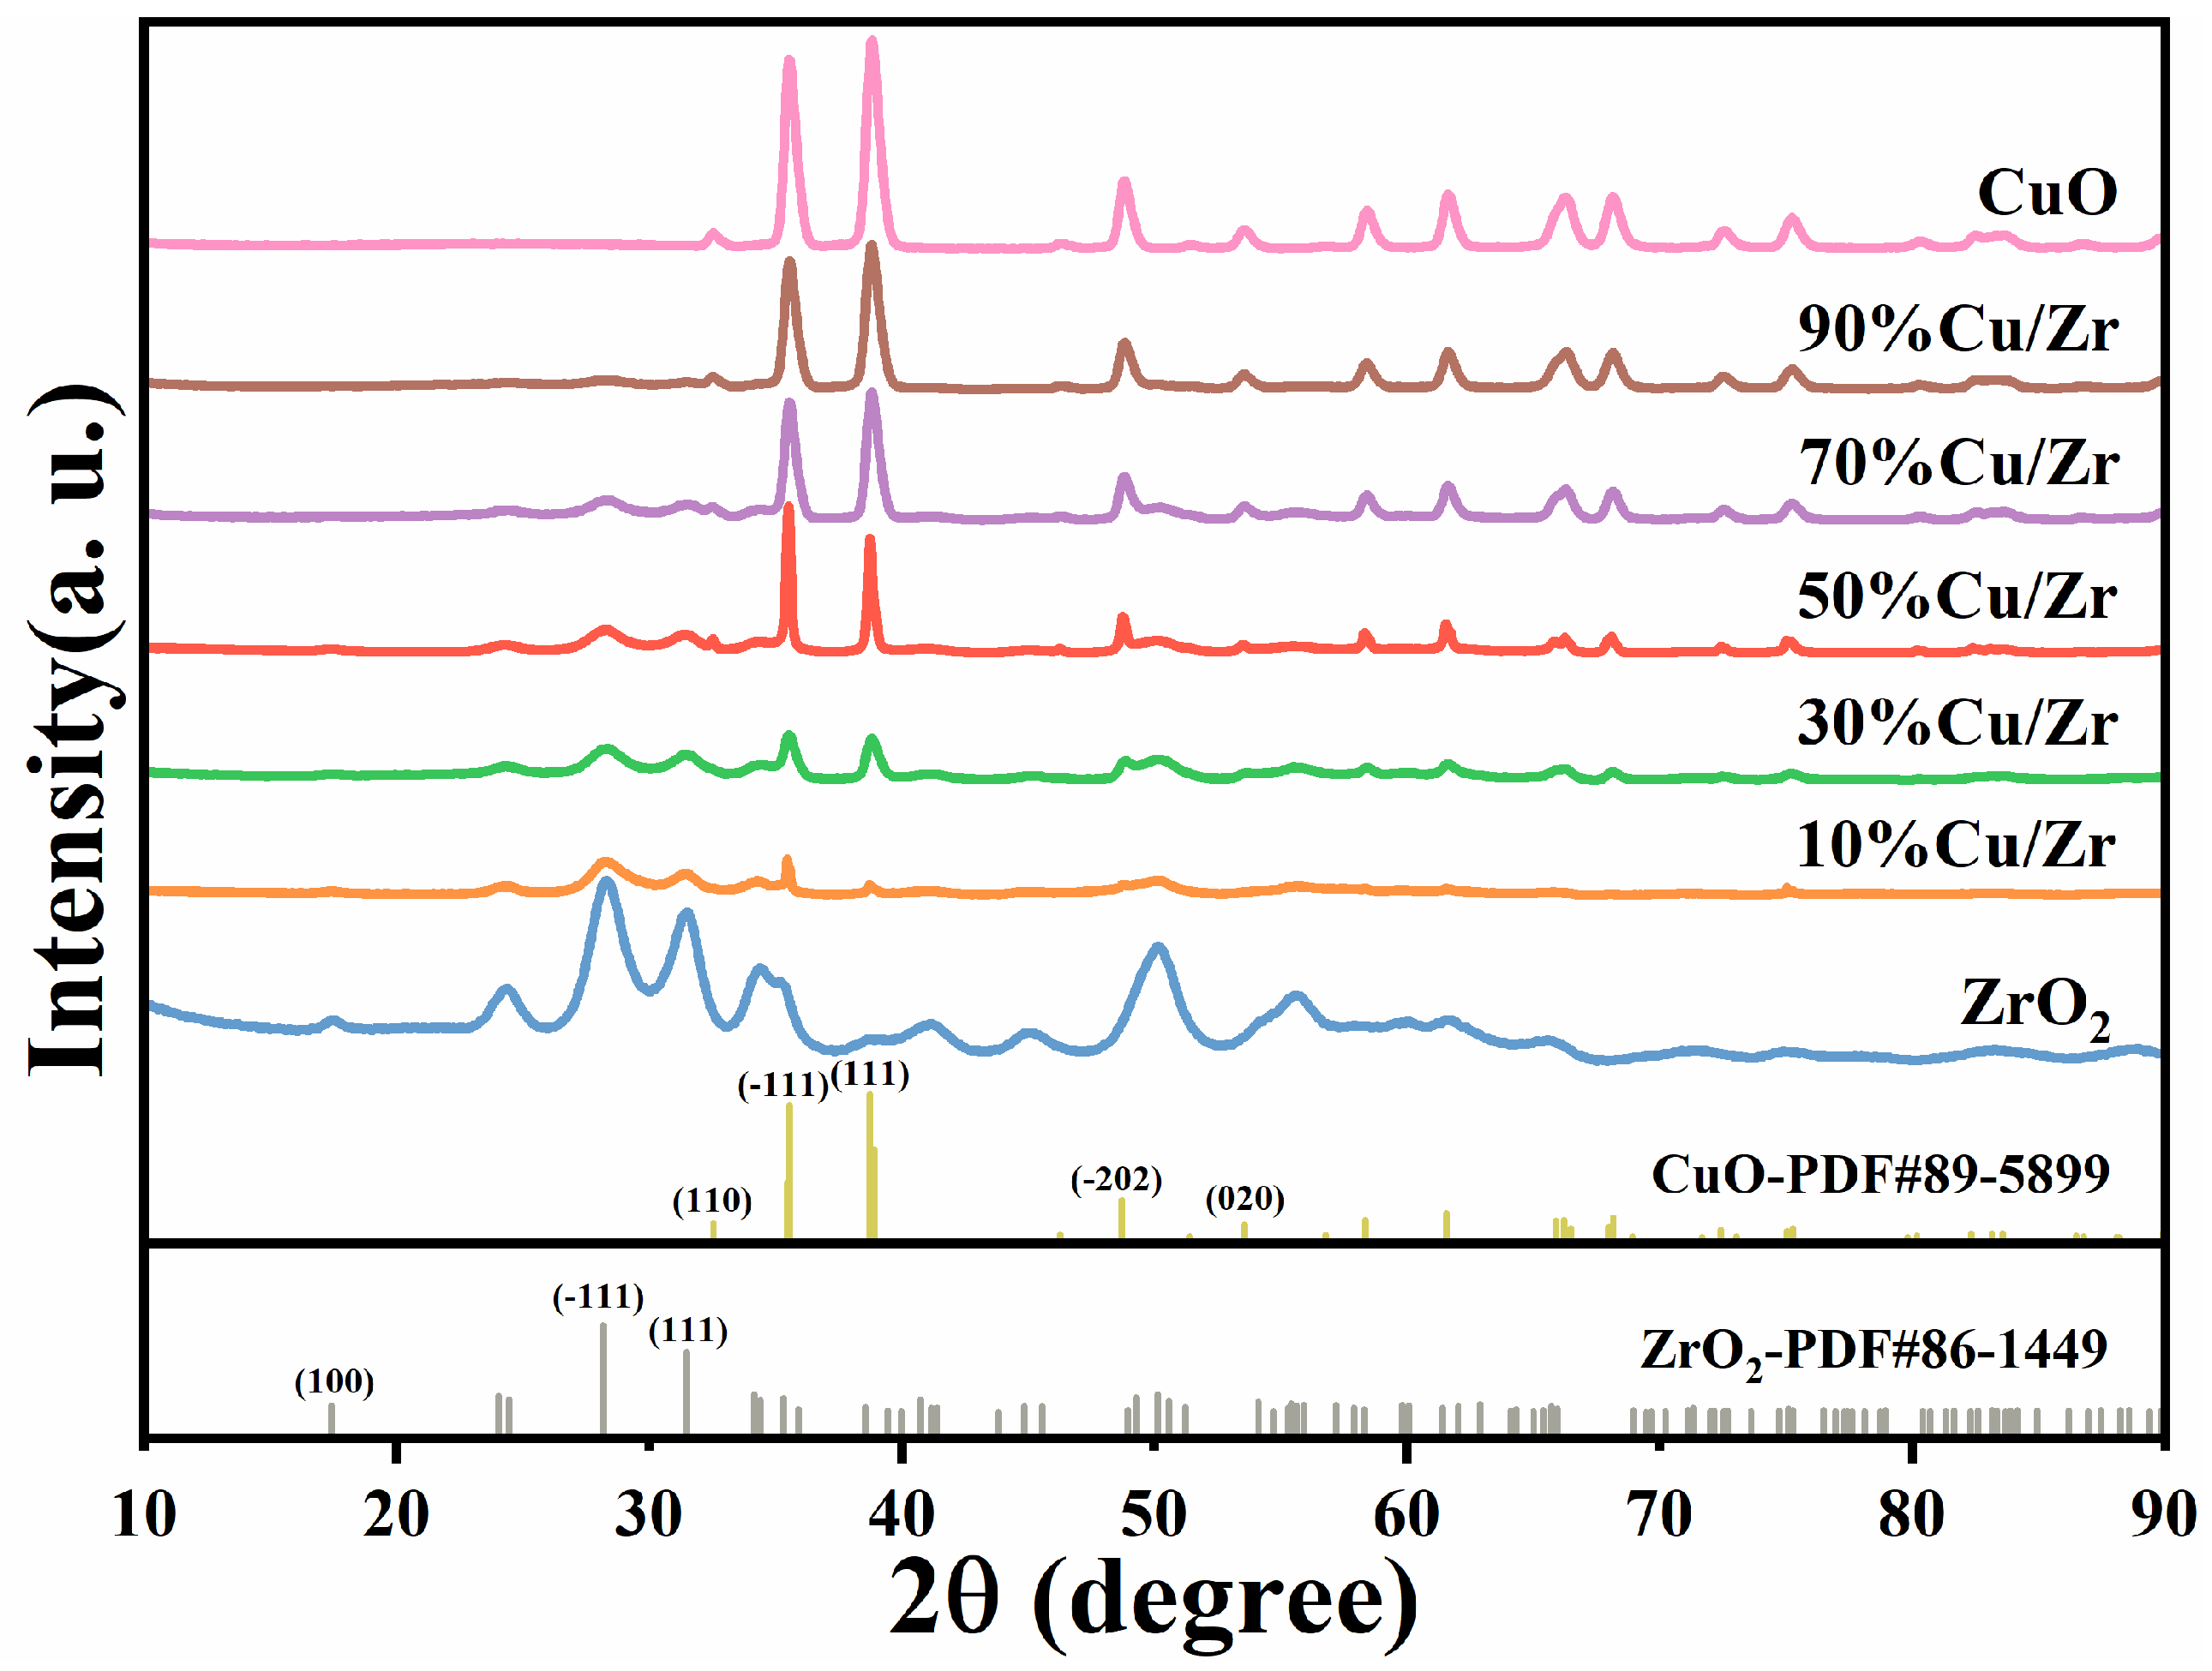
Figure 2 is a representation of the XRD patterns of CuO/ZrO2 catalysts with five CuO loading ratios, along with the patterns for pure ZrO2 and CuO catalysts. The XRD patterns reveal that the characteristic peaks for both ZrO2 and CuO match those reported for pure ZrO2 (JCPDS No. 86-1449) and CuO (JCPDS No. 89-5899), confirming the presence of these phases. As the CuO loading ratio increases, the ZrO2 diffraction peaks diminish in intensity, with some peaks eventually disappearing. In contrast, the CuO diffraction peaks at the (110), (-111), (111), (-202), and (020) crystal planes (corresponding to 32.5°, 35.5°, 38.7°, 48.7°, and 53.5°) progressively increase in intensity, indicating a growth in the crystallinity of the CuO phase within the CuO/ZrO2 composite catalysts. The Scherrer equation was employed to determine the particle size of the catalyst material, with the calculated values shown in Table 1. The grain size grows with increasing CuO loading at first but starts to decline as the CuO content further increases.
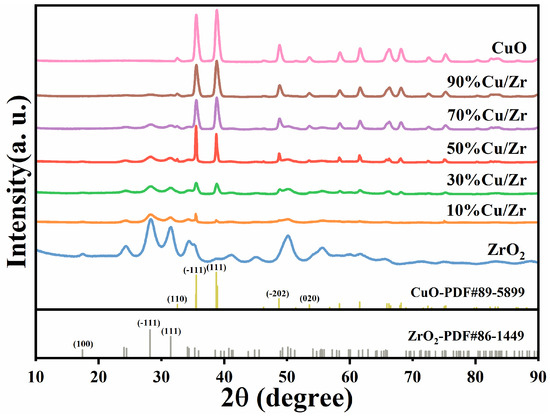
Figure 2.
XRD patterns of as-synthesized ZrO2, CuO/ZrO2, and CuO catalysts.

Table 1.
SSA, pore structure parameters, crystallite size, and actual loading ratio of catalysts.
The SSA and pore structure characteristics of Cu/Zr catalysts with varying loading ratios were measured and are outlined in Table 1. It was observed that the actual loading ratios exceeded the theoretical values, which can be attributed to the partial loss of ZrO2 support during the secondary hydrothermal treatment in NaOH solution, resulting in higher actual loading ratios. Furthermore, the data (Table 1) indicate that both the SSA and PV of the catalysts reduced as the Cu/Zr loading ratio increased. On the other hand, the average pore size exhibited an increasing trend with higher Cu/Zr content.
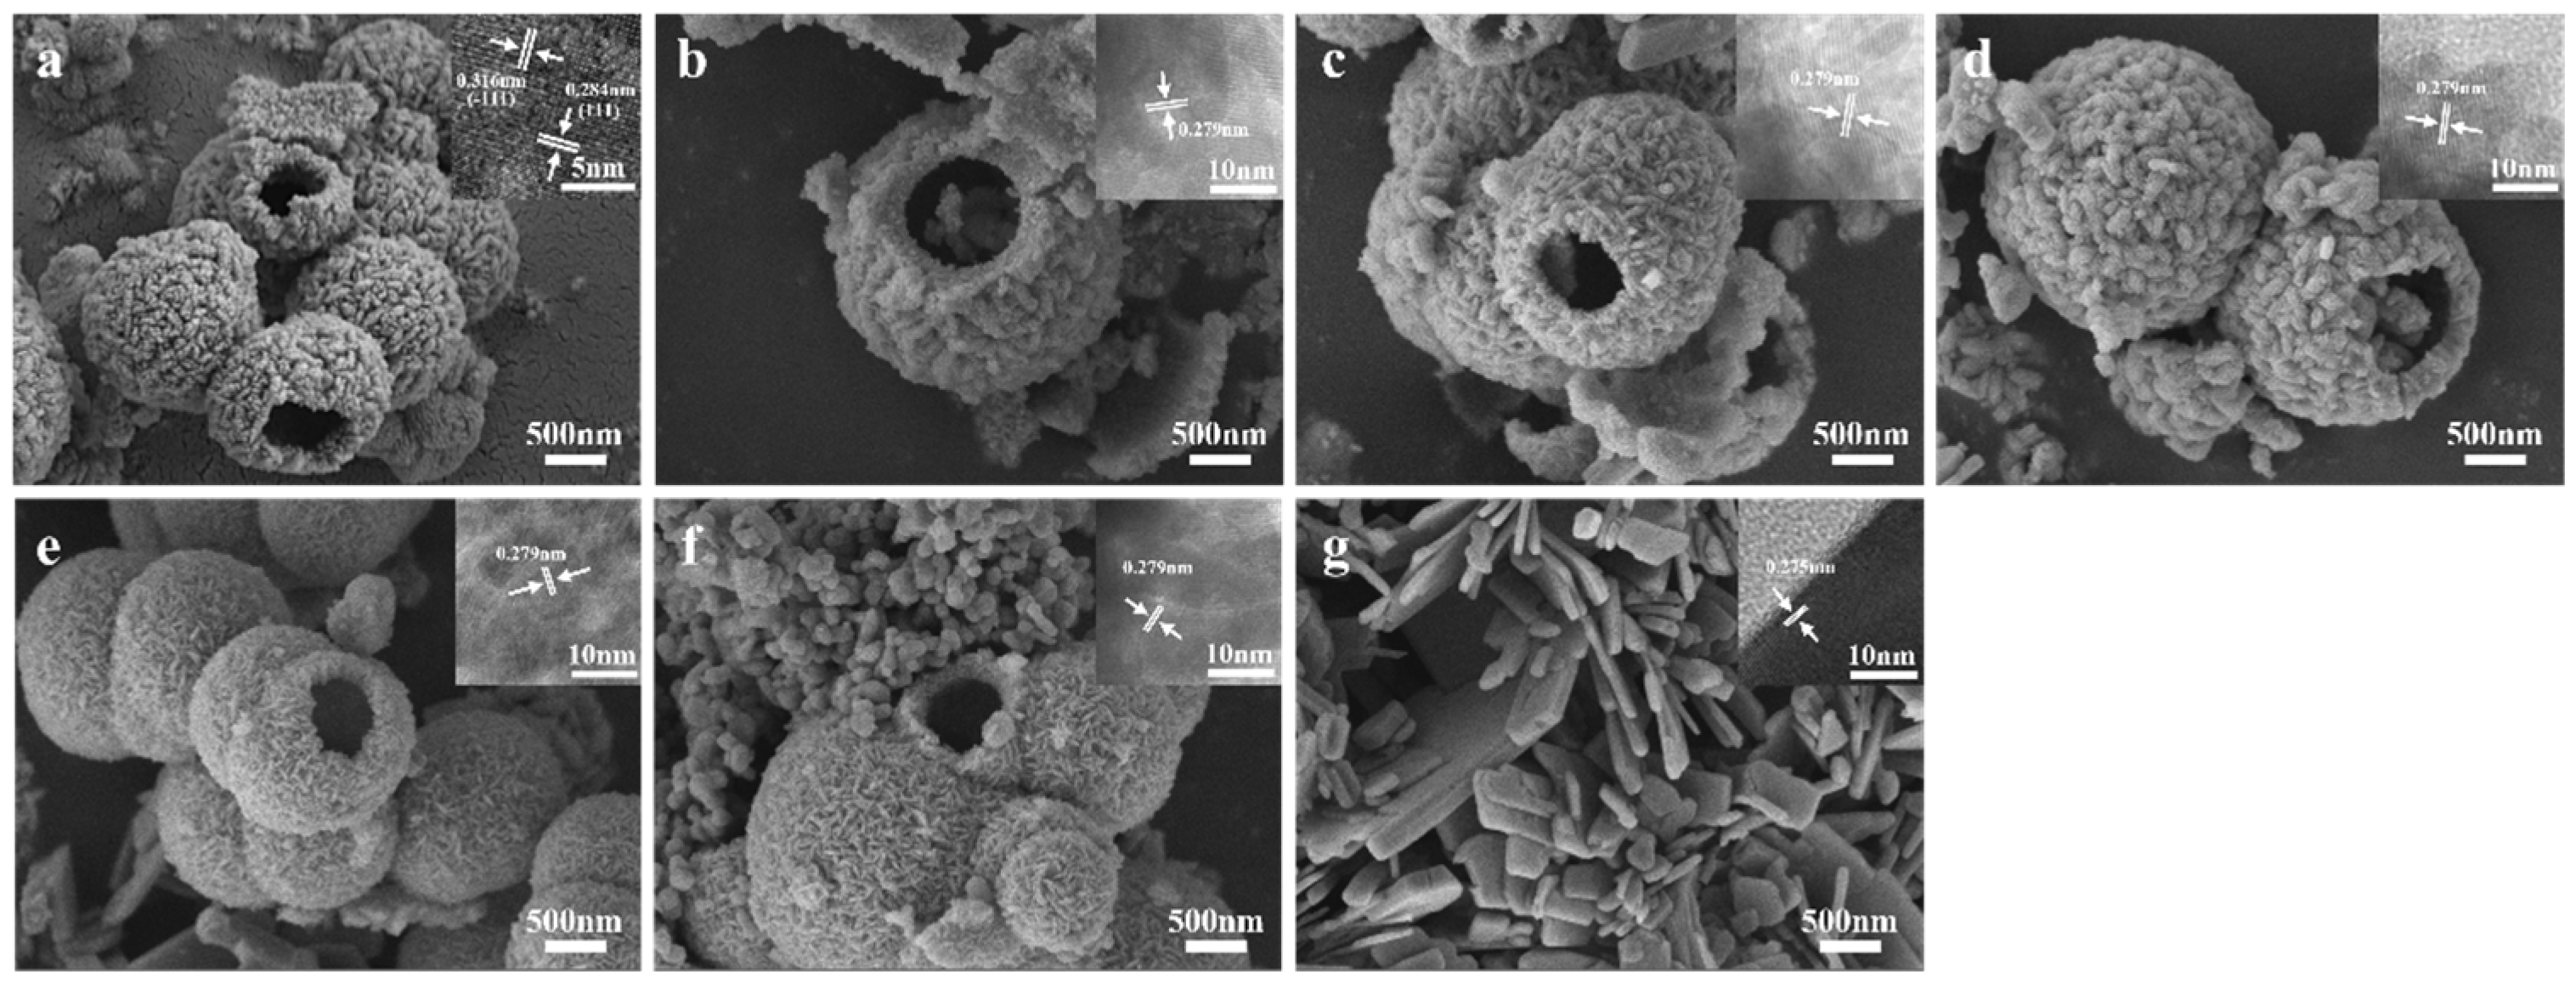
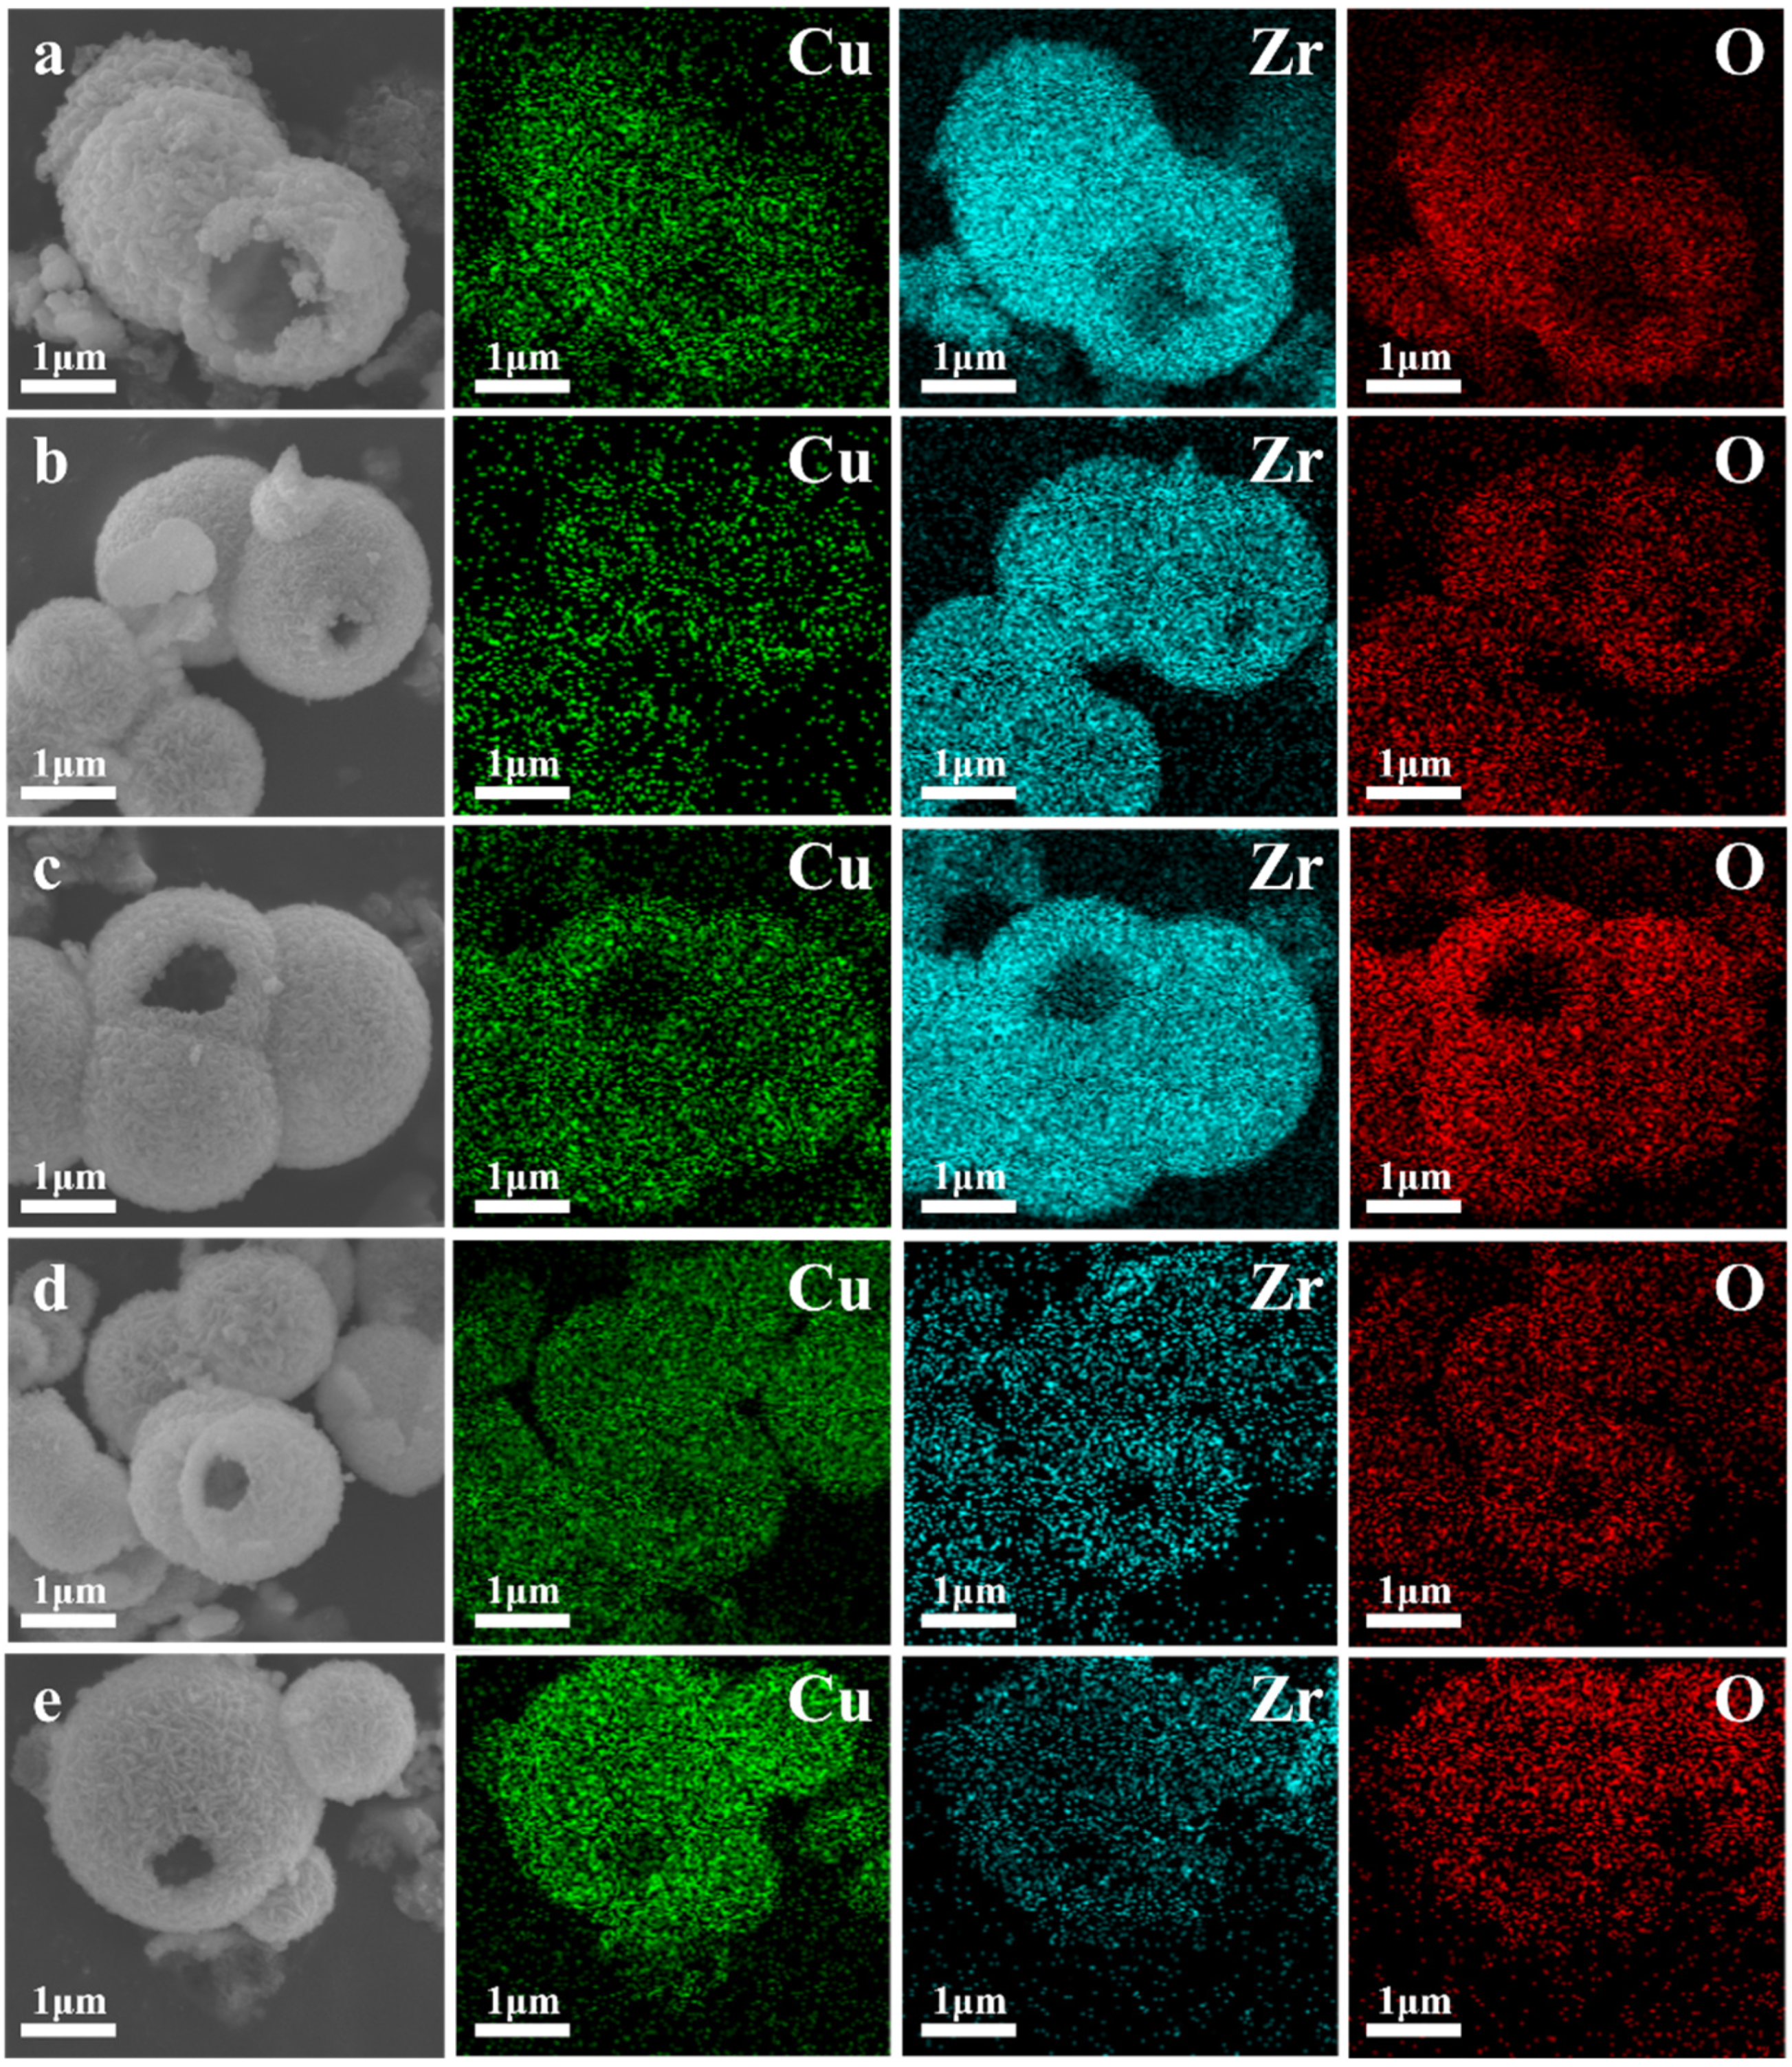
The SEM and HRTEM images of ZrO2, CuO, and CuO/ZrO2 catalysts with varying loading ratios are presented in Figure 3. As depicted in Figure 3a, the ZrO2 catalyst consists of hollow microspheres composed of fine nanoparticles with rough surfaces. The size of the hollow microspheres ranges from 0.5 μm to 2.5 μm, with a wall thickness of approximately 200 nm. The CuO catalyst exhibits an irregular flake-like morphology (Figure 3g). From Figure 3b–f and the mapping images in Figure 4, it is evident that the hollow microsphere structure of ZrO2 is preserved after CuO loading, with Cu being uniformly distributed on the surface of the ZrO2 hollow microspheres. When the Cu/Zr ratio reaches 50%, some CuO flaky structures begin to appear (Figure 3d).

Figure 3.
SEM and HRTEM images of catalysts: (a) ZrO2, (b) 10%Cu/Zr, (c) 30%Cu/Zr, (d) 50%Cu/Zr, (e) 70%Cu/Zr, (f) 90% Cu/Zr, and (g) CuO.
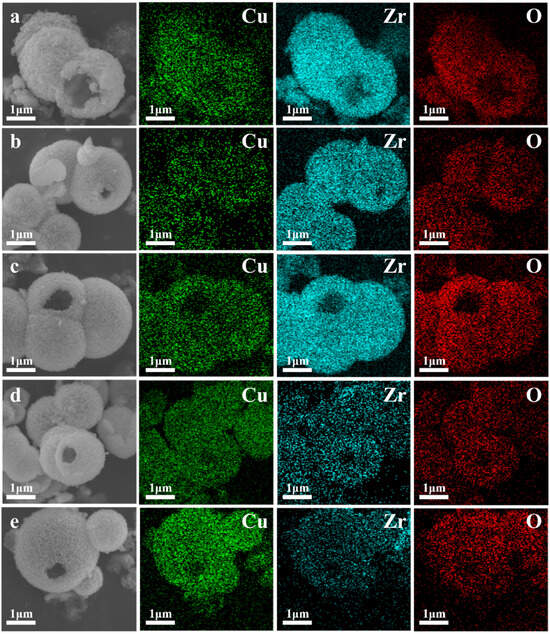
Figure 4.
Energy spectrum analysis of Cu, Zr, and O in CuO/ZrO2 catalysts: (a) 10%Cu/Zr, (b) 30%Cu/Zr, (c) 50%Cu/Zr, (d) 70%Cu/Zr, and (e) 90%Cu/Zr.
The lattice spacings observed in the illustrations of Figure 3a and Figure 3g for ZrO2 are 0.316 nm and 0.284 nm, respectively, while the lattice spacing of CuO is 0.275 nm. Additional lattice spacings of 0.262 nm, 0.252 nm, and 0.232 nm are also noted, which correlate with the XRD patterns of ZrO2 and CuO. Furthermore, the HRTEM images of CuO/ZrO2 catalysts with different Cu loading ratios (Figure 3b–f) reveal lattice fringes with a spacing of 0.279 nm. This change is attributed to the incorporation of CuO into the ZrO2 lattice, resulting in lattice distortion and a corresponding alteration in the lattice spacing.
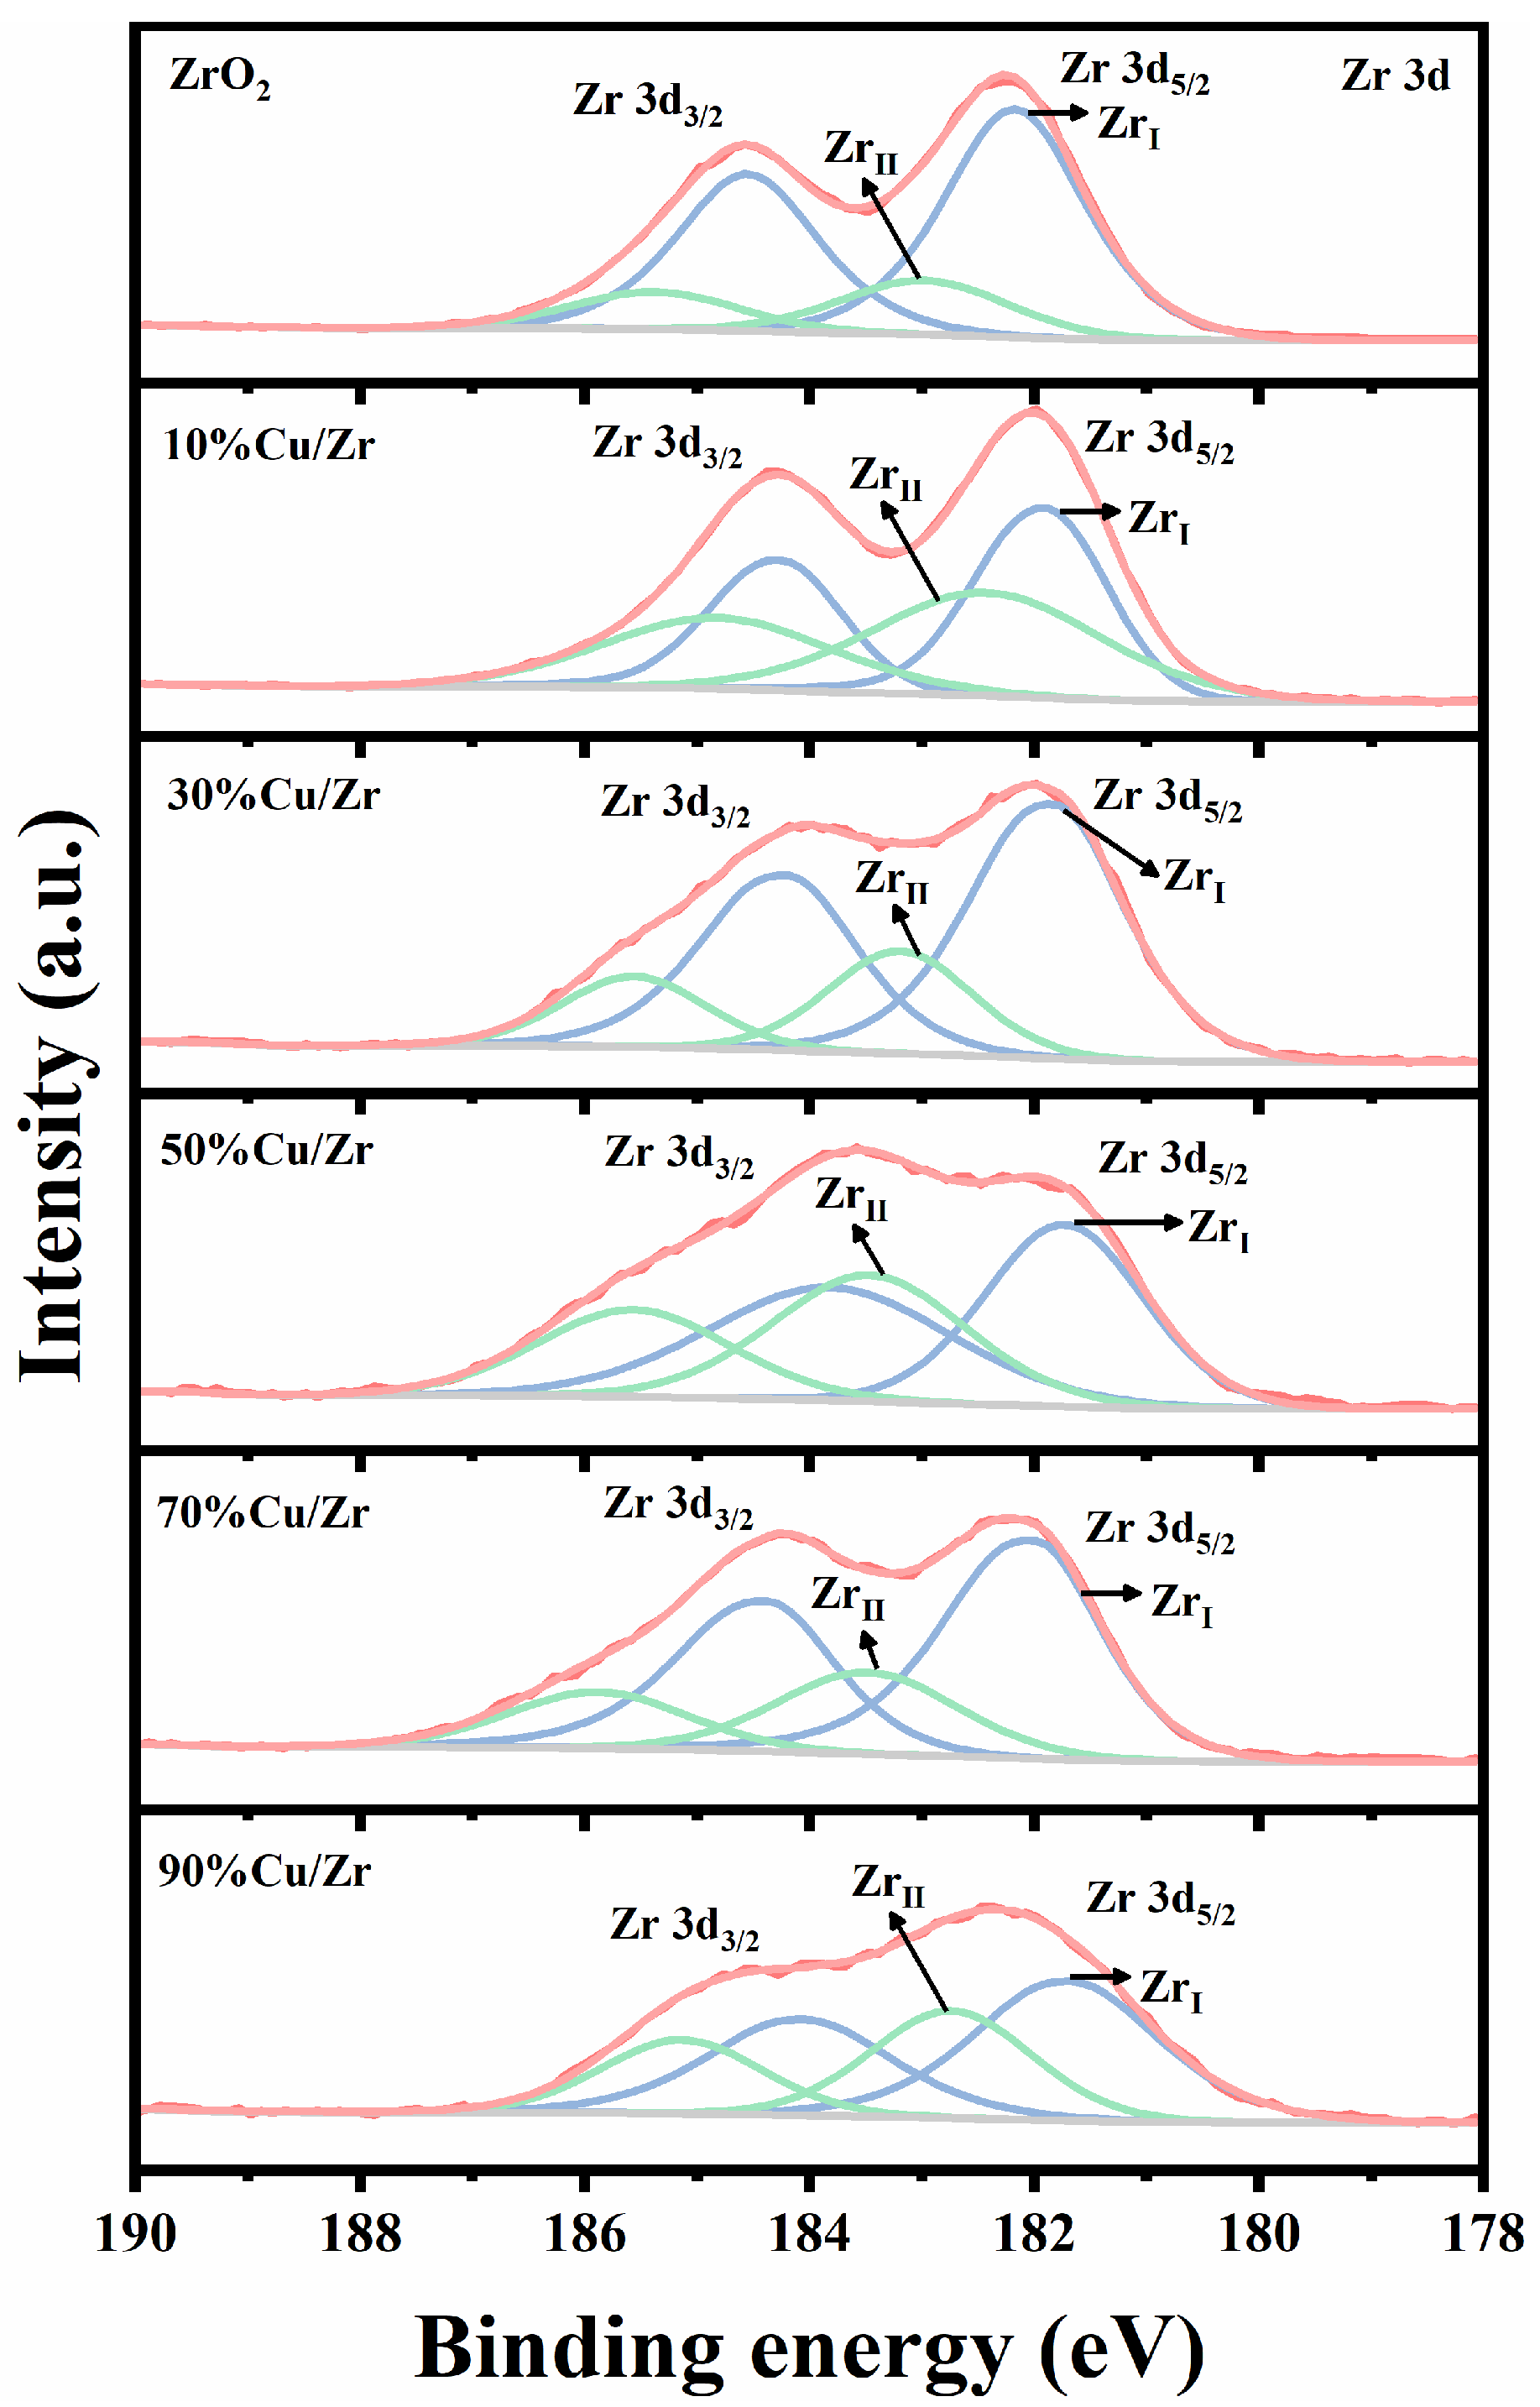
XPS analysis was systematically employed to characterize the surface composition of as-prepared ZrO2, CuO, and CuO/ZrO2 catalysts with varying Cu/Zr ratios (10%, 30%, 50%, 70%, and 90%), as comprehensively illustrated in Figure 5, Figure 6 and Figure 7. Figure 5 shows the Zr 3d XPS spectra of ZrO2 and CuO/ZrO2 catalysts. The prepared pure ZrO2 catalysts exhibit two spin orbitals in the Zr 3d energy level, 3d5/2 (182.0 eV) and 3d3/2 (184.4 eV), with a 2.4 eV difference in their binding energy difference, consistent with the data in references [33,34,35]. According to reference [35], the characteristic peaks of the Zr 3d profile can be ascribed to the existence of two Zr species, namely the relatively low-binding-energy ZrI species, and the relatively high-binding-energy ZrII species. A Gaussian–Lorentz function was used to fit them, and the percentage of ZrI species was computed using the fitting results as shown in Table 2. Relative to ZrO2, the Zr 3d peaks in the CuO/ZrO2 spectrum shift to lower binding energies, suggesting a weakening of Zr-O-Zr interactions and a progressive enhancement of Zr-Cu interactions [36]. It is noteworthy that the proportion of ZrI species is greater than that of ZrII species in all samples.
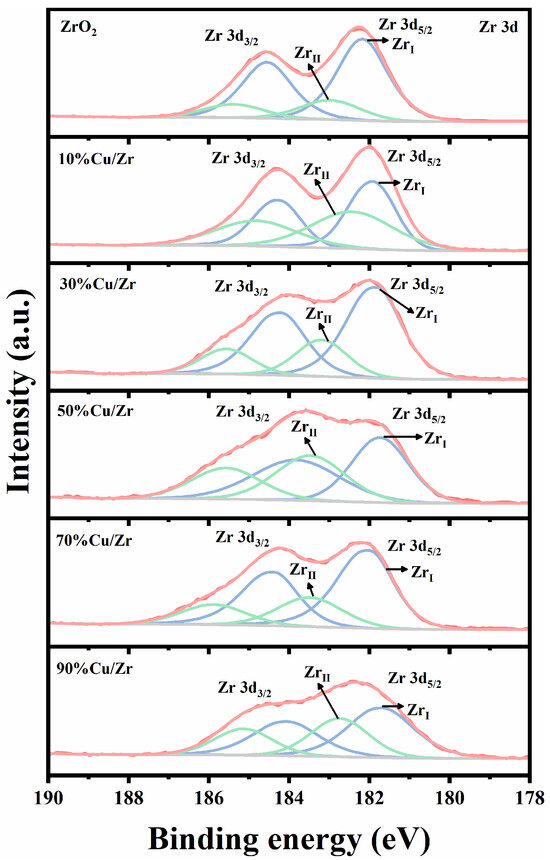
Figure 5.
Zr 3d XPS spectra of ZrO2 and CuO/ZrO2 catalysts with different Cu/Zr ratios.
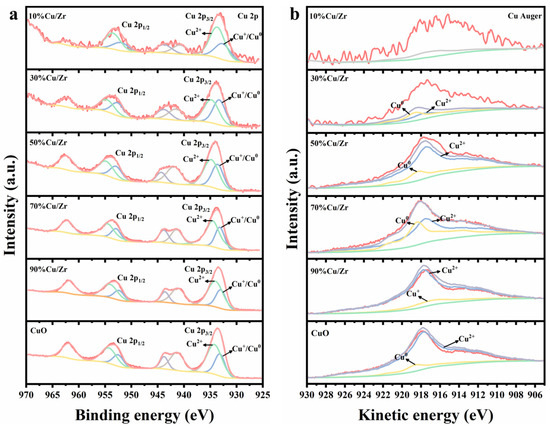
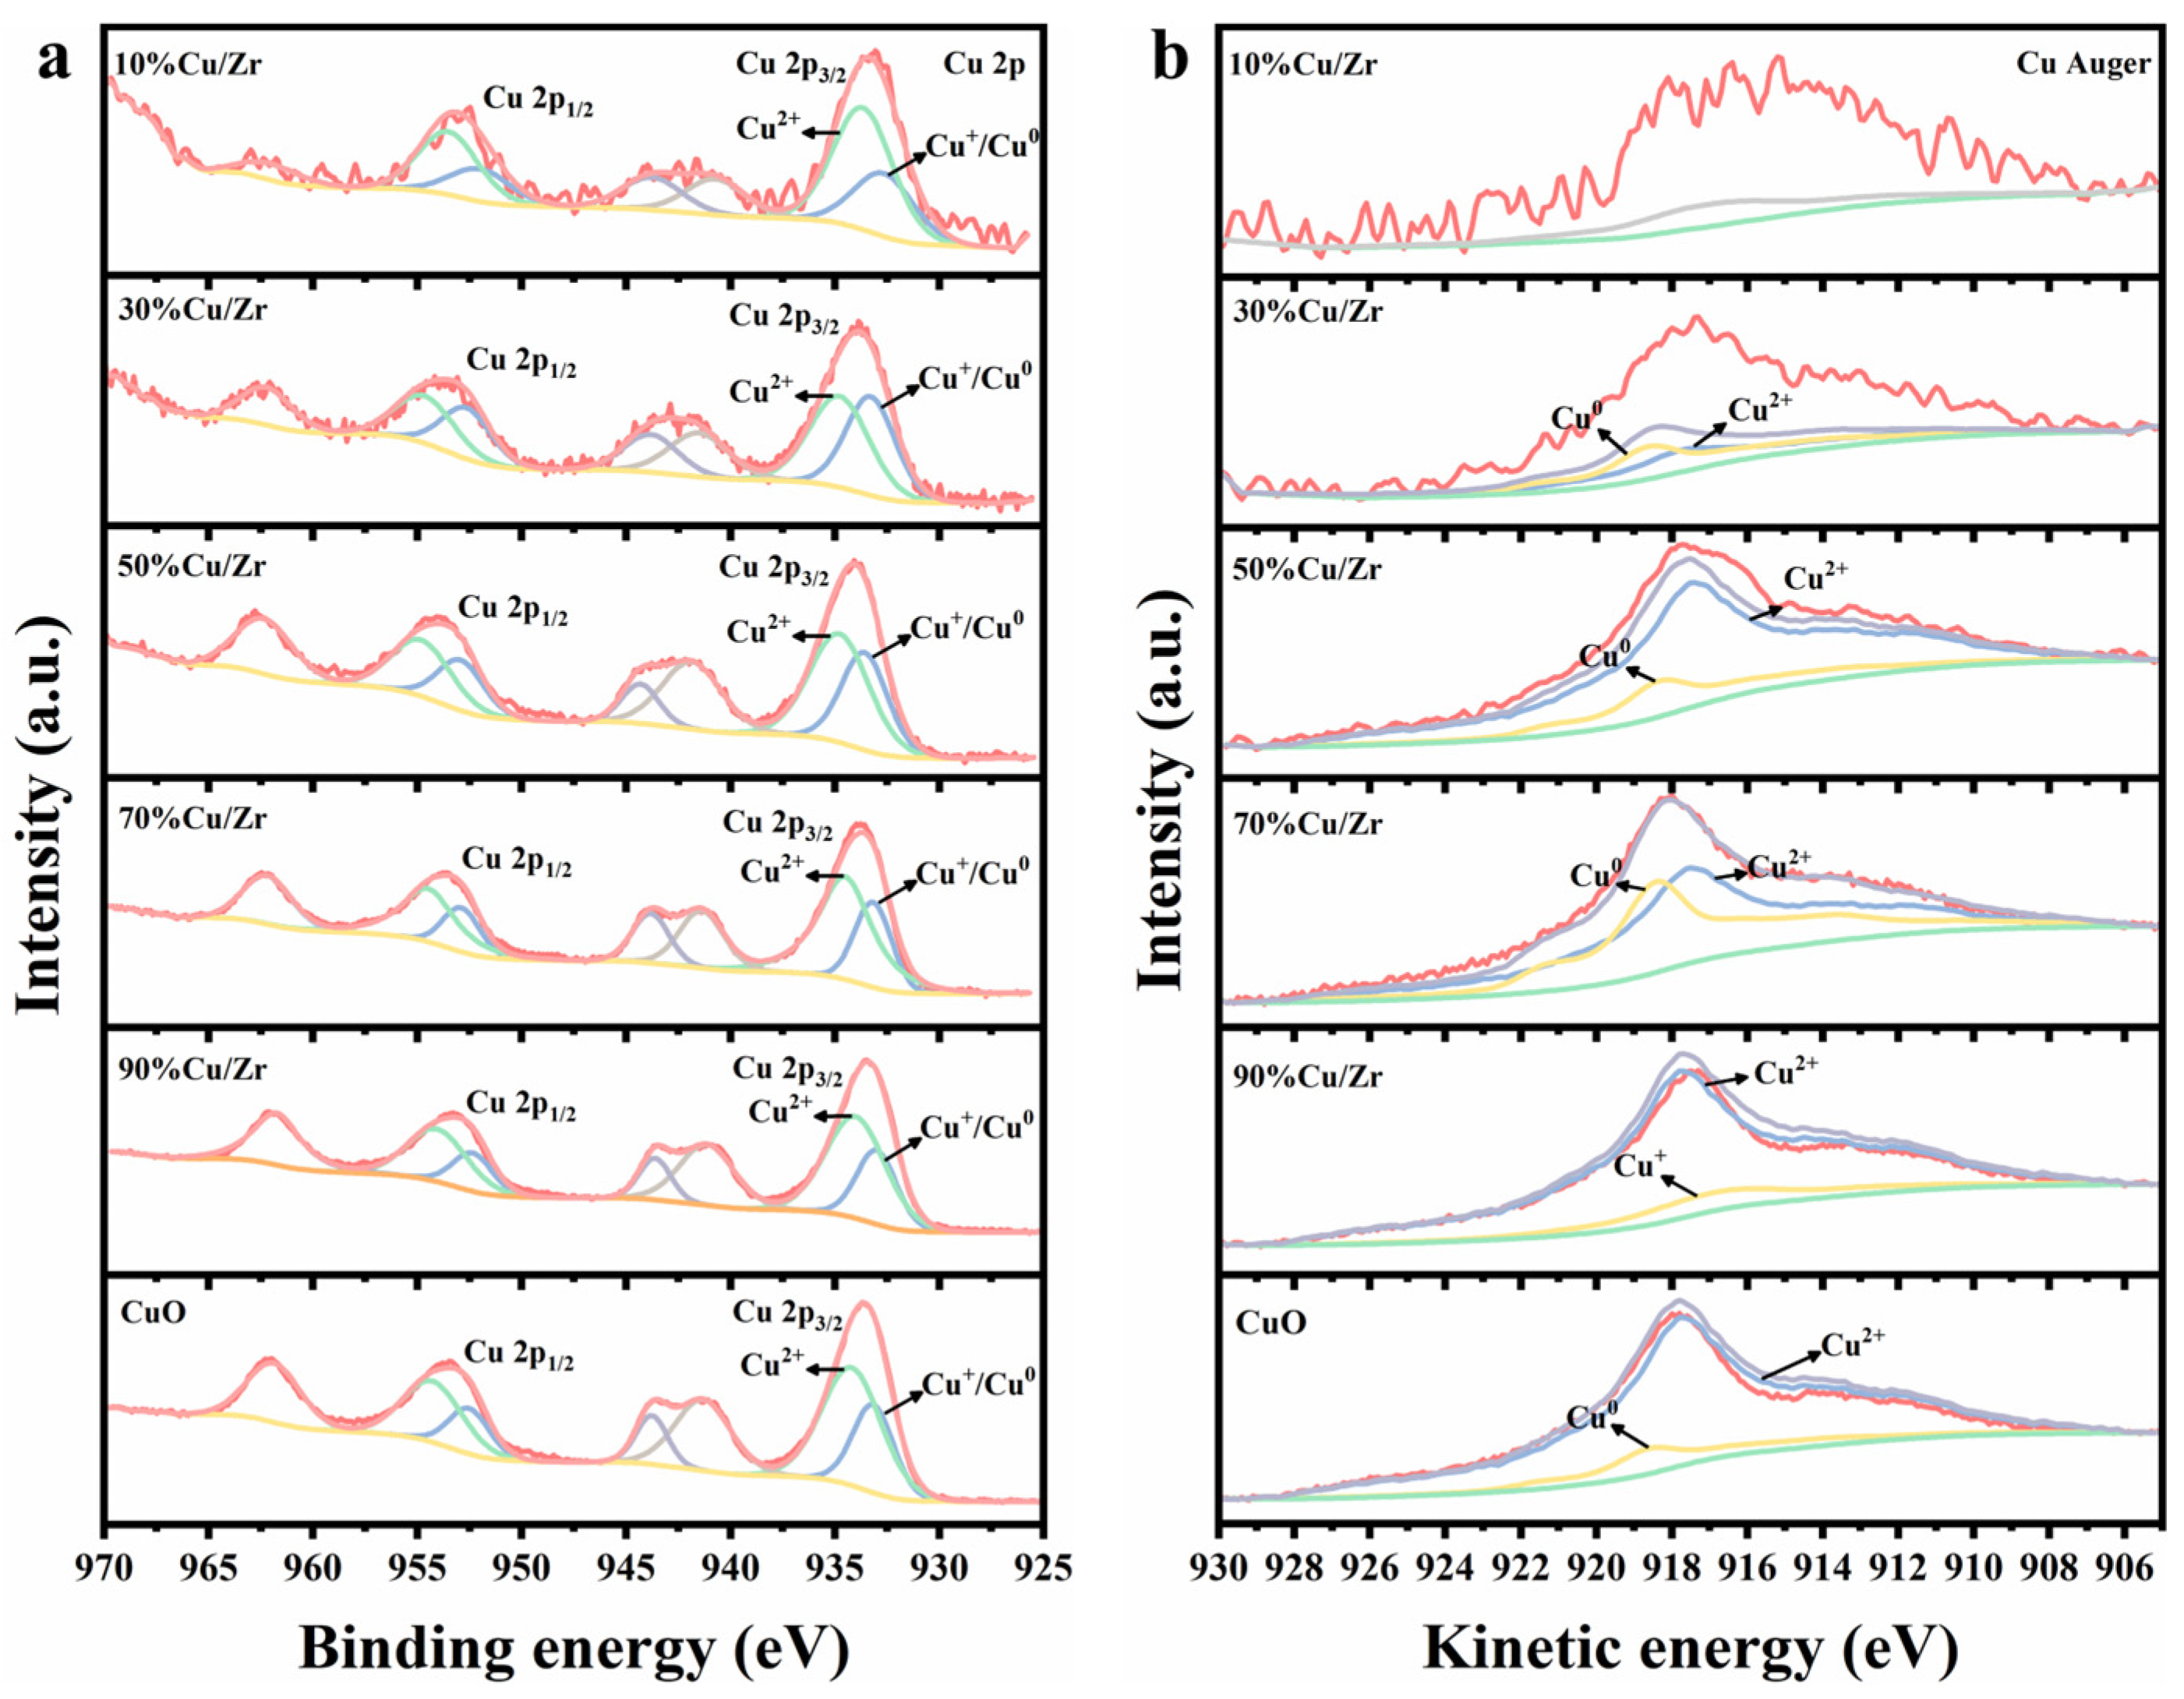
Figure 6.
(a) Cu 2p XPS spectra and (b) Cu LMM spectra of CuO and CuO/ZrO2 catalysts.
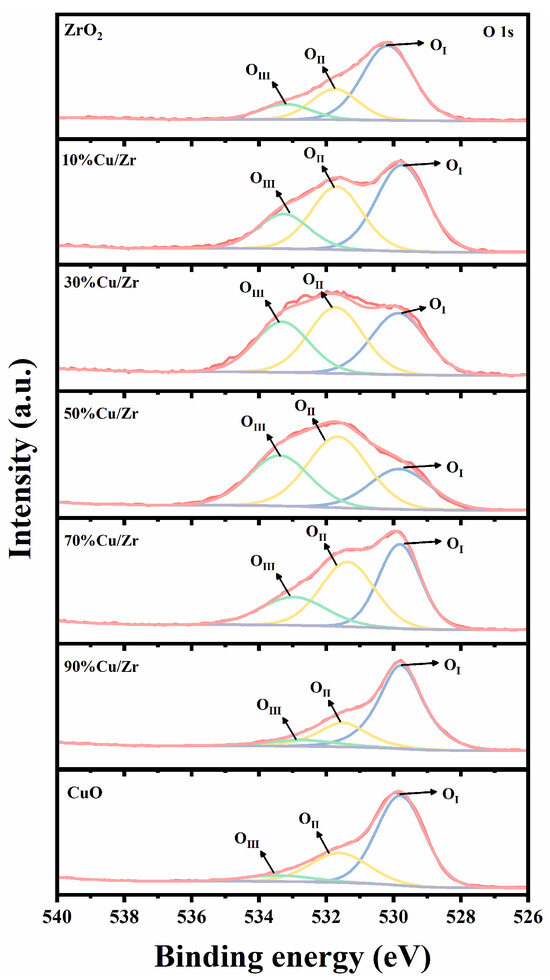
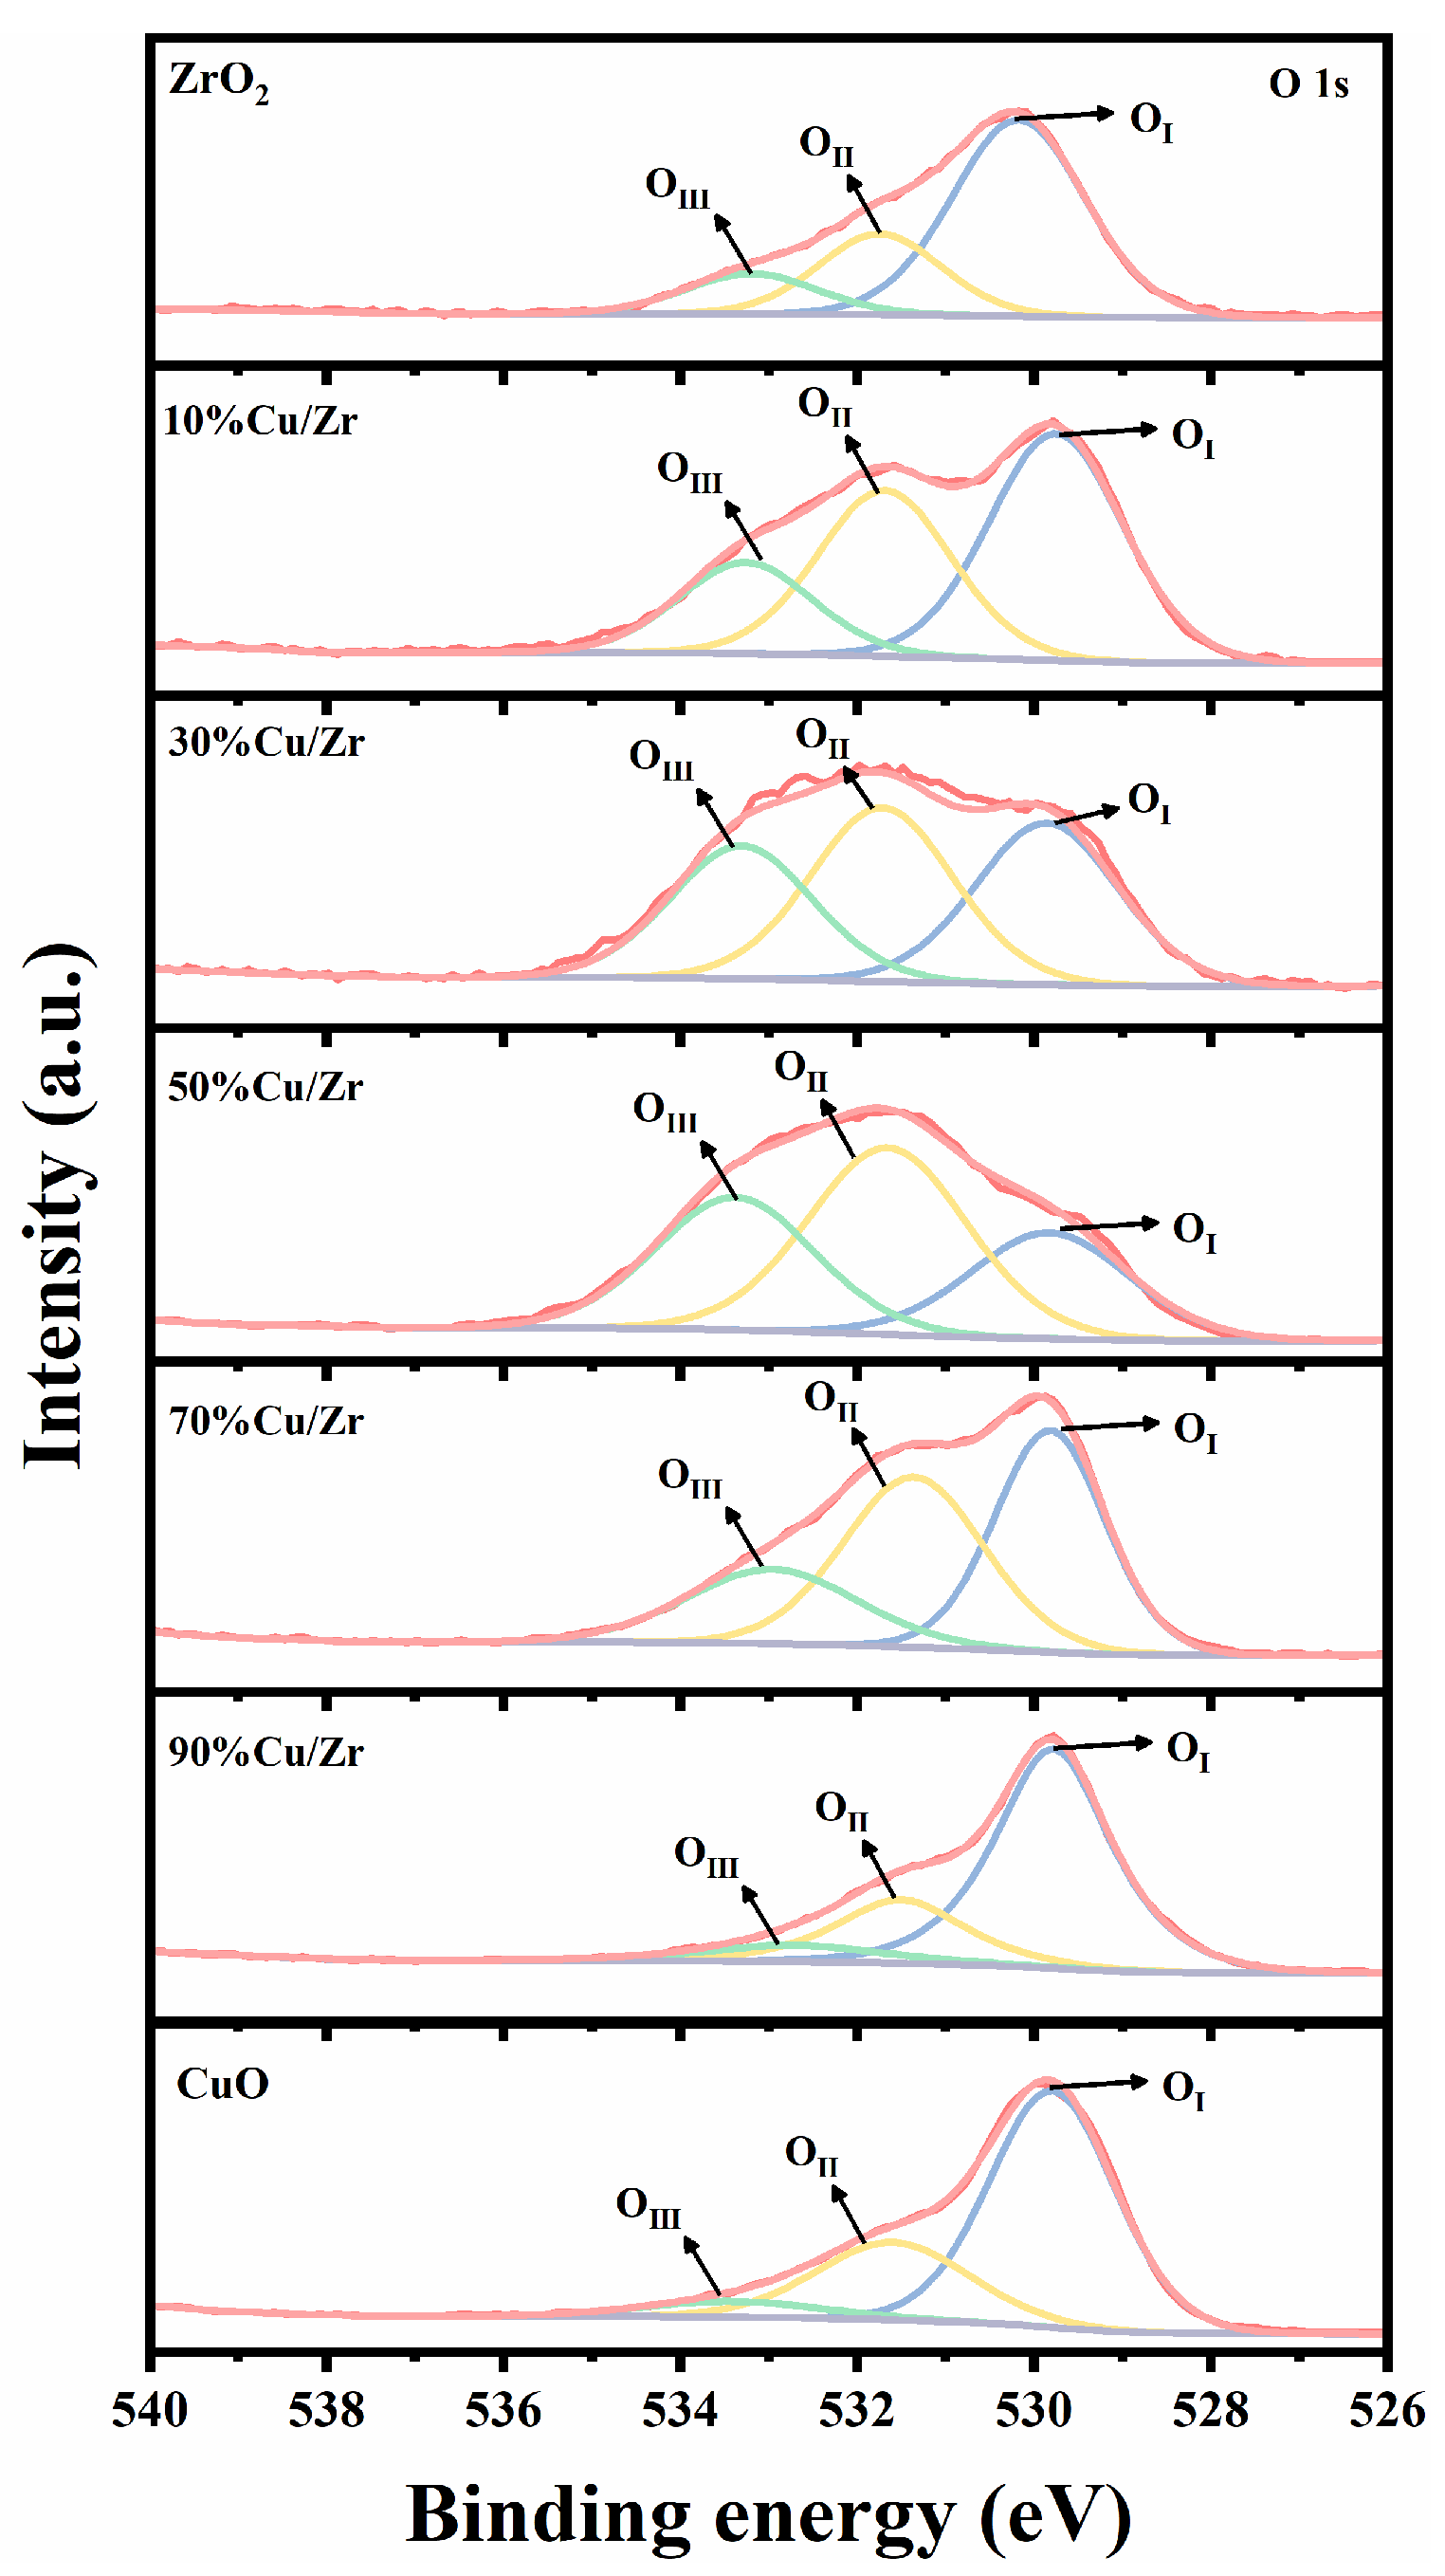
Figure 7.
O 1s XPS spectra of ZrO2, CuO/ZrO2, and CuO catalysts.
Table 2.
Surface atomic ratios of CuO/ZrO2 composite catalysts.
Figure 6 presents the Cu 2p and Cu Auger spectra of CuO/ZrO2 and pure CuO catalysts. In Figure 6a, the Cu 2p spectrum shows a pair of distinct characteristic peaks at 933.6 eV (2p3/2) and 953.4 eV (2p1/2), accompanied by strong satellite peaks in the 937–948 eV range. This confirms the presence of Cu2+ in the catalysts; however, the presence of Cu1+ and Cu0 cannot be definitively determined. Since the 2p3/2 binding energies of Cu1+ and Cu0 are too proximate to be distinguished by XPS alone, further analysis using Cu Auger spectra is required. Figure 6b displays the fitted Cu Auger spectra, obtained via the nonlinear least squares method, to identify Cu1+ or Cu0 in CuO/ZrO2 catalysts with varying Cu/Zr ratios. Importantly, the spectrum of the 10%Cu/Zr catalyst could not be fitted, likely due to the low Cu content, resulting in a weak signal-to-noise ratio. Compared to pure CuO, CuO/ZrO2 catalysts exhibited an increasing trend in Cu 2p binding energies across different Cu/Zr ratios, indicating alterations in the charge environment of Cu species during doping [34,37]. In addition, as CuO doping increased, the Cu 2p binding energy displayed a decreasing trend, which may be associated with a reduction in the oxidation state of Cu species [38].
Figure 7 shows the O 1s XPS spectra of ZrO2, CuO/ZrO2, and CuO catalysts. The O 1s spectral peaks of the prepared catalysts can be fitted into three peaks [36,39,40,41]: the lattice oxygen species with binding energies in the range of 529.4–530.1 eV (denoted as OI), the oxygen vacancies with binding energies in the range of 531.3–531.7 eV (denoted as OII), and surface-adsorbed or -bound oxygen species with binding energies in the range of 532.7–533.5 eV (denoted as OIII). The proportion of OI, OII, and OIII species to all O species is calculated in Table 2. The data revealed that in CuO/ZrO2 catalysts, lattice oxygen species initially decreased and then increased with rising CuO doping levels, while oxygen vacancies and surface-adsorbed/bonded oxygen species exhibited the opposite trend.
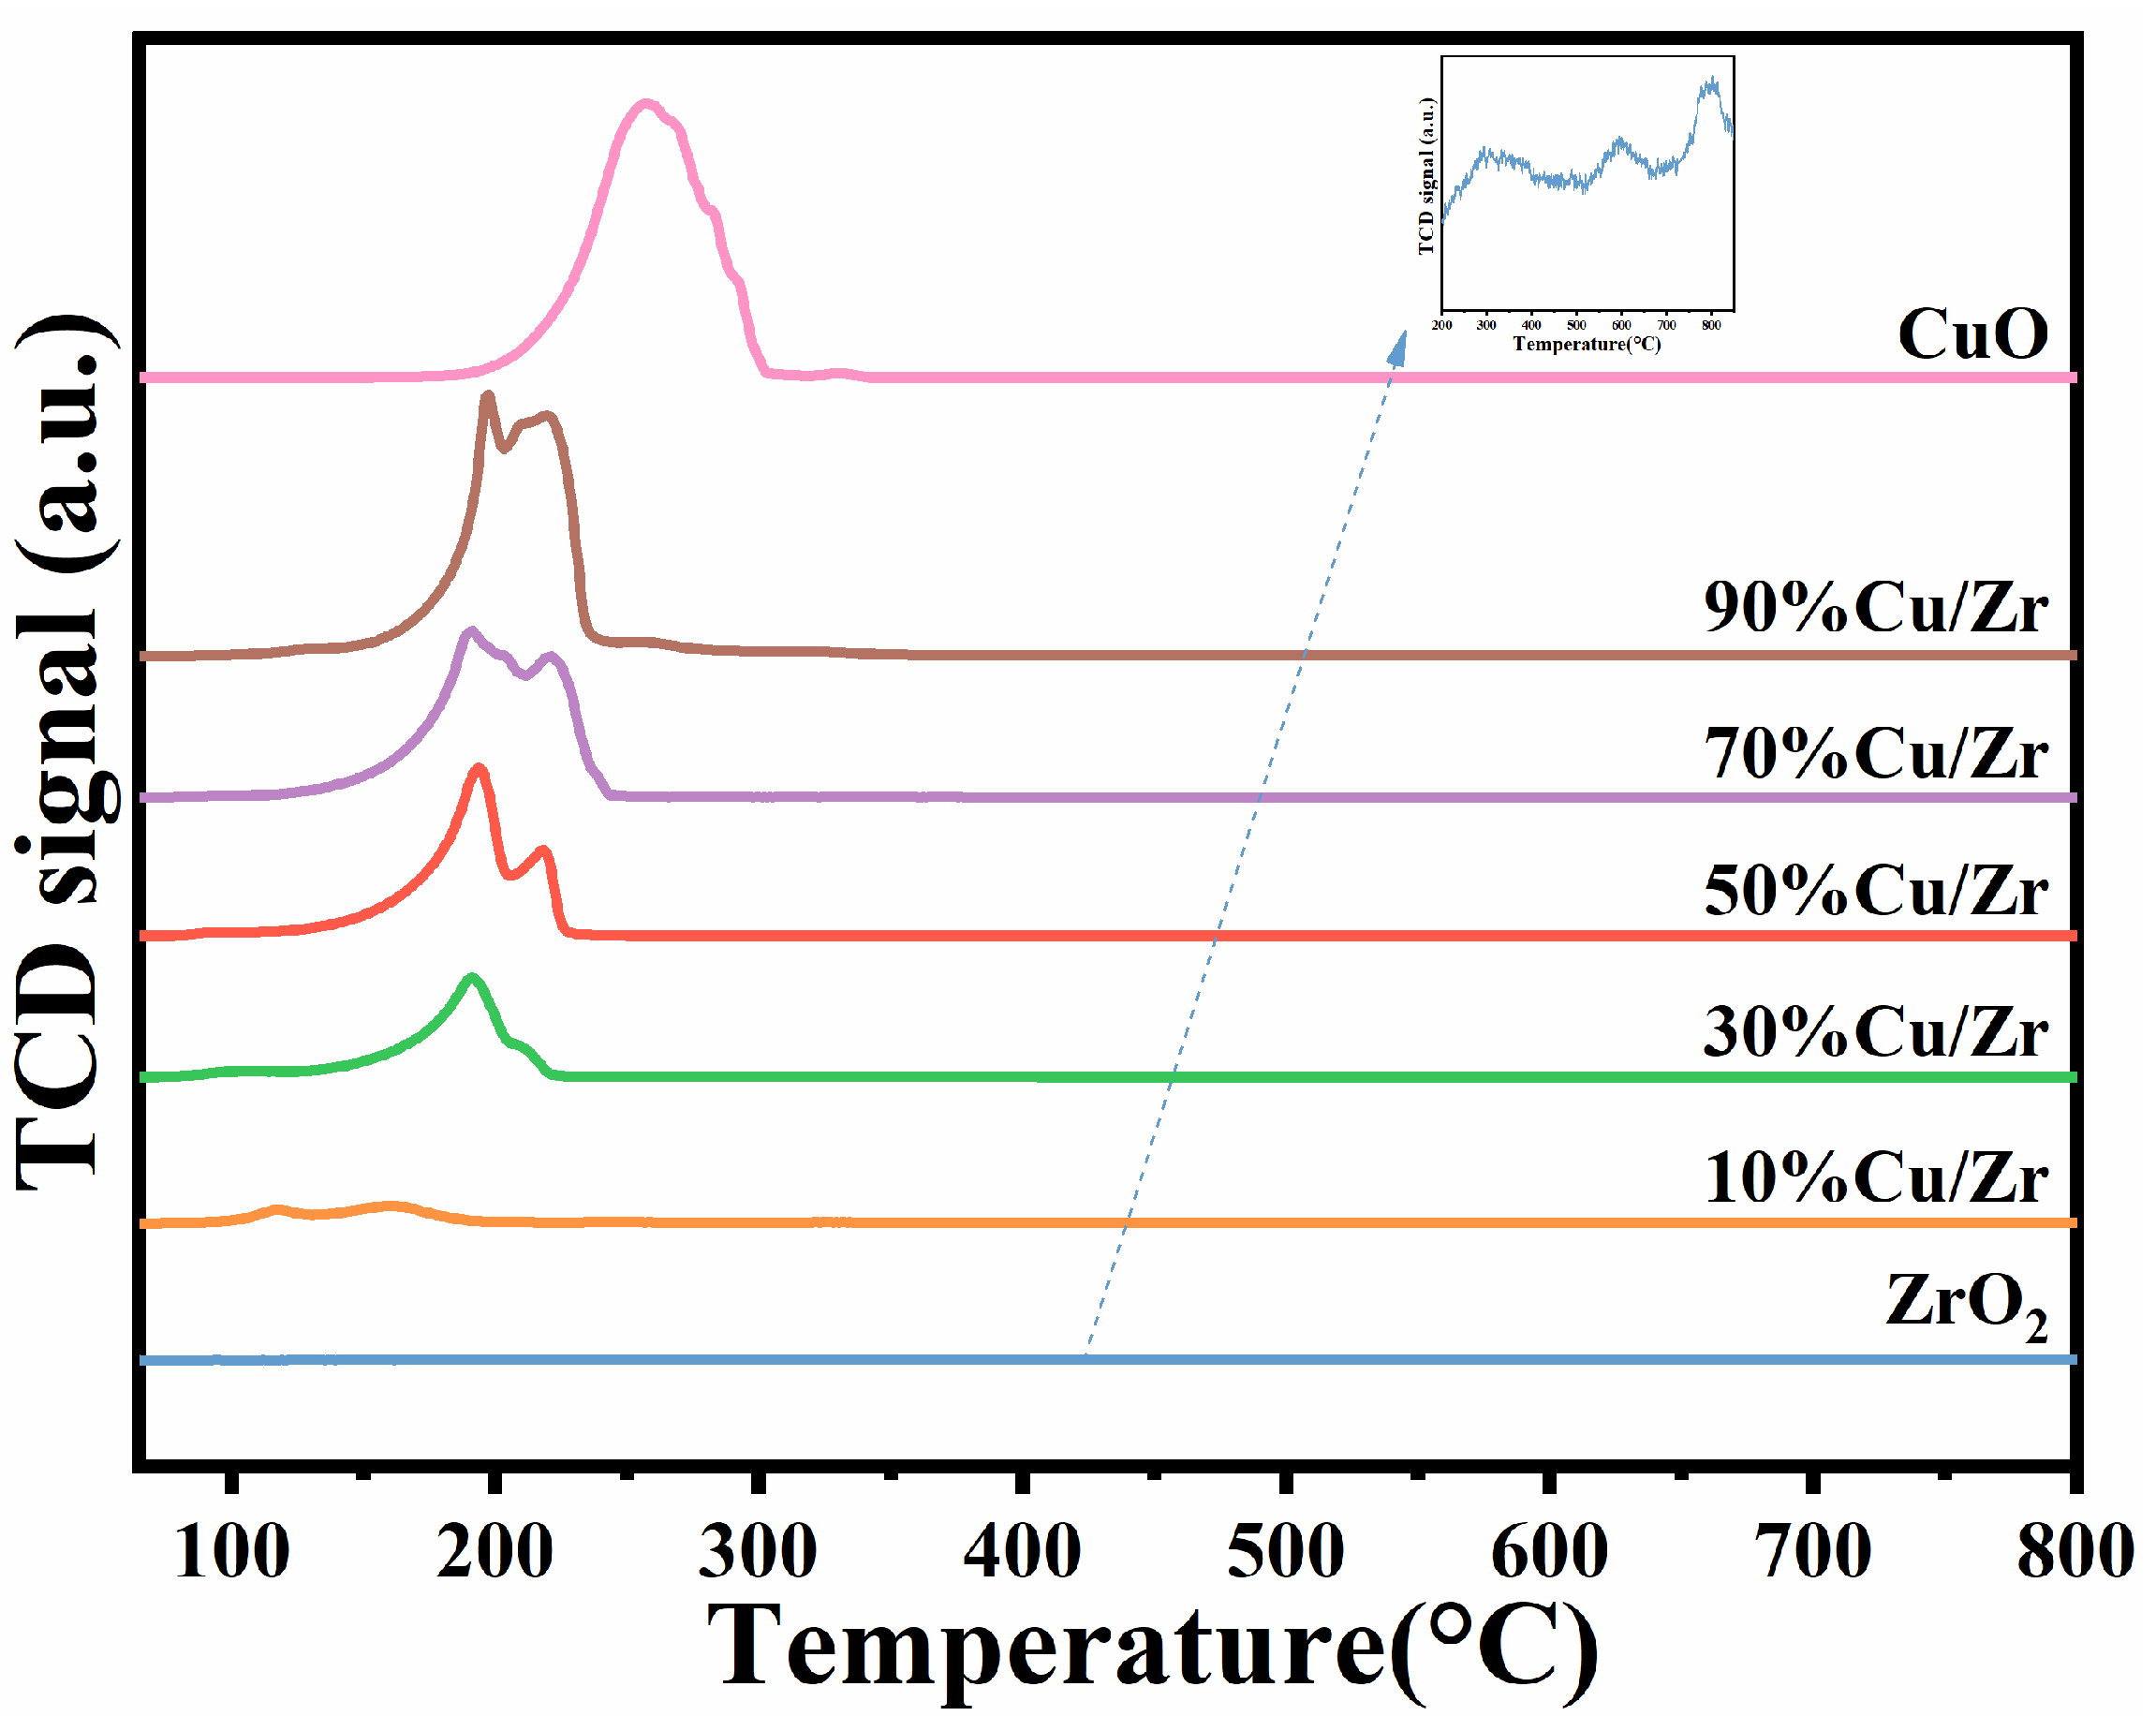
Figure 8 shows the H2-TPR curves of the ZrO2, CuO/ZrO2, and CuO catalysts, with the hydrogen consumption of the different catalysts given in Table 3. As depicted in Figure 8, ZrO2 exhibited three relatively weak reduction peaks, with significantly lower hydrogen consumption compared to CuO/ZrO2 and CuO catalysts. The CuO catalyst displayed a single broad reduction peak within the 185–302 °C range, whereas the H2-TPR profile of the CuO/ZrO2 catalyst revealed two distinct reduction peaks. According to the reference [30,36], the two reduction peaks observed in the H2-TPR profile of CuO/ZrO2 catalysts can be classified into low-temperature (117–197 °C) and high-temperature (200–230 °C) regions. The low-temperature peak corresponds to a reduction in small-sized CuO particles, while the high-temperature peak is associated with a reduction in highly dispersed CuO species that strongly interact with ZrO2, as well as CuO species with weaker interactions. Compared to pure CuO catalysts, CuO/ZrO2 catalysts exhibit lower reduction temperatures, suggesting enhanced low-temperature catalytic activity. This improvement is attributed to ZrO2 facilitating CuO dispersion, therefore enhancing the reducibility of CuO species [42]. Among the CuO/ZrO2 catalysts with varying Cu/Zr ratios, the composite catalyst with 10%Cu/Zr exhibited the lowest reduction temperature. This can be attributed to the smaller CuO grains at this doping level, which are more uniformly and easily dispersed on the ZrO2 surface. As CuO doping increased, the reduction temperature progressively rose, correlating with the growth of CuO grain size. This trend suggests that higher Cu/Zr doping levels significantly impact CuO dispersion, while the weakening interactions between CuO and ZrO2 reduce the catalyst’s oxidizability. Furthermore, the results indicate a gradual increase in hydrogen consumption with higher CuO doping levels.
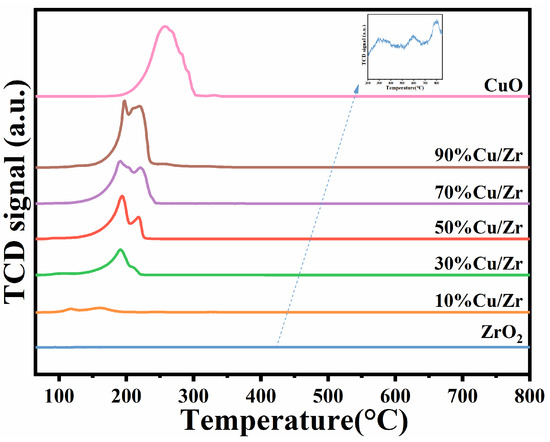
Figure 8.
H2-TPR profiles of ZrO2, CuO/ZrO2, and CuO catalysts.
Table 3.
H2 consumption amounts of ZrO2, CuO/ZrO2, and CuO catalysts.
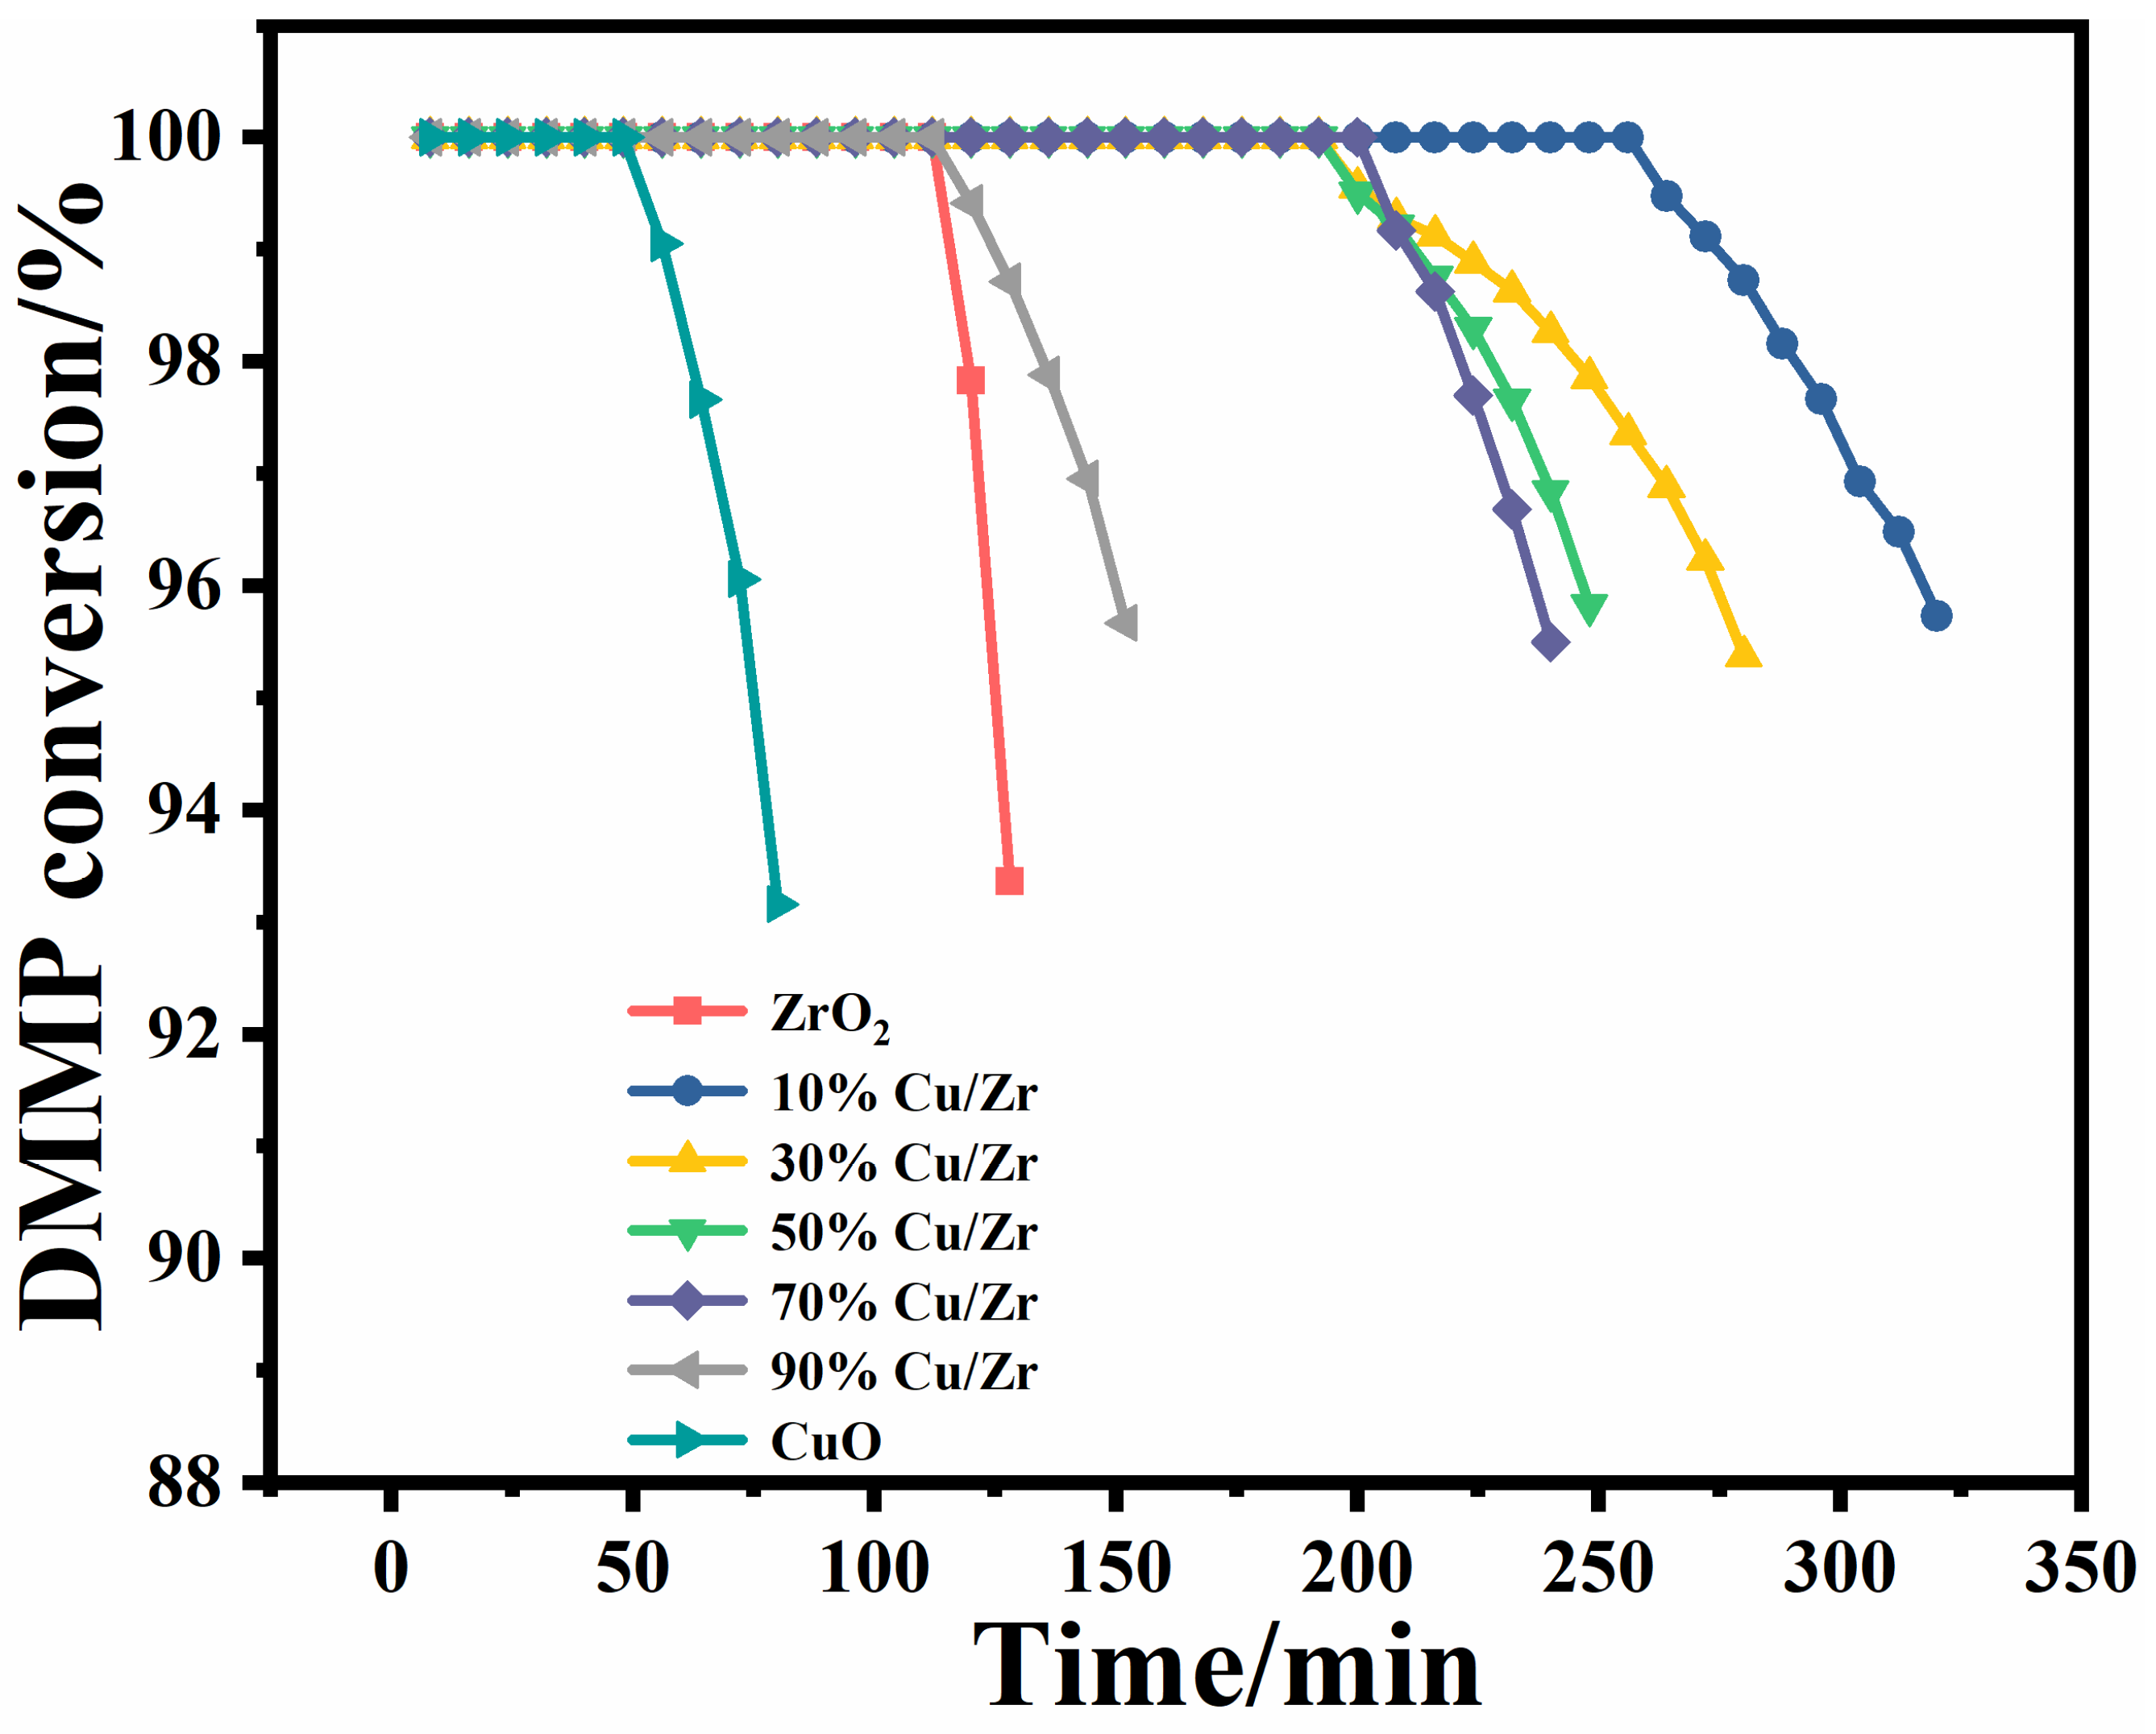
The protection time is a core determinant for assessing the catalysts’ performance for thermocatalytic DMMP decomposition [18]. The protection times of the seven catalysts are shown in Figure 9 and Table 4. The protection times of the catalysts followed a descending order: 10%Cu/Zr (272 min) > 30%Cu/Zr (220 min) > 50%Cu/Zr (212 min) > 70%Cu/Zr (208 min) > 90%Cu/Zr (124 min) > ZrO2 (116 min) > CuO (56 min). The CuO/ZrO2 catalysts demonstrated significantly longer protection times than ZrO2 and CuO alone, highlighting the role of Cu-Zr interactions in promoting DMMP decomposition. Among these, the 10%Cu/Zr catalyst exhibited the longest protection time, though this duration gradually declined with increasing CuO loading.
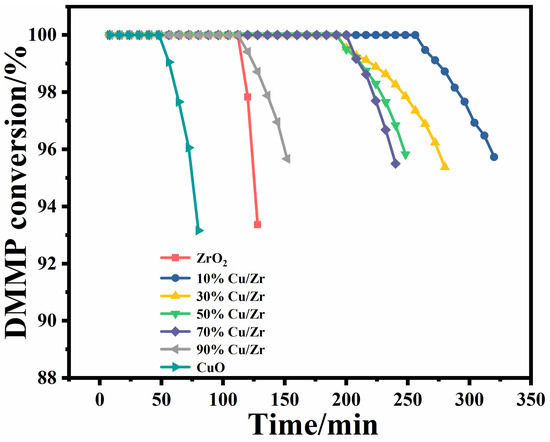
Figure 9.
Conversion rates over time of CuO/ZrO2 composite catalysts for thermocatalytic decomposition of DMMP.
Table 4.
Specific surface area, filling quality, and protective performance parameters of CuO/ZrO2 composite catalysts.
Given the considerable variation in catalyst mass due to differences in CuO content, the performance was further evaluated using mass-specific treatment capacity (MSTC) and surface-area-specific treatment capacity (SSTC). These parameters were calculated based on loading capacity, SSA, protection time, volumetric air velocity, and initial concentration. As summarized in Table 4, MSTC decreased with higher CuO doping, with 10%Cu/Zr achieving the highest MSTC. SSTC, on the other hand, exhibited a general increasing trend. Table 5 offers a comparative analysis of the protection times reported in the current study with the previously published literature on DMMP degradation.
Table 5.
A comparative analysis of protection time while using different catalysts.
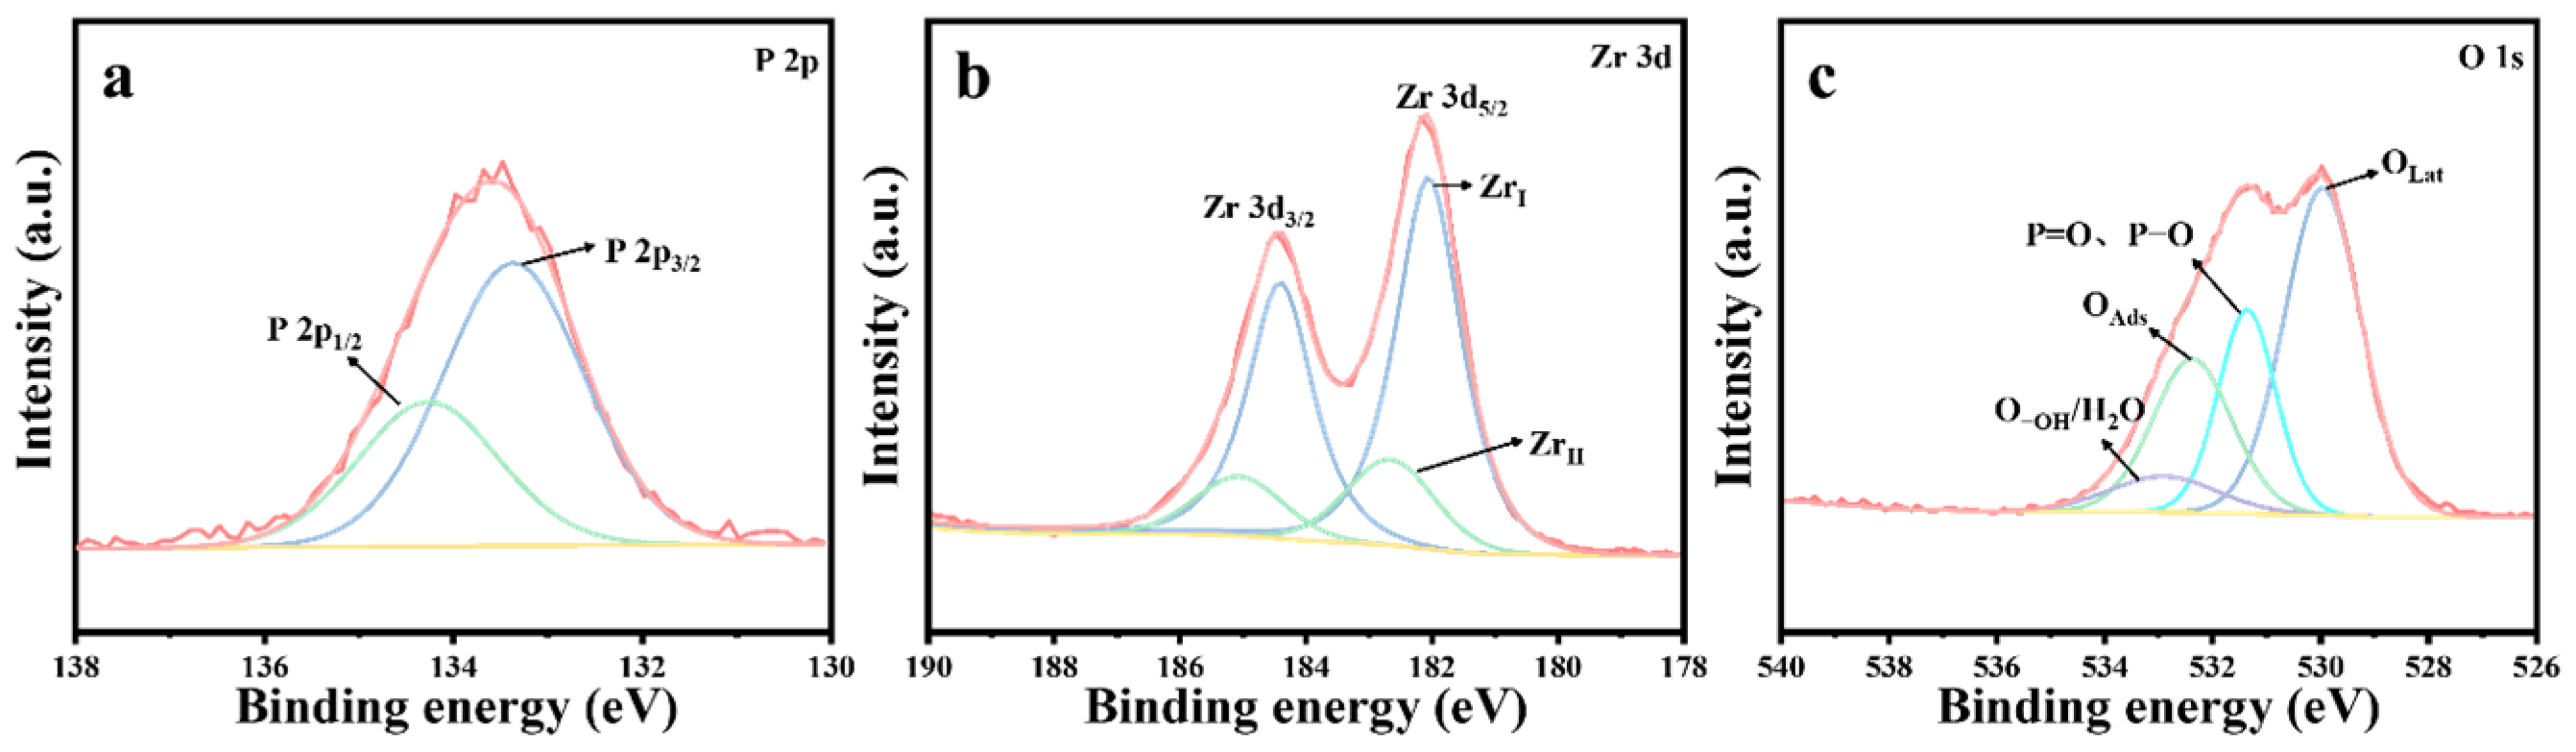
ZrO2, CuO, and 10%Cu/Zr catalysts with the longest protection time were chosen for elucidating the thermocatalytic decomposition mechanism of DMMP. The solid by-products of the catalytic reaction were initially analyzed. Upon reaching the protection time of the materials, XPS tests were conducted on the post-reaction ZrO2, CuO, and 10%Cu/Zr catalysts, with the results shown in Figure 10, Figure 11 and Figure 12. Figure 10 shows the XPS spectra of ZrO2 catalysts after reaction. As illustrated in Figure 10a, a distinct P 2p peak is observed on the catalyst surface after the reaction, indicating that the deactivated catalyst is covered with P species. Peak fitting of the P 2p region revealed two peaks at 134.3 and 133.4 eV, which are attributed to P=O and P-OH [45]. The Zr 3d XPS spectra of the reacted ZrO2 catalysts are shown in Figure 10b, where the spectra were fitted to ZrI (182.1 eV) and ZrII species (182.7 eV) using the Gaussian–Lorentz function. It was observed that, compared to the freshly prepared ZrO2 catalysts, both the reacted ZrI and ZrII species shifted toward lower binding energies, with an increase in the proportion of ZrI species on the surface of the reacted catalyst. Furthermore, the O 1s XPS spectrum of the reacted ZrO2 catalyst is presented in Figure 10c. The O 1s spectrum was fitted into four peaks, corresponding to lattice oxygen (OLat), P=O, P-O, adsorbed oxygen (OAds), and adsorbed water/hydroxyl oxygen (O-OH/H2O) [46]. The percentage of lattice oxygen species before and after the catalytic reaction was determined through fitting calculations, as presented in Table 6. The freshly prepared ZrO2 catalysts exhibit a higher proportion of OLat compared to the deactivated catalysts after the reaction, indicating that a significant amount of lattice oxygen was consumed during the thermocatalytic decomposition of DMMP.
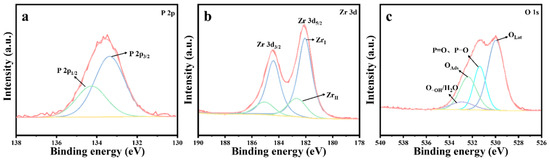
Figure 10.
XPS spectra of ZrO2 catalysts following the completion of reaction: (a) P 2p, (b) Zr 3d, and (c) O 1s.
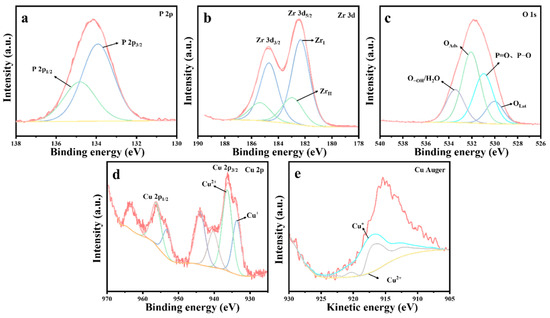
Figure 11.
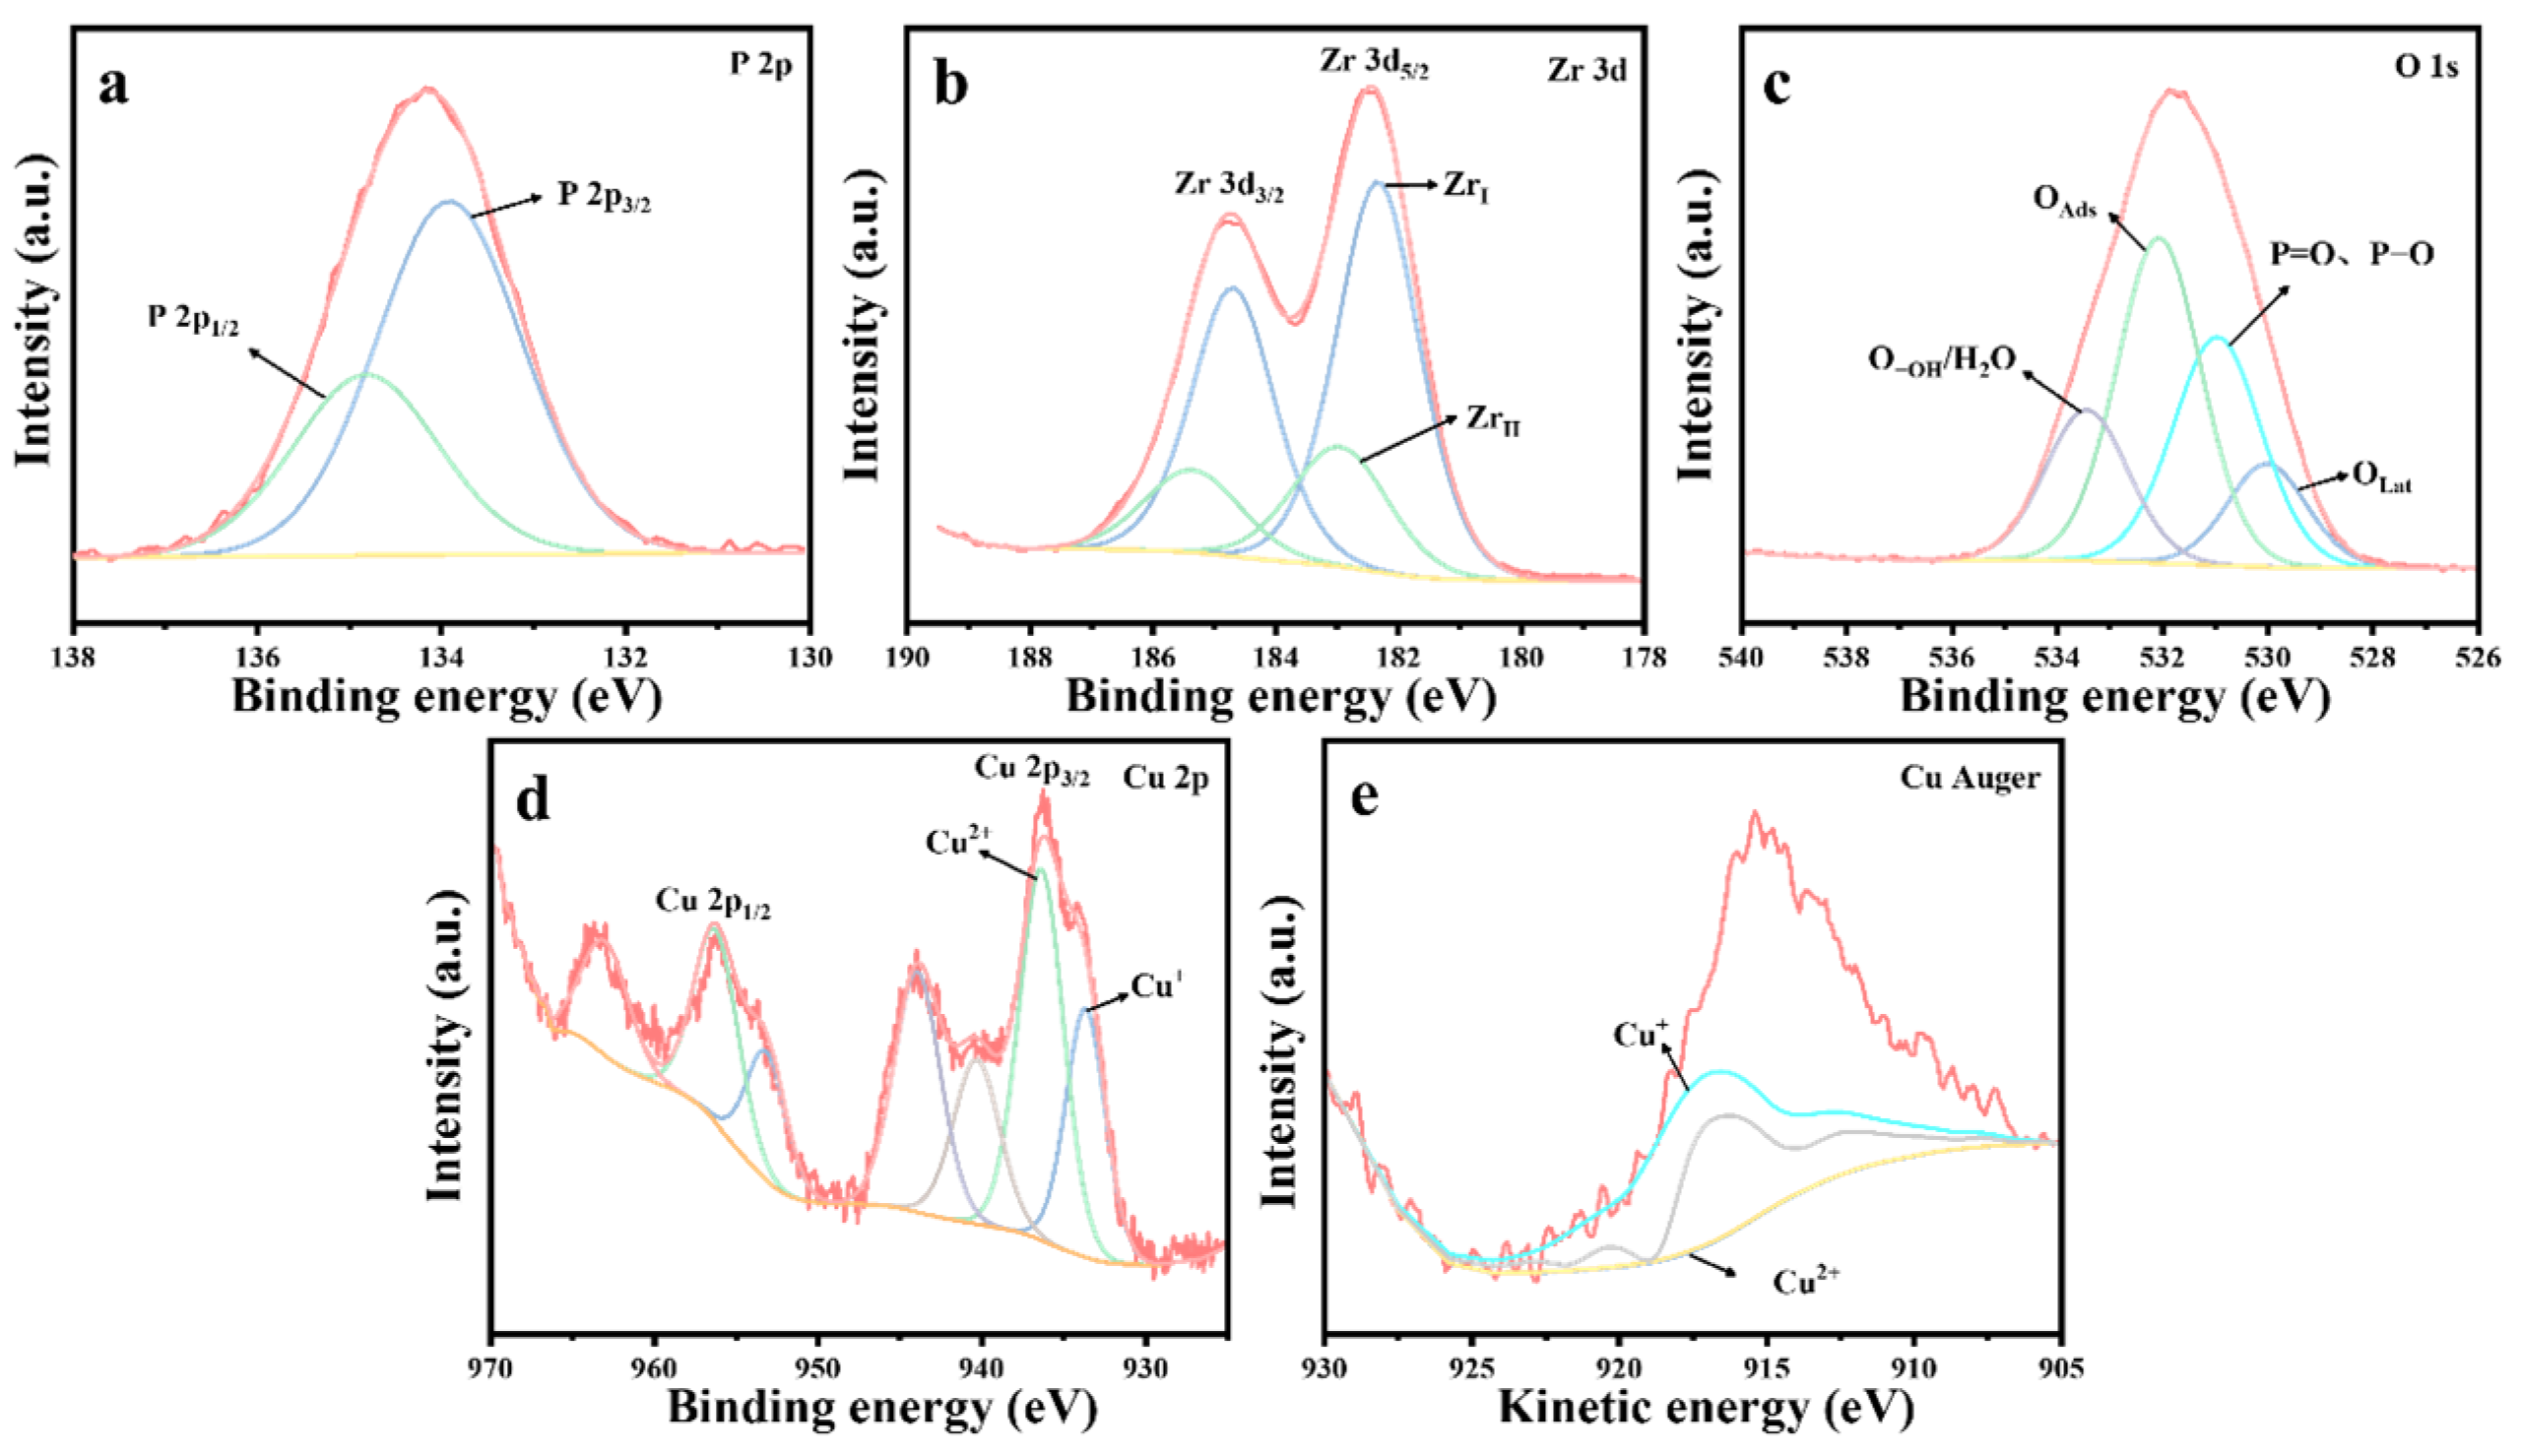
XPS spectra of 10%Cu/Zr catalysts after reaction: (a) P 2p, (b) Zr 3d, (c) O 1s, (d) Cu 2p, and (e) Cu Auger.
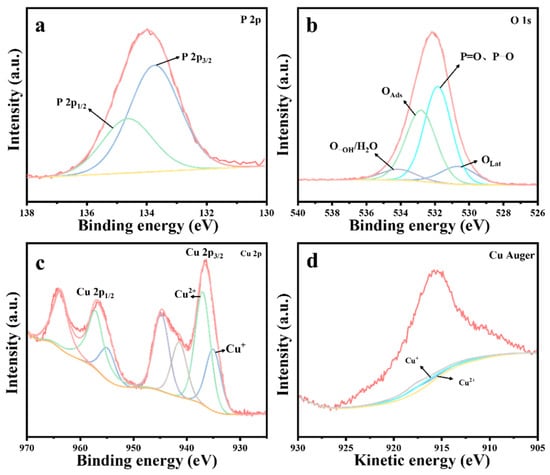
Figure 12.
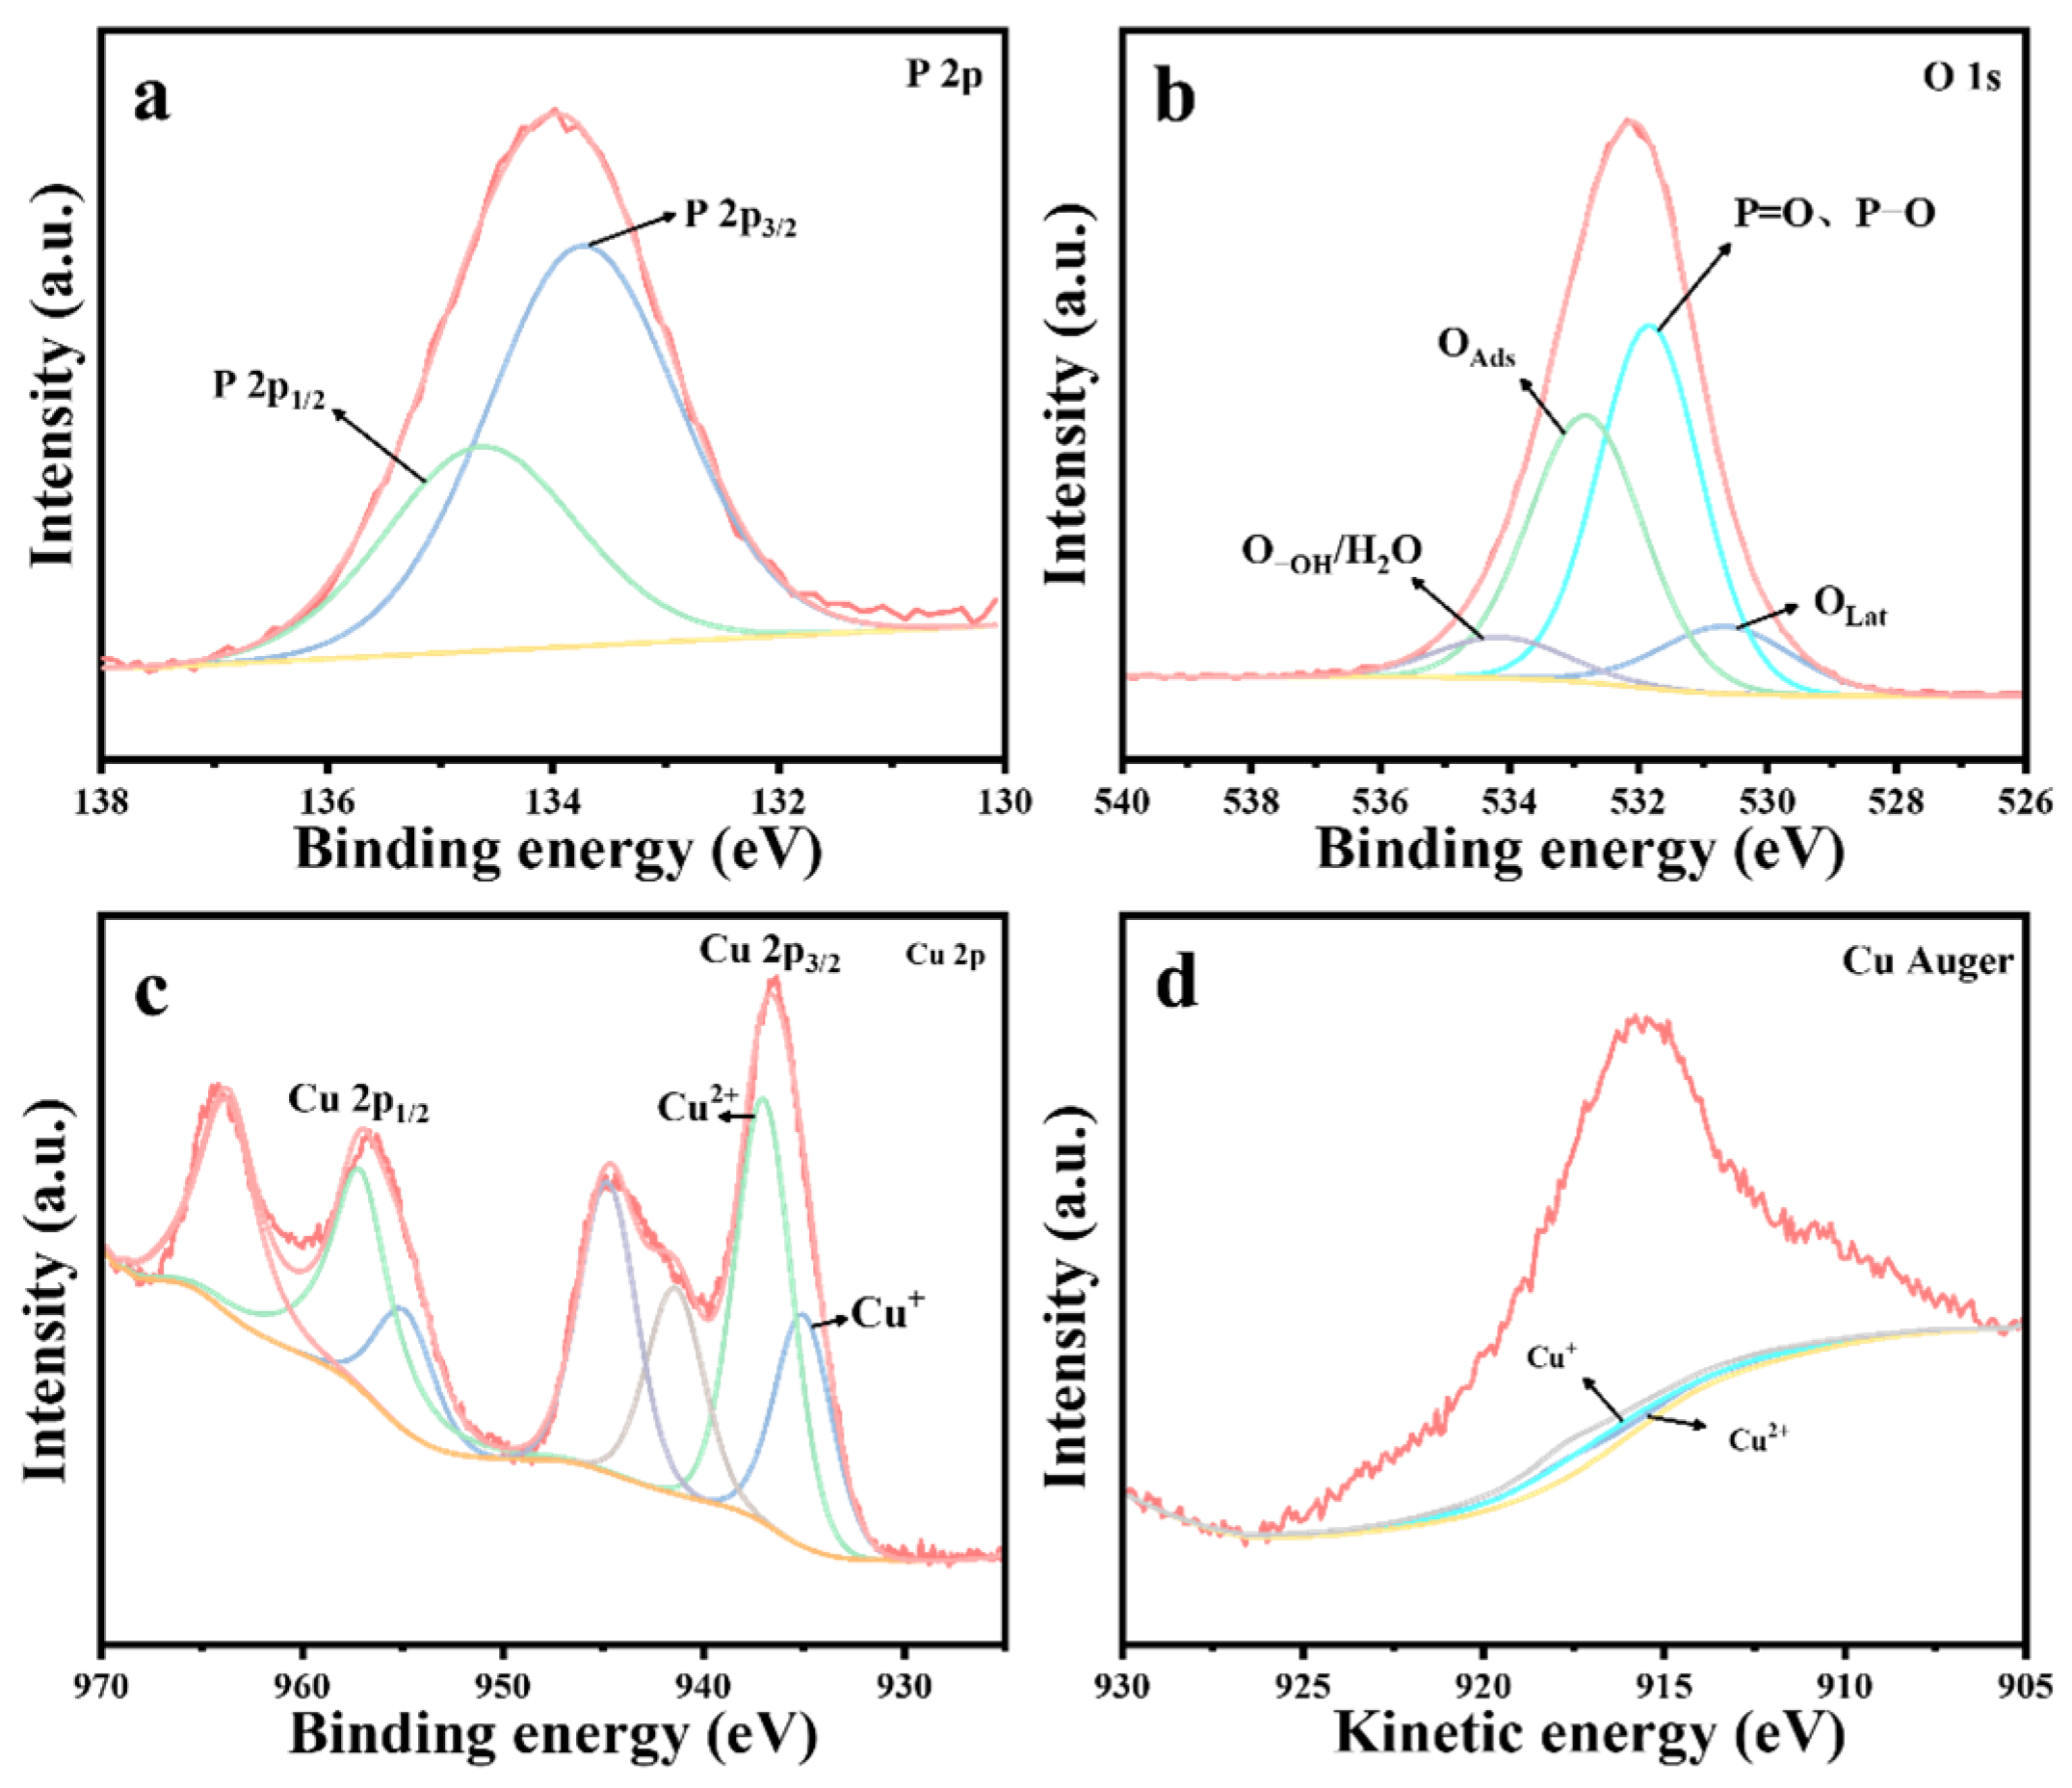
XPS spectra of CuO catalysts after reaction: (a) P 2p, (b) O 1s, (c) Cu 2p, and (d) Cu Auger.
Table 6.
The proportion of ZrI, OLat, and Cu2+ in the thermocatalytic decomposition of DMMP before and after the reaction of catalysts.
Figure 11 presents the XPS spectrum of the 10%Cu/Zr catalyst following the reaction. The presence of a P 2p energy peak, evident in Figure 11a, confirms the existence of phosphorus-containing species on the surface of the catalyst. The Zr 3d spectral peaks, illustrated in Figure 11b, were fitted to ZrI (182.3 eV) and ZrII (183.0 eV) species, which exhibit a shift toward lower binding energies. The content of ZrI species is significantly higher compared to the freshly prepared 10%Cu/Zr catalyst, where ZrI (182.4 eV) and ZrII (183.9 eV) species are observed. The O 1s profile, shown in Figure 11c, was fitted to four peaks corresponding to lattice oxygen (OLat), P=O, P-O, adsorbed oxygen (OAds), and adsorbed water/hydroxy-oxygen (O-OH/H2O). The proportions of lattice oxygen species were calculated based on the fitting results, revealing a significant reduction in the OLat ratio on the catalyst surface following reaction deactivation. The Cu 2p spectrum in Figure 11d displays distinct 2p3/2 and 2p1/2 characteristic peaks, along with strong satellite peaks in the 938–948 eV range, indicating the presence of Cu2+ in the reacted catalyst. However, it remains inconclusive whether Cu+ and Cu0 are present, as the 2p3/2 binding energies of Cu+ and Cu0 are too close to be distinguished by the XPS spectra alone. To further investigate, the Auger spectra of Cu were analyzed. Figure 11e shows the Cu Auger spectrum, which was fitted using the nonlinear least squares method, confirming the presence of Cu+ in the 10%Cu/Zr catalyst after the reaction. The data following fitting calculations are summarized in Table 6. A comparison of the data prior to and following the reaction reveals an evident decrease in the proportion of Cu2+ in the catalyst, suggesting that Cu2+ was partially consumed during the catalytic reaction, while the content of Cu+ in the catalyst increased. This indicates that lattice oxygen has a crucial function in the catalytic oxidation and consumption of DMMP. The Cu+ species on the catalyst surface may interact with phosphorus-containing species, leading to the formation of copper salts that remain on the surface. The accumulation of these products results in an increase in Cu+ content, which subsequently hinders further electron transfer from Cu+ to ZrI species. It can thus be inferred that the formation of metal salt by-products disrupts the ZrII + Cu2+ ↔ ZrI + Cu+/Cu0 cycle, causing a significant reduction in the content of ZrII and Cu2+ species. As the by-products continue to accumulate, the catalysts become fully penetrated and inactivated, preventing the cycle reaction from proceeding to completion.
Figure 12 presents the XPS spectrum of the CuO catalyst after the reaction. As shown in Figure 12a, the appearance of P 2p energy peaks on the surface of the deactivated CuO catalyst following the thermocatalytic decomposition of DMMP confirms the presence of residual phosphorus-containing species. Similarly, XPS spectral fitting analysis (Figure 12b) identified the presence of lattice oxygen (OLat), adsorbed oxygen (OAds), adsorbed water/hydroxyl oxygen (O-OH/H2O), P=O, and P-O species. Furthermore, both Cu+ and Cu2+ species were detected in the catalyst (Figure 12c,d). A comparison of the catalyst before and following the reaction revealed a significant depletion of lattice oxygen, accompanied by an increase in Cu+ content and a corresponding decrease in Cu2+ content, as summarized in Table 6.
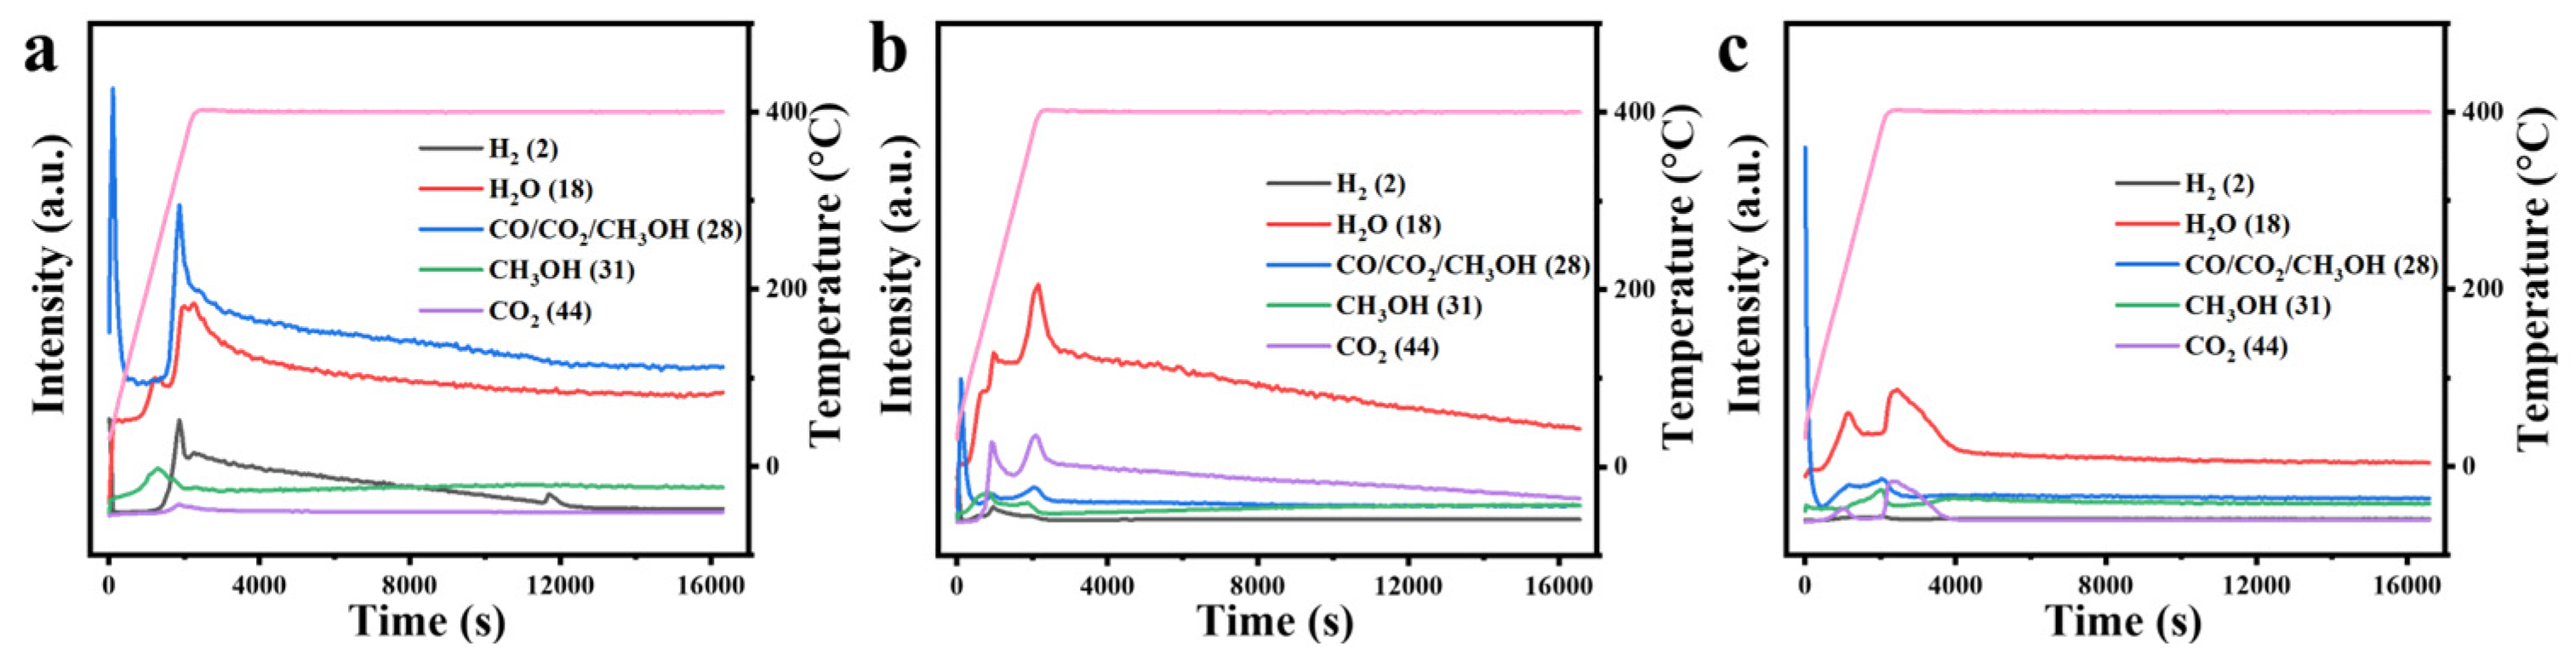
The gaseous products generated at different temperatures during the reaction were analyzed using a CATLAB microreaction system equipped with mass spectrometry. As shown in Figure 13, the exhaust gases from all three catalysts contained CH3OH, H2, CO2, and H2O. In the thermocatalytic decomposition of DMMP, the formation of H2 is primarily associated with the cleavage of C-H bonds [47]. For the ZrO2, CuO, and 10% Cu-Zr catalysts, the concentration of H2 initially increases with rising temperature before subsequently decreasing. This trend can be attributed to the enhanced cleavage of C-H bonds within the DMMP molecule at higher temperatures, which promotes H2 formation. However, at elevated temperatures, the decline in H2 concentration may result from the formation of other hydrogen-containing products, such as H2O, through secondary reactions. Similarly, the concentration of methanol increases and then decreases within a specific temperature range. This behavior can presumably be ascribed to the existence of hydroxyl moieties on the catalyst surface and the water generated during the reaction, both of which can act as nucleophilic agents, facilitating the replacement of the -OCH3 in DMMP and leading to CH3OH formation [17,48,49,50]. With increasing temperature, hydrolysis is enhanced, resulting in a rise in methanol concentration. However, at higher temperatures, the methanol concentration declines while CO2 levels increase, likely due to the oxidation of methanol to CO2. Furthermore, the gaseous products may include CO, as indicated by the charge-to-mass ratio of 28 in the mass spectrometry analysis. The presence of CO suggests incomplete oxidation, potentially caused by an insufficient oxygen supply during the catalytic process.
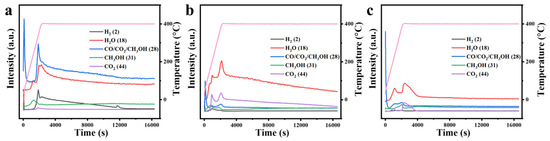
Figure 13.
Mass spectrometry analysis of exhaust gases from the thermocatalytic decomposition of DMMP using different catalysts: (a) ZrO2, (b) 10%Cu/Zr, and (c) CuO. The pink line represents the heating program curve.
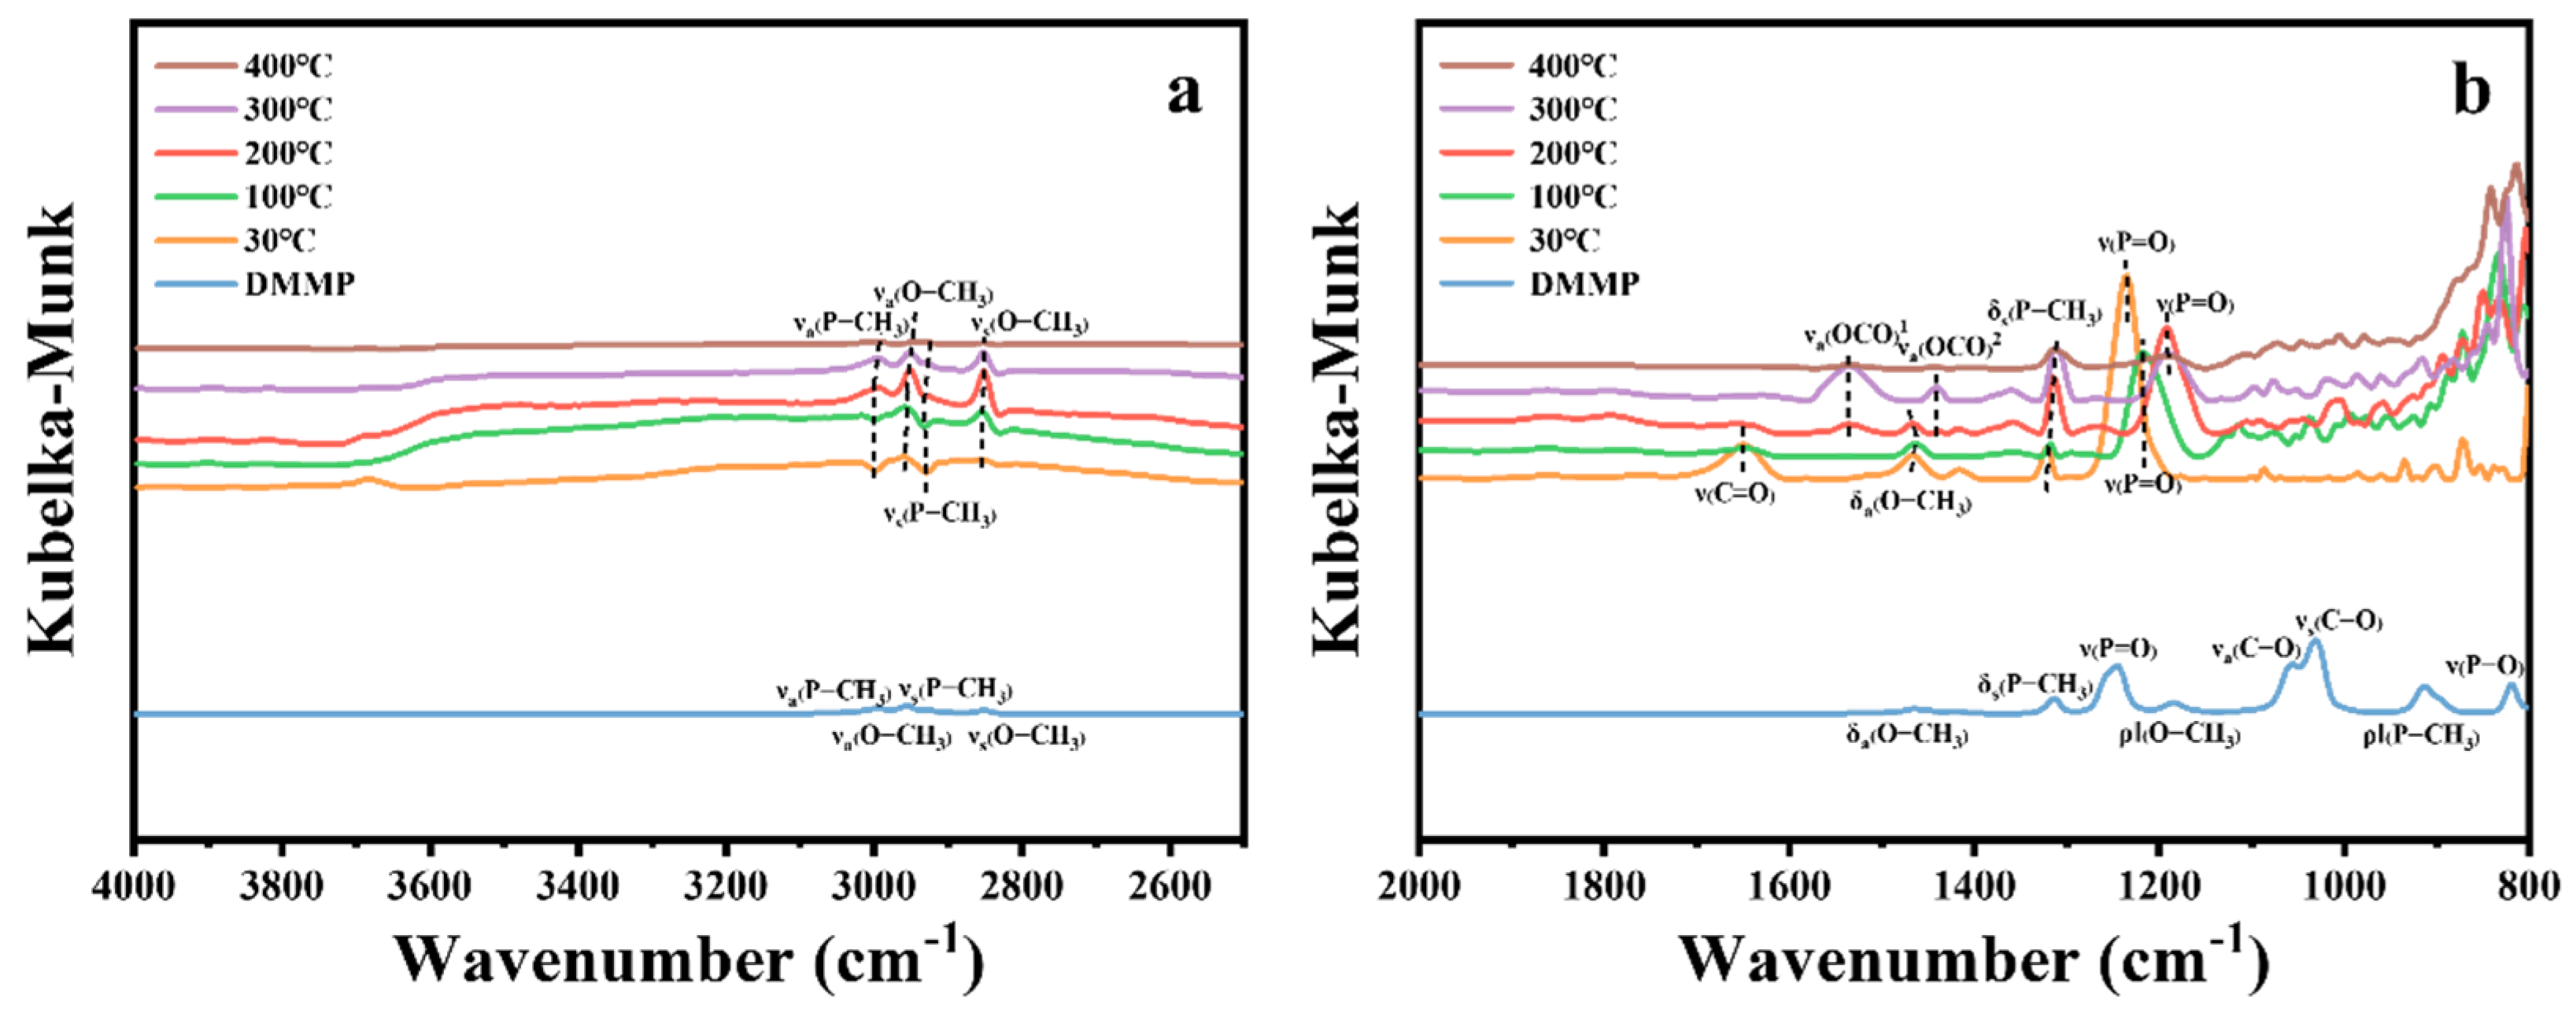
Table 7 presents the characteristic peak positions of DMMP. Figure 14 illustrates the in situ DRIFTS spectra of DMMP catalytic decomposition over ZrO2 hollow microsphere catalysts at various temperatures. In the high-frequency region of Figure 14a, the vibrational peaks corresponding to νa(P-CH3), νs(P-CH3), and νs(O-CH3) exhibit negative signals at 30 °C, which gradually weaken with increasing temperature and become positive at 200 °C. Further, the νa(O-CH3) vibrational peak intensifies positively from 30 °C to 200 °C, suggesting that DMMP undergoes adsorption on the ZrO2 surface at lower temperatures. As the temperature rises to 300 °C, the intensities of the νa(P-CH3), νs(P-CH3), νs(O-CH3), and νa(O-CH3) peaks begin to diminish, reaching their lowest levels at 400 °C. This behavior can be attributed to two possible factors: (1) the significant reduction in DMMP adsorption on ZrO2 at elevated temperatures, particularly beyond its boiling point, and (2) the onset of DMMP thermal decomposition at higher temperatures.
Table 7.
Infrared spectrum of DMMP molecules.
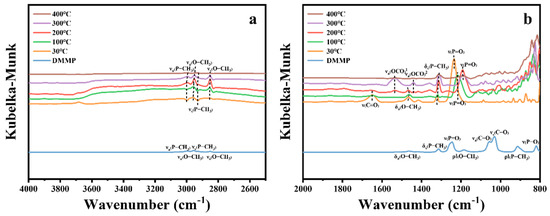
Figure 14.
In situ DRIFTS spectra of ZrO2 hollow microsphere surfaces under DMMP decomposition reactions at various temperatures. (a) High-frequency region. (b) Mid–low-frequency region.
In the low-frequency region of Figure 14b, the vibrational modes corresponding to δa(O−CH3), ρ‖(O−CH3), ρ‖(P−CH3), νa(C−O), νs(C−O), and ν(P−O) disappear at 400 °C, indicating the cleavage of the P–OCH3 bond in DMMP and the complete oxidation of methoxide. The δs(P–CH3) vibrational mode initially weakens, then intensifies, and subsequently weakens again as the reaction temperature increases, aligning with the trend observed in the high-frequency region. Similarly, the ν(P=O) peak at 1245 cm−1 shifts to a lower wavenumber with rising temperature and stabilizes beyond 200 °C. This suggests that DMMP molecules adsorb onto the Lewis acid sites of the ZrO2 catalyst and/or interact with surface hydroxyl groups to form hydrogen bonds [14,17,49]. The peak at 1648 cm−1 corresponds to the ν(C=O) vibrational mode of carbonate species [51], which diminishes as the temperature increases. However, starting from 200 °C, distinct vibrational peaks associated with the νa(O–C–O) mode of formate species appear on the catalyst surface [51]. The vibrational peaks within the 1200–800 cm−1 range arise from the phosphorus-containing compounds and carbon–oxygen reaction products [13,52].
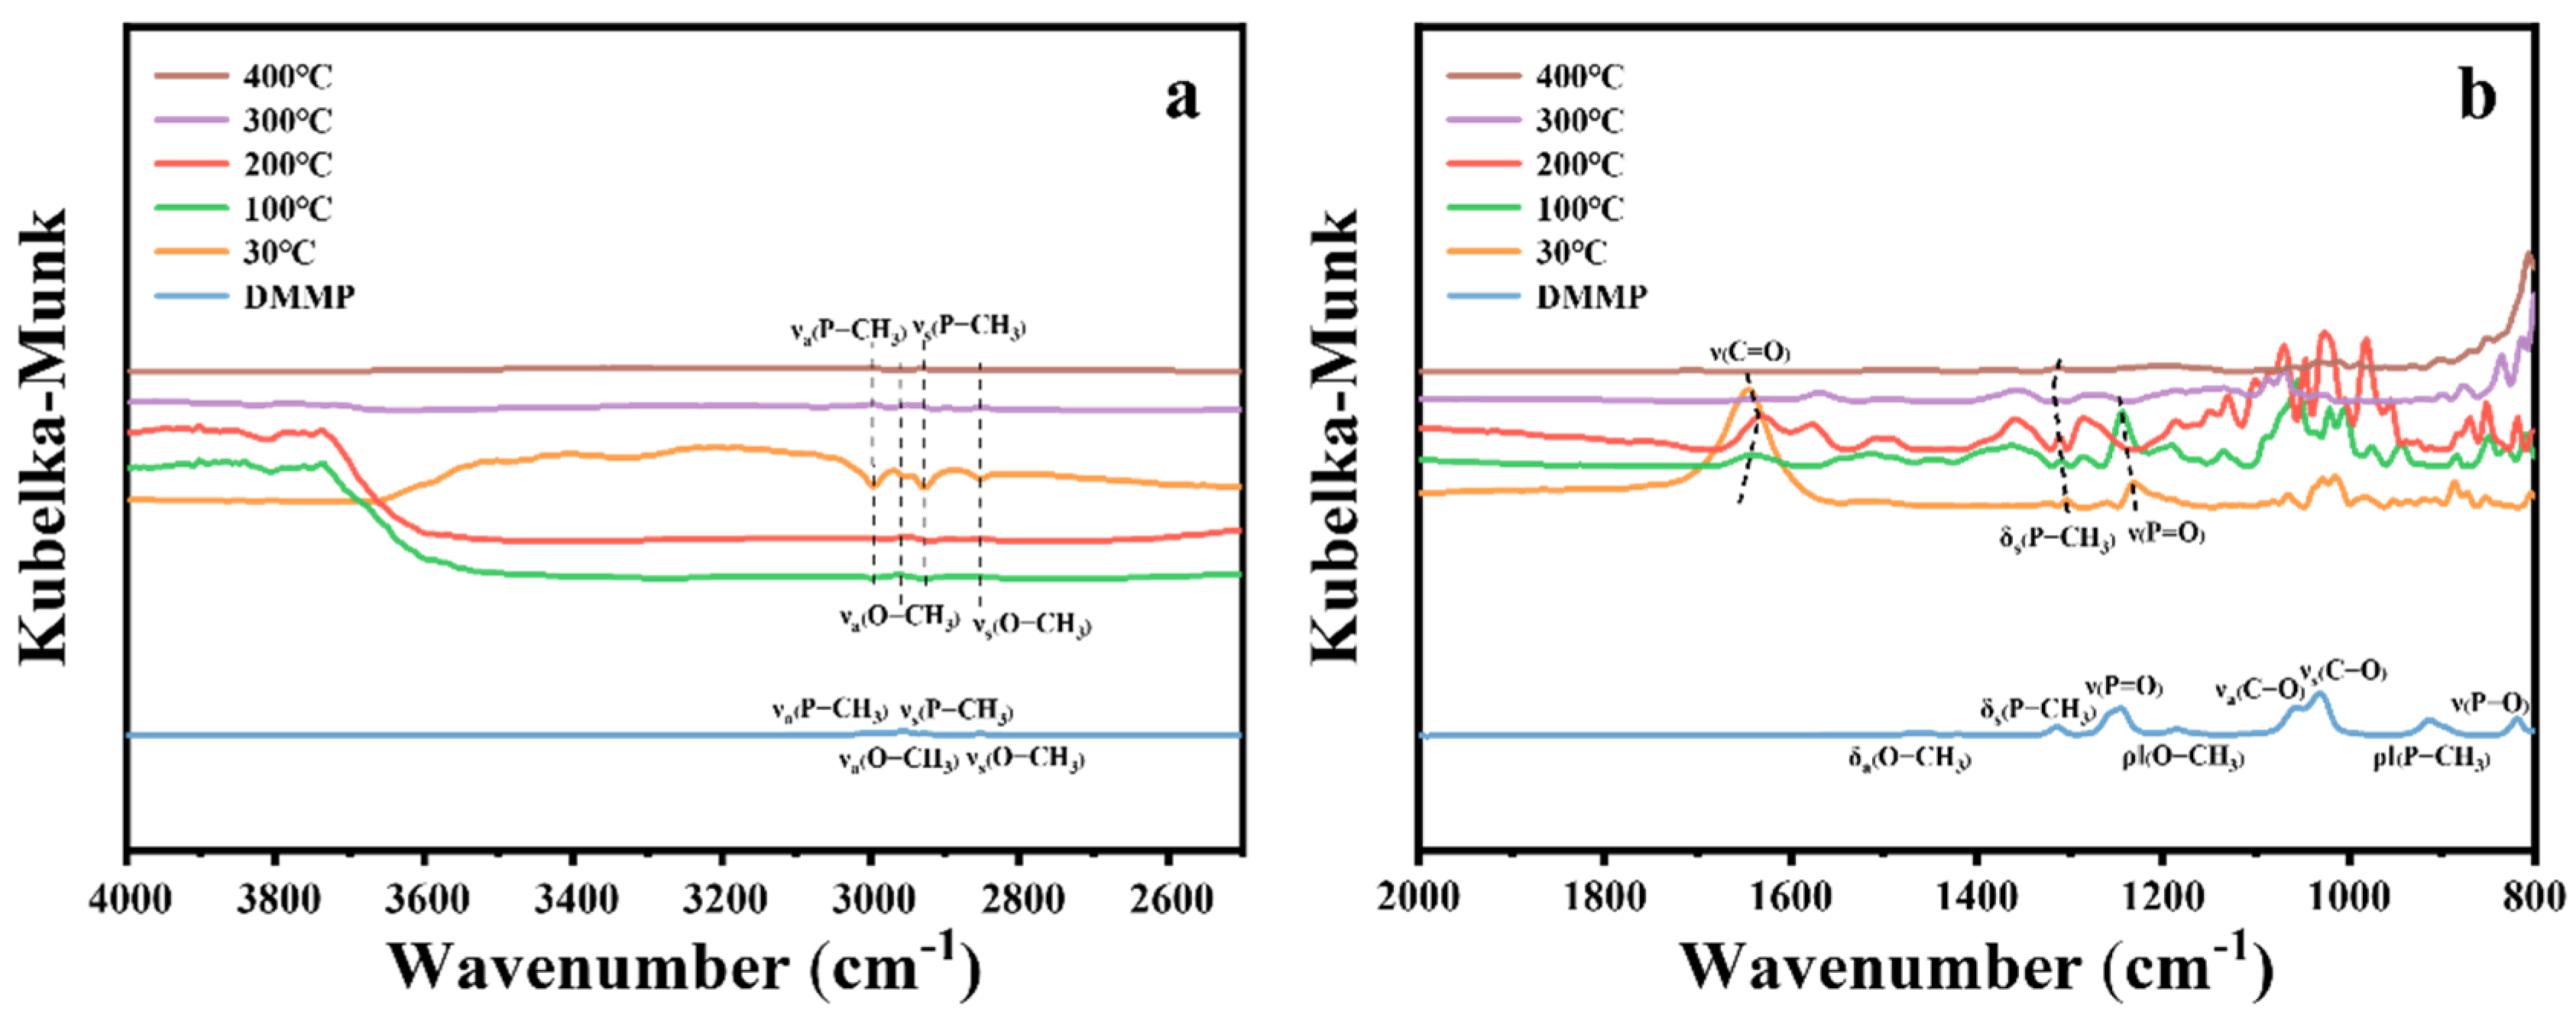
The in situ DRIFTS spectra of the 10%Cu/Zr catalyst at various temperatures during the catalytic decomposition of DMMP are presented in Figure 15. In the high-frequency region (Figure 15a), the vibrational peaks corresponding to νs(O–CH3), νa(O–CH3), νa(P–CH3), and νs(P–CH3) exhibit negative signals at 30 °C and gradually decrease with increasing reaction temperature. By 400 °C, the νs(O–CH3) and νa(O–CH3) peaks disappear, indicating the complete removal of methoxy groups.
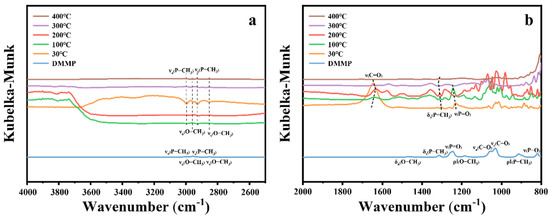
Figure 15.
In situ DRIFTS spectra of 10%Cu/Zr surfaces under DMMP decomposition reactions at various temperatures. (a) High-frequency region. (b) Mid–low-frequency region.
In the low-to-medium-frequency region (Figure 15b), the vibrational modes δa(O–CH3), ρ‖(O–CH3), νa(C–O), νs(C–O), and ν(P–O) are no longer detectable at 400 °C, confirming the elimination of methoxy groups and complete decomposition of DMMP. The ρ‖(P–CH3) mode also disappears at 400 °C, while δs(P–CH3) remains, suggesting that the P–CH3 bond is hard to cleave. The peak at 1648 cm−1, corresponding to the ν(C=O) vibrational mode [51], shifts to lower wavenumbers, weakens progressively, and eventually disappears as the temperature rises. The migration of the ν(P=O) peak to 1232 cm−1 at 30 °C suggests that DMMP molecules interact with the Lewis acid sites of the CuO/ZrO2 catalyst and/or form hydrogen bonds with surface hydroxyl groups [14,17,49]. The vibrational peaks observed in the 1200–800 cm−1 region correspond to phosphorus-containing and carbon–oxygen species formed during the reaction [13,52].
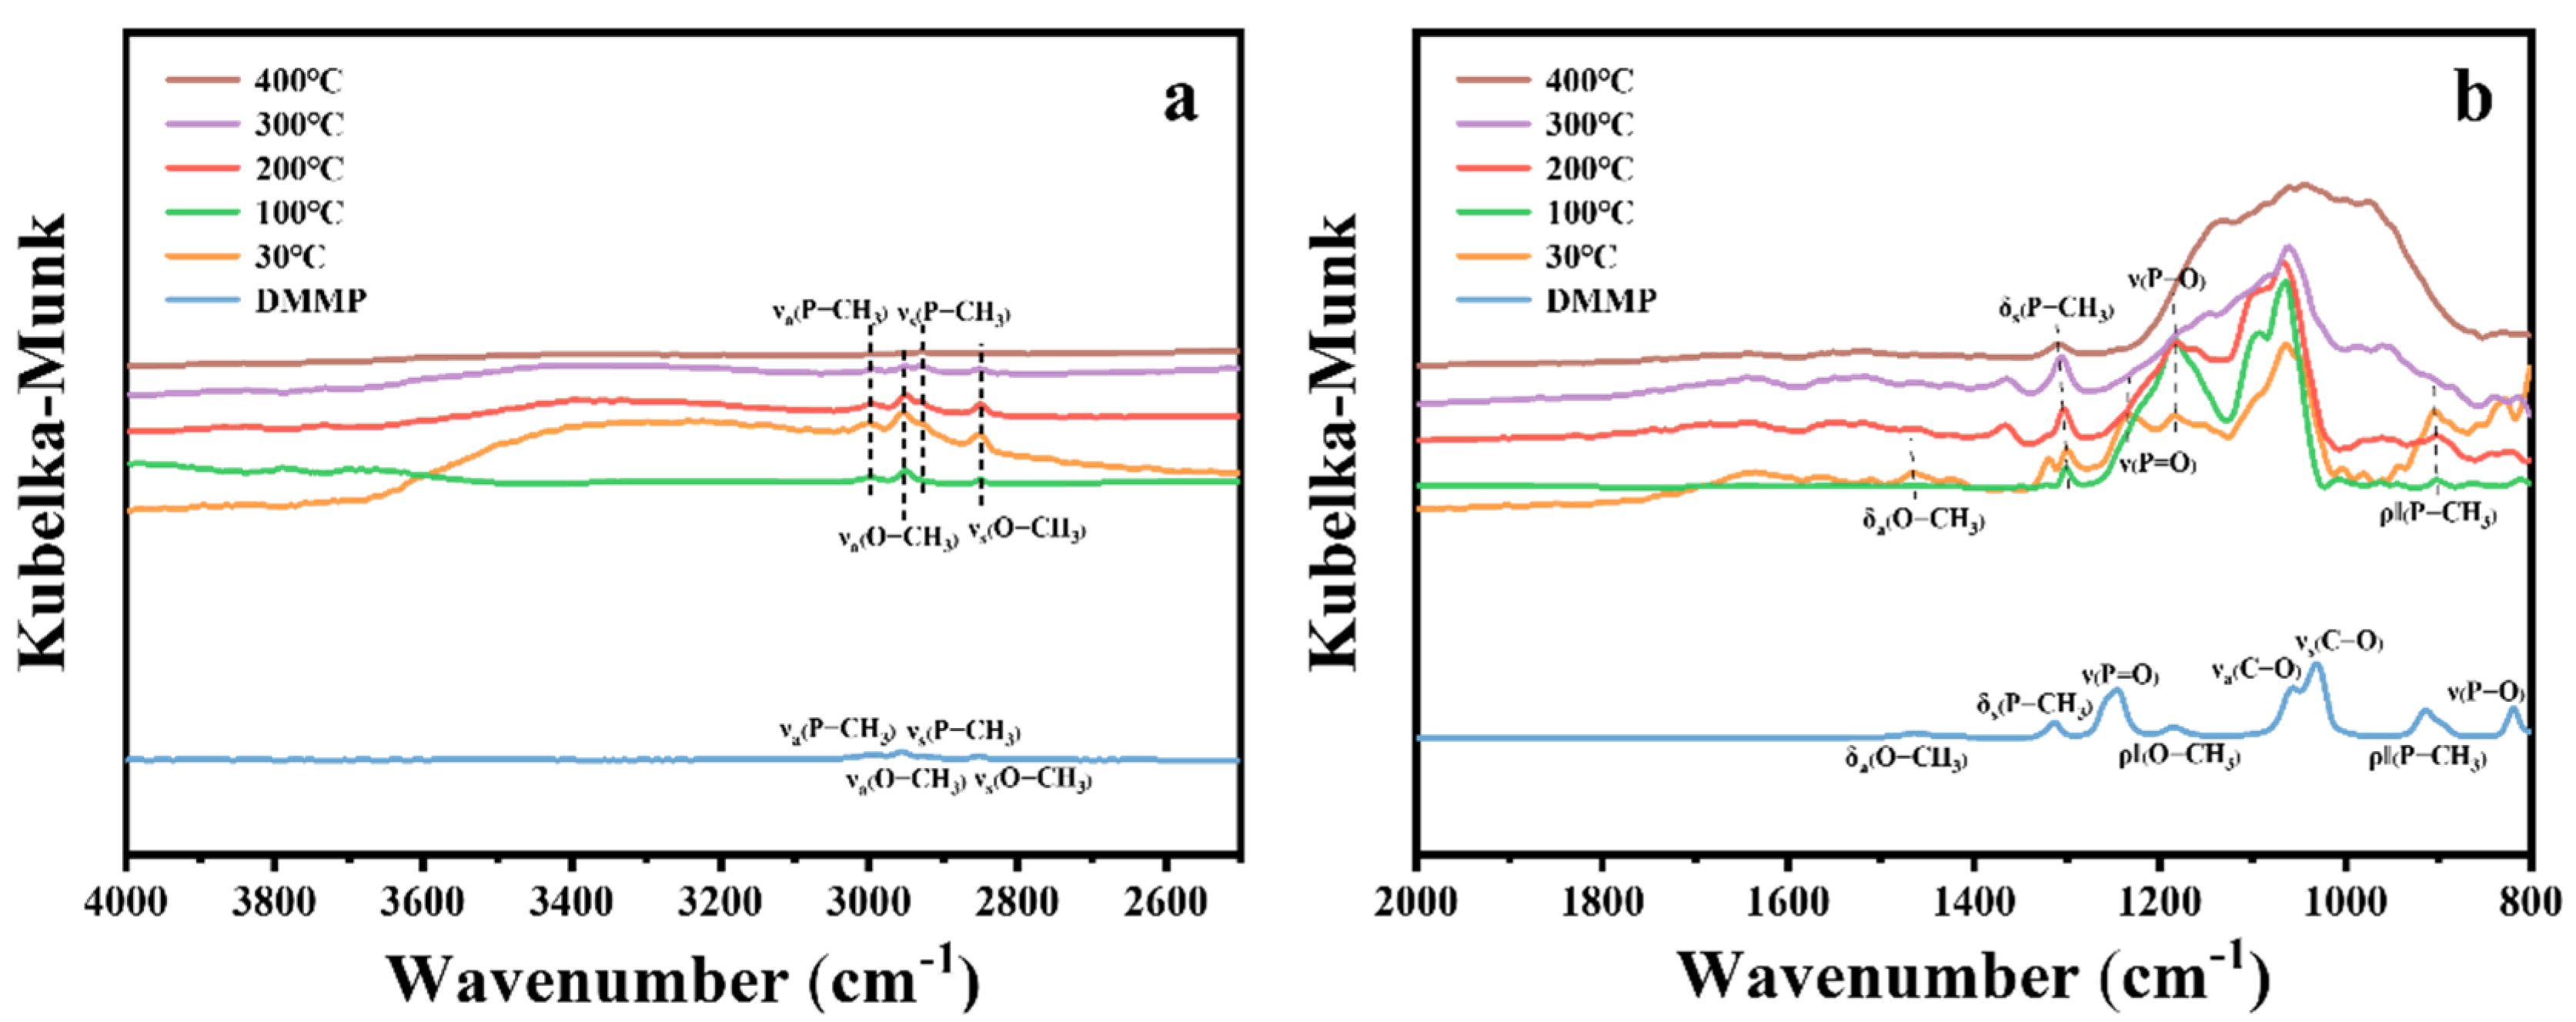
Figure 16 presents the in situ DRIFTS spectra of DMMP decomposition catalyzed by CuO at different temperatures. The figure shows that the intensities of the νa(P–CH3), νs(P–CH3), νa(O–CH3), and νs(O–CH3) peaks in the high-frequency region gradually decrease with increasing temperature, suggesting the progressive decomposition of DMMP. In the low-frequency region (Figure 16b), the δa(O–CH3), ρ‖(O–CH3), νa(C–O), νs(C–O), and ν(P–O) vibrational peaks disappear at 400 °C, indicating the complete oxidation of methoxy groups. The ρ‖(P–CH3) mode also vanishes at 400 °C, while δs(P–CH3) remains detectable, suggesting that the P–CH3 bond is more resistant to cleavage. The ν(P=O) vibrational mode disappears as early as 100 °C, indicating the cleavage of the phosphoryl bond. A broad set of overlapping peaks in the 1200–800 cm−1 region becomes more pronounced with increasing temperature, attributed to the generation of phosphorus-containing and carbon–oxygen species on the CuO surface [13,53].
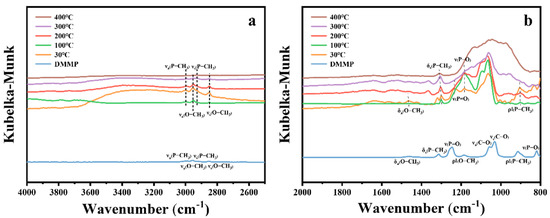
Figure 16.
In situ DRIFTS spectra of CuO surfaces under DMMP decomposition reactions at various temperatures. (a) High-frequency region. (b) Mid–low-frequency region.
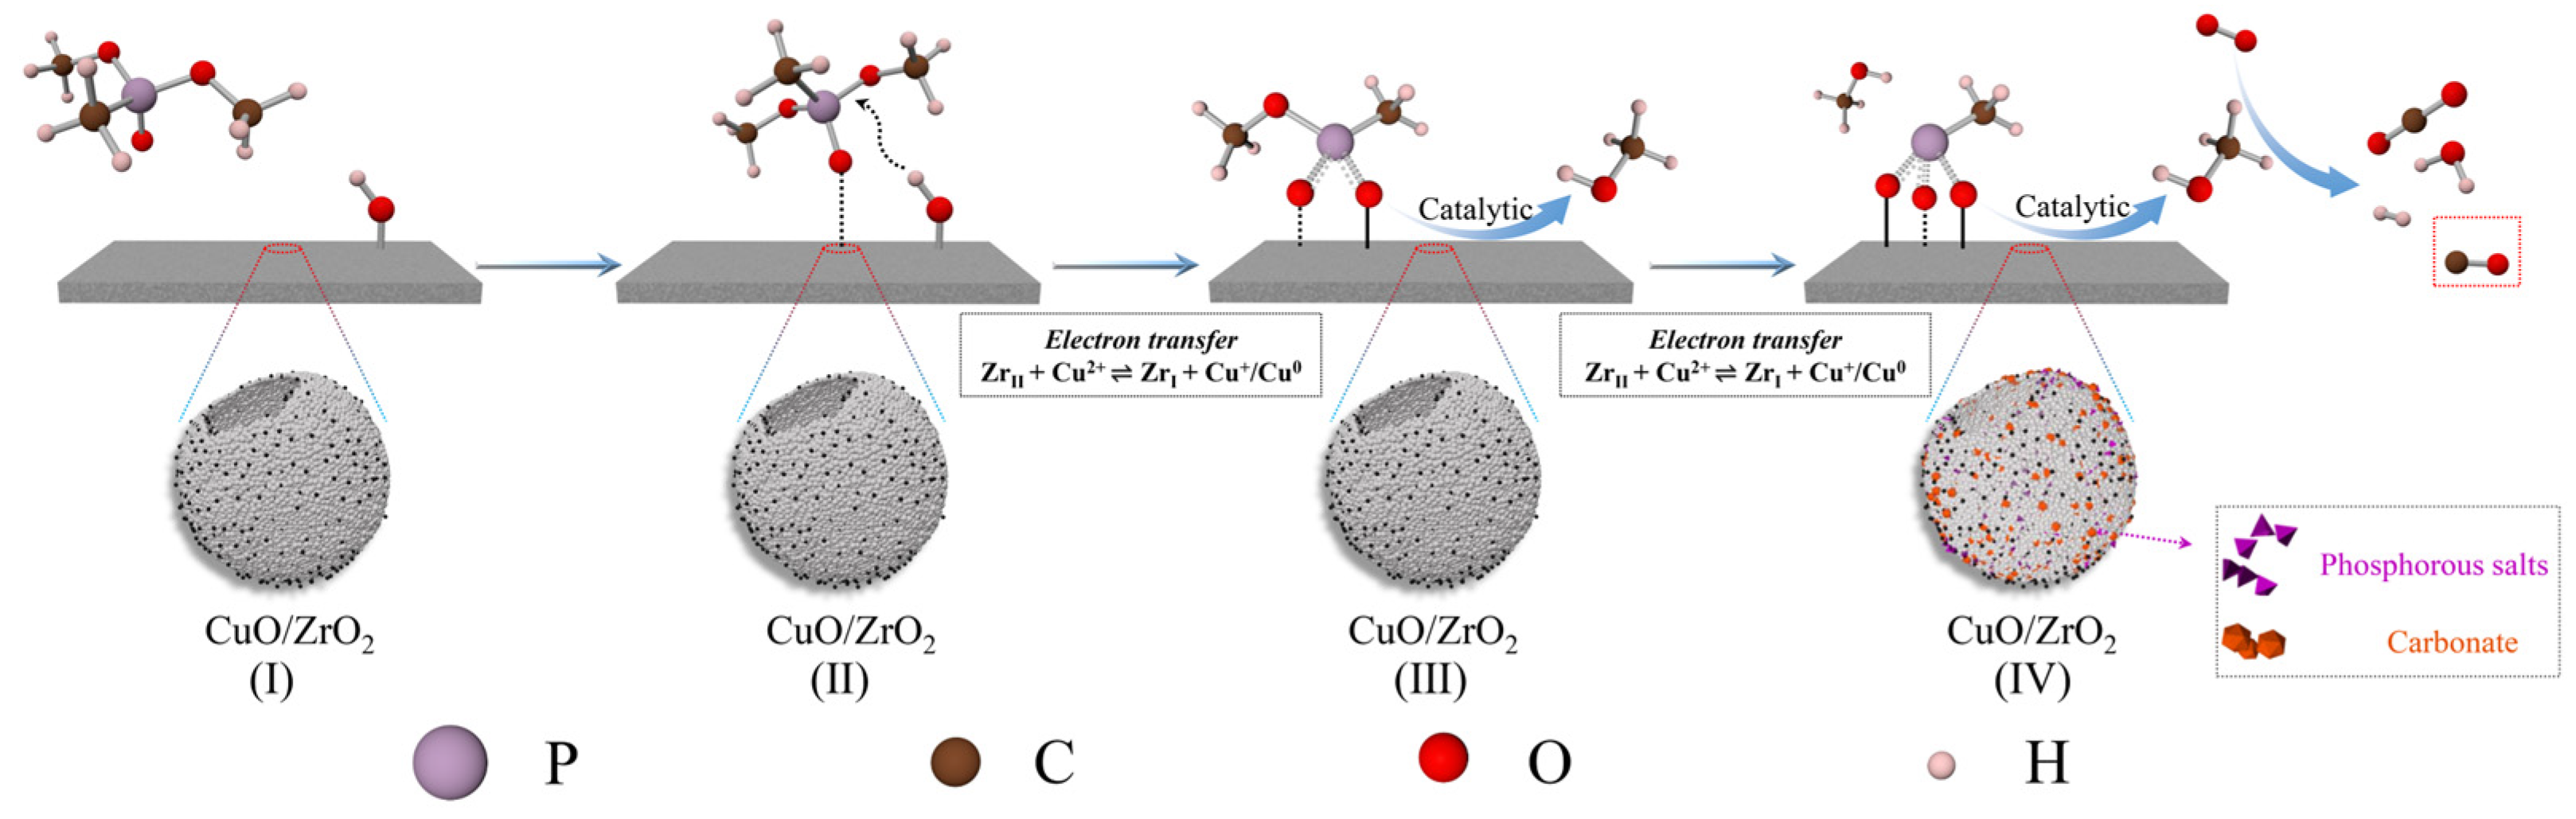
Based on the above analysis and the relevant literature, we propose that ZrO2, CuO, and CuO/ZrO2 catalysts follow similar catalytic decomposition pathways, as illustrated in Figure 17. Initially, DMMP molecules adsorb onto the Lewis acidic sites of the catalysts and/or interact with surface hydroxyl groups via H-bonding (step I). Subsequently, the hydroxyl groups on the catalyst surface sequentially replace the two methoxy groups in DMMP through nucleophilic substitution, leading to the formation of gaseous methanol and phosphorus-containing surface species (step II and III: C3H9O3P + CuO/ZrO2-OH → C2H6O3P-CuO/ZrO2 + CH3OH and C2H6O3P-CuO/ZrO2 + CuO/ZrO2-OH → CH3O3P-CuO/ZrO2 + CH3OH). Methanol then undergoes further oxidation and decomposition, generating CO2, CO, and H2O. Methanol can also react with hydroxyl groups or lattice oxygen on the catalyst surface, producing various carbon–oxygen by-products (step IV: CH3OH + O2 → CO2/CO + H2O + H2). Unlike pure ZrO2 and CuO, the CuO/ZrO2 catalyst benefits from the synergistic interaction between Cu and Zr, which facilitates electron transfer and enhances oxygen mobility. This improved oxygen transfer further promotes oxidative cycling reactions, contributing to more efficient catalytic decomposition.
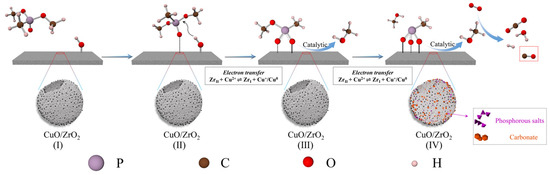
Figure 17.
Proposed mechanism for DMMP decomposition.
4. Conclusions
In this study, ZrO2, CuO, and CuO/ZrO2 composite catalysts with varying Cu/Zr ratios (10%, 30%, 50%, 70%, and 90%) were successfully synthesized using the hydrothermal method and a secondary hydrothermal method, respectively. Their thermocatalytic decomposition performance, reaction mechanism, and deactivation processes for DMMP were systematically investigated. Among the evaluated catalysts, CuO/ZrO2 composite catalysts with different loading ratios demonstrated superior protection time against DMMP compared to single-component catalysts. The 10%Cu/Zr composite exhibited the longest protection time for DMMP thermocatalytic decomposition, reaching 272 min. This enhanced performance was attributed to efficient electron transfer between Zr and Cu species (ZrII + Cu2+ ↔ ZrI + Cu+/Cu0), which facilitated the transfer of reactive oxygen species. The synergistic interaction between Cu and Zr further improved catalytic efficiency. The decomposition process over CuO, 10%Cu/Zr, and ZrO2 followed a similar pathway, producing gaseous CH3OH, CO2, H2, H2O, and possibly CO, while carbon–oxygen and phosphorus-containing by-products accumulated on the catalyst surface. Over time, this accumulation led to catalyst poisoning and deactivation. This study preliminarily revealed the fundamental mechanism of DMMP thermocatalytic decomposition using CuO/ZrO2 composite catalysts, providing reference for the rational design, performance optimization, and regeneration of catalysts for effective degradation of chemical warfare agents in the future.
Author Contributions
Methodology, X.W. and Y.L.; formal analysis, X.W., Y.L. and P.S.; data curation, X.W.; writing—original draft, X.W.; writing—review and editing, S.Z.; visualization, X.W. and S.Z.; supervision, P.Y. and Y.D.; project administration, Y.D. All authors have read and agreed to the published version of the manuscript.
Funding
This work was financially supported by the National Natural Science Foundation of China (No. 21701186) and the Fundamental Research Funds from the State Key Laboratory of NBC Protection for Civilian (SKLNBC 2019-04), China.
Data Availability Statement
The Data are contained within the article.
Conflicts of Interest
The authors declare no conflicts of interest.
Abbreviations
The following abbreviations are used in this manuscript:
| DMMP | Dimethyl methylphosphonate |
| AChE | Acetylcholinesterase |
| SSA | Specific surface area |
| SEM | Scanning electron microscopy |
| EDS | Energy-dispersive spectroscopy |
| H2-TPR | Hydrogen temperature-programmed reduction |
| ICP-OES | Inductively coupled plasma optical emission spectrometer |
| XPS | X-ray photoelectron spectroscopy |
| DRIFTS | Diffuse reflectance infrared Fourier transform spectroscopy |
| MFC | Mass flow controller |
| FID | Flame ionization detector |
References
- Motamedhashemi, M.Y.; Monji, M.; Egolfopoulos, F.; Tsotsis, T. A hybrid catalytic membrane reactor for destruction of a chemical warfare simulant. J. Membr. Sci. 2015, 473, 1–7. [Google Scholar] [CrossRef]
- Costanzi, S.; Machado, J.-H.; Mitchell, M. Nerve agents: What they are, how they work, how to counter them. ACS Chem. Neurosci. 2018, 9, 873–885. [Google Scholar] [CrossRef] [PubMed]
- Jang, Y.J.; Kim, K.; Tsay, O.G.; Atwood, D.A.; Churchill, D.G. Update 1 of: Destruction and detection of chemical warfare agents. Chem. Rev. 2015, 115, 1–76. [Google Scholar] [CrossRef] [PubMed]
- Kim, K.; Tsay, O.G.; Atwood, D.A.; Churchill, D.G. Destruction and detection of chemical warfare agents. Chem. Rev. 2011, 111, 5345–5403. [Google Scholar] [CrossRef]
- Bermudez, V.M. Computational study of environmental effects in the adsorption of DMMP, sarin, and VX on γ-Al2O3: Photolysis and surface hydroxylation. J. Phys. Chem. C 2009, 113, 1917–1930. [Google Scholar] [CrossRef]
- Singer, B.C.; Hodgson, A.T.; Destaillats, H.; Hotchi, T.; Revzan, K.L.; Sextro, R.G. Indoor sorption of surrogates for sarin and related nerve agents. Environ. Sci. Technol. 2005, 39, 3203–3214. [Google Scholar] [CrossRef]
- Xie, Y.; Zheng, C.; Lan, L.; Song, H.; Kang, J.; Kang, K.; Bai, S. The application of microfibrous entrapped activated carbon composite material for the sarin simulant dimethyl methylphosphonate adsorption. Nanomaterials 2023, 13, 2661. [Google Scholar] [CrossRef]
- Kiani, S.S.; Farooq, A.; Ahmad, M.; Irfan, N.; Nawaz, M.; Irshad, M.A. Impregnation on activated carbon for removal of chemical warfare agents (CWAs) and radioactive content. Environ. Sci. Pollut. Res. 2021, 28, 60477–60494. [Google Scholar] [CrossRef]
- Gundavarapu, S.; Zhuang, J.; Barrett, E.G.; Xu, F.; Russell, R.G.; Sopori, M.L. A critical role of acute bronchoconstriction in the mortality associated with high-dose sarin inhalation: Effects of epinephrine and oxygen therapies. Toxicol. Appl. Pharmacol. 2014, 274, 200–208. [Google Scholar] [CrossRef]
- Neupane, S.; Rahman, R.K.; Baker, J.; Arafin, F.; Ninnemann, E.; Thurmond, K.; Wang, C.-H.; Masunov, A.E.; Vasu, S.S. DMMP pyrolysis and oxidation studies at high temperature inside a shock tube using laser absorption measurements of CO. Combust. Flame 2020, 214, 14–24. [Google Scholar] [CrossRef]
- McEntee, M.; Gordon, W.O.; Balboa, A.; Delia, D.J.; Pitman, C.L.; Pennington, A.M.; Rolison, D.R.; Pietron, J.J.; DeSario, P.A. Mesoporous copper nanoparticle/TiO2 aerogels for room-temperature hydrolytic decomposition of the chemical warfare simulant dimethyl methylphosphonate. ACS Appl. Nano Mater. 2020, 3, 3503–3512. [Google Scholar] [CrossRef]
- Gao, H.; Kong, W.; Zhou, S.; Wang, X.; He, Q.; Dong, Y. Thermal catalytic decomposition of dimethyl methyl phosphonate using CuO-CeO2/γ-Al2O3. Appl. Sci. 2022, 12, 10101. [Google Scholar] [CrossRef]
- Jeon, S.; Schweigert, I.V.; Pehrsson, P.E.; Balow, R.B. Kinetics of dimethyl methylphosphonate adsorption and decomposition on zirconium hydroxide using variable temperature in situ attenuated total reflection infrared spectroscopy. ACS Appl. Mater. Interfaces 2020, 12, 14662–14671. [Google Scholar] [CrossRef] [PubMed]
- Rusu, C.N.; Yates, J.T. Adsorption and decomposition of dimethyl methylphosphonate on TiO2. J. Phys. Chem. B 2000, 104, 12292–12298. [Google Scholar] [CrossRef]
- Panayotov, D.A.; Morris, J.R. Thermal decomposition of a chemical warfare agent simulant (DMMP) on TiO2: Adsorbate reactions with lattice oxygen as studied by infrared spectroscopy. J. Phys. Chem. C 2009, 113, 15684–15691. [Google Scholar] [CrossRef]
- Walenta, C.A.; Xu, F.; Tesvara, C.; O’Connor, C.R.; Sautet, P.; Friend, C.M. Facile decomposition of organophosphonates by dual lewis sites on a Fe3O4 (111) Film. J. Phys. Chem. C 2020, 124, 12432–12441. [Google Scholar] [CrossRef]
- Mitchell, M.B.; Sheinker, V.N.; Mintz, E.A. Adsorption and decomposition of dimethyl methylphosphonate on metal oxides. J. Phys. Chem. B 1997, 101, 11192–11203. [Google Scholar] [CrossRef]
- Cao, L.; Segal, S.R.; Suib, S.L.; Tang, X.; Satyapal, S. Thermocatalytic oxidation of dimethyl methylphosphonate on supported metal oxides. J. Catal. 2000, 194, 61–70. [Google Scholar] [CrossRef]
- Kong, W.; Wang, X.; Wang, K.; He, Q.; Zhou, S.; Yang, P.; Dong, Y. Thermocatalytic decomposition of dimethyl methylphosphonate based on CeO2 catalysts with different morphologies. Appl. Sci. 2023, 13, 3093. [Google Scholar] [CrossRef]
- Kong, W.; Zhou, S.; Wang, X.; He, Q.; Yang, P.; Yuan, Y.; Dong, Y. Catalytic oxidative decomposition of dimethyl methyl phosphonate over CuO/CeO2 catalysts prepared using a secondary alkaline hydrothermal method. Catalysts 2022, 12, 1277. [Google Scholar] [CrossRef]
- He, M.-Y.; Ekerdt, J.G. Infrared studies of the adsorption of synthesis gas on zirconium dioxide. J. Catal. 1984, 87, 381–388. [Google Scholar] [CrossRef]
- Ananchenko, D.V.; Nikiforov, S.V.; Sobyanin, K.V.; Konev, S.F.; Dauletbekova, A.K.; Akhmetova-Abdik, G.; Akilbekov, A.T.; Popov, A.I. Paramagnetic defects and thermoluminescence in irradiated nanostructured monoclinic zirconium dioxide. Materials 2022, 15, 8624. [Google Scholar] [CrossRef]
- Jung, K.T.; Bell, A.T. The Effects of Synthesis and pretreatment conditions on the bulk structure and surface properties of zirconia. J. Mol. Catal. Chem. 2000, 163, 27–42. [Google Scholar] [CrossRef]
- Lin, F.-Q.; Dong, W.-S.; Liu, C.-L.; Liu, Z.; Li, M. In situ source–template-interface reaction route to hollow ZrO2 microspheres with mesoporous shells. J. Colloid Interface Sci. 2008, 323, 365–371. [Google Scholar] [CrossRef]
- Dai, W.; Meng, X.; Xu, B.; Zhao, R.; Jin, D.; Xu, F.; Yang, D.; Xin, Z. Effect of reflux time on the performance of the Cu/ZrO2 catalyst for CO2 hydrogenation to methanol. ACS Appl. Energy Mater. 2023, 6, 9417–9426. [Google Scholar] [CrossRef]
- Tada, S.; Watanabe, F.; Kiyota, K.; Shimoda, N.; Hayashi, R.; Takahashi, M.; Nariyuki, A.; Igarashi, A.; Satokawa, S. Ag addition to CuO-ZrO2 catalysts promotes methanol synthesis via CO2 hydrogenation. J. Catal. 2017, 351, 107–118. [Google Scholar] [CrossRef]
- Ratnasamy, P.; Srinivas, D.; Satyanarayana, C.V.V.; Manikandan, P.; Senthil Kumaran, R.S.; Sachin, M.; Shetti, V.N. Influence of the support on the preferential oxidation of CO in hydrogen-rich steam reformates over the CuO–CeO2–ZrO2 system. J. Catal. 2004, 221, 455–465. [Google Scholar] [CrossRef]
- Liu, S.-H.; Wang, H.P.; Wang, H.-C.; Yang, Y.W. In Situ EXAFS Studies of copper on ZrO2 during catalytic hydrogenation of CO2. J. Electron Spectrosc. Relat. Phenom. 2005, 144–147, 373–376. [Google Scholar] [CrossRef]
- Borovinskaya, E.S.; Trebbin, S.; Alscher, F.; Breitkopf, C. Synthesis, modification, and characterization of CuO/ZnO/ZrO2 mixed metal oxide catalysts for CO2/H2 conversion. Catalysts 2019, 9, 1037. [Google Scholar] [CrossRef]
- Basahel, S.; Mokhtar, M.; Alsharaeh, E.; Ali, T.; Mahmoud, H.; Narasimharao, K. Physico-chemical and catalytic properties of mesoporous CuO-ZrO2 catalysts. Catalysts 2016, 6, 57. [Google Scholar] [CrossRef]
- Suh, Y.-W.; Moon, S.-H.; Rhee, H.-K. Active sites in Cu/ZnO/ZrO2 catalysts for methanol synthesis from CO/H2. Catal. Today 2000, 63, 447–452. [Google Scholar] [CrossRef]
- Śliwa, M.; Podobiński, J.; Rutkowska-Zbik, D.; Datka, J. In situ IR studies on ethanol transformations over CuO, CuO/ZrO2 and CuO/ZrO2/ZnO catalysts modified with NiO. J. Mol. Struct. 2022, 1257, 132581. [Google Scholar] [CrossRef]
- Ardizzone, S.; Bianchi, C.L.; Signoretto, M. Zr(IV) Surface chemical state and acid features of sulphated-zirconia samples. Appl. Surf. Sci. 1998, 136, 213–220. [Google Scholar] [CrossRef]
- Velu, S.; Suzuki, K.; Gopinath, C.S.; Yoshida, H.; Hattori, T. XPS, XANES and EXAFS investigations of CuO/ZnO/Al2O3/ZrO2 mixed oxide catalysts. Phys. Chem. Chem. Phys. 2002, 4, 1990–1999. [Google Scholar] [CrossRef]
- Ardizzone, S.; Bianchi, C.L. XPS Characterization of sulphated zirconia catalysts: The role of iron. Surf. Interface Anal. 2000, 30, 77–80. [Google Scholar] [CrossRef]
- Sato, A.G.; Volanti, D.P.; Meira, D.M.; Damyanova, S.; Longo, E.; Bueno, J.M.C. Effect of the ZrO2 phase on the structure and behavior of supported Cu catalysts for ethanol conversion. J. Catal. 2013, 307, 1–17. [Google Scholar] [CrossRef]
- Navío; Hidalgo; Colón, G.; Botta, S.G.; Litter, M.I. Preparation and physicochemical properties of ZrO2 and Fe/ZrO2 prepared by a sol−gel technique. Langmuir 2001, 17, 202–210. [Google Scholar] [CrossRef]
- Salinas, D.; Sepúlveda, C.; Escalona, N.; GFierro, J.L.; Pecchi, G. Sol–Gel La2O3–ZrO2 mixed oxide catalysts for biodiesel production. J. Energy Chem. 2018, 27, 565–572. [Google Scholar] [CrossRef]
- Liu, W.-J.; Zeng, F.-X.; Jiang, H.; Zhang, X.-S.; Li, W.-W. Composite Fe2O3 and ZrO2/Al2O3 photocatalyst: Preparation, characterization, and studies on the photocatalytic activity and chemical stability. Chem. Eng. J. 2012, 180, 9–18. [Google Scholar] [CrossRef]
- Morant, C.; Sanz, J.M.; Galán, L.; Soriano, L.; Rueda, F. An XPS study of the interaction of oxygen with zirconium. Surf. Sci. 1989, 218, 331–345. [Google Scholar] [CrossRef]
- Jia, X.; Li, J.; Wang, E. One-Pot Green synthesis of optically pH-sensitive carbon dots with upconversion luminescence. Nanoscale 2012, 4, 5572. [Google Scholar] [CrossRef]
- Arena, F.; Italiano, G.; Barbera, K.; Bordiga, S.; Bonura, G.; Spadaro, L.; Frusteri, F. Solid-state interactions, adsorption sites and functionality of Cu-ZnO/ZrO2 catalysts in the CO2 hydrogenation to CH3OH. Appl. Catal. Gen. 2008, 350, 16–23. [Google Scholar] [CrossRef]
- Lee, K.Y.; Houalla, M.; Hercules, D.M.; Hall, W.K. Catalytic oxidative decomposition of dimethyl methylphosphonate over Cu-substituted hydroxyapatite. J. Catal. 1994, 145, 223–231. [Google Scholar] [CrossRef]
- Graven, W.M.; Weller, S.W.; Peters, D.L. Catalytic conversion of organophosphate vapor over platinum-alumina. Ind. Eng. Chem. Process Des. Dev. 1966, 5, 183–189. [Google Scholar] [CrossRef]
- Xi, Y.; Huang, M.; Luo, X. Enhanced phosphate adsorption performance by innovative anion imprinted polymers with dual interaction. Appl. Surf. Sci. 2019, 467–468, 135–142. [Google Scholar] [CrossRef]
- Trotochaud, L.; Head, A.R.; Büchner, C.; Yu, Y.; Karslıoğlu, O.; Tsyshevsky, R.; Holdren, S.; Eichhorn, B.; Kuklja, M.M.; Bluhm, H. Room temperature decomposition of dimethyl methylphosphonate on cuprous oxide yields atomic phosphorus. Surf. Sci. 2019, 680, 75–87. [Google Scholar] [CrossRef]
- Ma, S.; Zhou, J.; Kang, Y.C.; Reddic, J.E.; Chen, D.A. Dimethyl methylphosphonate decomposition on Cu surfaces: Supported Cu nanoclusters and films on TiO2(110). Langmuir 2004, 20, 9686–9694. [Google Scholar] [CrossRef]
- Chen, D.A.; Ratliff, J.S.; Hu, X.; Gordon, W.O.; Senanayake, S.D.; Mullins, D.R. Dimethyl methylphosphonate decomposition on fully oxidized and partially reduced ceria thin films. Surf. Sci. 2010, 604, 574–587. [Google Scholar] [CrossRef]
- Wang, L.; Denchy, M.; Blando, N.; Hansen, L.; Bilik, B.; Tang, X.; Hicks, Z.; Bowen, K.H. Thermal decomposition of dimethyl methylphosphonate on size-selected clusters: A comparative study between copper metal and cupric oxide clusters. J. Phys. Chem. C 2021, 125, 11348–11358. [Google Scholar] [CrossRef]
- Mukhopadhyay, S.; Schoenitz, M.; Dreizin, E.L. Vapor-phase decomposition of dimethyl methylphosphonate (DMMP), a sarin surrogate, in presence of metal oxides. Def. Technol. 2021, 17, 1095–1114. [Google Scholar] [CrossRef]
- Moravie, R.M.; Froment, F.; Corset, J. Vibrational spectra and possible conformers of dimethylmethylphosphonate by normal mode analysis. Spectrochim. Acta Part A Mol. Spectrosc. 1989, 45, 1015–1024. [Google Scholar] [CrossRef]
- Aurian-Blajeni, B.; Boucher, M.M. Interaction of dimethyl methylphosphonate with metal oxides. Langmuir 1989, 5, 170–174. [Google Scholar] [CrossRef]
- Podobiński, J.; Śliwa, M.; Datka, J. Ethoxy groups on ZrO2, CuO, and CuO/ZrO2 studied by IR spectroscopy. Molecules 2022, 27, 4790. [Google Scholar] [CrossRef] [PubMed]
Disclaimer/Publisher’s Note: The statements, opinions and data contained in all publications are solely those of the individual author(s) and contributor(s) and not of MDPI and/or the editor(s). MDPI and/or the editor(s) disclaim responsibility for any injury to people or property resulting from any ideas, methods, instructions or products referred to in the content. |
© 2025 by the authors. Licensee MDPI, Basel, Switzerland. This article is an open access article distributed under the terms and conditions of the Creative Commons Attribution (CC BY) license (https://creativecommons.org/licenses/by/4.0/).