1. Introduction
Pipeline transportation remains the most critical method for oil and gas transport due to its cost-effectiveness, high capacity, efficiency, and reliability [
1]. However, the unique role of oil and gas pipelines also underscores the significant risks associated with accidents, which can result in severe and far-reaching consequences [
2]. Moreover, during pipeline operations, factors such as high-pressure conditions, continuous operation, extended distances, diverse geographical environments, and varying climates amplify the risks. In the event of pipeline leakage or blockage, the impact can be catastrophic, leading to serious economic, environmental, and safety consequences [
3].
To address these challenges, various technologies have been developed to mitigate gas hydrate formation and ensure the uninterrupted flow of natural gas in pipelines. Austvik and Gudmundsson [
4,
5] proposed the Hydra Flow Technology and the Cold Flow Concept, which focus on guiding hydrate formation within pipelines while maintaining a uniform and stable flow of hydrate particles suspended in the fluid. This approach minimizes the risk of hydrate aggregation and blockages, ensuring the safe transport of natural gas. Swirl flow technology has also emerged as a promising method for controlling natural gas hydrate (NGH) transport. Wang [
6] studied the influence of different twist tape parameters on the swirl number and concentration distribution of hydrate particles. Cai [
7] developed flow pattern maps for screw swirl channels, finding that the annular flow region increased while intermittent flow regions decreased, in contrast to Taitel’s vertical pipeline flow maps [
8].
Liu [
9] used the Response Surface Methodology (RSM) and the Volume of Fluid (VOF) model to simulate gas–liquid two-phase flow patterns in straight pipes, successfully modeling bubble, stratified, wavy, slug, and annular flows. Similarly, Liu [
10] experimentally investigated gas–water two-phase flows in vertical swirl rectangular channels using high-speed flow visualization, producing flow pattern maps and describing the flow evolution at various positions within the channel. Fabio [
11] studied gas–liquid two-phase flows with twisted tapes and identified five flow patterns: stratified, intermittent, annular-stratified, annular, and plug flow. Liu [
12,
13] investigated the axial development of air–water annular swirl flows in vertical pipes, focusing on flow patterns, void fractions, and pressure drops along the streamwise direction.
Compared to other methods, swirl flow generators, such as twisted tapes and impellers, offer advantages including high rotational efficiency, ease of installation, and compatibility with straight pipeline systems. Recent advancements in swirl flow generation include the use of diversion blades [
14], perforated twist tapes [
15], and varying diameter twist tapes [
16]. Liu [
17] investigated the characteristics of single-phase and gas-phase swirl flows induced by short spiral bonds, observing that the pitch of the vortex decreases with increasing Reynolds number, leading to non-uniform axial velocity in the gas phase. Yin [
18,
19] designed a swirl flow spinning device to study bubble separation trajectories at different sizes and Reynolds numbers using high-speed visualization. Nana et al. [
20] evaluated the influence of perforated twisted tapes on fluid flow and heat transfer, concluding that the perforations reduce fluid drag but slightly compromise heat transfer performance. The influences of the gas content, mass flux, and saturation temperature on the heat transfer coefficient of R-600a in the smooth spiral bellows were experimentally studied [
21]. Chen et al. optimized and designed a nonaxial- type swirling cavitating nozzle (NASCN) based on traditional swirling cavitating nozzles (SCNs). Both numerical simulations and indoor experiments verified the higher mining performance of this nozzle [
22]. Zheng et al. studied the cementation breaking and grit separation characteristics of weakly cemented NGH-similar materials in the swirl flow field. The experimental results under the operating conditions studied show that the swirl flow field exhibits good cementation breaking and grit separation performance for weakly cemented NGH-similar materials [
23].
Despite these advancements, most current pipeline swirl flow studies focus on localized swirl generators, such as short twisted tapes [
24] and impellers [
25], which experience rapid attenuation of swirling motion. This limitation necessitates the installation of multiple relay swirl devices for long-distance pipelines, increasing operational complexity and cost.
In the present study, we investigate the impact of twisted tape parameters on the flow characteristics of hydrate particles in pipelines, using a computational fluid dynamics (CFD) model based on the discrete phase model (DPM) and RNG k-ε turbulence model. The study examines the effects of various parameters, including the placement angle, height, and number of twisted tapes, on the velocity field, turbulent dissipation, turbulent kinetic energy, and pressure distribution. The influence of these parameters on hydrate particle transport dynamics is systematically analyzed.
Our research includes the following novel contributions. Firstly, most previous studies have focused on localized swirl flow generators, such as short twisted tapes and impellers, which exhibit rapid swirl flow attenuation. This study addresses the gap by investigating continuous swirl flow along the entire pipeline, providing a comprehensive analysis of its effects on hydrate particle flow. Secondly, the study evaluates the impact of multiple twisted tape configurations, including varying placement angles, heights, and numbers of twisted tapes, on the swirl flow dynamics and hydrate particle transport efficiency. The interaction between turbulent dissipation, tangential velocity, and axial velocity in different twisted tape configurations is thoroughly examined. Lastly, the findings provide theoretical insights and technical guidelines for designing pipelines with enhanced swirl flow technology, offering practical solutions to improve the safe and efficient transport of natural gas hydrates over long distances.
3. Results and Discussion
3.1. Velocity Distributions
In this section, the numerical simulations focus on examining the effects of twisted tape parameters on hydrate flow characteristics, while other boundary conditions remain unchanged. The Reynolds number is set to 20,000, the hydrate particle size is 10 μm, and the initial concentration of hydrate particles in the gas–solid two-phase flow is 8%. A total of 11 simulation cases were conducted, with the parameters for each operating condition summarized in
Table 1.
Figure 1 illustrates the velocity magnitude and vector distribution across different sections of the twisted tape pipe, characterized by a twist angle of 25°,
h =
D/6,
n = 3 under the Reynolds number of Re = 20,000. Due to the 120° rotational symmetry of the twisted tape around the pipe axis, the velocity distribution within the pipe exhibits corresponding 120° rotational symmetry with respect to the pipe’s centerline. The velocity magnitude is highest along the pipe axis, where the flow is relatively undisturbed, resulting in a small velocity gradient. In contrast, near the pipe wall and the surfaces of the twisted tape, the axial velocity decreases sharply, creating a steep velocity gradient. This gradient is a result of the interaction between the swirling flow induced by the twisted tape and the pipe’s stationary boundary, which increases shear forces in these regions.
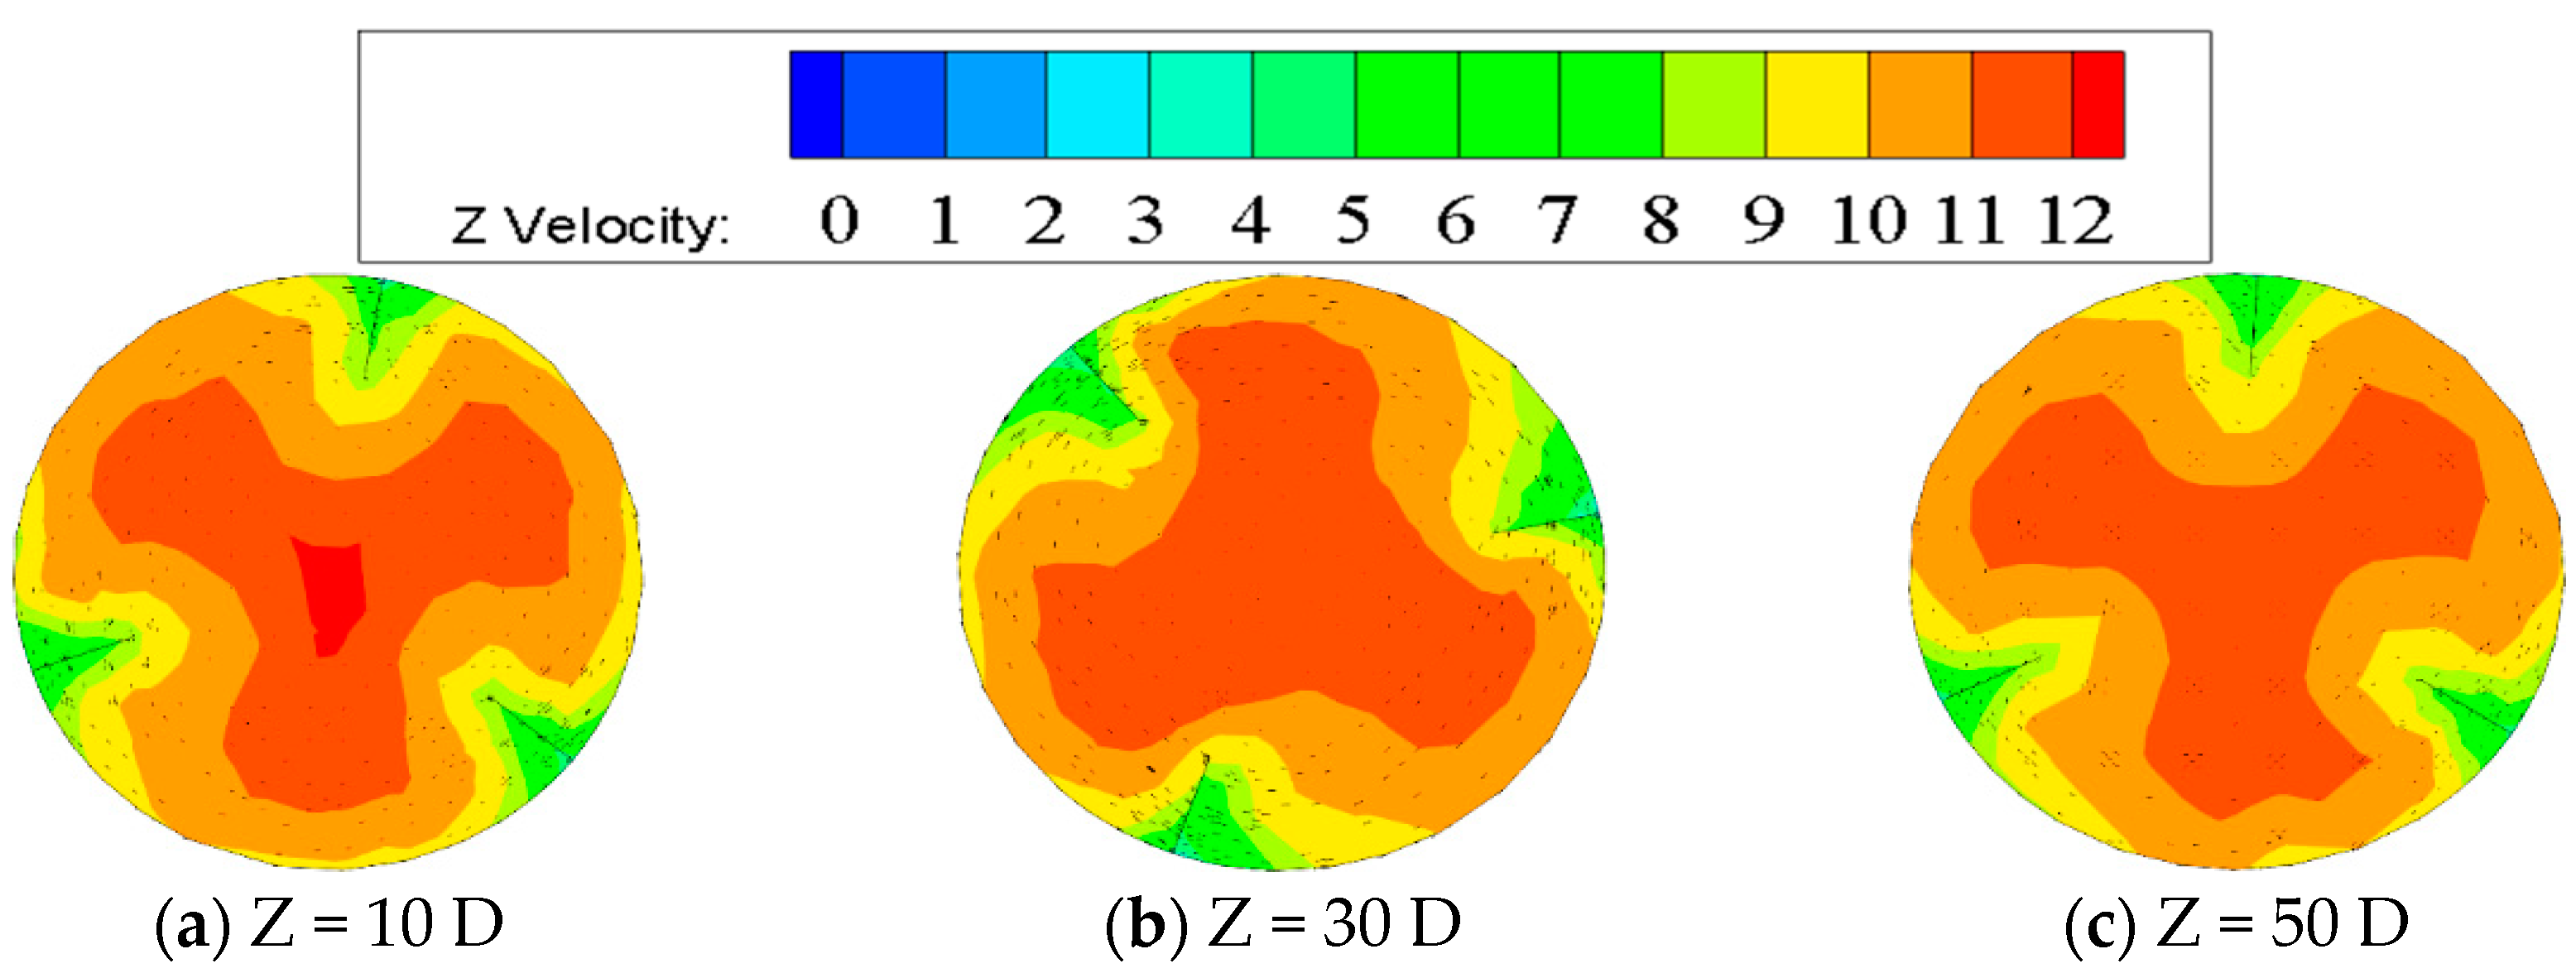
As the flow progresses along the pipe (Z = 10 D, 30 D, and 50 D), the velocity vector distributions show that the swirling motion remains well-preserved, with minimal attenuation of tangential velocity near the twist tape. This sustained swirl flow is crucial for maintaining the tangential velocity component, which prevents hydrate particles from settling and adhering to the pipe wall. The induced shear forces promote the suspension of hydrate particles, reducing the risk of deposition that can lead to blockages in the pipeline. At section Z = 10 D, the swirling motion is pronounced, with strong velocity vectors demonstrating significant rotational effects. By Z = 30 D, the flow remains consistent, indicating the twisted tape’s effectiveness in maintaining flow uniformity. Even at Z = 50 D, the swirl persists, confirming the design’s ability to enhance flow dynamics over extended distances. Hence, the twisted tape geometry not only improves velocity uniformity but also mitigates the deposition of hydrate particles by leveraging shear forces and swirl-induced tangential velocity. This demonstrates its potential for addressing challenges associated with hydrate accumulation in gas–solid two-phase flow systems.
3.2. Effect of Placement Angles of the Twist Tape
The placement angle of the twisted tape significantly affects the flow characteristics in the pipe, as it alters the guide period and the alignment of the twist tape at various cross-sections. To ensure a meaningful comparison, the cross-sections are selected based on positions closest to equivalent distances within a half-cycle or full-cycle, ensuring the twist tape aligns at 120° and 240° rotations or completes a full 360° cycle relative to the pipe inlet.
Figure 2 illustrates the effects of different twist tape placement angles on tangential and axial velocities at varying cross-sections under a Reynolds number of 20,000. The analysis reveals that larger placement angles result in higher tangential velocities and lower axial velocities. Tangential velocity maxima are observed near the pipe wall, whereas the tangential velocity at the pipe axis region approaches zero. The radial distribution of tangential velocity is notably non-axisymmetric, reflecting the influence of the asymmetric geometry of the twist tape.
In terms of axial velocity, the maximum values are concentrated along the pipe axis. Axial velocity diminishes progressively closer to the pipe wall, with a distinct asymmetry: the left axial velocity is slightly lower than the right, consistent with the observation that the left tangential velocity exceeds the right. This phenomenon can be attributed to the swirling flow dynamics induced by the twist tape’s geometry and placement. The placement angle further influences the behavior of axial velocity maxima as the flow progresses downstream. For pipes with placement angles of θ = 10° and 15°, the axial velocity maxima increase significantly after crossing the reference plane at Z = 10 D. Maximum speed increased by 18.2%. The maximum velocity area contracts towards the pipe axis, and the velocity profile becomes increasingly pointed, indicating enhanced flow concentration. Conversely, for placement angles of θ = 20° and 25°, the axial velocity maxima exhibit a slight decrease, suggesting a trade-off between tangential and axial flow intensities at higher placement angles. At Z = 30 D, the tangential velocity remains robust, particularly for larger placement angles, indicating sustained swirl flow. However, as the flow progresses to Z = 50 D, the tangential velocity begins to decay slightly, though it remains sufficiently high to prevent hydrate particle deposition on the pipe walls. This highlights the importance of optimizing placement angles to balance the tangential and axial velocity components, thereby enhancing the flow’s ability to transport hydrate particles without blockages.
Figure 3 shows the influence of the twist tape displacement angle on turbulent dissipation and turbulent kinetic energy at different cross-sections, with a Reynolds number of 20,000. The semi-periodic positioning of the twist tape significantly impacts the variation in these two parameters. The horizontal axis
r/
D represents the ratio of the radial distance from the pipe axis to the pipe diameter, while the vertical axis denotes the normalized values of turbulent dissipation and turbulent kinetic energy, expressed as ratios to their respective maximum values within the cross-section. Similar to the tangential velocity distribution, both turbulent dissipation and turbulent kinetic energy exhibit higher values near the pipe wall and asymmetry between the left and right sides of the cross-section. Conversely, these values are significantly lower closer to the pipe axis. This distribution pattern reflects the influence of swirl flow induced by the twisted tape and the resulting energy transfer within the fluid.
As the flow advances downstream (Z = 10 D, 30 D, and 50 D), the fluid’s helical motion causes the locations of peak turbulent dissipation and turbulent kinetic energy to shift slightly. The dynamic energy production and dissipation are influenced by the turbulence generation mechanisms, which are inherently non-conservative. The regions of maximum turbulent kinetic energy correspond to areas where turbulence production is most intense, and this is where the dissipation rate also peaks. With larger displacement angles, the interaction between the twisted tape and the fluid intensifies, leading to stronger swirl flow. This results in increased turbulence pulsations and enhanced formation of secondary vortices and smaller wake vortices. The complementary relationship between these processes strengthens the overall swirl flow and boosts energy transfer within the pipe. The heightened turbulence activity also increases the efficiency of secondary vortex formation, contributing to higher dissipation rates.
However, as the transport distance increases, turbulent dissipation gradually decreases, particularly for larger displacement angles. This attenuation indicates that although greater placement angles initially enhance swirl flow strength and collision intensity between the fluid and the twist tape, the energy dissipates more rapidly over longer distances. This behavior underscores the trade-off between initial turbulence intensity and energy retention along the pipe. At Z = 10 D, turbulent dissipation and turbulent kinetic energy are concentrated near the pipe wall, demonstrating the influence of strong swirl flow near the entrance. At Z = 30 D, the energy distribution begins to shift, reflecting the sustained but evolving turbulence structure. At Z = 50 D, the overall intensity diminishes, particularly for turbulent dissipation, as the swirl flow gradually stabilizes.
3.3. Effect of Heights of the Twist Tape
The impact of twist tape heights on swirling fluid dynamics in gas–solid two-phase gas hydrate flows is thoroughly analyzed in
Figure 4 and
Figure 5. We focus on tangential velocity, axial velocity, turbulence dissipation, and turbulent kinetic energy under Re = 20,000 conditions.
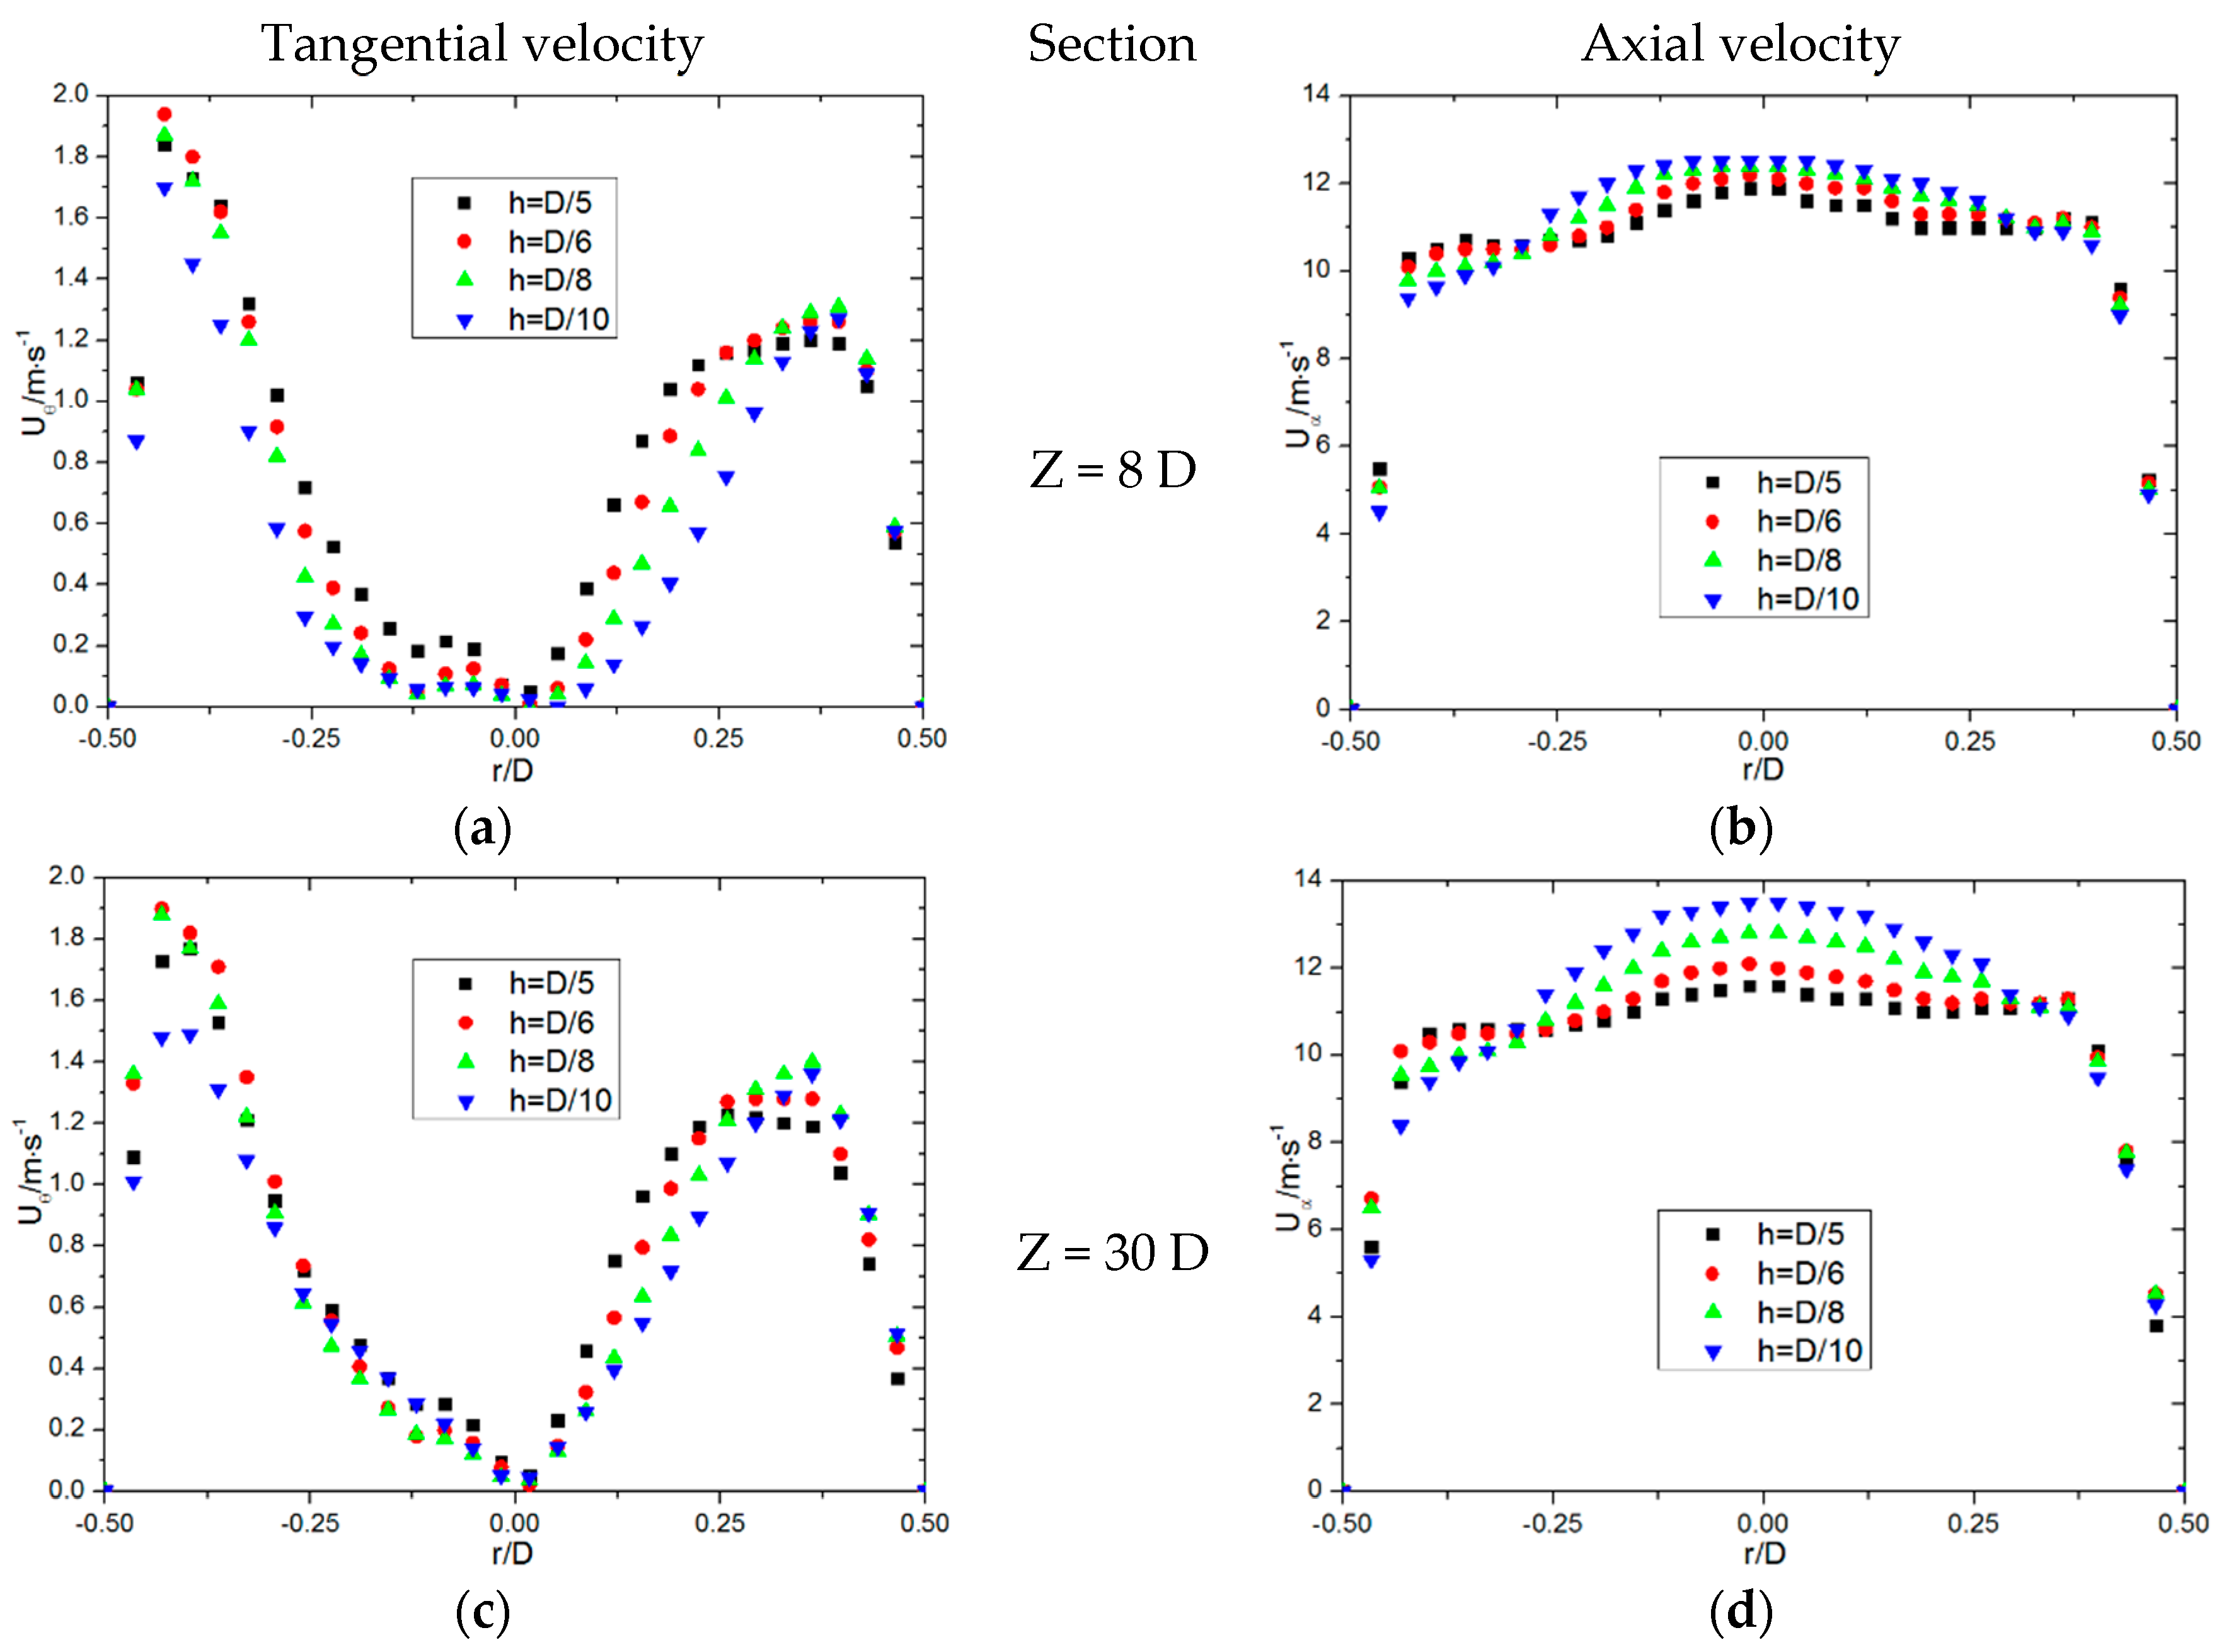
Figure 4 describes the influence of twist tape height on tangential and axial velocities at three different axial positions:
Z = 8
D, 30
D, and 47
D. The tangential velocity near the pipe axis increases with the height of the twist tape. However, the axial decline in tangential velocity is less pronounced for higher twist tape heights. This suggests that taller twist tapes promote sustained swirling motion in the core region. The radial distribution is non-axisymmetric, with the maximum tangential velocity occurring near the pipe wall. Interestingly, the peak tangential velocity for all twist tape heights remains nearly identical, highlighting that the primary effect of twist tape height lies in altering the velocity gradient rather than the absolute maximum velocity. The transition of tangential velocity from the pipe wall to the axis exhibits a smoother gradient with higher twist tape heights. This indicates that taller tapes foster a more gradual dissipation of swirling energy, reducing the radial velocity shear.
The axial velocity near the twist tape is significantly reduced compared to other regions due to the obstruction imposed by the tape. The maximum axial velocity consistently appears at the pipe’s axis, while it diminishes closer to the wall. A subtle asymmetry is observed: the left axial velocity slightly underperforms the right. This could be attributed to localized disturbances induced by the twisting geometry. As the flow progresses downstream, the axial velocity for lower-height twist tapes increases along the axis. Conversely, the axial velocity for higher-height twist tapes stabilizes, indicating that taller tapes achieve earlier axial flow stabilization.
Figure 5 provides insight into the turbulent dissipation and turbulent kinetic energy across different sections. These parameters, normalized to their highest section values, serve as key indicators of swirling flow strength. Turbulent dissipation is generally lower near the axis compared to the regions close to the pipe wall. This trend reflects the gradual reduction in energy dissipation at the core of the swirling flow. At the section 8D, the turbulent kinetic energy increases by 60% with the increase in the height of the twisted tapes. The radial profiles of turbulent dissipation exhibit minimal fluctuation near the pipe wall, suggesting consistent energy dissipation rates in this region regardless of twist tape height. Notably, the height of the twist tape broadens the region of intense swirling flow. Taller twist tapes produce a larger secondary vortex near the wall, enhancing local dissipation rates.
Turbulent kinetic energy shows pronounced differences near the axis but converges near the wall. The elevated turbulent kinetic energy at the axis for taller twist tapes reflects a more robust core swirling motion. With increasing flow distance, the turbulent kinetic energy profile stabilizes. The initially high turbulent kinetic energy values near the entrance diminish as turbulence intensity reduces along the flow direction. For higher twist tapes, the stronger helical flow persists over longer axial distances. This aligns with the observation that taller tapes extend the range of strong swirling motion.
Our findings demonstrate that twist tape height significantly influences the characteristics of swirling flow in gas–solid two-phase systems. Taller twist tapes create more stable swirling flows by sustaining tangential velocity and reducing axial velocity fluctuations. This is beneficial for maintaining uniform flow patterns in industrial applications. The extended region of strong swirling motion enabled by higher twist tapes promotes efficient mixing and reduces localized energy losses. This is particularly advantageous for gas hydrate flows where mixing is critical. While higher twist tapes increase the range of turbulence dissipation, they also stabilize the core turbulent kinetic energy, balancing mixing efficiency with flow stability.
3.4. Effect of Numbers of the Twist Tape
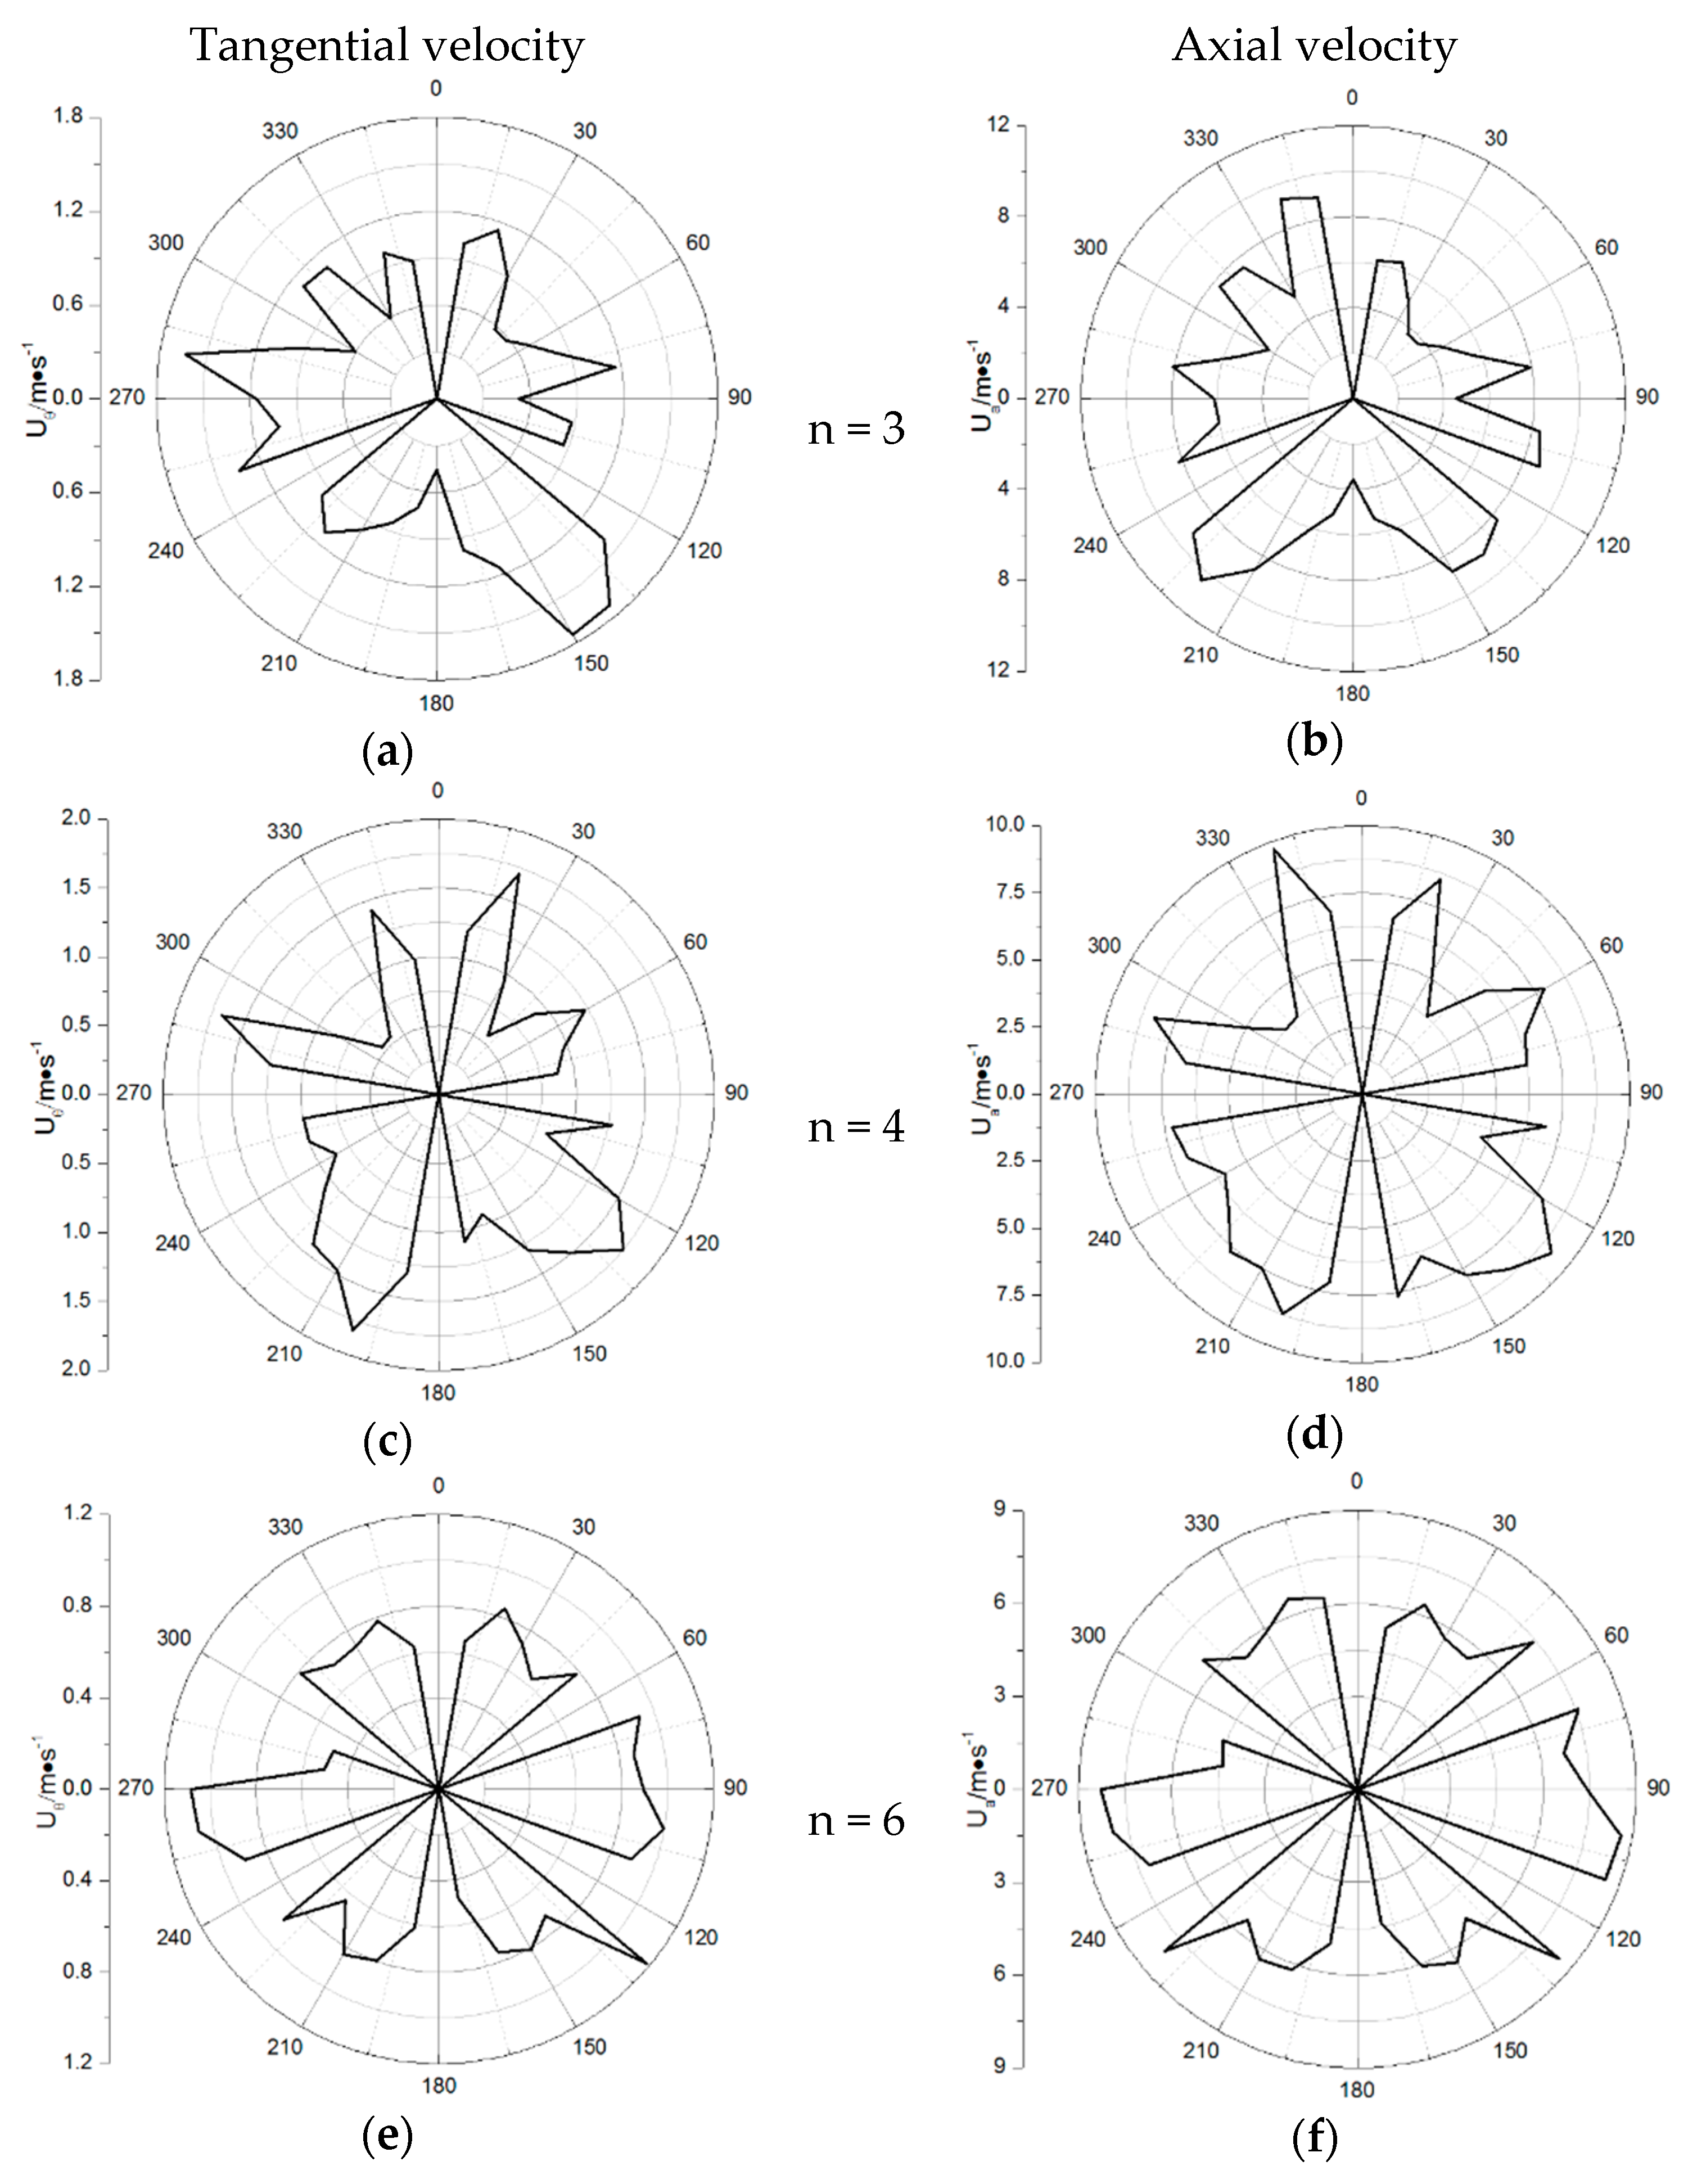
Figure 6 illustrates the velocity profiles at a radial position of 0.4
D along the pipe circumference, measured at intervals of 10° in the rotational direction. The velocity acquisition points correspond to the midpoint between consecutive twist tapes, with 0 representing the position of a twist tape. The tangential velocity within the pipe varies asymmetrically along the radial direction. The interval from the windward side of one twist tape to the next exhibits an initial increase in tangential velocity, followed by a decrease. Despite localized fluctuations, the overall tangential velocity decreases with an increasing number of twist tapes. This decline is attributable to increased flow resistance and the energy dissipation caused by additional obstruction. An asymmetry in the tangential velocity is observed. For instance, at
n = 3, the point at 270° shows a higher velocity than the point at 90°. This discrepancy arises because the former is closer to the windward side of the upper twist tape, which enhances localized swirling intensity.
Axial velocity exhibits an opposite trend to tangential velocity. While localized fluctuations occur, the overall axial velocity increases or remains constant with additional twist tapes. This phenomenon can be attributed to the interplay between axial flow stabilization and the resistance imposed by the twist tapes. The axial velocity becomes more uniform along the pipe’s length as the number of twist tapes increases, indicating enhanced mixing but reduced swirling strength.
Figure 7 provides insights into the turbulent dissipation and turbulent kinetic energy at various cross-sectional positions (
Z = 10
D, 30
D, and 50
D) for different numbers of twist tapes. The turbulent dissipation decreases with increasing flow distance. For pipes with three twist tapes, the dissipation curves shift downward significantly, indicating a growing disparity between turbulence intensity near the twist tape and the pipe’s axis. Pipes with four twist tapes maintain a relatively stable turbulent dissipation profile across the flow length. This suggests a balance between energy input from the swirl and dissipation losses, optimizing the flow stability. In the case of six twist tapes, the turbulent dissipation difference diminishes with distance. This reduction occurs because excessive twist tapes increase resistance and energy losses, limiting the swirling flow’s effectiveness.
The profiles of turbulent kinetic energy exhibit trends similar to turbulent dissipation. For three twist tapes, the difference between turbulent kinetic energy values near the twist tape and the pipe axis widens as the flow progresses downstream. With four twist tapes, the turbulent kinetic energy difference remains consistent across the flow length, signifying efficient energy utilization for swirl generation without excessive dissipation. For six twist tapes, the turbulent kinetic energy values near the axis and the twist tape converge over distance, indicating a weakening of the swirl due to increased flow resistance and diminished energy input.
We found that increasing the number of twist tapes enhances flow resistance, leading to higher energy dissipation. This effect is particularly pronounced for six twist tapes, where excessive obstruction reduces the swirl’s overall strength. Fewer twist tapes (e.g., n = 3) preserve swirling intensity over longer distances but at the cost of less uniform flow. Conversely, more twist tapes (e.g., n = 6) reduce swirling intensity but achieve better flow uniformity. Four twist tapes strike a balance between swirling intensity and flow stability. They maintain consistent turbulent dissipation and turbulent kinetic energy profiles, ensuring efficient energy utilization without excessive resistance.
3.5. Pressure Drop Rule
3.5.1. Effect of Twist Tape Angle on Pressure Distribution
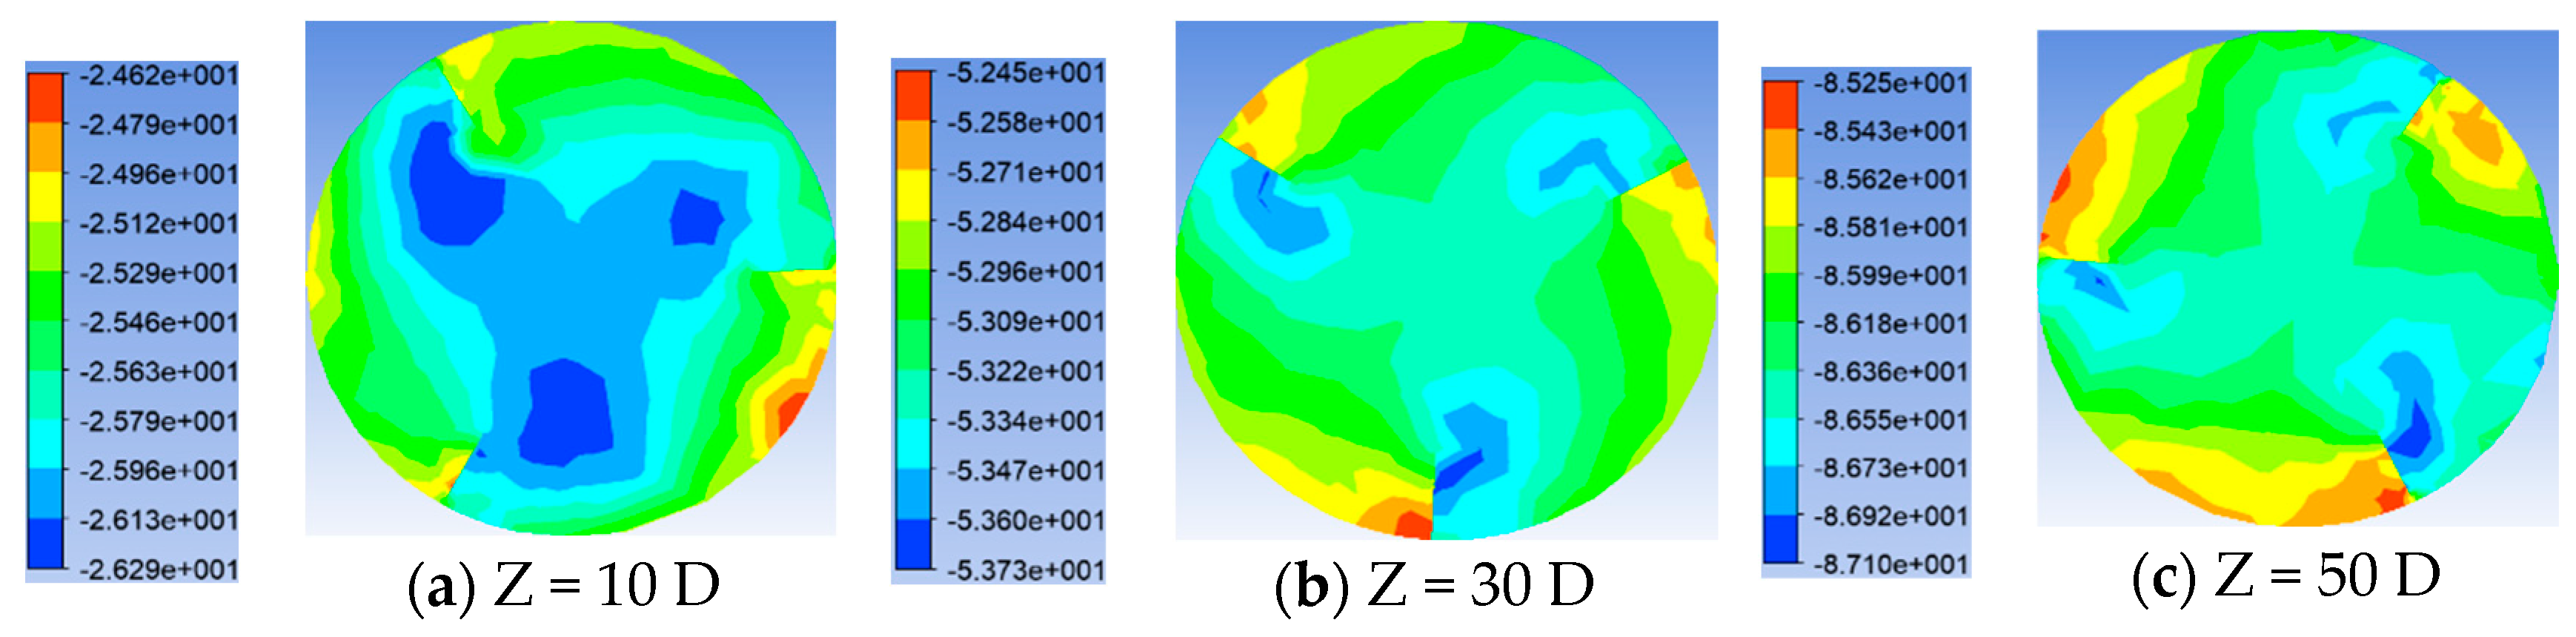
Shown in
Figure 8,
Figure 9,
Figure 10 and
Figure 11 is the pressure distribution diagram at different section positions under Re = 20,000. It is obvious from the figure that as the pressure gradient in the section of the pipe gradually becomes clear, the pressure distribution is more uniform, and 120° is the center of the circle. From the different points of view of a single pipe, the pressure maximum appears in the windward side of the twist tape, its minimum appears in the back plane of the next twist tape, and the pressure decreases gradually between the two twist tapes. With the increase in the flow distance, the pressure maximum area decreases to the windward side of the twist tape, and the pressure minimum area gradually moves down to the intersection position of the lee side of the diversion strip and the pipe wall. From the pressure value, the greater the placement angle of the twist tape, the greater the pressure. As shown in
Figure 12, the setting angle of the twist tape affects the pressure drop under the Re = 20,000 condition. The abscissa is the ratio of the axial flow distance to the total length of the pipeline, and the ordinate is the pressure drop. As can be seen from the figure, with the increase in the transmission distance, the influence of the placing angle on the pressure drop of the pipe gradually increases. The greater the placing angle, the greater the pressure drop. At section 65D, the pressure drop increases gradually with the increase in the orientation angle and increases by 36.8%. At the outlet end of the pipeline, due to the export effect, the pressure growth rate slows down.
3.5.2. Effect of the Twist Tape Height on the Pressure Distribution Law
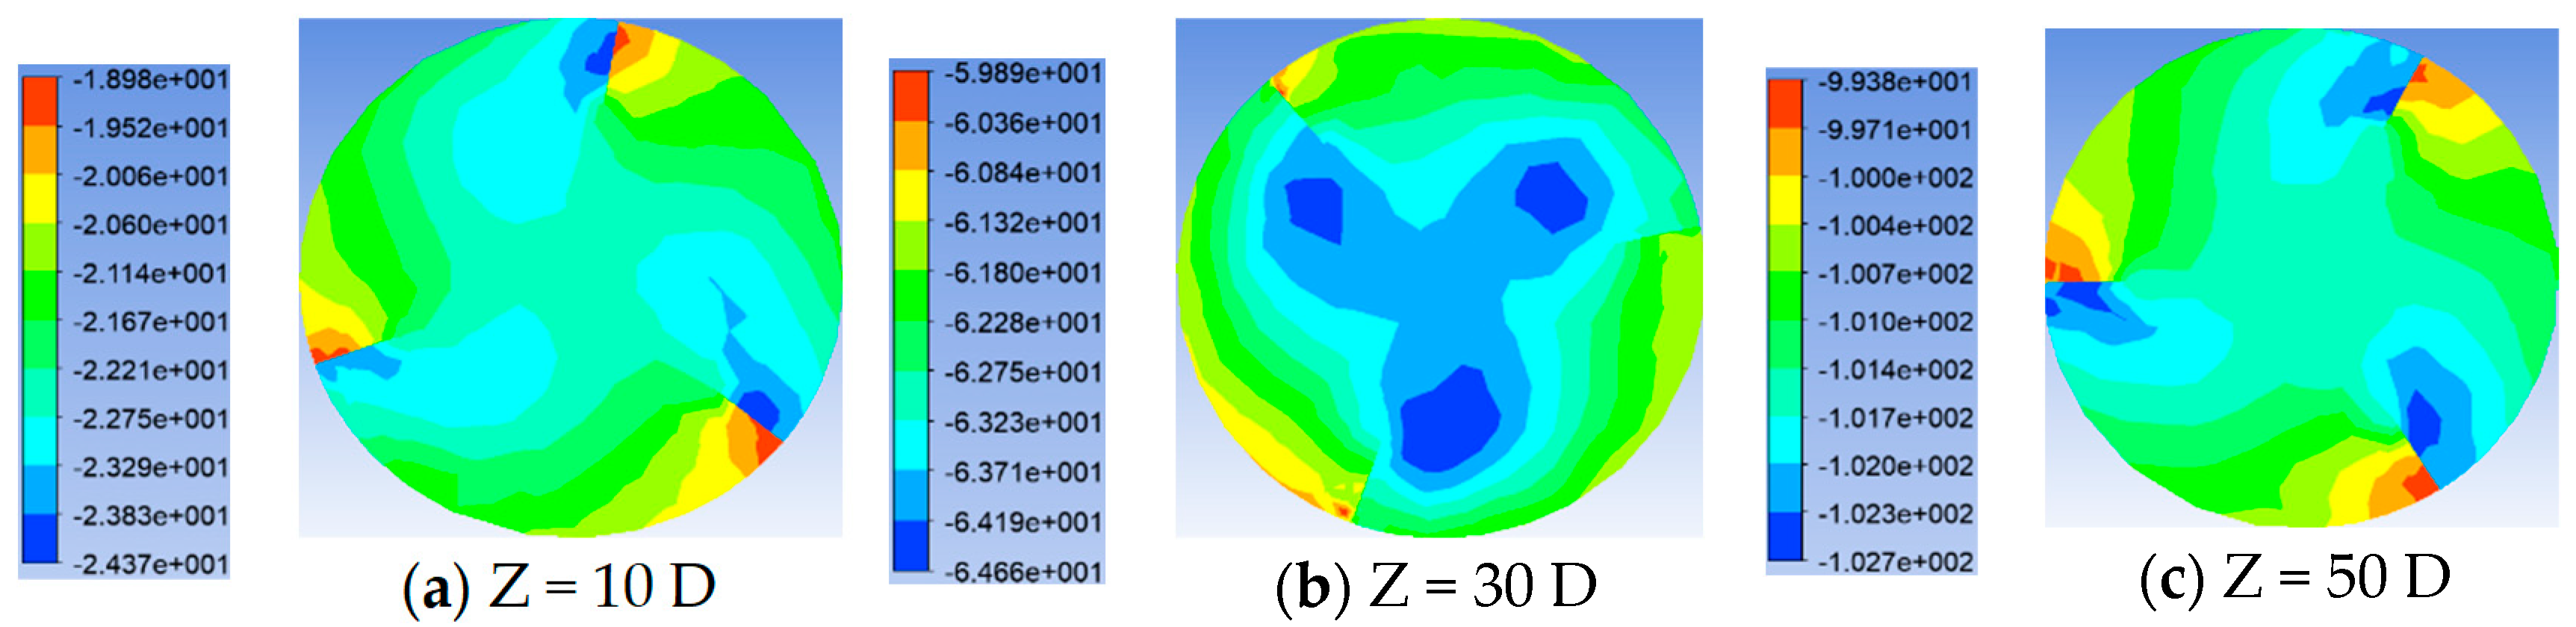
Shown in
Figure 13,
Figure 14,
Figure 15 and
Figure 16 is the pressure distribution diagram of different heights under Re = 20,000. From the figure, compared with the above that put the angle on pressure distribution, draft height difference on the pressure gradient is not big, each pipe section pressure distribution level is relatively clear, the pressure maximum appears on the windward side of the draft, the pressure minimum area appears on the side of the draft plane and the pipe axis, and pressure distribution about the center is 120° rotation symmetry distribution. As the height of the strip increases, the pressure maximum area on the windward surface of the strip increases. In terms of the pressure value, the higher the height of the twist tape, the greater the pressure. As shown in
Figure 17, the influence of different-height twist tapes on the pressure drop at the Re = 20,000 working condition is shown. It can be seen from the figure that with the increase in the transmission distance, the influence of the diversion strip height on the pipeline pressure drop gradually becomes larger, and the higher the height, the greater the pressure drop.
3.5.3. Effect of the Number of Current Twist Tape on the Pressure Distribution Law
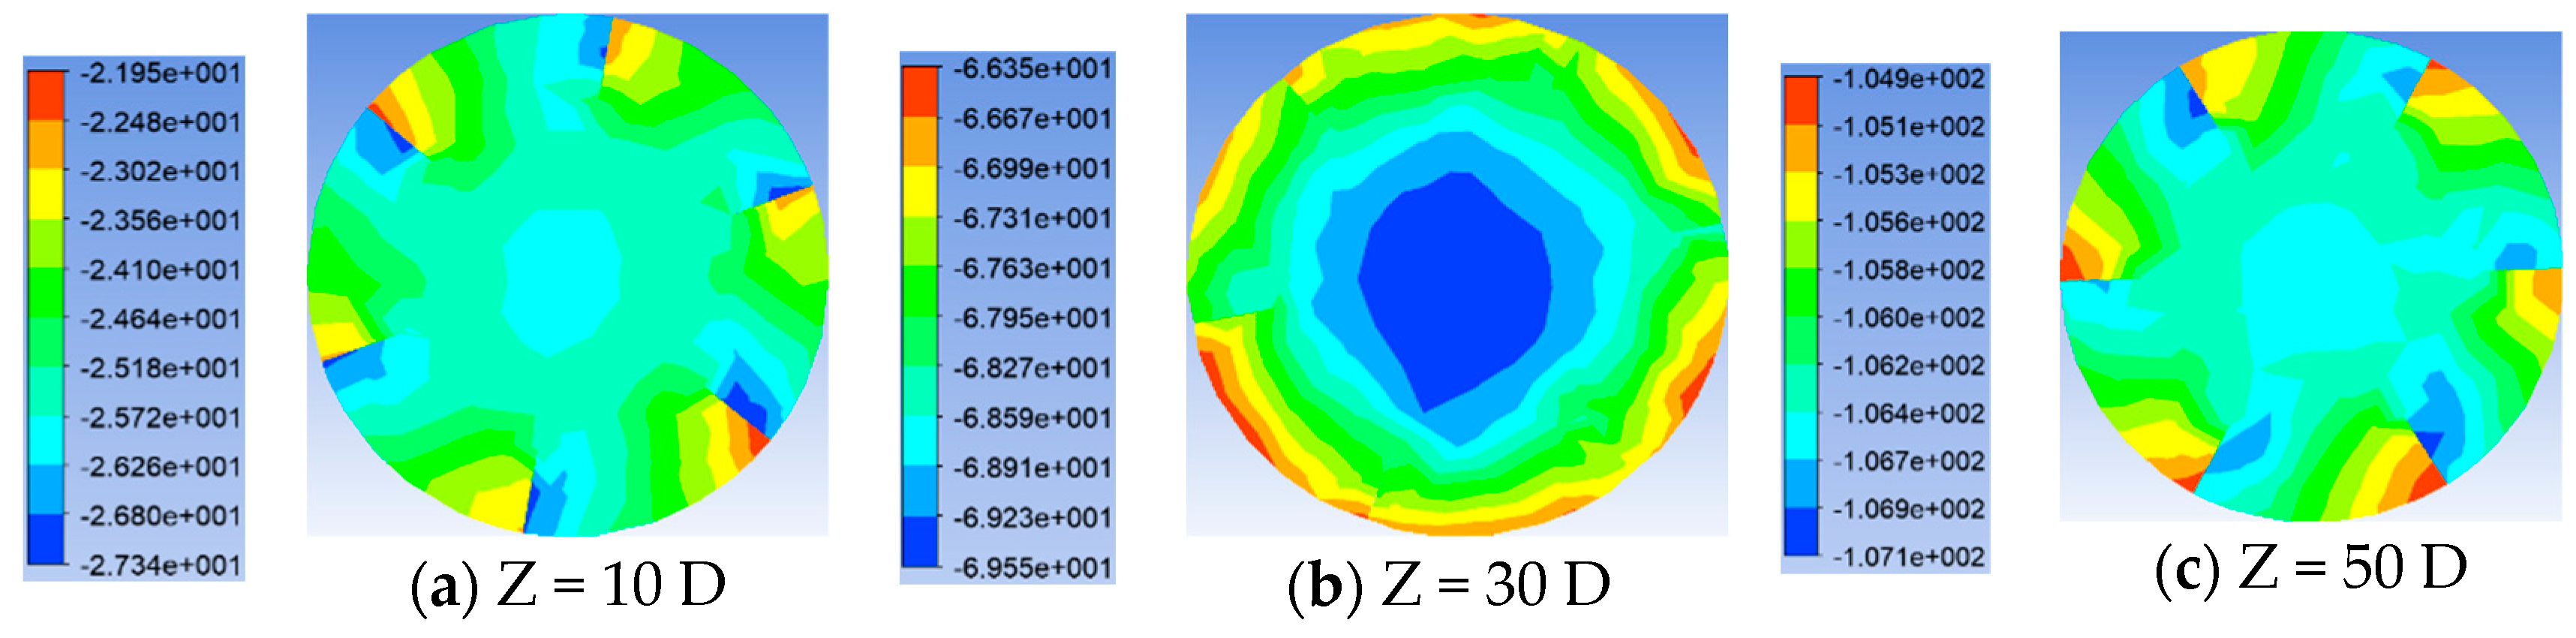
Shown in
Figure 18,
Figure 19 and
Figure 20 are the pressure distribution maps of different numbers of twist tape pipes under Re = 20,000. It can be found from the figure that the pressure distribution in the pipe is 360°/n rotated about the center of the circle. As the number of twist tape increases, the pressure maximum area on the wind side of the twist tape increases, the high pressure area on the pipe section also increases, and the pressure minimum area is close from the lee surface of the twist tape to the axis position of the pipe. Shown in
Figure 21 is the influence of the different number of twist tapes on the pressure drop under the Re = 20,000 working condition. As can be seen from the figure, with the increase in the transmission distance, the influence of the increasing number of twist tape on the pipeline pressure drop gradually increases. The higher the number, the greater the pressure drop. The pressure drop curve almost coincides with
n = 3 and
n = 4, while the pressure drop increases significantly with
n = 6.
4. Conclusions
This study employs the discrete phase model (DPM) and the RNG k-ε turbulence model to simulate swirl flow transport in pipelines containing hydrate particles. We investigate the effects of various twist tape parameters on the velocity field, turbulent dissipation, turbulent kinetic energy, and pressure distribution of the hydrate particles. The findings provide significant insights into the dynamics of swirling fluid flows in gas–solid two-phase systems. Our analysis reveals that the axial velocity distribution within the pipeline exhibits substantial variation, with the most notable changes occurring at sections with a 120° flow angle. Near the twist tape, the axial velocity decreases sharply, resulting in a pronounced velocity gradient between the pipe wall and the twist tape. The region surrounding the twist tape demonstrates the densest vector lines, which remain persistent with increasing flow distance, while the axial region exhibits a near absence of vector lines.
Twist tape placement angle emerges as a critical factor influencing velocity dynamics. A larger placement angle enhances tangential velocity while reducing axial velocity. Similarly, an increase in twist tape height amplifies tangential velocity near the axis but suppresses axial velocity. Conversely, a greater number of twist tapes results in reductions in both tangential and axial velocities. The velocity distribution between successive twist tapes follows a distinctive trend: tangential and axial velocities initially increase, then decrease, and subsequently diminish further as the flow progresses downstream.
The turbulence characteristics are equally influenced by twist tape parameters. Larger placement angles intensify turbulence dissipation and turbulent kinetic energy near the twist tape, indicating stronger turbulence intensity. An increase in twist tape height prolongs the decay of turbulent dissipation and turbulent kinetic energy from the pipe wall to the axis, thereby expanding the range of strong helical flow. On the other hand, a higher number of twist tapes reduces the disparity in turbulence strength between the pipe wall and the axis, suggesting a homogenization of turbulence within the flow.
The pressure maximum appears on the windward side of the twist tape, and its minimum appears on the back side of the next twist tape. The pressure between the two twist tapes decreases gradually, and the pressure distribution in the tube is symmetrically distributed at 360°/n. The larger the placement angle of the twist tape, the clearer the pressure gradient distribution and the greater the pressure drop along the line. The higher the height of the twist tape, the greater the pressure maximum area range on the windward surface of the diversion strip and the greater the pressure drop along the course. The higher the number of the twist tape, the greater the range of the high pressure area on the pipe section, and the minimum pressure area gradually draws close from the lee plane of the diversion strip to the position of the pipe axis. At section 65D, the pressure drop increases gradually with the increase in the orientation angle and increases by 36.8%.


 ,
, 


