Article

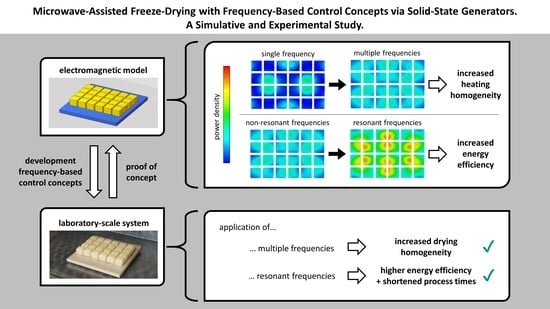
Microwave-Assisted Freeze-Drying with Frequency-Based Control Concepts via Solid-State Generators: A Simulative and Experimental Study

1
Institute of Process Engineering in Life Sciences, Food Process Engineering, Karlsruhe Institute of Technology, 76131 Karlsruhe, Germany
2
Food and Bioprocess Engineering, TUM School of Life Sciences, Technical University of Munich, 85354 Freising, Germany
3
Food Process Engineering, TUM School of Life Sciences, Technical University of Munich, 85354 Freising, Germany
*
Author to whom correspondence should be addressed.
Processes 2023, 11(2), 327; https://doi.org/10.3390/pr11020327
Submission received: 5 December 2022 / Revised: 12 January 2023 / Accepted: 16 January 2023 / Published: 19 January 2023

Abstract

:
Freeze-drying is a common process to extend the shelf life of food and bioactive substances. Its main drawback is the long drying time and associated high production costs. Microwaves can be applied to significantly shorten the process. This study investigates the effects of modulating the electromagnetic field in microwave-assisted freeze-drying (MFD). Control concepts based on microwave frequency are evaluated using electromagnetic simulations. The concepts are then applied to the first part of primary drying in a laboratory-scale system with solid-state generators. Targeted frequency modulation in the electromagnetic simulations enabled an increase in energy efficiency or heating homogeneity throughout MFD while having negligible effects on the power dissipation ratio between frozen and dried product areas. The simulations predicted the qualitative effects observed in the experimental proof of concept regarding energy efficiency and drying homogeneity. Additionally, shortened drying times were observed in the experiments with a targeted application of energy-efficient frequencies. However, differences occurred in the quantitative validation of the electromagnetic models for energy efficiency in dependence on frequency. Nevertheless, the models can be used for a time-efficient investigation of the qualitative effects of the control concepts. In summary, frequency-based control of MFD represents a promising approach for process control and intensification.

Graphical Abstract

1. Introduction

Conventional freeze-drying (CFD) is an essential unit operation in many process chains of the food and pharmaceutical industries. The reason for the widespread use of CFD is the preservation of valuable quality characteristics, such as the high retention of valuable ingredients [1,2,3], advantageous rehydration properties [1], and high volume retention [4]. The product-preserving characteristic of CFD is associated with the exclusion of liquid water and prevailing low temperatures [5], as well as the exclusion of oxygen from the process [4]. The freeze-drying process is generally composed of three stages, which may overlap in time [6]:
  • Freezing of the product;
  • Primary drying, in which frozen water is removed by sublimation;
  • Secondary drying, in which the remaining water is removed from the product.
Drying times for food and pharmaceuticals range from hours to days. When using CFD for drying pharmaceuticals, primary drying is usually the most expensive and time-consuming step [7]. In the drying of food, secondary drying is often skipped for economic reasons. Therefore, there is great potential in optimizing the lengthy primary drying stage for foods and pharmaceuticals.
In CFD, the enthalpy of sublimation is usually supplied by the mechanisms of thermal conduction and thermal radiation, originating from the temperature-controlled shelves or the walls of the process chamber. In contrast, microwave-assisted freeze-drying (MFD) applies electromagnetic waves to provide the enthalpy of sublimation. Through interactions of microwaves with the product, electromagnetic energy is converted into heat directly in the product [8]. Thus, limitations from heat transfer resistance to the sublimation front can be circumvented. This makes MFD especially suitable for products in which heat transfer limits the drying rate, e.g., materials with high porosity, such as foams, or materials with low thermal conductivity. Several papers in the literature have shown a significant reduction in drying time for MFD in comparison to CFD [9,10,11]. This could potentially offset the economic disadvantages resulting from the need for additional process equipment and the use of electrical energy to supply the enthalpy of sublimation. Moreover, no temperature gradient from the product surface to the sublimation front is necessary for heat transfer in MFD. While in CFD, the energy input may be restricted due to temperature limits at the product surface, this does not apply to MFD.
Ma and Peltre [12,13] investigated the MFD of beef in a two-part study with a theoretical and experimental part as early as 1975. Since then, a large number of studies on MFD have been conducted with various materials. Examples include experimental studies on the drying of foods [11,14,15,16], starter cultures [17], pharmaceuticals [18], and model products [19]. Furthermore, MFD has been studied in simplified one-dimensional thermodynamic models [20,21] as well as in more complex electromagnetic models coupled with thermodynamic models [19].
However, microwave-assisted processing using conventional magnetrons as microwave generators is subject to limitations. Luan et al. [22] demonstrated fluctuations in the frequency spectrum of identical household microwave ovens depending on various factors. This makes reproducible process control difficult to impossible. Moreover, corona discharges may occur during the application of microwaves, especially at pressures common for freeze-drying [11] and high peaks of microwave power. The latter is typical when using magnetrons due to common on-off control. These discharges threaten product quality and lead to unnecessary power consumption. Limitations of the magnetron pose a constraint on the controllability of microwave-assisted processes. This is especially true for microwave-assisted drying, in which the non-uniform energy input into the product is a particular problem [23].
One possible approach to overcome these challenges is the deployment of the so-called solid-state generator (SSG) for the generation of microwaves, which is based on semiconductor technology. In contrast to magnetrons, the SSG enables the targeted electrical control of frequency, power, and phase shift. In combination with the possibility of measuring the forward and reflected powers as feedback parameters, SSGs enable the development of so-called “smart” systems for microwave-assisted processing, capable of detecting the state of the product and influencing the relevant parameters of the electromagnetic field [24]. The influence of power splitting between multiple microwave sources and phase shift on microwave heating, as enabled by SSGs, has already been investigated by Bianchi et al. [25]. Their study showed that it is possible to achieve desired energy efficiencies or heating homogeneities via modulation of the electromagnetic field. Varying the frequency during microwave-assisted processes in experiments enabled more homogeneous temperature profiles compared to operation at single frequencies [26,27,28]. Yang et al. [27] also demonstrated that energy efficiency could be increased by the selective application of multiple frequencies, chosen based on heating uniformity and heating rate. However, a higher heating rate, associated with high energy efficiency, resulted in less heating homogeneity in comparison to a process only optimized for heating homogeneity. Yakovlev [29] detected a higher heating homogeneity in electromagnetic simulations compared to single frequencies by applying multiple frequencies. The observation was valid for equidistant as well as resonant frequencies. In addition, higher energy efficiency was found when energy-efficient resonant frequencies were used compared to an alternative control approach using equidistant frequencies. The above results show the potential of selectively controlling the electromagnetic field to increase both energy efficiency and heating homogeneity in microwave-assisted processing. However, there appears to be a trade-off between the two parameters in which pure maximization of one comes at the expense of the other.
To the best of our knowledge, no studies have been published on the modulation of the electromagnetic field during drying. In contrast to heating processes, the dielectric properties of the product change considerably throughout drying due to the removal of water. The change in material properties, in turn, affects the electromagnetic field within the process chamber [30] (pp. 300–302). This results in a complex coupling of electromagnetic and thermodynamic processes. Whereas there are numerous studies dealing with the modeling of CFD, e.g., [7,31,32], there are only a few works on modeling MFD, e.g., [19,20,21]. In some of the latter, the assumption of a spatially homogeneous microwave field was made [20,21] to solve a thermodynamic model. In the work of Wang et al. [19], a thermodynamic model was coupled with an electromagnetic model, but drying was only simulated at a constant frequency of 2.45 GHz. Similarly, MFD with SSGs has only been carried out experimentally at a constant frequency of 2.45 GHz [18]. Thus, the investigation of a targeted modulation of the electromagnetic field during MFD emerges as a gap in knowledge that provides an opportunity for further research.
The present work, therefore, aims to investigate the effects of modulating the frequency of the electromagnetic field during MFD. For this purpose, electromagnetic models are developed to represent the MFD of chunky tylose gel, which is used as a model food product. By simulating multiple discrete drying states, the models are decoupled from the thermodynamics of the process. The dielectric properties of the product, which are required for the models, are determined experimentally. The verified models are then used to investigate the effects of different frequency-based control concepts on energy efficiency and heating homogeneity in MFD. Subsequently, the control concepts are applied in a laboratory-scale MFD system to provide proof of concept for the first part of primary drying, which ended with the removal of 20 wt% of the water contained at the start of MFD. In the experiments, the effects of frequency modulation on drying time, energy efficiency, and homogeneity of drying are investigated in the context of qualitative comparability with simulation results.

2. Materials and Methods

2.1. Electromagnetic Model

2.1.1. Governing Equations and Assumptions

Maxwell’s equations [33] are the fundamental equations forming the basis for the electromagnetic models representing MFD. Maxwell’s equations in their differential form [34] (p. xiii) are given as
· D = ρ V ,
· B = 0 ,
× E = B t ,   and
× H = J + D t .
In Formulas (1)–(4), E is the electric field intensity and D the electric flux density. Respectively, H represents the magnetic field intensity and B the magnetic flux density. ρ V is the electric charge density, J is the electric current density, and t denotes the time. Perfect electrical conduction is set as a boundary condition at the walls of the process chamber and the waveguide.
The electromagnetic waves interact with the materials in the process chamber and convert electromagnetic energy into heat in lossy dielectrics. The complex relative permittivity ε r , defined as
ε r = ε r i ε r ,
is used to characterize these interactions. ε r is the relative dielectric constant and ε r the relative dielectric loss factor. Dielectric losses through all mechanisms are lumped in ε r . The dielectric properties depend on a variety of factors, including temperature, frequency of electromagnetic waves, aggregate state, and composition of the dielectric, see, e.g., [35]. In the simulations of the present work, the dielectric properties are only differentiated between the dried and the frozen regions of the product. The influences of temperature and frequency are neglected.
The average volume-specific power absorption P a v V is calculated in the electromagnetic simulations in analogy to
P a v V = 2 π f ε 0 ε r E r m s 2
as defined by Metaxas and Meredith [36] (p. 72). In Formula (6), f represents the frequency of the electromagnetic field, ε 0 the vacuum permittivity, and E r m s the root mean square of the electric field strength.
In the present work, there is no coupling of the electromagnetic models with thermodynamic equation systems to simulate mass and heat transfer. The influence of the drying progress on the electromagnetic field is represented by the simulation of several discrete drying states of primary drying in MFD. The drying state z characterizes the proportion of the dried volume divided by the volume of the entire product. Thus, z = 0% corresponds to a completely frozen product, while z = 100% corresponds to a completely dried product. The drying states from 0% to 100% are simulated in an interval of 10% via separate electromagnetic models, which are solved numerically. The progress of drying in these simulations is represented by a uniform retraction of the frozen volume from all sides into the sample interior, leaving a dried outer layer. The total volume of the products is assumed to be constant throughout drying.

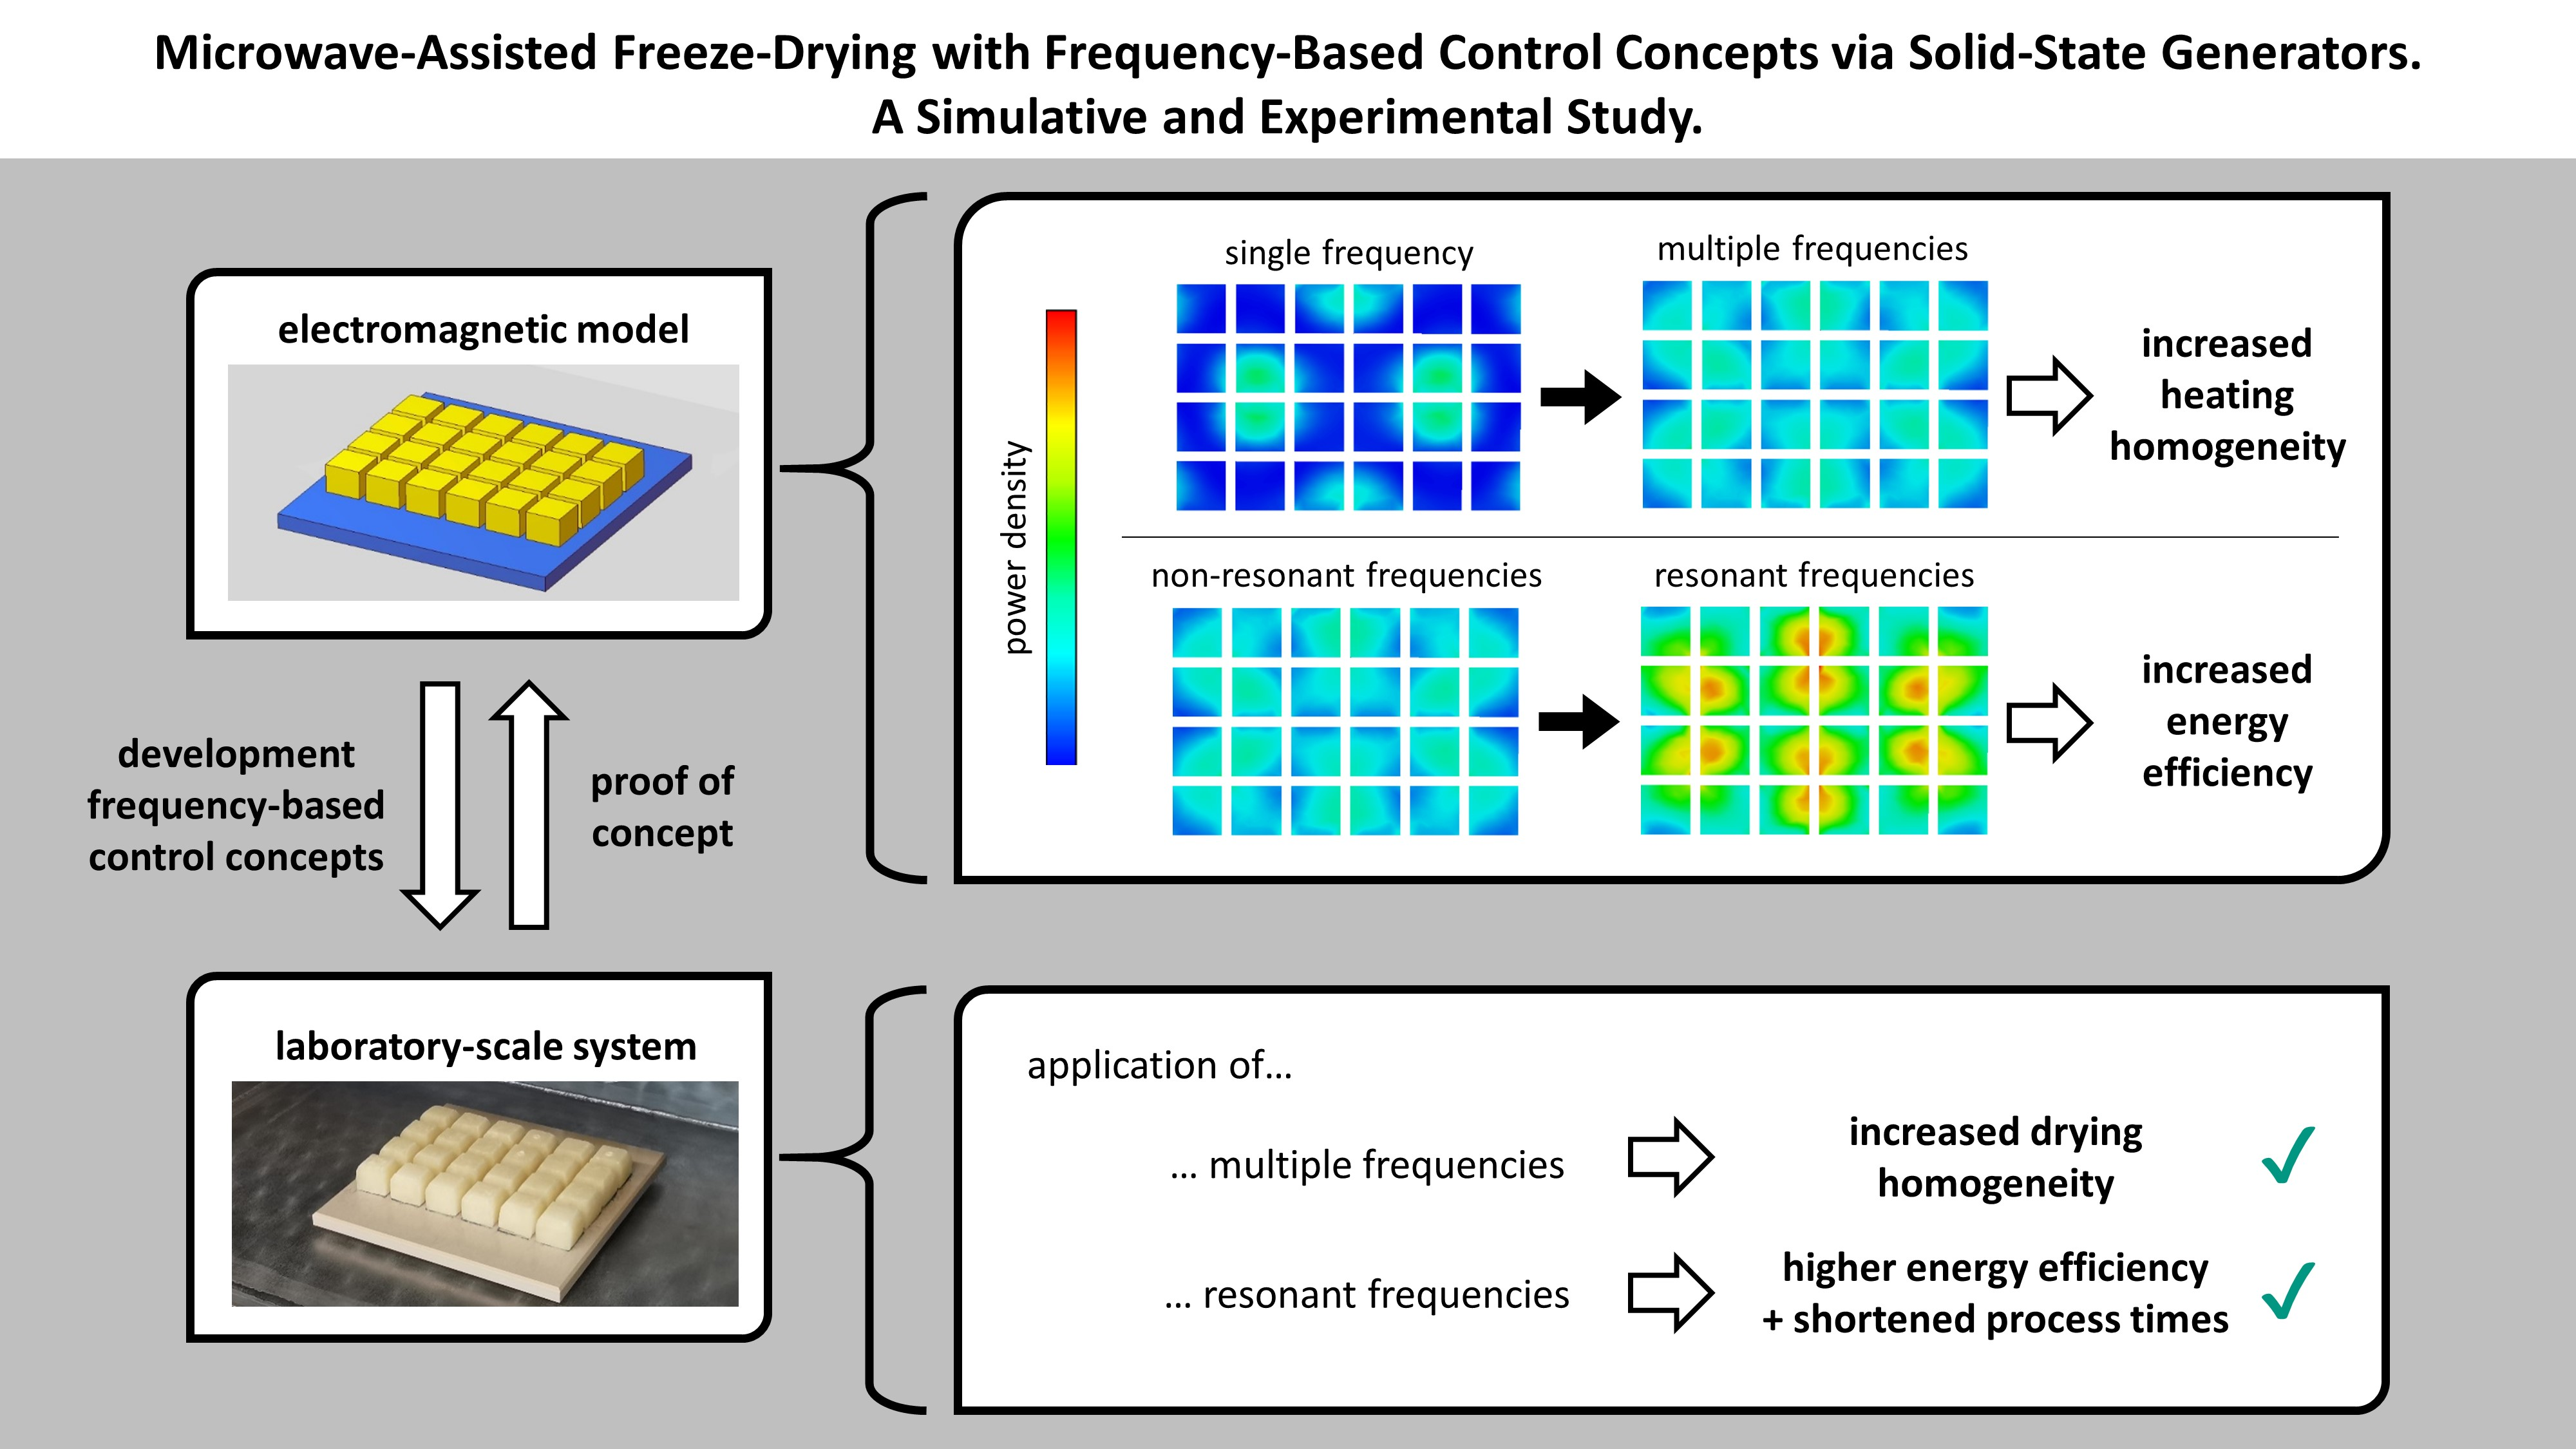
2.1.2. Model Specifications

Figure 1 shows the process chamber and the arrangement of the materials utilized in the electromagnetic models. These resemble the experimental arrangements in the process chamber for MFD. The process chamber is a cuboid cavity with dimensions of 612 mm × 400 mm × 300 mm, as described in the work of Yakovlev [29]. A WR340 waveguide is placed in the center of the top of the cavity. Centrally on the bottom of the cavity, a plate made of polyether ether ketone (PEEK) with a base area of 200 mm × 200 mm is located as product support. The support is connected to the bottom of the cavity by two cylinders made of PEEK. A set of 24 tylose gel samples (25 mm × 25 mm × 20 mm) is centrally located on the product support in a 6 × 4 arrangement, each 5 mm apart. The dried and frozen regions of the product were assigned the dielectric properties of the dried and frozen tylose gel, respectively. The remaining space inside the cavity was set to the dielectric properties of a perfect vacuum. The dielectric properties of the materials are listed in Table 1. The properties of tylose gel were determined experimentally in the present work and are displayed in Section 3.1. as a function of temperature.

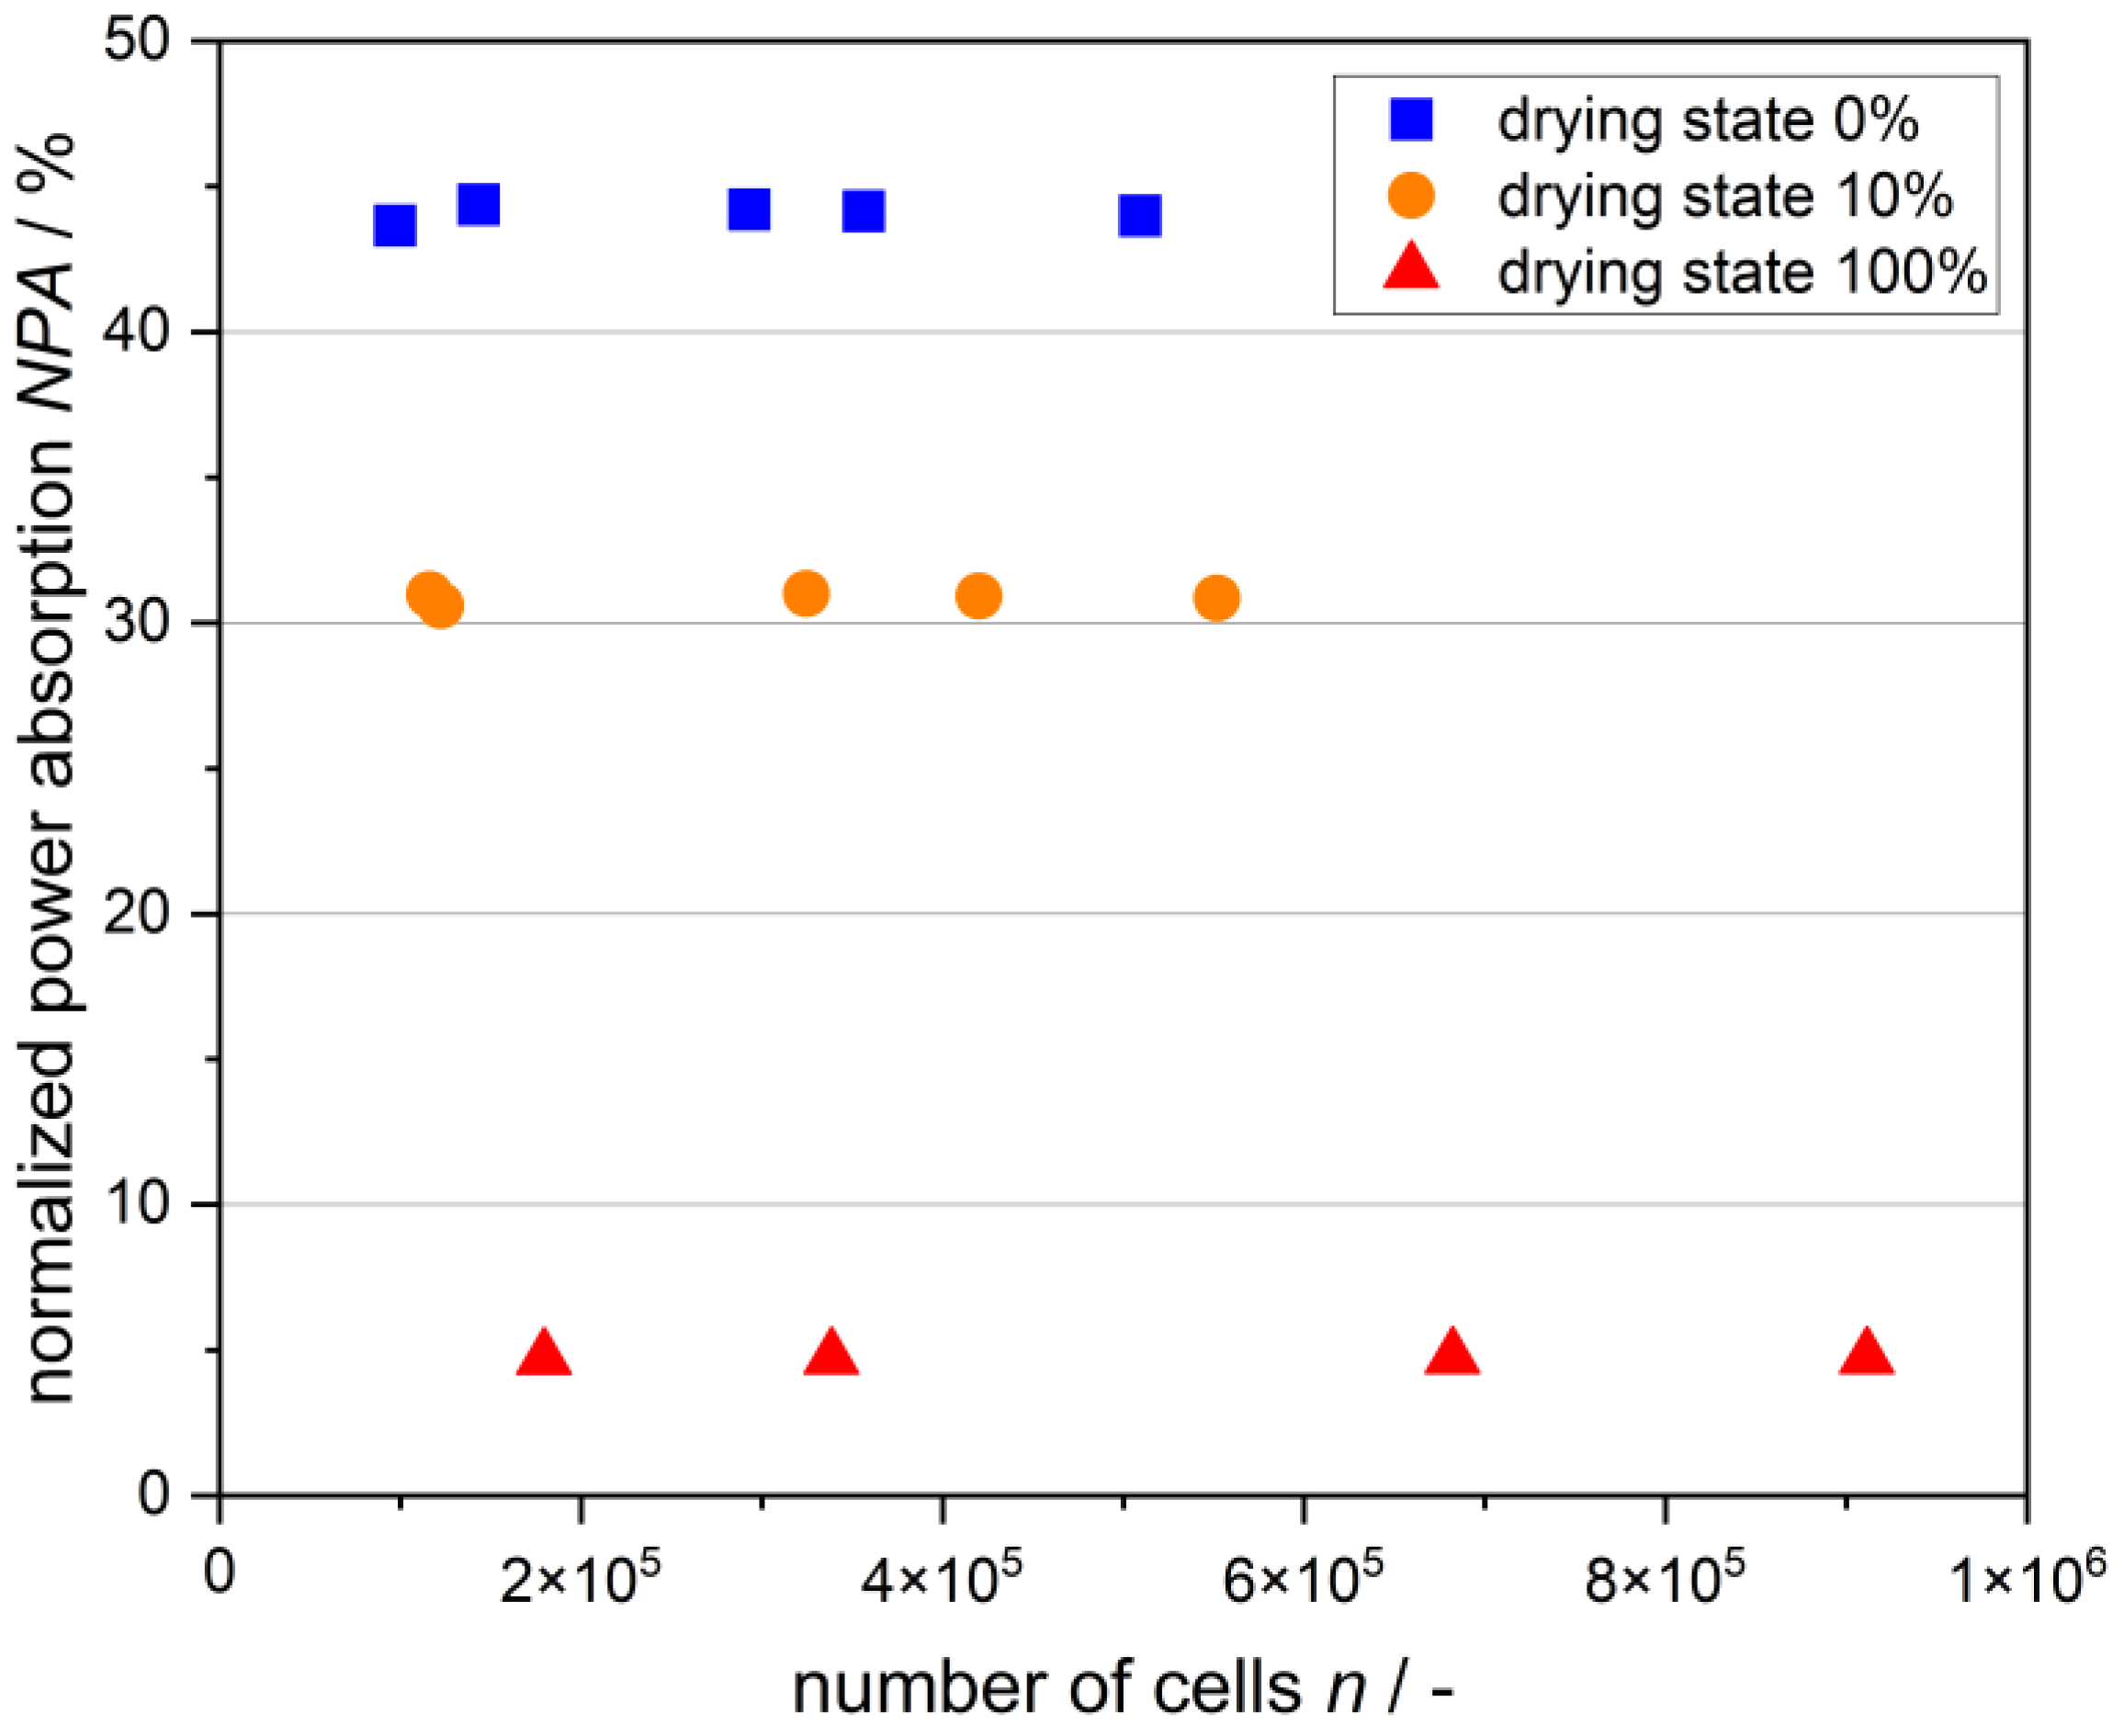
2.1.3. Simulation Procedure

For the electromagnetic simulations, the Frequency Domain Solver in the software CST Studio Suite 2020 (Dassault Systèmes, Vélizy-Villacoublay, France) was used. The simulations were performed on the parallel computer system bwUniCluster 2.0 + GFB-HPC, a state service within the framework of the Baden-Württemberg Implementation Concept for High-Performance Computing. Core count and memory were varied according to the requirements of the simulations up to a maximum of 32 cores and 150 GB RAM. First, a grid study was performed to verify the simulations at the drying states 0%, 10%, and 100%. Afterward, the models of the 11 drying states were solved numerically in the frequency range of 2.4 GHz to 2.5 GHz. In the first simulation runs, the frequencies used in the control concepts were identified and the corresponding monitors for field parameters were set. The results of the subsequent runs were evaluated in post-processing.

2.1.4. Post-Processing

CST-Studio provides the scattering parameter S 11 in the investigated frequency range of 2.4 GHz to 2.5 GHz as an output. The energy efficiency was calculated from the simulation results for a single port system with
η = 1 | S 11 | 2
according to Więckowski et al. [38]. Therefore, only the conversion of electromagnetic energy into heat was considered in the calculation of energy efficiency. The efficiency of microwave generation was excluded. This allowed for comparison with experimental results, as the SSG provided a record of a comparable data set.
The effects of the following frequency-based control concepts were investigated in post-processing for every drying state:
  • Single Minimum Frequency (1MF)—the single frequency with the global minimum of energy efficiency;
  • Single Resonant Frequency (1RF)—the single frequency with the global maximum of energy efficiency;
  • Six Equidistant Frequencies (6EF)—frequencies from 2.4 GHz to 2.5 GHz in the interval 0.02 GHz;
  • Six Resonant Frequencies (6RF)—six frequencies with the highest local maxima of energy efficiency.
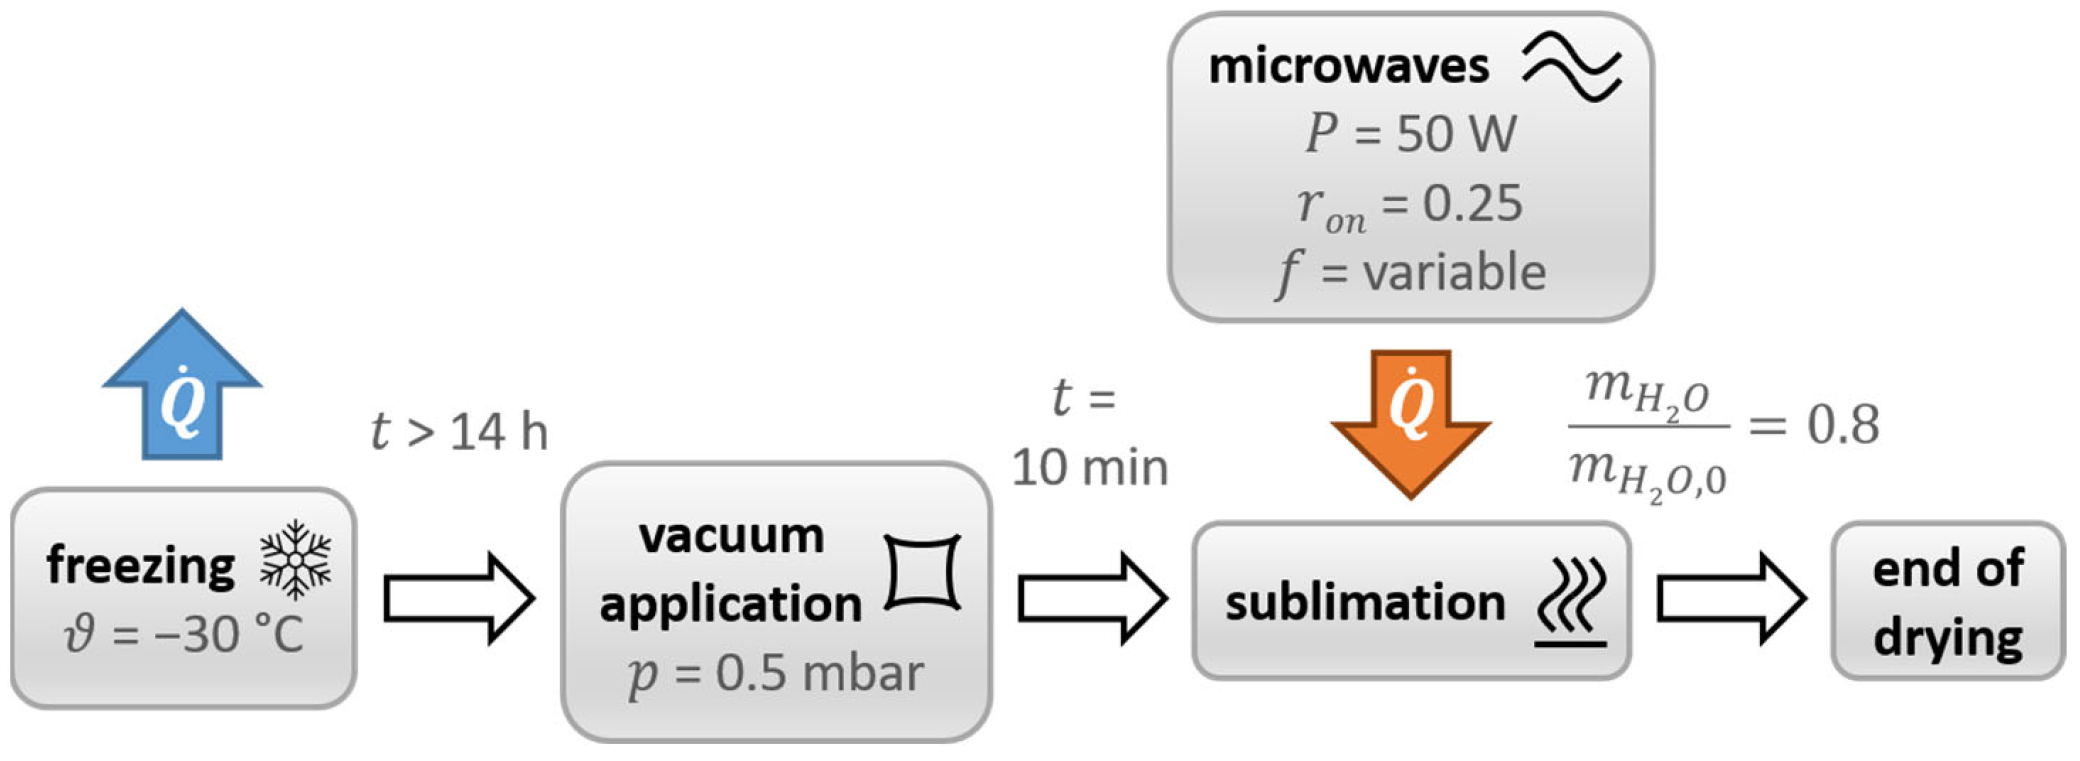
For every simulated drying state, the average energy efficiency η ¯ was calculated for the control concepts according to
η ¯ = i = 1 n η i n
as the arithmetic mean of the energy efficiencies η i at the n frequencies applied.
Monitors of the volume-specific power absorption were set for all frequencies utilized. Additionally, the integral dissipated power in the frozen and dried volumes of the individual samples was calculated. Therefore, the spatially resolved power dissipation patterns between and inside the individual samples could be investigated.
The heating homogeneity factor ζ was determined as
ζ = P d , m a x P ¯ d
and thus defined as the ratio of the maximum integral dissipated power P d , m a x in a single sample to the average dissipated integral power in all samples P ¯ d . Hence, ζ is a standardized measure of the maximum dissipated power in a single product. When multiple frequencies were applied in a control concept, the homogeneity factor was calculated from an equally weighted superposition of all the power dissipation patterns involved.

2.2. Experiments

2.2.1. Model Product

Derivatives of methyl cellulose, known by the trade name tylose, have already been used as a model food product both to study microwave-assisted heating [35,39] and to study freezing [40,41]. Thus, the material is ideally suited for an investigation of MFD. In this work, a tylose gel based on a powder of methyl 2-hydroxyethyl cellulose was used as a model product. The tylose gel is composed of 76.23 wt% demineralized water, 22.77 wt% Tylose MH1000 (Kremer Pigmente, Aichstetten, Germany), and 1.00 wt% L-(+)-ascorbic acid (Carl Roth, Karlsruhe, Germany). Demineralized water was heated to 65 °C at 200 rpm using a heatable magnetic stirrer C-MAG HS 7 (IKA Werke, Staufen im Breisgau, Germany). The appropriate amount of L-(+)-ascorbic acid was dissolved in water and the solution was kneaded with the tylose powder to form a homogeneous mass. The tylose gel was weighed at 12.50 g for each sample, formed into cuboids of approximately 25 mm × 25 mm × 20 mm, and frozen at −30 °C for at least 14 h. To avoid water loss in the frozen state, the product was packed airtight before freezing.

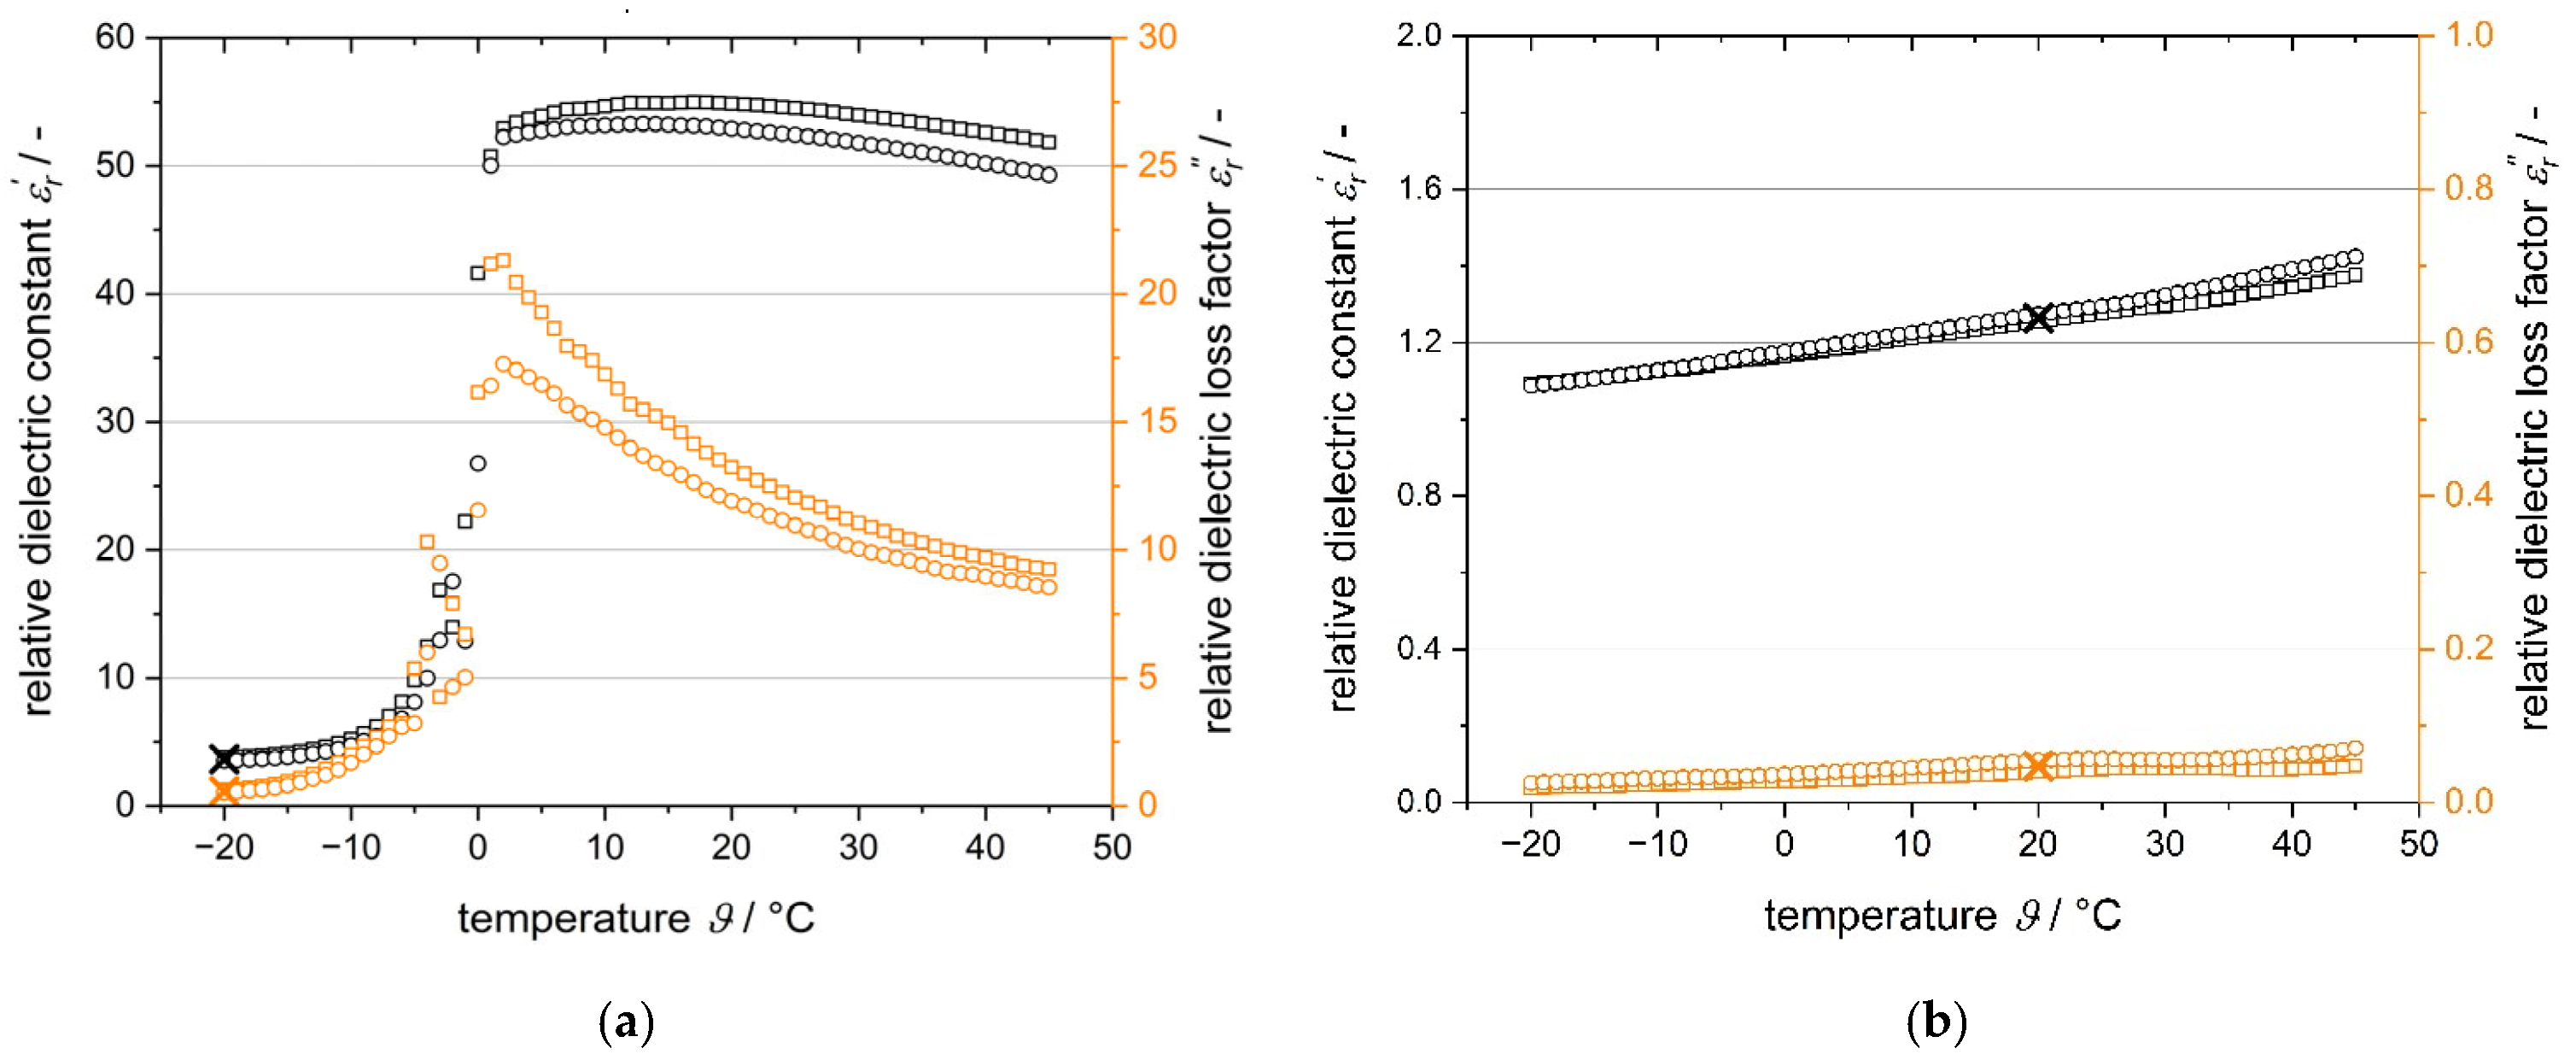
2.2.2. Dielectric Properties
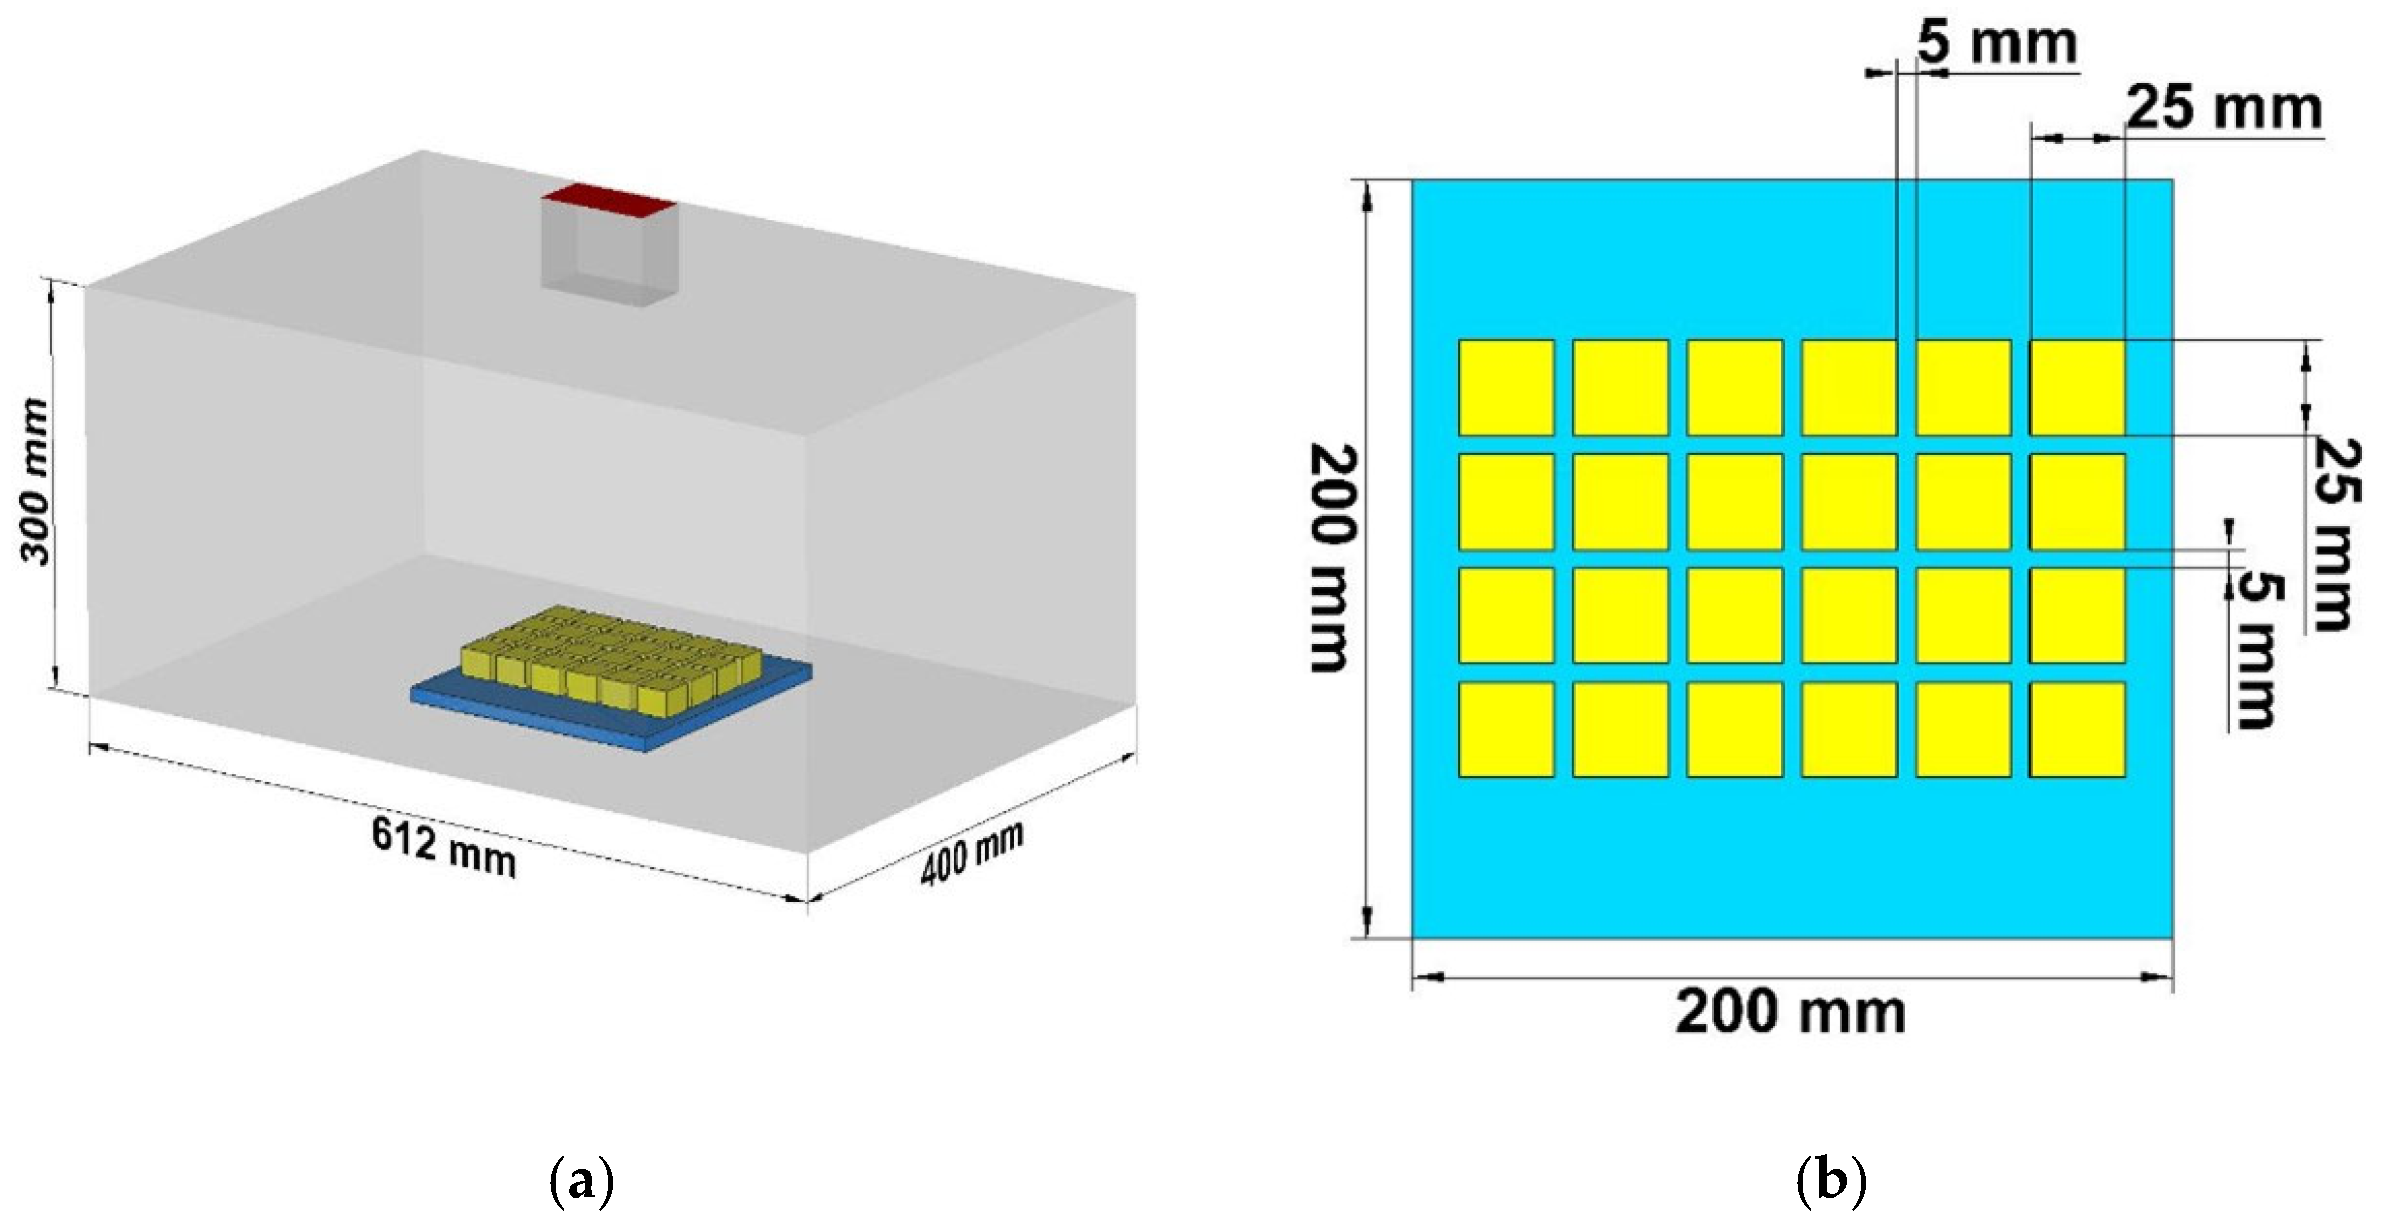
The dielectric properties of the fresh and freeze-dried samples were measured with a μWaveAnalyser (Püschner, Schwanewede, Germany) in a temperature range of −20 °C to 45 °C. The sample was tempered to −20 °C before measurement. The temperature of the measuring head was set to −20 °C with a connected external cooling system (Unistat 161 W, Huber, Offenburg, Germany). The pre-tempered sample was inserted into the μWaveAnalyser and equilibrated for 1 h. Subsequently, the temperature was continuously increased at 0.1 K/min to 45 °C. Dielectric property measurements were performed at a frequency of 2.45 ± 0.05 GHz and recorded every 30 s using μWaveAnalyser 3.2.0 software (Püschner, Schwanewede, Germany). Measurement of an empty vial served as a reference. The temperature was recorded using the software SpyControl 2.0 (Huber, Offenburg, Germany) and a temperature sensor (PT100, Huber, Offenburg, Germany), which was inserted into the measuring head.
All measurements were conducted in duplicate. Time-dependent dielectric measurement data and time-related temperature data were processed in Matlab R2019a (MathWorks, Natick, MA, USA).

2.2.3. MFD System

Figure 2 depicts the schematic setup of the laboratory-scale MFD system. The process chamber with dimensions of 612 mm × 400 mm × 300 mm is manufactured from stainless steel. A P 65 D vacuum pump (SASKIA, Ilmenau, Germany) is connected to the process chamber. Between the vacuum pump and the process chamber is a cold trap (UCCT, Vienna, Austria) set to a temperature of −60 °C. A WR340 waveguide is centrally embedded in the top of the process chamber. An HY2020 SSG (TRUMPF, Freiburg, Germany) is connected to the waveguide at the cavity via a coaxial cable. The generator has a maximum output power of 500 W and can be tuned in the frequency range of 2.4 GHz to 2.5 GHz with an accuracy of 0.01 MHz. In addition to the reflected and forward microwave power as well as the respective frequencies, the weight of the product and the pressure in the process chamber are recorded online via Matlab R2020b (MathWorks, Natick, MA, USA). The sensors used are a CMR363 capacitive pressure sensor (Pfeiffer, Aßlar, Germany), a PW4MC3/2kg load cell (Hottinger Brüel & Kjaer, Darmstadt, Germany), and the internal sensors of the HY2020 SSG. The pressure in the process chamber as well as the frequency and power of the microwave field can be adjusted via the self-made process control system. In the present work, the pressure in the system was set to 0.5 mbar.

2.2.4. Process Characterization and Drying Procedure

The 24 frozen tylose gel samples were placed centrally on the product support in the process chamber in a 6 × 4 arrangement with a spacing of 5 mm in accordance with the electromagnetic models (see Figure 1). Ten minutes after the vacuum was applied in the process chamber, the SSG was switched on and process characterization or drying was started.
For the process characterization, a frequency sweep in the range of 2.4 GHz to 2.5 GHz was performed at an interval of 0.1 MHz with the minimally possible power of 50 W. The forward power P f and reflected power P r were recorded at each frequency. By inserting the respective values in the formula
η = 1 P r P f ,
the energy efficiency η of the conversion of electromagnetic energy into heat could be calculated for each frequency in the experiments. This enabled the detection of resonant frequencies, which are defined as local maxima of energy efficiency.
For drying via MFD, the control concepts 1MF, 1RF, 6EF, and 6RF were applied in accordance with the simulations. The power of the SSG was set to 50 W. Since preliminary tests had shown product damage with this setting, the output power of the generator was applied for 2.5 s at each frequency and then paused for 7.5 s, corresponding to a ratio r o n = 0.25 of time for active microwave generation to total time. When multiple frequencies were utilized, the frequency loop was run from the lowest to the highest frequency and then the next loop was started at the lowest frequency. The selected frequencies of the individual control concepts were kept constant during the process runs. The average energy efficiency η ¯ in the experiments was calculated in analogy to Formula (8) as the arithmetic mean of the values of all frequencies for each loop if several frequencies were applied. Otherwise, η ¯ corresponds to the value of the respective individual frequency. A loss of 20 wt% of the water mass was used as a termination criterion. The results of the first phase of primary drying are sufficient to provide a proof of concept and are simple in their implementation since no frequency adjustment is required. In addition, incomplete primary drying allows detailed observation of drying homogeneity since the differences in sample weights are more pronounced than in complete drying. Figure 3 depicts a schematic overview of the process steps during MFD.
The process characterization and drying runs were conducted in triplicate. Before and after each experiment, the samples were weighed on a Type 1518 balance (Sartorius, Göttingen, Germany). The samples were then cut in half and visually inspected for macroscopic product damage. This was followed by gravimetric determination of residual moisture for each sample to evaluate the homogeneity of drying. For this purpose, the freeze-dried samples were dried in a drying oven T 6060 (Heraeus, Hanau, Germany) at 105 °C for at least 24 h. Subsequently, the weight of the samples was determined using a precision balance LS 220A SCS (Precisa, Dietikon, Switzerland) and used to determine the drying homogeneity between the samples.

3. Results and Discussion

3.1. Dielectric Properties

The dielectric properties of fresh tylose gel, shown in Figure 4a, vary considerably in the temperature range studied. This temperature-dependent behavior of dielectric properties ε r and ε r of fresh tylose gel is in line with the literature [35]. The largest increase is detected in the range of −10 °C to 2 °C. This phenomenon can be explained by the melting of frozen water. As the dielectric properties of water at microwave frequencies [42] are much higher than those of ice [43], partial melting of frozen water from approximately −5 °C leads to a significant increase in dielectric properties. The slight increase at lower temperatures, namely −20 °C to −5 °C, is probably caused by an increasing fraction of liquid water in the tylose gel with increasing product temperature, as elucidated in previous studies based on differential scanning calorimetry of tylose gel [44]. The higher ε r value of the tylose gel in the present study containing ascorbic acid compared to published data on tylose gel [35] is presumably due to the compositional differences in the tested material. It has been demonstrated that the addition of compounds to tylose gel can lead to changes in dielectric properties, e.g., for sodium chloride [35,45] and sucrose [45]. At about −5 °C to 0 °C, inconsistencies in dielectric property measurement are attributed to measurement errors caused by partial melting of frozen water in this temperature range. The measurement procedure is not feasible for this temperature range of phase transition. Since the dielectric properties at the aforementioned temperatures are not relevant for the remainder of the present work, a detailed discussion is omitted.
The dielectric properties of the freeze-dried tylose gel are much lower than those of the fresh gel, as depicted in Figure 4b. The dielectric properties increase slightly with temperature, probably due to the increasing mobility of the molecules interacting with the electromagnetic field. Because of the lack of phase transitions inside the material, no significant shift in the dielectric properties occurs.
In ice, microwave energy dissipates only to a small extent due to the low dielectric properties [43]. Combined with the low dielectric properties of the freeze-dried tylose gel, this suggests that the microwave energy is dissipated in the frozen product by the interaction of microwaves with bound water, which is contained in the frozen but not in the dried product. This idea is consistent with the literature [21].
Due to the unknown and time-dependent temperature distribution during MFD, no variable dielectric properties were assigned to the product in the simulations. The dielectric properties of the fresh gel at −20 °C were set for the frozen product and the dielectric properties of the dried gel at 20 °C were set for the dried product. The temperature of the frozen product was chosen since the temperature of −20 °C for the frozen product is closest to the ice vapor pressure at the present total pressure of 0.5 mbar, as stated in the literature [46]. The temperature of the dried product is set to room temperature since the differences in the temperature range investigated are relatively minor. The dielectric properties at the respective temperatures are calculated as the arithmetic mean of the duplicate runs and are marked in Figure 4. The exact values of the dielectric properties used in the electromagnetic models are given in Table 1.

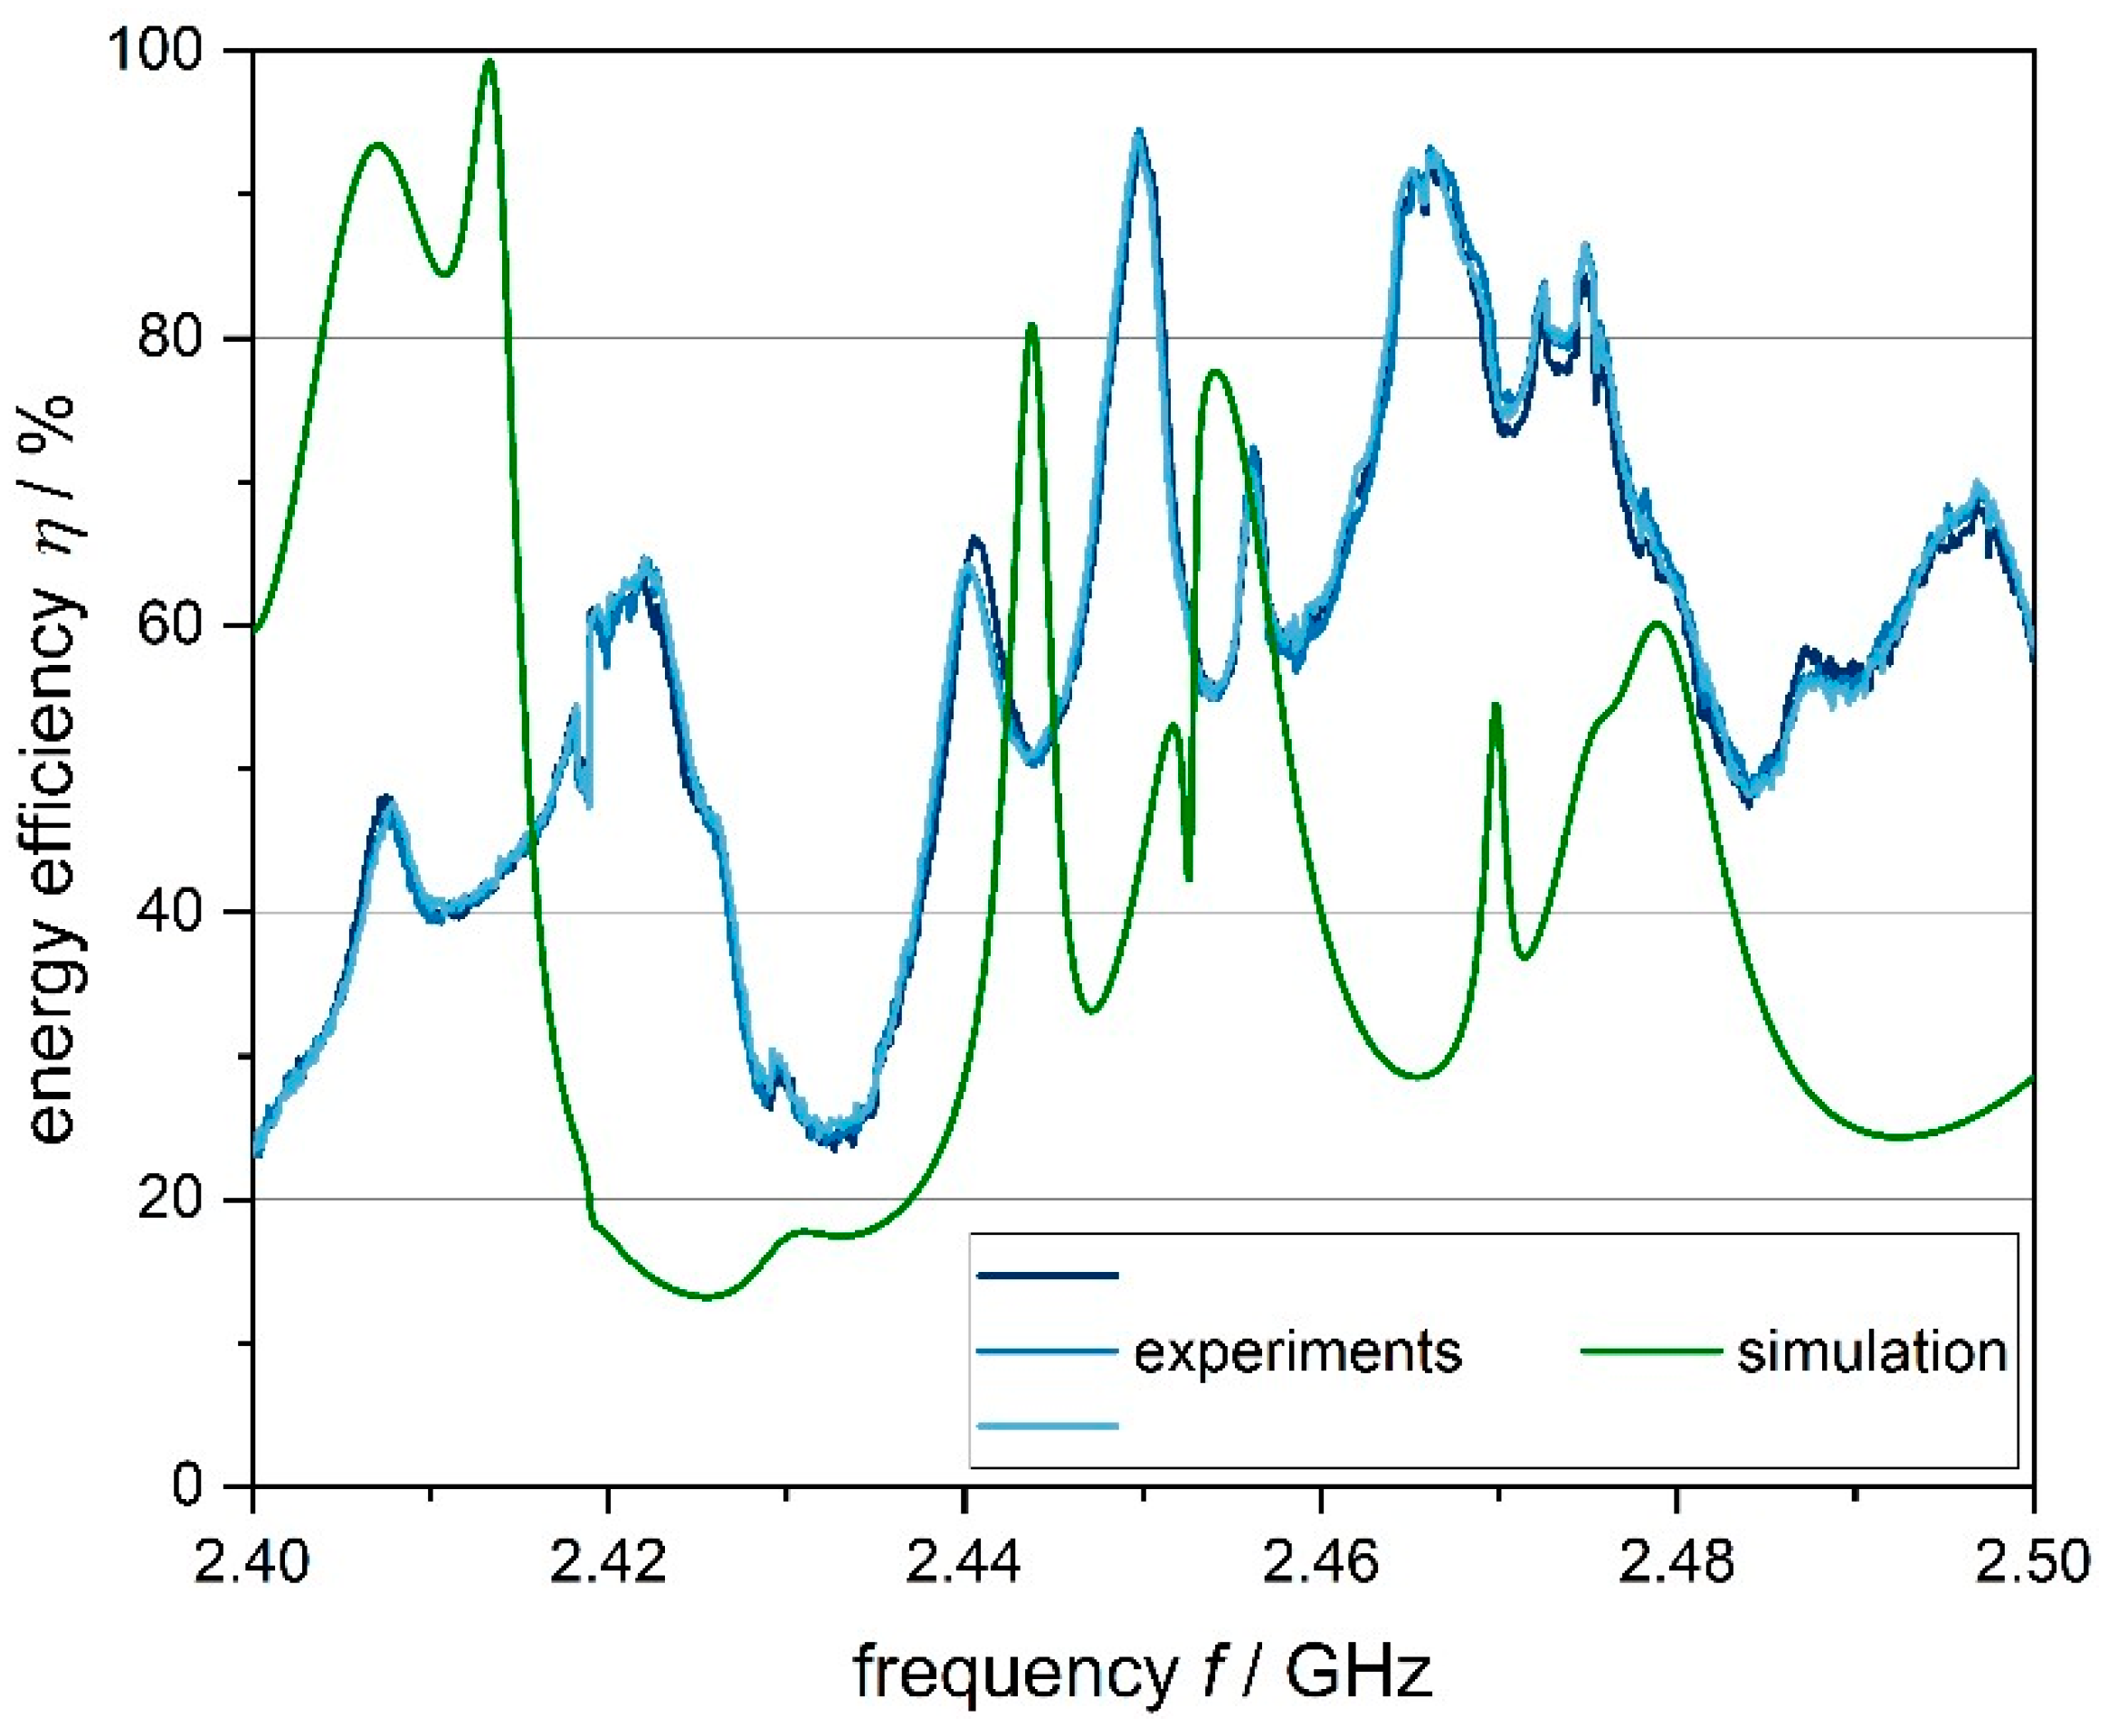
3.2. Model Verification

The normalized power absorption NPA is used in electromagnetic simulations as a parameter to verify the electromagnetic model as a function of the number of cells or time steps in transient simulations [47,48]. In the present work, the NPA for the simulations is defined with
N P A = P d , t o t a l P f
as the ratio of the dissipated power in all materials P d , t o t a l to the forward power of the SSG P f at 2.45 GHz. Figure 5 shows the NPA as a function of the number of cells for the drying states 0%, 10%, and 100%. These represent the start and end of drying as well as a drying state in which the dried product layer is comparably thin, posing a challenge for discretization. The grids with the lowest number of cells of the individual drying states were generated with the same settings of the program for mesh generation. The same applies to the settings for the subsequent higher numbers of cells. The numbers of cells differ for the drying states because the internal mesh generation of the software depends on the composition of the dielectric properties of the materials. For the 100% drying state, only simulations with four instead of five meshes were performed since the computational requirements for the fifth mesh exceeded the available memory space. From the mesh with the third lowest number of cells, there are only minor changes in the NPA. The absolute deviation from the mesh with the highest cell count is only 0.207%, 0.153%, and 0.002% for the drying states 0%, 10%, and 100%, respectively. Therefore, based on these solver settings, a mesh-independent convergent solution can be expected. The settings for this mesh generation are transferred to the models of all drying states.

3.3. Model Validation

Figure 6 depicts the energy efficiency in dependence on the frequency in the range of 2.4 GHz to 2.5 GHz. The data were obtained from an experimental frequency sweep using the SSG and the post-processing of the electromagnetic simulation of the drying state 0%. The simulative results show clearly defined peaks at resonant frequencies, while the results from the experiments at the beginning of drying show both clearly defined peaks and broader peaks with fluctuations in energy efficiency. Presumably, these fluctuations are caused by several resonant frequencies that are closely spaced. Except for the general existence of maxima and minima in a comparable magnitude, no detailed agreement can be observed between the energy efficiency from the simulation and the experimental frequency sweeps. The experimental data, on the other hand, are well reproducible.
Obviously, the electromagnetic model does not provide an exact reproduction of the electromagnetic field in dependence on the frequency. The electromagnetic model would require further revision and validation for an accurate representation of the microwave field. Nevertheless, as long as minima and maxima occur in comparable numbers and magnitudes in both cases, the electromagnetic models can be used to develop frequency-based control concepts in dependence on the energy efficiency of the frequencies to be applied. The models can be regarded as a tool for the time-efficient investigation of the qualitative impact of control concepts throughout drying. Electromagnetic simulations have already been used in the literature to find specific combinations of energy efficiency and heating homogeneity for microwave-assisted heating [25], which can be done with the developed model for MFD. However, the respective model was not validated for the process chamber investigated. Other models of microwave-assisted processes were validated with analytical results in an empty cavity [29], temperatures measured with fiberoptic sensors [21,49], or spatial distributions of heating patterns [50,51]. These methods do not necessarily indicate an accurate representation of the electromagnetic field in the entire frequency range of 2.4 GHz to 2.5 GHz. Therefore, it remains unclear whether the simulated results in the literature are of practical relevance when varying the frequency throughout MFD. The present study aims to overcome this gap via an experimental proof of concept.

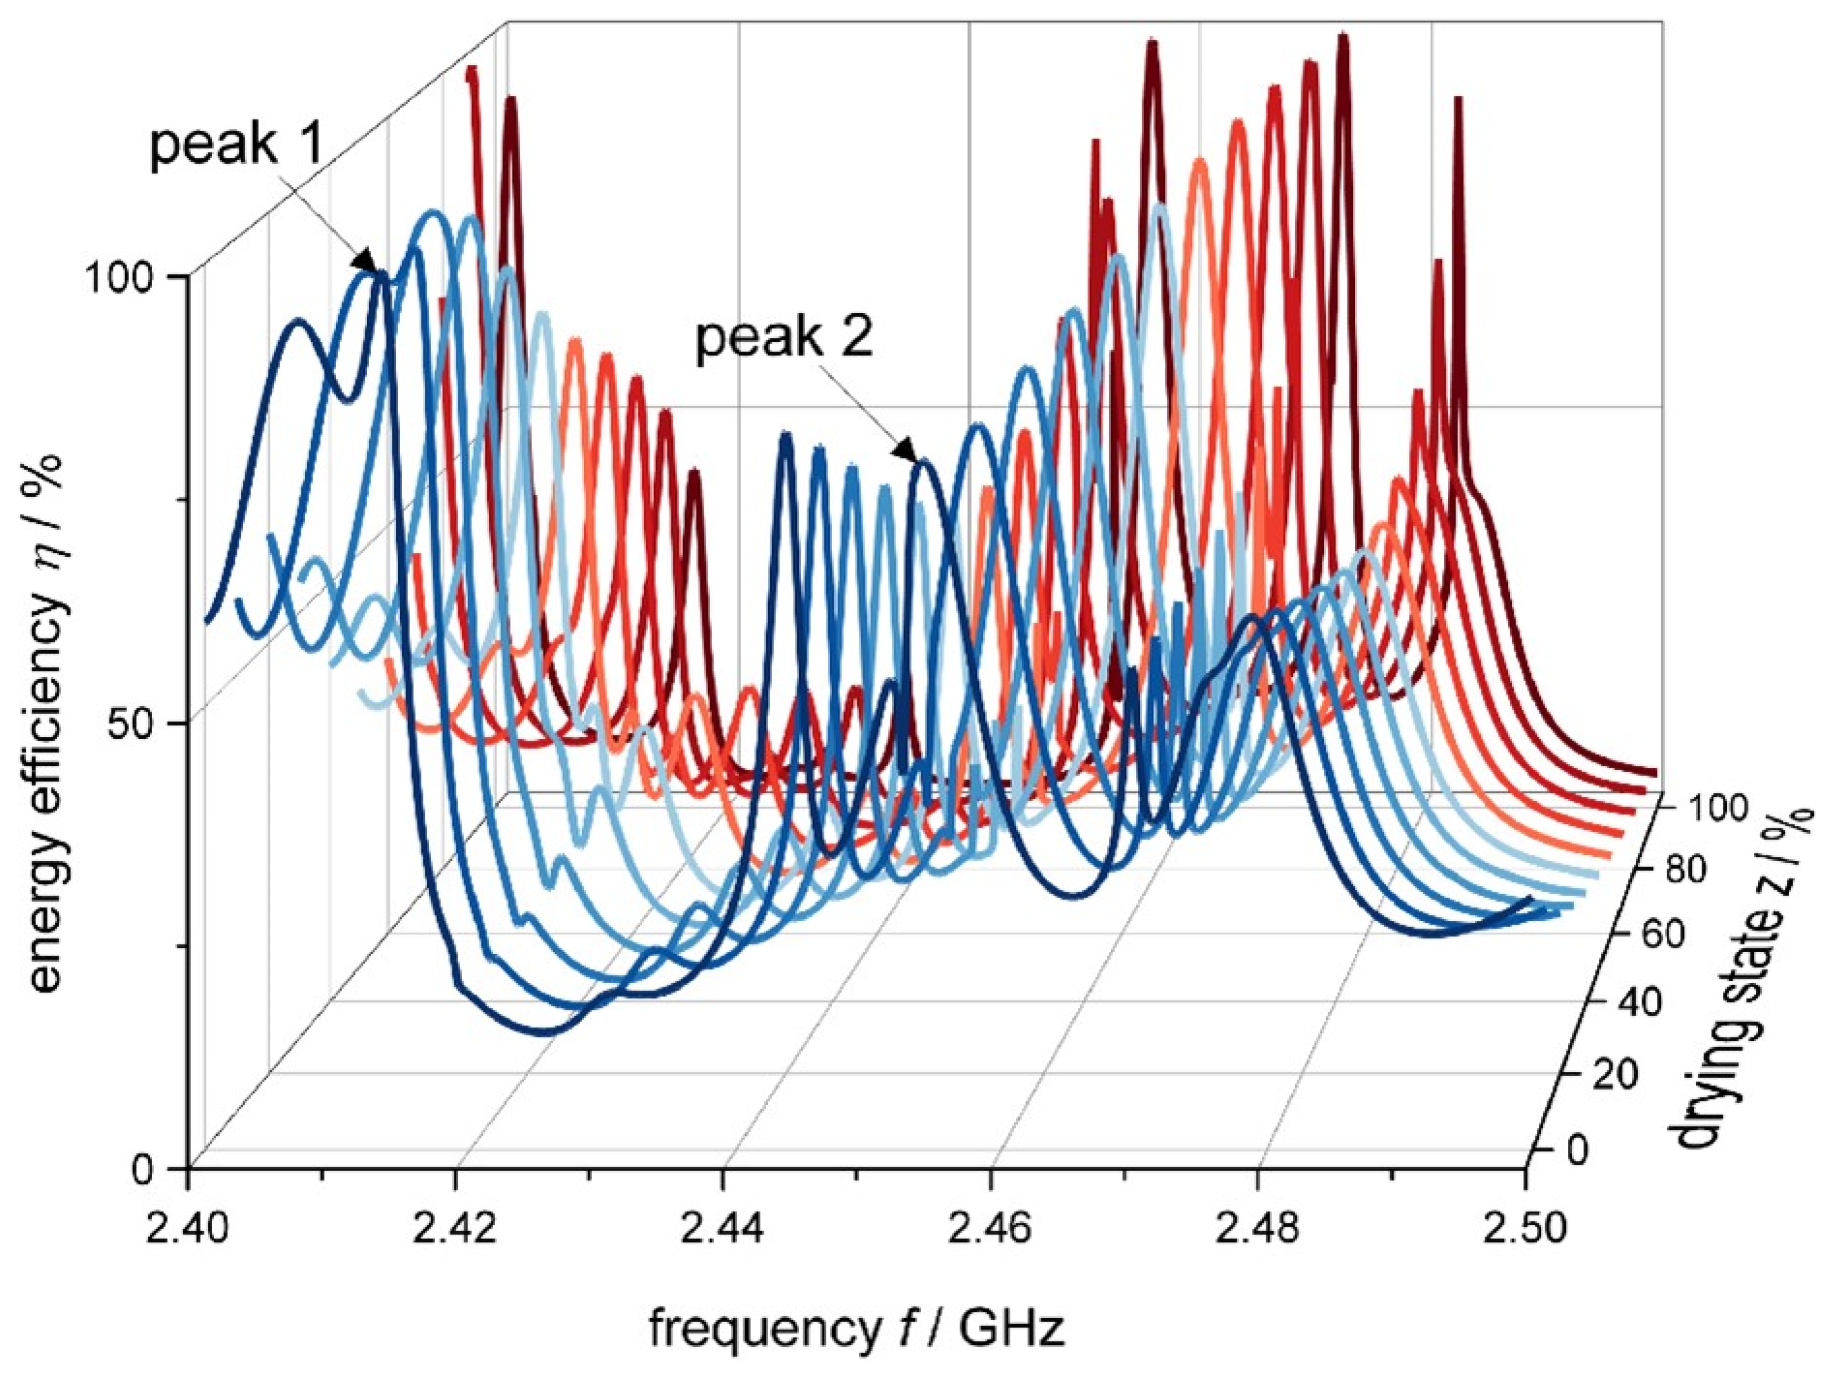
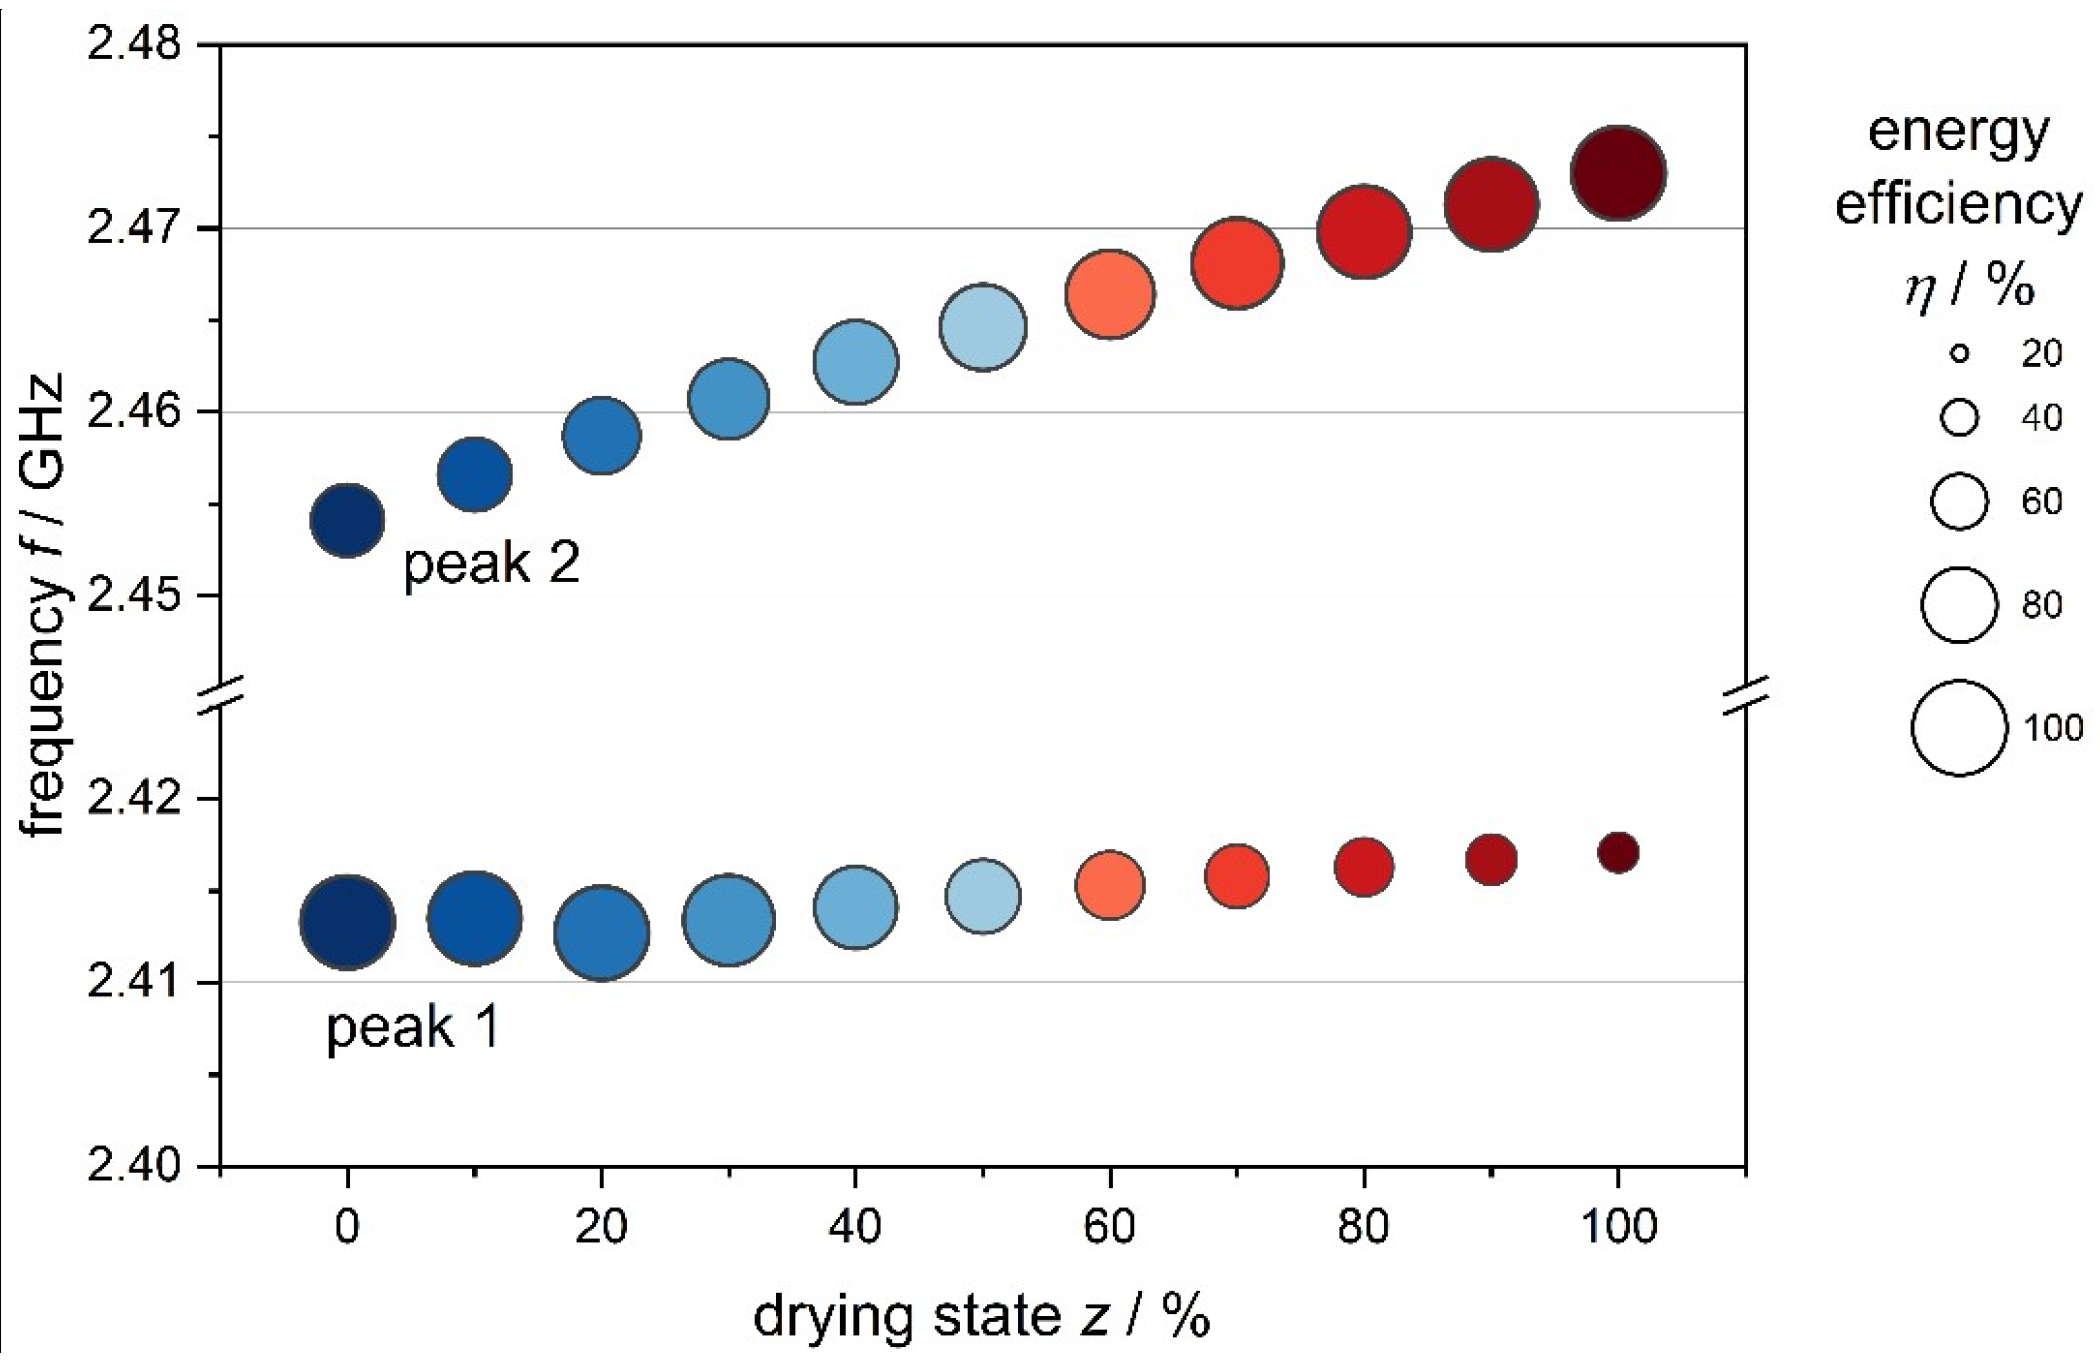
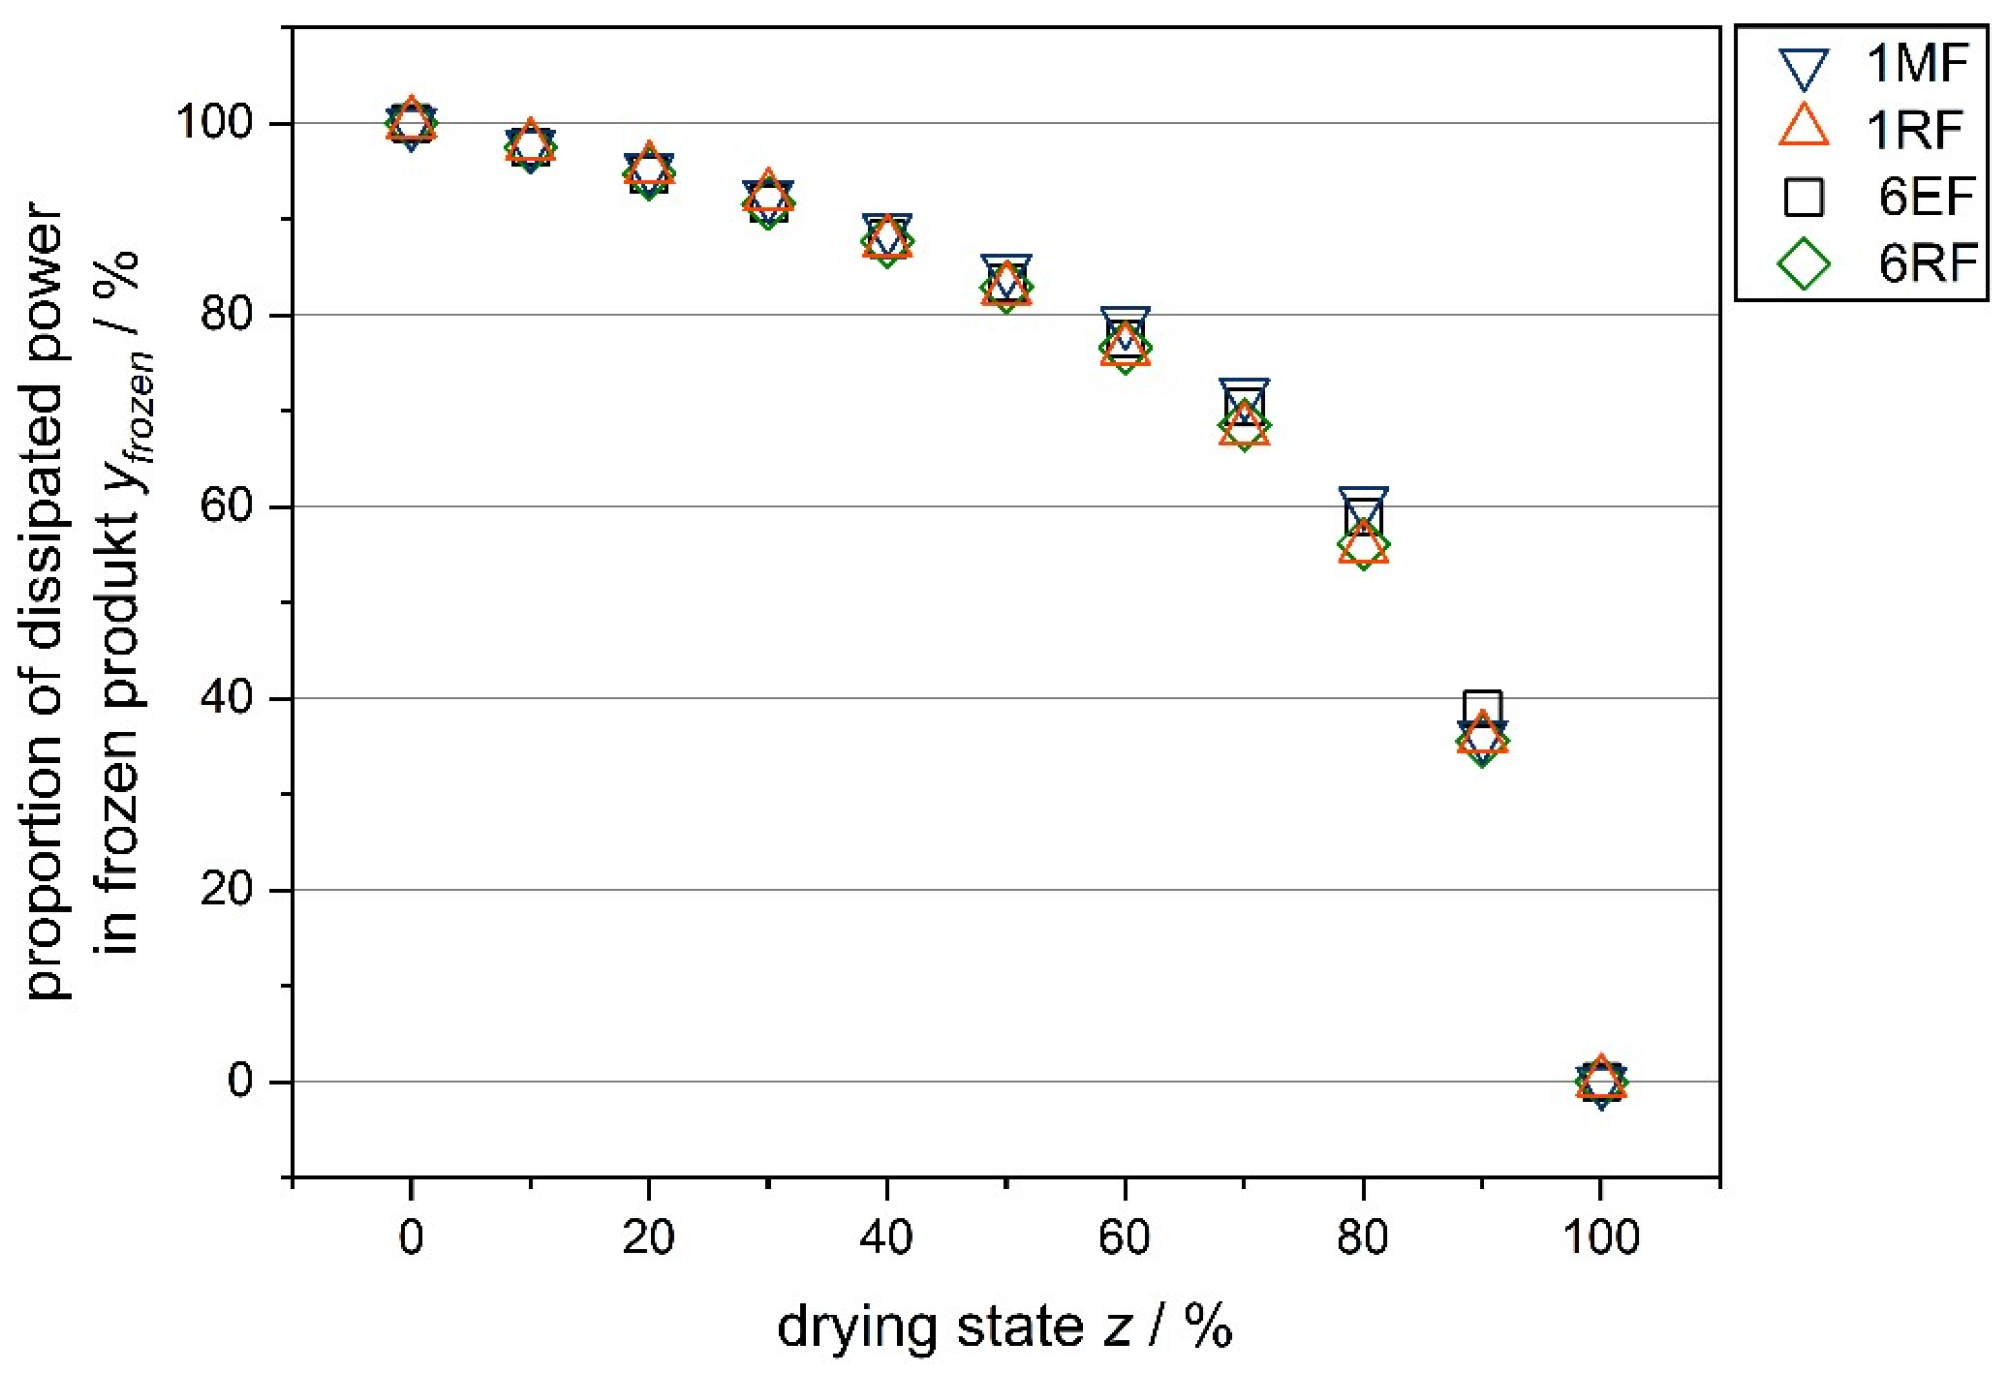
3.4. Effects of Drying State on Energy Efficiency

Figure 7 shows the energy efficiency calculated in the electromagnetic simulations as a function of frequency and drying state. The energy efficiency varies considerably in the frequency range of 2.4 GHz to 2.5 GHz, ranging from 13.2% to 99.3% for the 0% drying state to 3.0% to 99.7% for the 100% drying state. With progressive drying, the average energy efficiency decreases continuously from 42.4% to 19.9% (data not shown). This is consistent with the expected trend due to the increasing proportion of dried tylose gel with relatively low dielectric properties (see Table 1), which leads to lower effective dielectric properties in the cavity. Analogously, a reduction of effective dielectric properties due to a lower product mass results in lower average energy efficiency. This has been demonstrated, for example, in simulations of microwave-assisted heating [52]. Multiple peaks in energy efficiency above 80% for all drying states indicate the potential benefits of a targeted excitation of specific frequencies over the whole course of drying to increase energy efficiency. On the other hand, the disadvantage of non-targeted excitation of microwaves, especially towards the end of drying, becomes apparent.
The frequency-dependent energy efficiencies for adjacent drying states in Figure 7 follow similar curves. The energy-efficient peaks, which indicate the presence of so-called resonant modes, shift to slightly higher frequencies with an increase in the drying state. The observed shift is consistent with theoretical considerations that calculate a shift of resonant modes to higher frequencies for a decrease in effective dielectric properties in a cavity [30] (pp. 300–302). The result suggests that similar resonant modes and associated heating patterns appear in the process chamber throughout multiple drying states.
To investigate the frequency shifts of the peaks further, the frequencies of the representative energy-efficient peaks 1 and 2 over the drying state are depicted in Figure 8. The peaks were chosen since one or the other has the highest energy efficiency during all drying states, making them easy to spot and relevant for the control concepts 1RF and 6RF. The shift to higher frequencies during the drying progress is more pronounced for peak 2 than for peak 1. Therefore, the curve of energy efficiency over frequency is a result of the overlapping of multiple resonant modes in different compositions throughout drying. The cause is presumably the superposition of multiple modes displaying different magnitudes in frequency shift with an increase in the drying state. It is not obvious from the appearance of a peak whether only one mode occurs or a superposition of several modes is present. The lower frequency of peak 1 for the drying states 20% and 30% compared to the previous drying state in Figure 8 contradicts the trend of a shift to higher frequencies. The superposition of the peaks of two resonant modes may be the explanation for this observation. A previously separated resonant mode shifts into the mode at peak 1 from a lower frequency. The superposition results in one local maximum, which is shifted to a lower frequency as the resonant mode from a previously lower frequency is still at a frequency slightly below that of the mode associated with peak 1 in preceding drying states.
The energy efficiency of the peaks in Figure 8 shifts upwards for peak 2 and downwards for peak 1 with an increasing drying state. The occurrence of spatial maxima of the electromagnetic field at locations with lossy dielectrics determines the energy efficiency of the peaks. Since the pattern of the electromagnetic field is not known in advance, no predictions can be made about the energy efficiency of different frequencies throughout drying.

3.5. Effects of Control Concepts

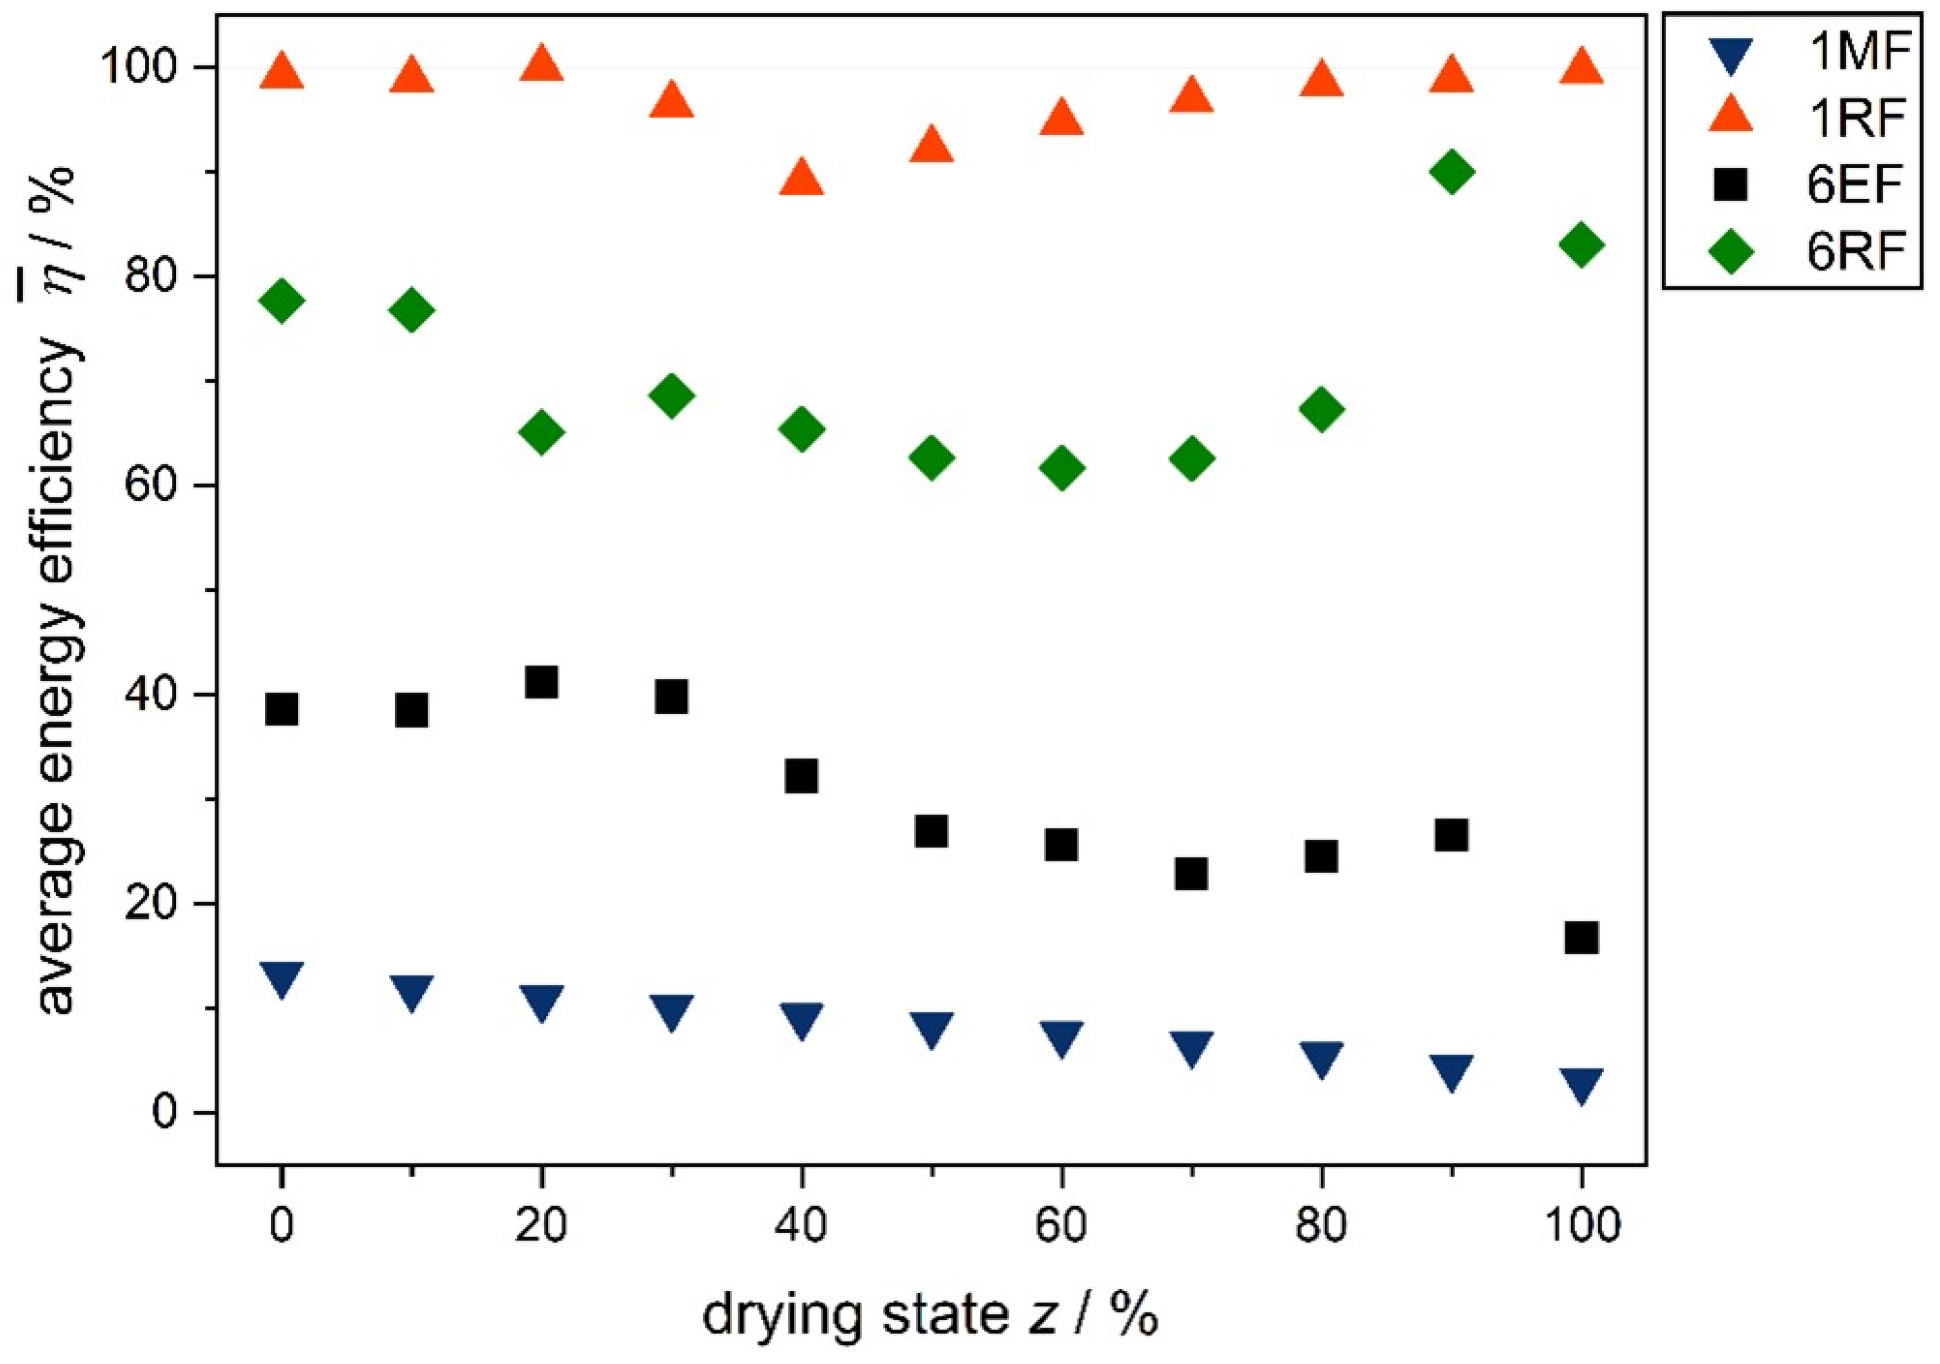
3.5.1. Energy Efficiency

Figure 9 illustrates the average energy efficiency over the drying progress as a function of the applied frequency-based control concepts. A detailed overview of the applied frequencies in the control concepts and their respective energy efficiency is given in the supplementary material in Tables S1 and S2. The energy efficiency for 1RF and 6RF, in which resonant frequencies are applied, is significantly higher than for 6EF and 1MF throughout the entire drying process.
The control concepts 1MF and 6EF show a tendency of decreasing energy efficiency with increasing drying state. These results are consistent with the observations of the decreasing average energy efficiency in the frequency range of 2.4 GHz to 2.5 GHz (see Figure 7). In contrast, the energy efficiencies of 1RF and 6RF decrease at intermediate drying states and return to high energy efficiencies towards the end of drying. This is due to the behavior of the resonant frequencies throughout drying. The energy efficiency of 1RF during MFD is caused by the initial decreasing energy efficiency of peak 1 and, in the later drying stages, the increasing energy efficiency of peak 2 (compare to Figure 8). The decrease in energy efficiency for 6RF up to about the drying state of 70% is consistent with the overall decreasing energy efficiency in the relevant frequency range. The increasing energy efficiency towards the end of drying can at least partially be attributed to a new resonant frequency entering the frequency range of 2.4 GHz to 2.5 GHz due to the shift of resonant modes to higher frequencies (compare Tables S1 and S2 in supplementary material). Electromagnetic simulations in the literature also showed high values of dissipated energy by the application of resonant frequencies, which were chosen based on scattering parameters [53].
In summary, relatively high energy efficiency can be achieved over the entire course of drying when resonant frequencies are applied with 1RF or 6RF. In contrast, the energy efficiency of the remaining control concepts decreases during drying, which leads to inefficient energy input, especially towards the end of drying. This finding highlights the need for a continuous, targeted frequency adjustment throughout drying.

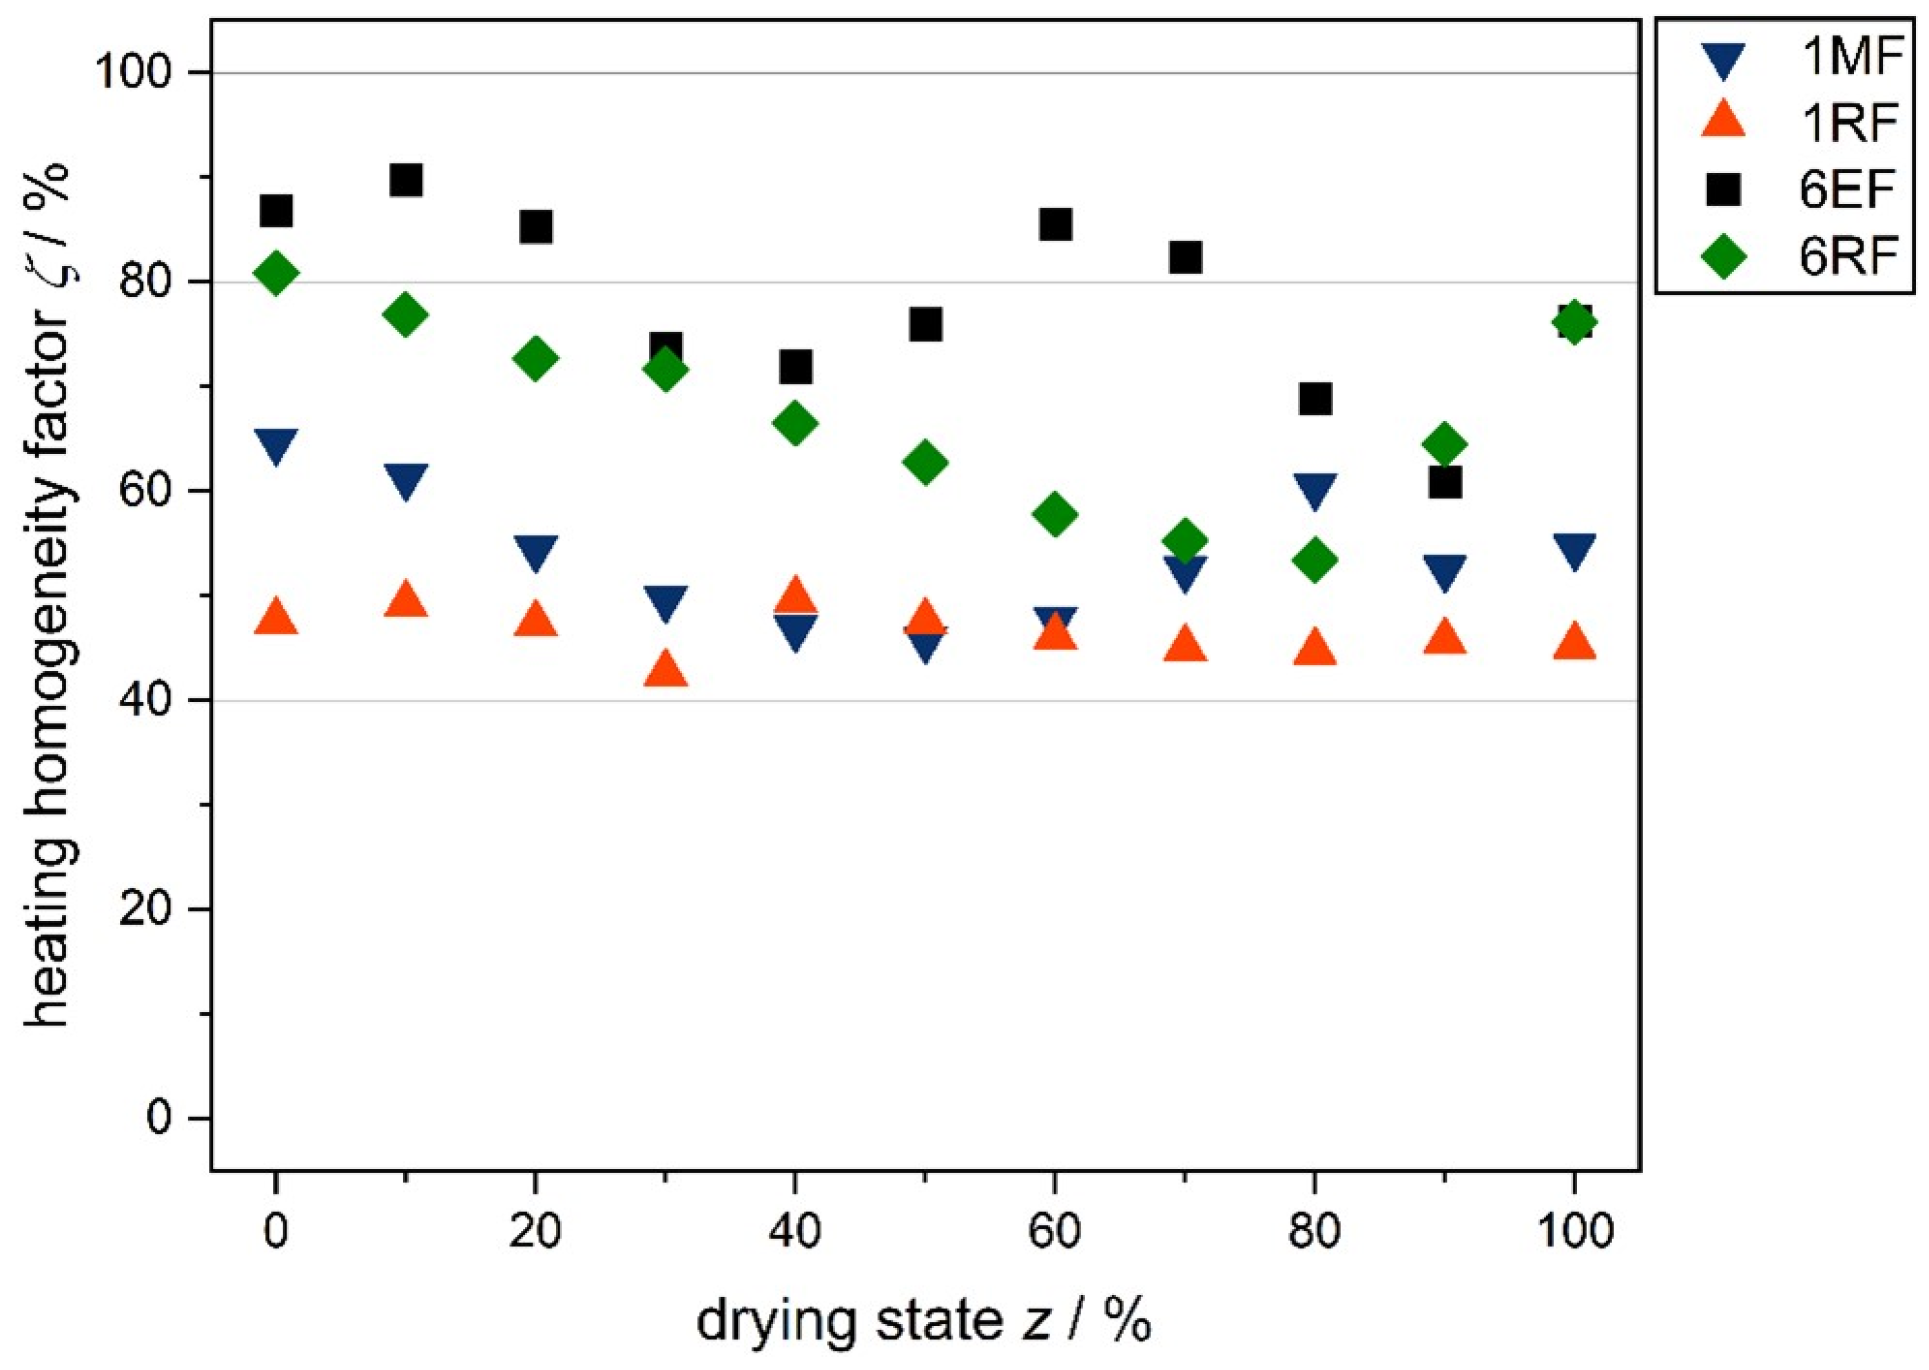
3.5.2. Heating Homogeneity

Figure 10 displays the heating homogeneity factor over the drying state for the different control concepts, which enables the evaluation of the homogeneity between the samples. When using multiple frequencies in 6EF and 6RF, there is a higher homogeneity factor compared to single frequencies at almost all drying states. This trend is consistent with more homogeneous microwave-assisted heating in electromagnetic models for the application of multiple frequencies [29,50]. The highest homogeneity with 6EF is presumably due to less dominant individual heating patterns. On the other hand, a few highly energy-efficient heating patterns with similar heating patterns might lower the homogeneity with 6RF.
Therefore, the application of several frequencies weighted according to power or time while specifying the desired energy efficiency represents an approach to achieve high heating homogeneity in MFD in future work. The targeted application of multiple frequencies has already been simulated for microwave-assisted processes with different optimization criteria, including heating homogeneity and energy efficiency [25,29,50,54]. However, the heating homogeneity was only evaluated inside a single product, which is only of limited significance for the drying of multiple chunky products.
To evaluate the heating homogeneity inside the samples, Table 2 shows the heating patterns for 1MF, 1RF, 6EF, and 6RF in an exemplary product sample at half height. The dependence of the heating pattern on the drying state and control concept is evident. 1RF and 6RF show the highest power densities, especially in the frozen center towards the end of drying. For all control concepts, there is always a higher power density in the frozen core of the product than in the dried layer. This can be explained by the higher dielectric properties in the frozen area (compare Table 1).
Figure 11 shows the proportion y f r o z e n of dissipated power in the frozen layer divided by the total dissipated power in the same exemplary sample. It can be seen that the distribution of the power in the product depends significantly on the drying state. In comparison, the control concept used has only a minor effect. This result illustrates the selective character of microwave-assisted processing, which is known in the literature [8]. This is particularly advantageous in MFD since the energy is introduced directly into the frozen core where the energy is required for sublimation. Towards the end of drying, there is a high power input in a relatively small frozen volume. If constant power density is desired in frozen areas, power should be reduced toward the end of the process.

3.6. Experimental Proof of Concept

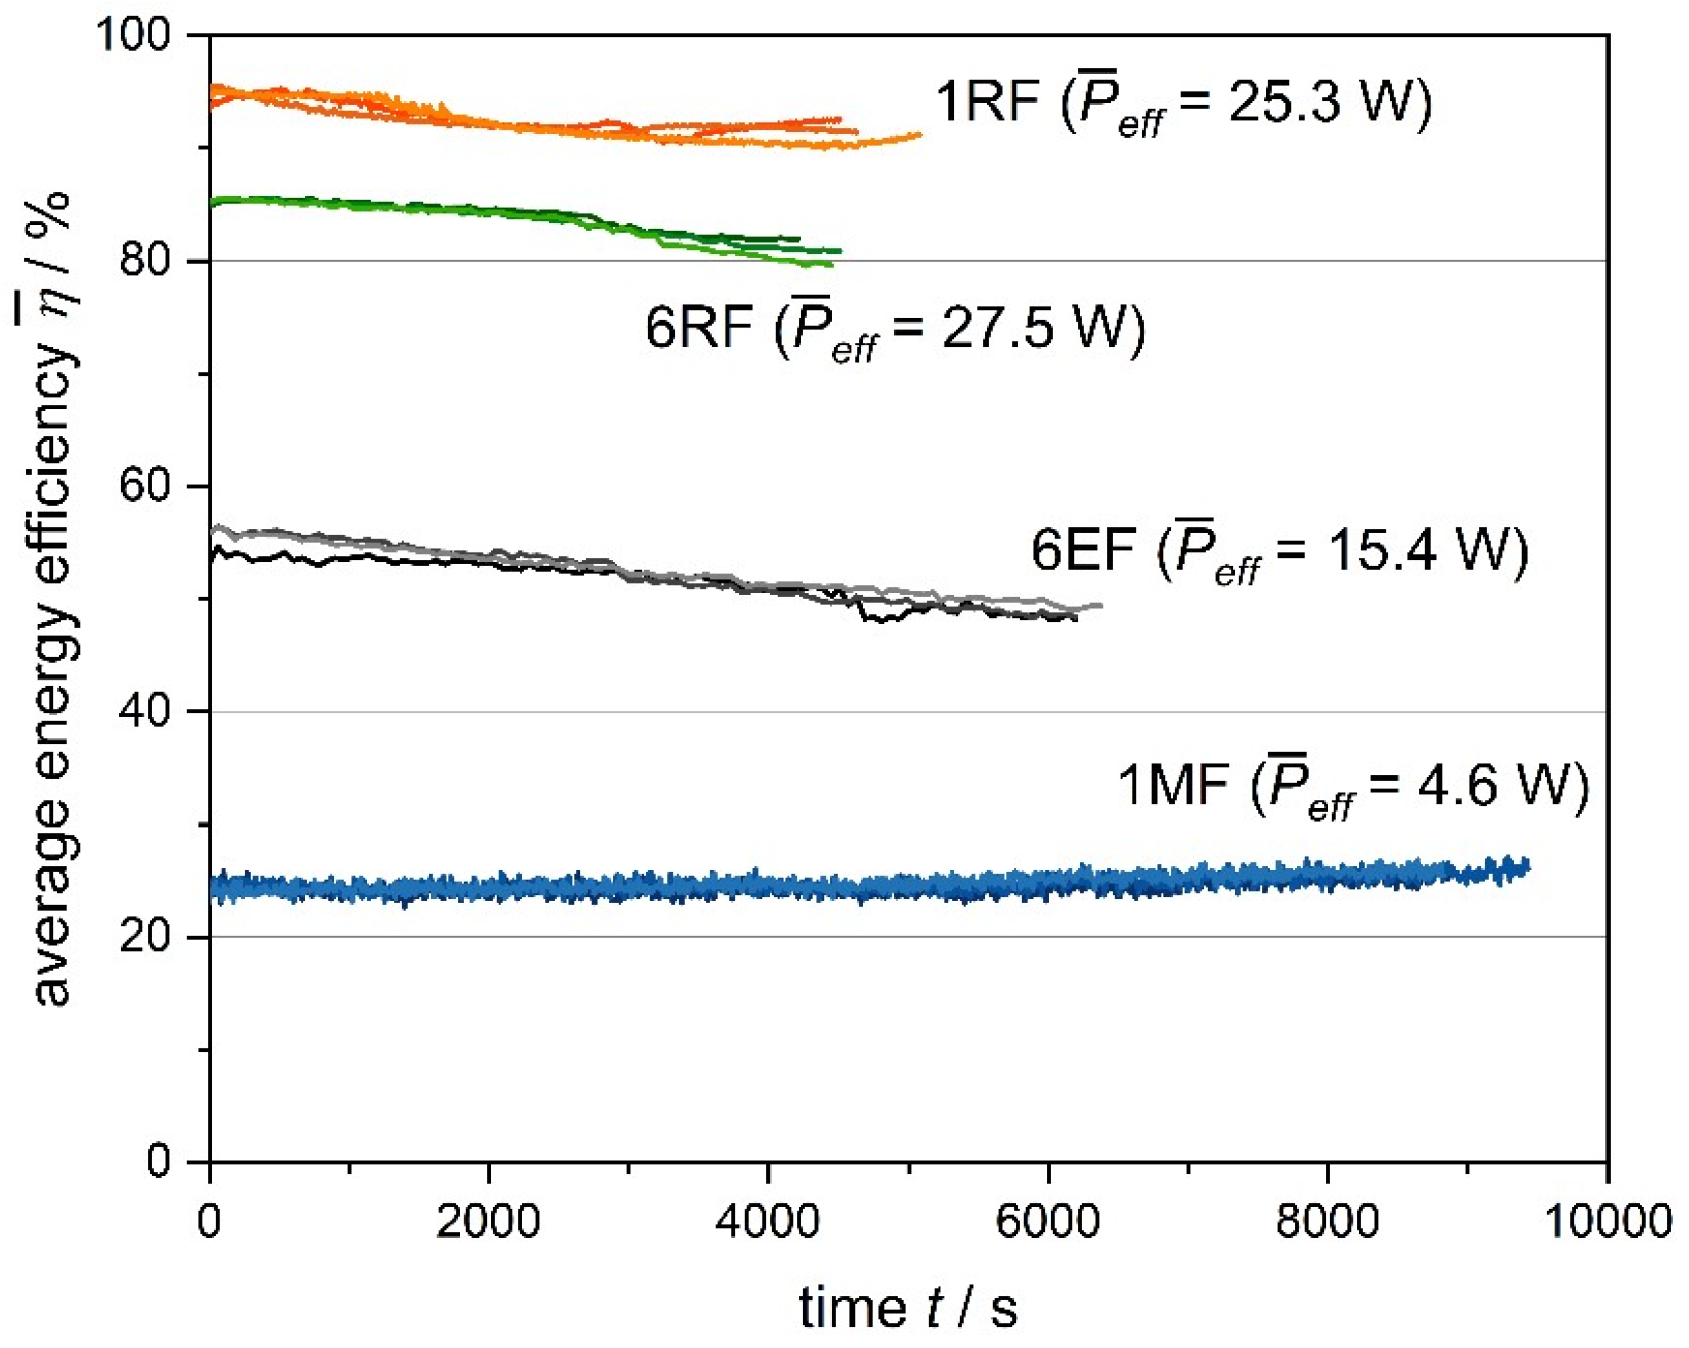
3.6.1. Energy Efficiency

Figure 12 depicts the average energy efficiency plotted over the process time as a function of the applied control concepts for the removal of 20 wt% water without an adaption of the initial frequencies. The applied frequencies are listed in Table S3 in the Supplementary Material. During this part of the drying process, the energy efficiency ranks η 1 R F > η 6 R F > η 6 E F > η 1 M F . This order is consistent with the results from the electromagnetic simulations (see Figure 9). Experimental results from the literature also show high energy efficiency when selected energy-efficient frequencies are applied in microwave-assisted heating [27,55]. Therefore, the proof of concept of the electromagnetic simulations was successful in terms of energy efficiency. In the experiments, high energy efficiency generally correlates with short drying times. A targeted selection of frequencies in MFD can thus be used in a process intensification to accelerate the time-intensive primary drying without increasing power consumption.
Despite a higher energy efficiency, the process time using the 1RF control concept is longer than using the 6RF control concept (see Figure 12). This can be explained by a non-constant forward power by the SSG used, as the power output of the SSG is slightly dependent on the frequency. This is likely due to inaccuracies in the calibration of the power output of the SSG, which unfortunately could not be fully resolved during these investigations. Taking into account the effective power applied in the individual experiments, the experiments with the highest effective power have the lowest drying time. This is shown in Figure 12, which displays the average effective power P ¯ e f f of the experiments in triplicate for each control concept. P e f f is calculated for each experiment with
P e f f = i = 1 n η i P f , i t i t t o t a l
as the sum of the product of the energy-efficiency η i with the forward power P f , i and the time t i at all applied frequencies, divided by the process time t t o t a l . The tendency regarding the shortened drying time with increasing effective power is consistent with thermodynamic considerations and observations from the literature in experiments [11,15,16,17] and simulations [21].

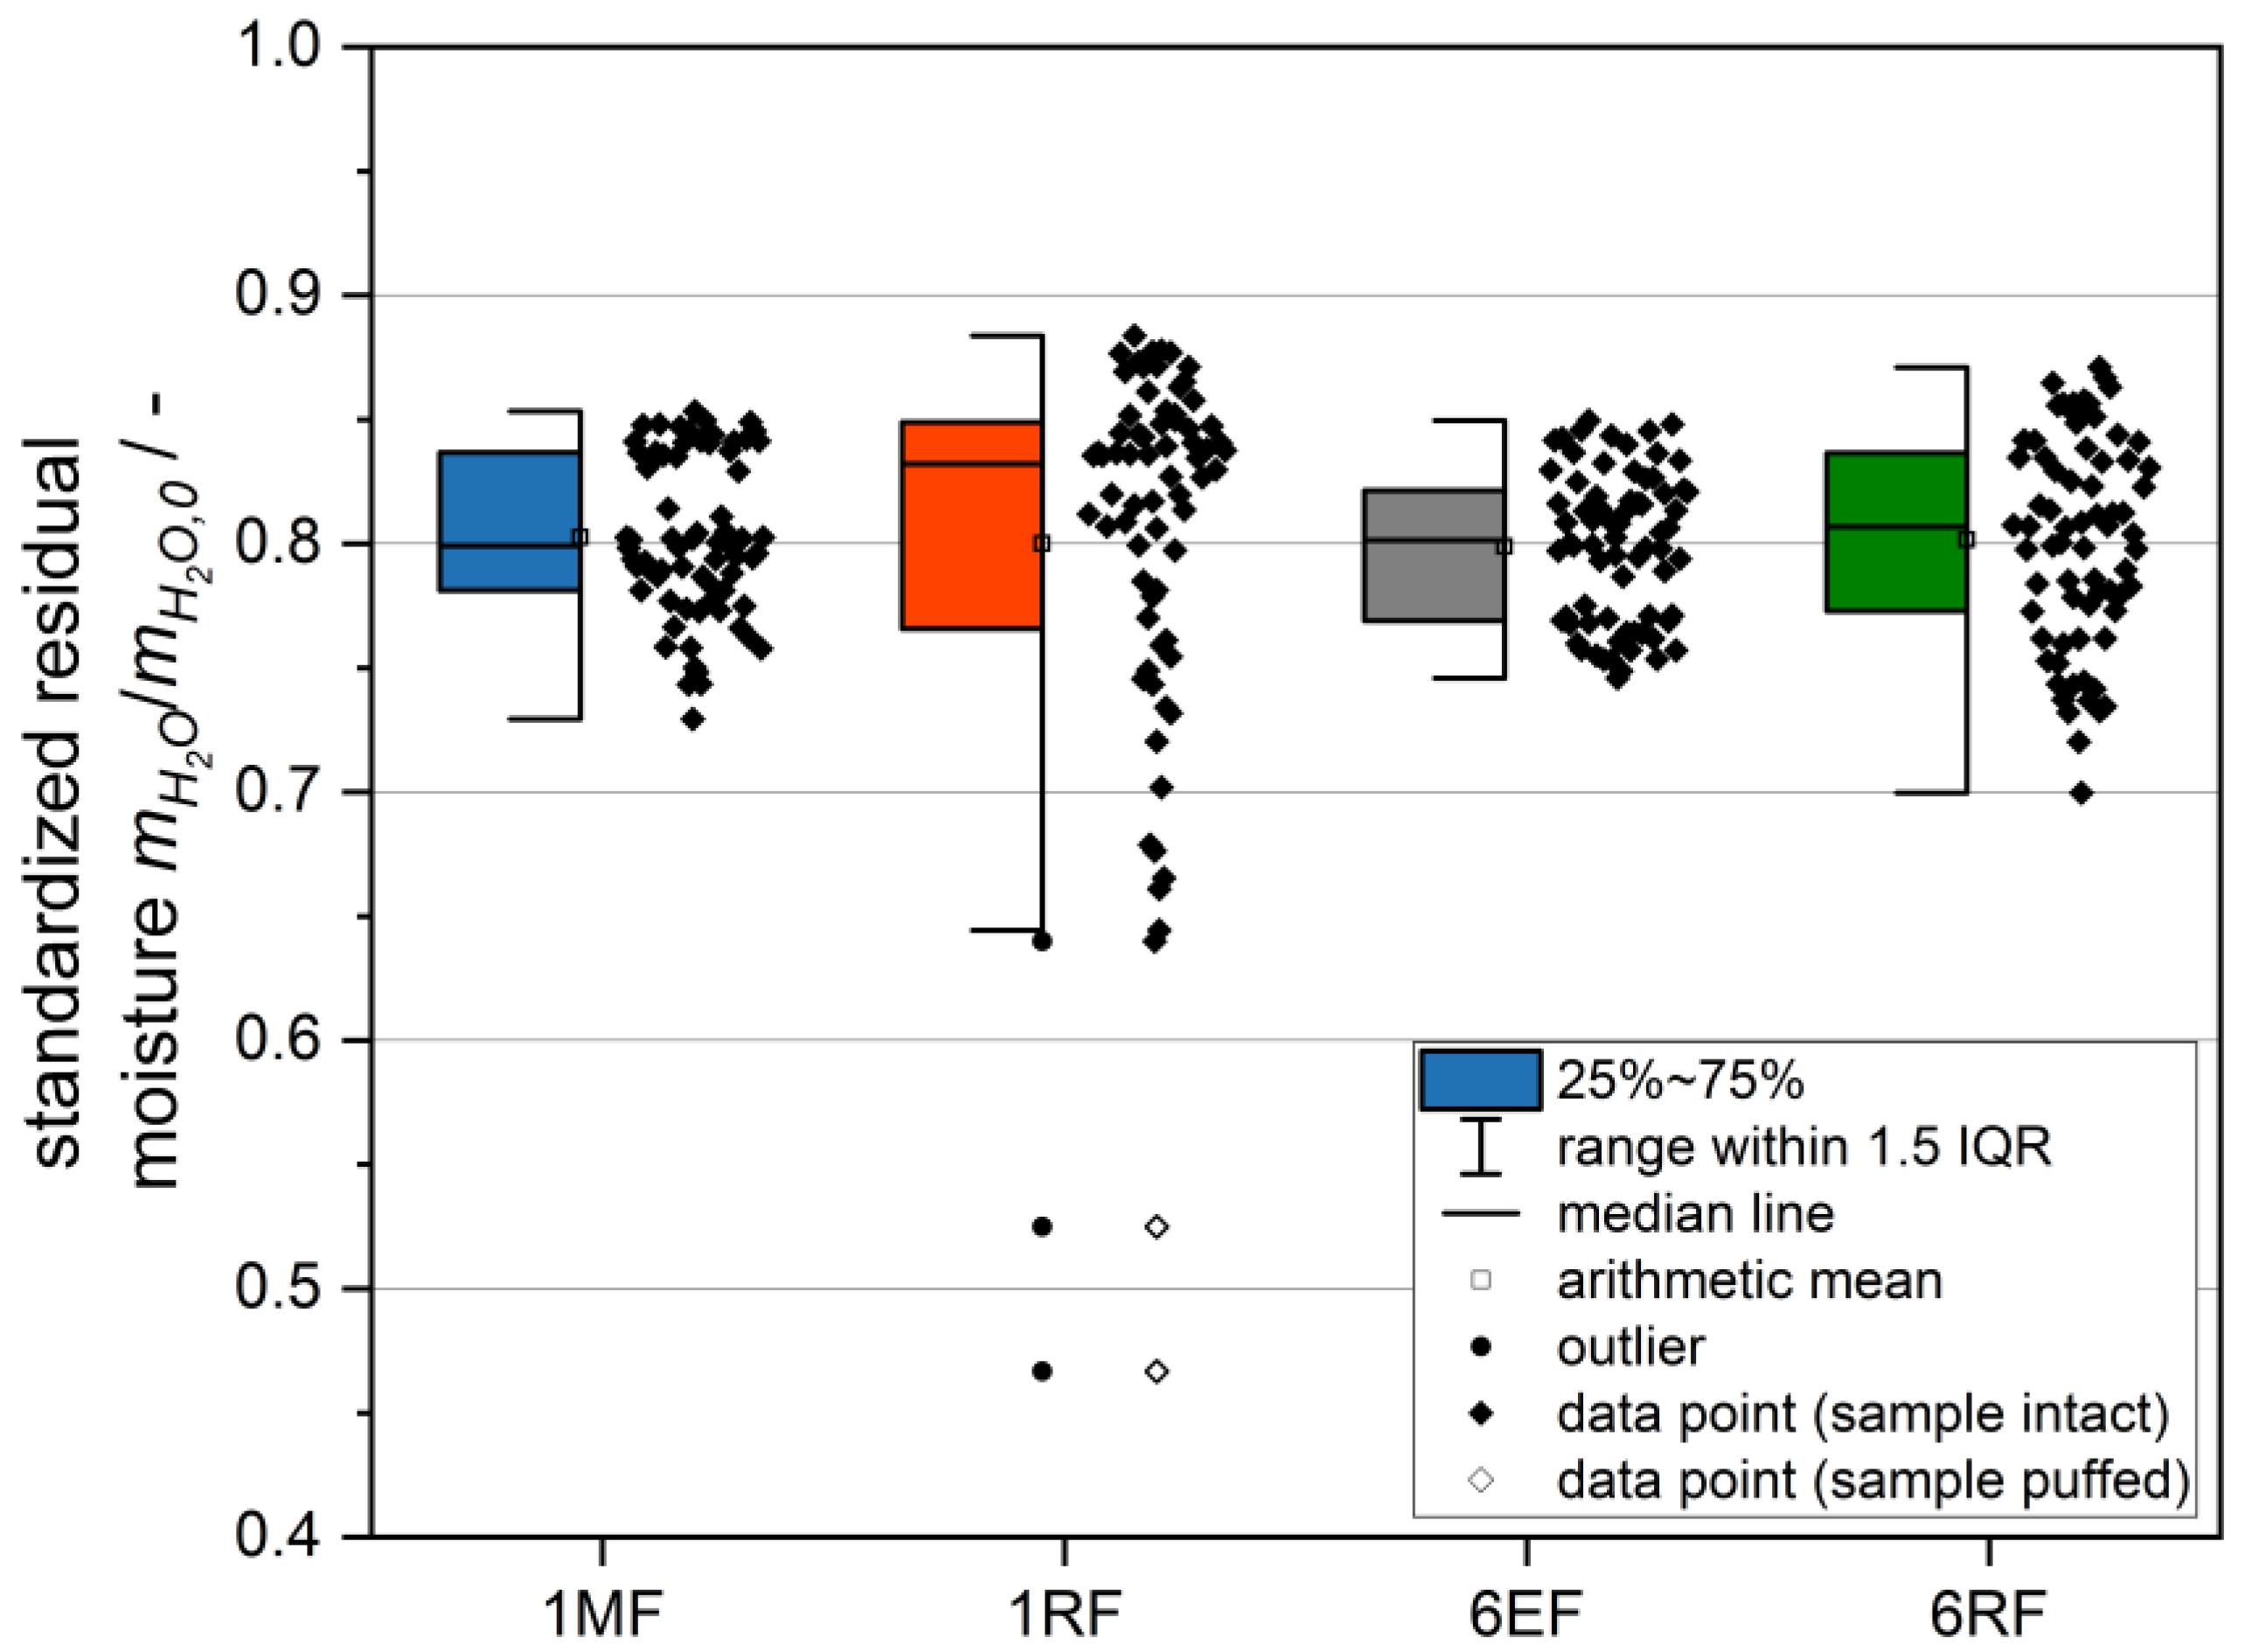
3.6.2. Drying Homogeneity

In the present work, the homogeneity of drying is used as an indirect indicator of homogeneity of power input instead of infrared imaging because endothermal sublimation occurs in MFD. The basic assumption is a lower residual moisture content with higher energy input. Figure 13 displays the residual moisture distribution of the individual samples for the applied control concepts.
The range of residual moisture is largest for 1RF and smallest for 6EF. This result is consistent with the predictions from the electromagnetic simulations shown in Figure 10. There is a clear correlation of frequency number with drying homogeneity in the results for similar effective microwave power. For 6EF, a smaller spread is found in comparison with 1MF. The same tendency can be seen when comparing 6RF with 1RF. Additionally, a smaller difference between the median and mean is found for 6RF than for 1RF. The results are qualitatively in line with the expectations from the simulations, which predict more homogeneous heating for the application of multiple frequencies. In the literature, the tendency of a more uniform energy input with multiple frequencies is also shown for microwave-assisted processes [26,28]. Due to the obtained results, the validity of this statement can now be extended to the first part of primary drying in MFD.
In contrast to the expectations from the simulation results, a higher range of residual moisture is found for 6RF compared to 1MF, although several frequencies were applied with 6RF. One possible explanation is the occurrence of thermal radiation in the experiments, which is not accounted for in the electromagnetic models. The longer process time and lower effective power when utilizing 1MF probably lead to a higher proportion of power input by thermal radiation from the uncooled surfaces of the process chamber. Moreover, more time is given to thermal equalization processes. These effects could lead to more homogeneous drying with 1MF, even though the power dissipation of microwaves should be less homogeneous. Therefore, the supplementation of MFD with power sources based on additional heat transfer mechanisms, e.g., thermal radiation or conduction, in hybrid processes remains an interesting focus for future work. Park et al. [21] already simulated shortened process times when combining MFD with CFD.
The partly high ranges of residual moisture and outliers, as can be seen with 1RF, are caused by the rapid drying of individual samples. Presumably, this occurs in samples with the highest power input. In extreme cases, high power absorption leads to the melting of the frozen product area and subsequent product damage due to puffing. Visible puffing occurred in two drying experiments applying 1RF in one sample each. The puffed samples can be seen in Figure 13 as outliers with a residual moisture m H 2 O m H 2 O , 0 < 0.6. These low residual moisture contents are probably caused by the high power input into the molten samples in combination with the reduced mass transfer resistance due to the large pores formed. The product damage due to puffing can be avoided by applying multiple resonant frequencies with 6RF, even though a higher effective power is coupled in. This underlines the advantage of more homogeneous power input by applying multiple frequencies in MFD.

3.7. Limitations and Future Work

Though a useful tool for gaining qualitative insights into the MFD process, the results from the electromagnetic simulations do not depict the actual distribution of the microwave field in MFD. Possible reasons for partial mismatches between the results from simulations and experiments in validation and proof of concept are:
  • Simplification of the geometries of cavity and samples, as well as possible deviations in positions and dimensions;
  • Temperature- and frequency-dependency of the dielectric properties are not taken into account;
  • Exclusive simulation of the electromagnetic field at discrete times of drying, leading to no consideration of thermodynamic effects;
  • Simplifying assumptions throughout drying, including a uniform retreat of the sublimation front in all samples and no shrinkage.
Further fine-tuning of the models is possible but cumbersome. It is questionable if the efforts can lead to improvements, which enable further insights. Utilization of the developed electromagnetic model and the discovered advantageous features of frequency modulation in future work is a promising possibility to explore the high potential of using SSGs in MFD in a time-efficient manner. Additional parameters to be investigated are, e.g., the phase shift or power distribution between multiple SSGs.
The effect of different frequency-based control concepts has been successfully investigated in experiments during the first part of primary drying. However, the frequencies of the control concepts were not adjusted at a drying state of 10% as in the electromagnetic simulations. The complete drying with a variation of the controlled frequencies throughout MFD remains an application-relevant topic for future research. The MFD process should then be compared to the established CFD by classifying product and process parameters.

4. Conclusions

A model of MFD for drying a chunky model product of tylose gel in a laboratory-scale system was successfully developed and verified to investigate the effects of modulating the electromagnetic field throughout drying. The purely electromagnetic model has been decoupled from thermodynamic equations by solving for several discrete drying states.
The dielectric properties of fresh and freeze-dried tylose gel were acquired experimentally and utilized in the simulations. The properties indicate dissipation of the electromagnetic power in frozen tylose gel mainly by interactions with bound water.
Validation of the simulations via experimentally determined energy efficiency in the frequency range of 2.4 GHz to 2.5 GHz at the beginning of drying did not show quantitative agreement. Nevertheless, a comparability of the curves in terms of the number and magnitude of the detected maxima was observed. Therefore, electromagnetic simulations can be employed as a time-efficient tool to predict the qualitative effects of frequency modulation in MFD. Due to the limitations of the model, experimental proof of concept is always required.
In post-processing of the simulations, the following generally valid correlations were found by applying different frequency-based control concepts in MFD:
  • Higher energy efficiency over the whole course of drying when applying energy-efficient resonant frequencies;
  • More uniform heating homogeneity between products when targeting multiple frequencies;
  • Insignificant effect on power distribution between frozen and dried regions in individual products. The distribution is mainly determined by the higher dielectric properties of the frozen region.
In the experimental proof of concept, qualitative agreement with predictions from simulation results was demonstrated regarding energy efficiency and drying homogeneity for the first part of primary drying. Moreover, the higher energy efficiency with a targeted frequency modulation was associated with shortened process times without an increase in power consumption.

Supplementary Materials

The following supporting information can be downloaded at: https://www.mdpi.com/article/10.3390/pr11020327/s1, Table S1: Frequencies utilized in the electromagnetic simulations in dependence on the control concept and drying state; Table S2: Energy efficiencies of the frequencies utilized in the electromagnetic simulations in dependence on the control concept and drying state; Table S3: Frequencies and respective energy efficiencies utilized in the control concepts in the experiments with the laboratory-scale MFD system.

Author Contributions

Conceptualization, T.S. and V.G.; methodology, T.S., I.K. and J.C.; software, T.S.; validation, T.S.; formal analysis, T.S.; investigation, T.S.; investigation dielectric properties I.K.; writing—original draft preparation, T.S.; writing—review and editing, I.K., J.C. and V.G.; visualization, T.S. and J.C.; supervision and discussion of results, V.G.; project administration, T.S., I.K. and V.G.; funding acquisition, T.S. and V.G. All authors have read and agreed to the published version of the manuscript.

Funding

This research was funded as an IGF project of the FEI via AiF within the program for promoting the Industrial Collective Research (IGF) of the German Federal Ministry for Economic Affairs and Climate Action, based on a resolution of the German Parliament. Project 22205 N.

Data Availability Statement

The data and methods used in the research are presented in sufficient detail in the document for other researchers to replicate the work.

Acknowledgments

The authors express their gratitude to Tobias Dosch, Markus Fischer, Daniel Göckel, Jürgen Kraft, Lena Trapp, and Max Renaud for their support in constructing the experimental system for microwave-assisted freeze-drying. Moreover, the authors acknowledge the support of Richy Bergmann in setting up the electromagnetic simulations. We acknowledge support from the KIT-Publication Fund of the Karlsruhe Institute of Technology.

Conflicts of Interest

The authors declare no conflict of interest. The funders had no role in the design of the study; in the collection, analyses, or interpretation of data; in the writing of the manuscript; or in the decision to publish the results.

References

  1. Coumans, W.J.; Kerkhof, P.J.A.M.; Bruin, S. Theoretical and Practical Aspects of Aroma Retention in Spray Drying and Freeze Drying. Dry. Technol. 1994, 12, 99–149. [Google Scholar] [CrossRef] [Green Version]
  2. Duan, X.; Yang, X.; Ren, G.; Pang, Y.; Liu, L.; Liu, Y. Technical aspects in freeze-drying of foods. Dry. Technol. 2016, 34, 1271–1285. [Google Scholar] [CrossRef]
  3. Lin, T.M.; Durance, T.; Scaman, C.H. Characterization of vacuum microwave, air and freeze dried carrot slices. Food Res. Int. 1998, 31, 111–117. [Google Scholar] [CrossRef]
  4. Bhatta, S.; Stevanovic Janezic, T.; Ratti, C. Freeze-Drying of Plant-Based Foods. Foods 2020, 9, 87. [Google Scholar] [CrossRef] [Green Version]
  5. Ratti, C. Hot air and freeze-drying of high-value foods: A review. J. Food Eng. 2001, 49, 311–319. [Google Scholar] [CrossRef]
  6. Franks, F. Freeze-drying of bioproducts: Putting principles into practice. Eur. J. Pharm. Biopharm. 1998, 45, 221–229. [Google Scholar] [CrossRef]
  7. Velardi, S.A.; Barresi, A.A. Development of simplified models for the freeze-drying process and investigation of the optimal operating conditions. Chem. Eng. Res. Des. 2008, 86, 9–22. [Google Scholar] [CrossRef]
  8. Clark, D.E.; Sutton, W.H. Microwave Processing of Materials. Annu. Rev. Mater. Sci. 1996, 26, 299–331. [Google Scholar] [CrossRef]
  9. Gitter, J.H.; Geidobler, R.; Presser, I.; Winter, G. Significant Drying Time Reduction Using Microwave-Assisted Freeze-Drying for a Monoclonal Antibody. J. Pharm. Sci. 2018, 107, 2538–2543. [Google Scholar] [CrossRef]
  10. Wang, R.; Zhang, M.; Mujumdar, A.S. Effects of vacuum and microwave freeze drying on microstructure and quality of potato slices. J. Food Eng. 2010, 101, 131–139. [Google Scholar] [CrossRef]
  11. Duan, X.; Zhang, M.; Mujumdar, A.S.; Wang, S. Microwave freeze drying of sea cucumber (Stichopus japonicus). J. Food Eng. 2010, 96, 491–497. [Google Scholar] [CrossRef]
  12. Ma, Y.H.; Peltre, P.R. Freeze dehydration by microwave energy: Part, I. Theoretical investigation. AIChE J. 1975, 21, 335–344. [Google Scholar] [CrossRef]
  13. Ma, Y.H.; Peltre, P.R. Freeze dehydration by microwave energy: Part II. Experimental study. AIChE J. 1975, 21, 344–350. [Google Scholar] [CrossRef]
  14. Wang, Y.; Zhang, M.; Mujumdar, A.S.; Mothibe, K.J. Microwave-Assisted Pulse-Spouted Bed Freeze-Drying of Stem Lettuce Slices—Effect on Product Quality. Food Bioprocess Technol. 2013, 6, 3530–3543. [Google Scholar] [CrossRef]
  15. Ozcelik, M.; Heigl, A.; Kulozik, U.; Ambros, S. Effect of hydrocolloid addition and microwave-assisted freeze drying on the characteristics of foamed raspberry puree. Innov. Food Sci. Emerg. Technol. 2019, 56, 102183. [Google Scholar] [CrossRef]
  16. Jiang, H.; Zhang, M.; Mujumdar, A.S.; Lim, R.-X. Drying uniformity analysis of pulse-spouted microwave–freeze drying of banana cubes. Dry. Technol. 2016, 34, 539–546. [Google Scholar] [CrossRef]
  17. Ambros, S.; Mayer, R.; Schumann, B.; Kulozik, U. Microwave-freeze drying of lactic acid bacteria: Influence of process parameters on drying behavior and viability. Innov. Food Sci. Emerg. Technol. 2018, 48, 90–98. [Google Scholar] [CrossRef]
  18. Gitter, J.H.; Geidobler, R.; Presser, I.; Winter, G. Microwave-Assisted Freeze-Drying of Monoclonal Antibodies: Product Quality Aspects and Storage Stability. Pharmaceutics 2019, 11, 674. [Google Scholar] [CrossRef] [Green Version]
  19. Wang, W.; Zhang, S.; Pan, Y.; Tang, Y.; Chen, G. Wave-absorbing material aided microwave freeze-drying of vitamin C solution frozen with preformed pores. Dry. Technol. 2020, 51, 2025–2038. [Google Scholar] [CrossRef]
  20. Witkiewicz, K.; Nastaj, J.F. Simulation Strategies in Mathematical Modeling of Microwave Heating in Freeze-Drying Process. Dry. Technol. 2010, 28, 1001–1012. [Google Scholar] [CrossRef]
  21. Park, J.; Cho, J.H.; Braatz, R.D. Mathematical modeling and analysis of microwave-assisted freeze-drying in biopharmaceutical applications. Comput. Chem. Eng. 2021, 153, 107412. [Google Scholar] [CrossRef]
  22. Luan, D.; Wang, Y.; Tang, J.; Jain, D. Frequency Distribution in Domestic Microwave Ovens and Its Influence on Heating Pattern. J. Food Sci. 2017, 82, 429–436. [Google Scholar] [CrossRef]
  23. Li, Z.Y.; Wang, R.F.; Kudra, T. Uniformity Issue in Microwave Drying. Dry. Technol. 2011, 29, 652–660. [Google Scholar] [CrossRef]
  24. Atuonwu, J.C.; Tassou, S.A. Quality assurance in microwave food processing and the enabling potentials of solid-state power generators: A review. J. Food Eng. 2018, 234, 1–15. [Google Scholar] [CrossRef]
  25. Bianchi, C.; Bonato, P.; Dughiero, F.; Canu, P. Enhanced power density uniformity for microwave catalytic reactions adopting solid-state generators: Comparison with magnetron technology. Chem. Eng. Process. Process Intensif. 2017, 120, 286–300. [Google Scholar] [CrossRef]
  26. Taghian Dinani, S.; Feldmann, E.; Kulozik, U. Effect of heating by solid-state microwave technology at fixed frequencies or by frequency sweep loops on heating profiles in model food samples. Food Bioprod. Process. 2021, 127, 328–337. [Google Scholar] [CrossRef]
  27. Yang, R.; Fathy, A.E.; Morgan, M.T.; Chen, J. Development of a complementary-frequency strategy to improve microwave heating of gellan gel in a solid-state system. J. Food Eng. 2022, 314, 110763. [Google Scholar] [CrossRef]
  28. Zhou, J.; Li, Y.; Li, N.; Liu, S.; Cheng, L.; Sui, S.; Gao, J. A multi-pattern compensation method to ensure even temperature in composite materials during microwave curing process. Compos. Part A 2018, 107, 10–20. [Google Scholar] [CrossRef]
  29. Yakovlev, V.V. Effect of frequency alteration regimes on the heating patterns in a solid-state-fed microwave cavity. J. Microw. Power Electromagn. Energy 2018, 52, 31–44. [Google Scholar] [CrossRef]
  30. Pozar, D.M. Microwave Engineering, 4th ed.; John Wiley & Sons Inc.: Hoboken, NJ, USA, 2012; pp. 300–302. ISBN 0470631554. [Google Scholar]
  31. Capozzi, L.C.; Barresi, A.A.; Pisano, R. Supporting data and methods for the multi-scale modelling of freeze-drying of microparticles in packed-beds. Data Brief 2019, 22, 722–755. [Google Scholar] [CrossRef]
  32. Chaurasiya, V.; Singh, J. An analytical study of coupled heat and mass transfer freeze-drying with convection in a porous half body: A moving boundary problem. J. Energy Storage 2022, 55, 105394. [Google Scholar] [CrossRef]
  33. Maxwell, J.C. VIII. A dynamical theory of the electromagnetic field. Phil. Trans. R. Soc. 1865, 155, 459–512. [Google Scholar] [CrossRef]
  34. Huray, P.G. Maxwell’s Equations; Wiley: Hoboken, NJ, USA, 2010; p. xiii. ISBN 978-0-470-54276-7. [Google Scholar]
  35. Llave, Y.; Mori, K.; Kambayashi, D.; Fukuoka, M.; Sakai, N. Dielectric properties and model food application of tylose water pastes during microwave thawing and heating. J. Food Eng. 2016, 178, 20–30. [Google Scholar] [CrossRef]
  36. Metaxas, A.C.; Meredith, R.J. Industrial Microwave Heating; IET: London, UK, 1988; p. 72. ISBN 978-1-84919-424-2. [Google Scholar]
  37. Guan, Y.; Nikawa, Y. Measurement of temperature-dependent complex permittivity for materials using cylindrical resonator under microwave irradiation. Electron. Commun. Jpn. 2007, 90, 1–8. [Google Scholar] [CrossRef]
  38. Więckowski, A.; Korpas, P.; Krysicki, M.; Dughiero, F.; Bullo, M.; Bressan, F.; Fager, C. Efficiency optimization for phase controlled multi-source microwave oven. Int. J. Appl. Electromagn. Mech. 2014, 44, 235–241. [Google Scholar] [CrossRef] [Green Version]
  39. Curet, S.; Rouaud, O.; Boillereaux, L. Microwave tempering and heating in a single-mode cavity: Numerical and experimental investigations. Chem. Eng. Process. Process Intensif. 2008, 47, 1656–1665. [Google Scholar] [CrossRef]
  40. Riedel, L. A test substance for freezing experiments. Kaltetechnik 1960, 12, 222–225. [Google Scholar]
  41. Deep, C.; Pratihar, A.K.; Sharma, M.K. Freezing time-temperature behavior and parametric study of cylindrical shaped tylose gel samples: A numerical and experimental study. Therm. Sci. Eng. Prog. 2021, 24, 100933. [Google Scholar] [CrossRef]
  42. Kaatze, U.; Uhlendorf, V. The Dielectric Properties of Water at Microwave Frequencies. Z. Phys. Chem. 1981, 126, 151–165. [Google Scholar] [CrossRef]
  43. Matzler, C.; Wegmuller, U. Dielectric properties of freshwater ice at microwave frequencies. J. Phys. D Appl. Phys. 1987, 20, 1623–1630. [Google Scholar] [CrossRef]
  44. Chamchong, M.; Datta, A.K. Thawing of foods in a microwave oven: I. Effect of power levels and power cycling. J. Microwave Power Electromagn. Energy 1999, 34, 9–21. [Google Scholar] [CrossRef]
  45. Wang, R.; Zhang, M.; Mujumdar, A.S.; Jiang, H. Effect of salt and sucrose content on dielectric properties and microwave freeze drying behavior of re-structured potato slices. J. Food Eng. 2011, 106, 290–297. [Google Scholar] [CrossRef]
  46. Marti, J.; Mauersberger, K. A survey and new measurements of ice vapor pressure at temperatures between 170 and 250 K. Geophys. Res. Lett. 1993, 20, 363–366. [Google Scholar] [CrossRef]
  47. Du, Z.; Wu, Z.; Gan, W.; Liu, G.; Zhang, X.; Liu, J.; Zeng, B. Multi-Physics Modeling and Process Simulation for a Frequency-Shifted Solid-State Source Microwave Oven. IEEE Access 2019, 7, 184726–184733. [Google Scholar] [CrossRef]
  48. Pitchai, K.; Birla, S.L.; Subbiah, J.; Jones, D.; Thippareddi, H. Coupled electromagnetic and heat transfer model for microwave heating in domestic ovens. J. Food Eng. 2012, 112, 100–111. [Google Scholar] [CrossRef] [Green Version]
  49. Polaert, I.; Ledoux, A.; Estel, L.; Huyghe, R.; Thomas, M. Microwave Assisted Regeneration of Zeolite. Int. J. Chem. Reactor Eng. 2007, 5, A117. [Google Scholar] [CrossRef]
  50. Antonio, C.; Deam, R.T. Comparison of linear and non-linear sweep rate regimes in variable frequency microwave technique for uniform heating in materials processing. J. Mater. Process. Technol. 2005, 169, 234–241. [Google Scholar] [CrossRef]
  51. Ma, L.; Paul, D.-L.; Pothecary, N.; Railton, C.; Bows, J.; Barratt, L.; Mullin, J.; Simons, D. Experimental validation of a combined electromagnetic and thermal FDTD model of a microwave heating process. IEEE Trans. Microwave Theory Tech. 1995, 43, 2565–2572. [Google Scholar] [CrossRef] [Green Version]
  52. Bressan, F.; Dughiero, F.; Bullo, M.; Di Barba, P. Efficiency optimization of a two-port microwave oven: A robust automated procedure. COMPEL 2015, 34, 1213–1228. [Google Scholar] [CrossRef]
  53. Tang, Z.; Hong, T.; Liao, Y.; Chen, F.; Ye, J.; Zhu, H.; Huang, K. Frequency-selected method to improve microwave heating performance. Appl. Therm. Eng. 2018, 131, 642–648. [Google Scholar] [CrossRef]
  54. Tang, Z.; Zhang, S.; Hong, T.; Zhu, H.; Huang, K. Frequency-selected microwave heating: Its mathematical physics basis and characteristics. Int. J. RF Microwave Comput. Aided Eng. 2020, 30, 24. [Google Scholar] [CrossRef]
  55. Yang, R.; Fathy, A.E.; Morgan, M.T.; Chen, J. Development of online closed-loop frequency shifting strategies to improve heating performance of foods in a solid-state microwave system. Food Res. Int. 2022, 154, 110985. [Google Scholar] [CrossRef] [PubMed]
Figure 1. (a) Geometry of the process chamber in the electromagnetic simulations; (b) Geometry of the individual product samples and the product support in the electromagnetic simulations. Yellow—tylose gel; blue—product support made of PEEK; red—inlet waveguide.
Processes 11 00327 g001
Figure 2. Schematic layout of the laboratory-scale MFD system. Information streams are shown as dotted lines. P—forward and reflected microwave power SSG; p—pressure capacitive sensor; m—mass load cell.
Processes 11 00327 g002
Figure 3. Schematic overview of the process steps and corresponding parameters for MFD.
Processes 11 00327 g003
Figure 4. (a) Dielectric properties of fresh tylose gel; (b) Dielectric properties of freeze-dried tylose gel. The results were obtained in duplicate. The arithmetic means of the dielectric properties utilized in the simulations are marked with an x.
Processes 11 00327 g004
Figure 5. NPA at 2.45 GHz displayed as a function of the number of mesh cells in the electromagnetic simulations for various drying stages.
Processes 11 00327 g005
Figure 6. Energy efficiency in the frequency range of 2.4 GHz to 2.5 GHz obtained from the electromagnetic simulations at a drying state of 0% (green) and experimentally in the laboratory-scale plant in triplicate at 0.5 mbar (blue). The energy efficiency was calculated for the simulation according to Formula (7) and for the experiments according to Formula (10).
Processes 11 00327 g006
Figure 7. Energy efficiency in the frequency range of 2.4 GHz to 2.5 GHz obtained from the electromagnetic models of all drying states in the range of 0% to 100%. Peak 1 and peak 2 mark two prominent energy-efficient peaks throughout drying.
Processes 11 00327 g007
Figure 8. Frequency of peaks 1 and 2 plotted over the drying state, obtained from electromagnetic simulations. The size of the bubbles indicates the energy efficiency of the respective peaks. The colors reflect the drying state in analogy to Figure 7.
Processes 11 00327 g008
Figure 9. Average energy efficiency of the respective control concepts plotted over the drying state, calculated from the electromagnetic simulations.
Processes 11 00327 g009
Figure 10. Heating homogeneity factor for the investigated control concepts as a function of the drying state, determined from the electromagnetic simulations.
Processes 11 00327 g010
Figure 11. The proportion of power dissipation in an exemplary cuboid made of tylose gel (top left in Figure 1a) in the frozen region relative to the total power dissipation in the respective cuboid as a function of the drying state for the investigated control concepts, obtained from the electromagnetic simulations.
Processes 11 00327 g011
Figure 12. Average energy efficiency from MFD experiments plotted over drying time for different control concepts. Experiments were conducted in triplicate. P ¯ e f f denotes the effective power averaged across the respective repetitions.
Processes 11 00327 g012
Figure 13. Distribution of residual moisture after MFD for the different control concepts standardized to the water mass in the samples before drying. The data sets consist of experiments in triplicate for each control concept with 24 samples each. The colors match the control concepts in analogy to the previous figures. IQR–interquartile range.
Processes 11 00327 g013
Table 1. Dielectric properties of the materials in the electromagnetic simulations.
MaterialRelative Dielectric Constant ε r /-Relative Dielectric Loss Factor ε r /-Source
PEEK3.1420.0085[37]
tylose gel, dried1.2640.0473present study
tylose gel, frozen3.6490.5807present study
vacuum1.0000.0000per definition
Table 2. Patterns of the volume-specific power absorption from the electromagnetic simulations in an exemplary cuboid of tylose gel (top left in Figure 1a) in dependence on drying state and control concept at half height of the cuboid. At the drying states 20%, 40%, 60%, and 80%, the sample consists of a frozen core and a dried outer layer, while the drying state 0% is a completely frozen cuboid and the drying state 100%, respectively, fully dried.
Drying State z/%020406080100W/m3
Processes 11 00327 i001
1MFProcesses 11 00327 i002Processes 11 00327 i003Processes 11 00327 i004Processes 11 00327 i005Processes 11 00327 i006Processes 11 00327 i007
1RFProcesses 11 00327 i008Processes 11 00327 i009Processes 11 00327 i010Processes 11 00327 i011Processes 11 00327 i012Processes 11 00327 i013
6EFProcesses 11 00327 i014Processes 11 00327 i015Processes 11 00327 i016Processes 11 00327 i017Processes 11 00327 i018Processes 11 00327 i019
6RFProcesses 11 00327 i020Processes 11 00327 i021Processes 11 00327 i022Processes 11 00327 i023Processes 11 00327 i024Processes 11 00327 i025
Disclaimer/Publisher’s Note: The statements, opinions and data contained in all publications are solely those of the individual author(s) and contributor(s) and not of MDPI and/or the editor(s). MDPI and/or the editor(s) disclaim responsibility for any injury to people or property resulting from any ideas, methods, instructions or products referred to in the content.

