Article

Experimental Analysis of Drying Conditions’ Effect on the Drying Kinetics and Moisture Desorption Isotherms at Several Temperatures on Food Materials: Corn Case Study

1
Research Laboratory of Thermal and Thermodynamic of Industrial Processes (LRTTPI), National Engineering School of Monastir, University of Monastir, Monastir 5019, Tunisia
2
Mechanical Engineering Department, ISSAT, University of Kairouan, Kairouan 3100, Tunisia
3
Chemical Engineering Department, King Khalid University, P.O. Box 394, Abha 61411, Saudi Arabia
*
Author to whom correspondence should be addressed.
Processes 2023, 11(1), 184; https://doi.org/10.3390/pr11010184
Submission received: 1 December 2022 / Revised: 25 December 2022 / Accepted: 1 January 2023 / Published: 6 January 2023

Abstract

:
This work studied the effect of external conditions on the drying kinetics of a thin layer of corn during convective drying. The density and the specific volume of the corn grain were reported and the desorption isotherms of the corn were determined at three temperatures and for a water activity from 0.1 to 0.9 using the static gravimetric method. Initially, a thin layer of corn about 7 mm thick with an initial moisture content of 45% (d.b) was investigated, and the external conditions were tested. Afterwards, a comparison between the experimental convective drying of a packed bed and a thin layer was performed under the same conditions. Finally, the values of equilibrium moisture contents, water activities and temperatures obtained were fitted using seven sorption models. It was found that the experimental desorption data exhibited type II behavior, according to Brunauer’s classification. The GAB model was found as the most suitable semi-empirical model which was well suited to represent the desorption equilibrium moisture content of corn kernels in the suggested ranges of temperature and water activity. It can be concluded from the entropy–enthalpy compensation theory that the desorption process of the corn kernels is controlled by the enthalpy mechanism.

1. Introduction

For five years, corn has been the world’s most produced cereal, ahead of wheat and rice [1]. It is one of the most outstanding staple foods, accounting for around 48% of cereal production. It is by far the most important spring cereal in North Africa, especially in Tunisia, Algeria and Morocco. Generally, corn is used in several areas, such as construction, nutrition, and the extraction of sugar and alcohol production. Furthermore, an artificial fibre has been produced from corn protein, which has been called “Vieara” [2].
Before being used or stored like any other agricultural product, corn must be dried. Many drying processes have been used over the years depending on the nature of the product. Drying is a preservation method, in which cereals’ water content is decreased by a heated fluid to minimize biochemical, chemical and microbiological changes. These deteriorations are notably influenced by the storage and drying conditions, the moisture content of the product and the relative humidity of the air. Studies must therefore be carried out on fresh and processed corn kernels to define their optimal storage conditions and ensure a greater efficacy of the natural substances and their biological activities. Indeed, high temperatures, unseasonal rain and high relative humidity have been cited among the main causes of post-harvest losses in cereals [3]; they have led to 30–40% of grain loss [4]. Winds, heavy rains, and storms will cause damage to drying structures, reduced pesticide effectiveness due to high humidity and a higher likelihood of grain contamination with dust. Sometimes corn kernels are harvested with moisture contents of more than 18% (d.b). The drying of the freshly harvested grain becomes necessary before storage to reduce losses in quality and to ameliorate storage durability. This operation is of great interest to many sectors, such as industrial and agricultural sectors. To reduce the cost of drying operations and preserve quality, it is necessary to study the kinetics taking place during this process [5]. To obtain such knowledge, it is imperative to investigate the temperature and moisture distribution in the product, which are indispensable parameters for both equipment and process design in addition to the product’s quality control. Several studies have reported on the drying of thin-layer grain, such as long-grain rice [6] rough rice [7], corn [8,9,10], hazelnut [11,12] and wheat [13,14,15].
Kaorkida et al. [16] studied the effect of the parameters of drying on the progress of the drying process of some vegetables (red, green and yellow pepper, pumpkin, green pea, carrot, corn, tomato, mushroom, garlic, onion, spinach, leek and celery). Unasekaran [17] investigated the effect of the drying temperature of corn kernels, the water content, and the heating rate on the gelatinization characteristics of starch extracted from corn and waxy corn. The research of Sun Le-Xiu et al. [18] concerned the drying of biological seeds to evaluate the effects of seed texture and phenotypic traits with a thin-layer drying rate by using different maize cultivars. Abu Hamden [19] experimentally verified the bed drying of wheat by changing the conditions of the inlet air, using wheat of various initial moisture contents. Abasi [20] investigated the effect of drying temperature in a convective-type dryer on the mechanical properties of corn (variety KSC704). Several tests were conducted by Zare et al. in a laboratory-scale paddy dryer under different drying conditions with two independent drying variables, namely: the drying air temperature and air mass flow rate [21]. Zhe Liu et al. [22] examined the drying of deep-bed corn and described the phenomenon in which desorption and adsorption coexist in the drying process. Veras et al. [23] studied the convective drying of corn and determined the drying kinetics and the structural proprieties (true density, apparent density, porosity and shrinkage) in terms of the moisture content during drying.
Although extensive work has been conducted on the drying of corn, no literature is available on the drying kinetics of spherical corn of a Tunisian variety. Desorption isotherms are basic tools in dehydration processes for predicting shelf-life stability, as well as the packaging and drying of the desired product. The sorption isotherms of food products are important thermodynamic data for the design, modelling and optimization of many unit operations, such as drying [5,24] and storage [25,26,27]. The quality of most preserved foods strongly depends on their physical, chemical and microbiological stabilities. At a given temperature, this stability of the food material is generally a consequence of the relationship between the equilibrium moisture content and the water activity.
The sorption isotherms are matchless for the individual food materials and are used to avoid food processing problems, like the storage conditions and the energy requirements [28]. To establish a thermodynamic analysis of sorption mechanisms, it is necessary to study the desorption isotherms at different temperatures [29,30,31]. Water sorption isotherm data are required for the estimation of thermodynamic properties, such as desorption heat, differential enthalpy and differential entropy. Several mathematical models are available in the literature to describe the water sorption isotherms of food materials [32,33]. To the best of the authors’ knowledge, there have been no specific results for the whole range of water activities or all types of foods. Labuza et al. [34] have attributed this to the association of water to the food matrix by various mechanisms in different water activity regions.
There are many models in the literature describing the moisture sorption isotherm of many food products (Table 1), which can be divided into two categories: semi-empirical (Henderson, Halsey and Chung and Pfost) and empirical models (GAB, BET, Peleg and Oswin model).
The BET model was considered a pertinent one to provide a better rendition of mono-layer sorption isotherms, particularly types II and III according to Brunauer’s classification [35]. A large number of researchers modified the BET model and the resulting equation gave a great fit up to a water activity of 0.9 [36]. The GAB model is considered to be the most adaptable sorption model available to the majority of biological products [24]. Peleg et al. [37] proposed the four-parameter model and noted that it can be utilized simultaneously for sigmoidal and non-sigmoidal isotherms, and fitted evenly with the GAB model. Henderson et al. [38] proposed a semi-empirical model for the equilibrium moisture content of cereal grains. Chirife and Igleasis found that the Halsey and Oswin models are also adaptable [39]. The Chung and Pfost equation [40] fitted the grain equilibrium moisture content data for a range of relative humidities from 20 to 90%. The sorption isotherms are indispensable for the selection of the proper operating conditions of the dryer, and conditions for the storage of dry products. To the authors’ knowledge, no published works are available that investigate the moisture desorption isotherms and the thermodynamic properties of the corn kernel.
Table 1. Recent findings on sorption isotherms applications (for food).
ProductBest Fitted ModelTemperature (°C)Publication
Apple, ApricotsHalsey30, 45, 60[41]
BananaModified Fraundlich10, 15, 20, 30, 40[42]
BeefBET25, 40[43]
BerriesGAB4, 13, 27[44]
CeleryPeleg25, 40, 50[45]
CheeseGAB4, 8, 12[46]
Chicken meatBET25[47]
Cocoa beansGAB25, 35, 45, 55[48]
Crystalline lactose powderTimmerann-GAB, GAB12–40[49]
Cured beef and porkGAB, Peleg10–50[50]
Currants, Prunes, FigsGAB15, 30, 45, 60[51]
EggsGAB60–80[52]
Gelatin gelFerro-Fontan, Modified GAB3.5–20[24]
Grapes, PotatoGAB, Halsey30, 45, 60[53,54]
Green pepperHalsey30, 45, 60[55]
HazelnutsFreundlich50, 60, 70, 80, 90[56]
LemonGAB20, 30, 40, 50[57]
Macadamia nutsGAB25, 35, 45[58]
MangoBET40, 50, 60[59]
MilksGAB15, 25, 35, 45[60]
MushroomGAB, BET40, 50, 60[61]
OnionModified Halsey30, 40, 50[62]
PineappleBET40, 50, 60[63]
RaisinGAB15, 30, 45, 60[64]
RiceChung Pfost10, 20, 30, 40, 50[65]
SorghumModified Chung-Pfost40, 50[66]
Starch (maize)GAB45[67]
Starch, PotatoGAB30–60[68]
TomatoGAB25, 40, 50[69]
As seen above, the studies on the drying of corn are very scarce. Moreover, most of the above studies are concerned with the effect of the temperature of the drying air. The other part of this study deals with the drying kinetics of corn in a convective dryer, after an extensive discussion of the experimental protocols that are used. Additional experimental exploration is still required in order to adequately determine the characteristic curve of drying. For the next industrial step after drying, the curve of drying is necessary for the storage of corn to ensure the long-term stability of the porous medium.
Thus, with some simplifying hypotheses (the porous medium is homogeneous and isotropic, the internal temperature and moisture content are initially uniform into the material, and the porosity is constant with no heat transfer by radiation or conduction), the present work has the following aims:
(i)
To provide information about the temperature distribution and moisture content drying of thin layers and a packed bed of corn under different drying conditions;
(ii)
To investigate the variation in corn density and the specific volume of corn kernels during the drying operation;
(iii)
To analyze the desorption isotherms of corn kernels in a wide range of relative humidities (10–90%) at three temperatures levels: 50, 60 and 70 °C;
(iv)
To estimate the thermodynamic properties of corn kernels depending on the moisture content;
(v)
To evaluate the pertinence of the enthalpy–entropy theory;
(vi)
To identify the desorption mechanism if enthalpy or entropy is controlled.

2. Materials and Methods

2.1. Experimental Procedure

Before studying the experimental convective drying of thin layers of corn, the materials’ characteristic properties were determined. The apparent density and the specific volume of corn according to the moisture content determine the behaviour of the studied product.

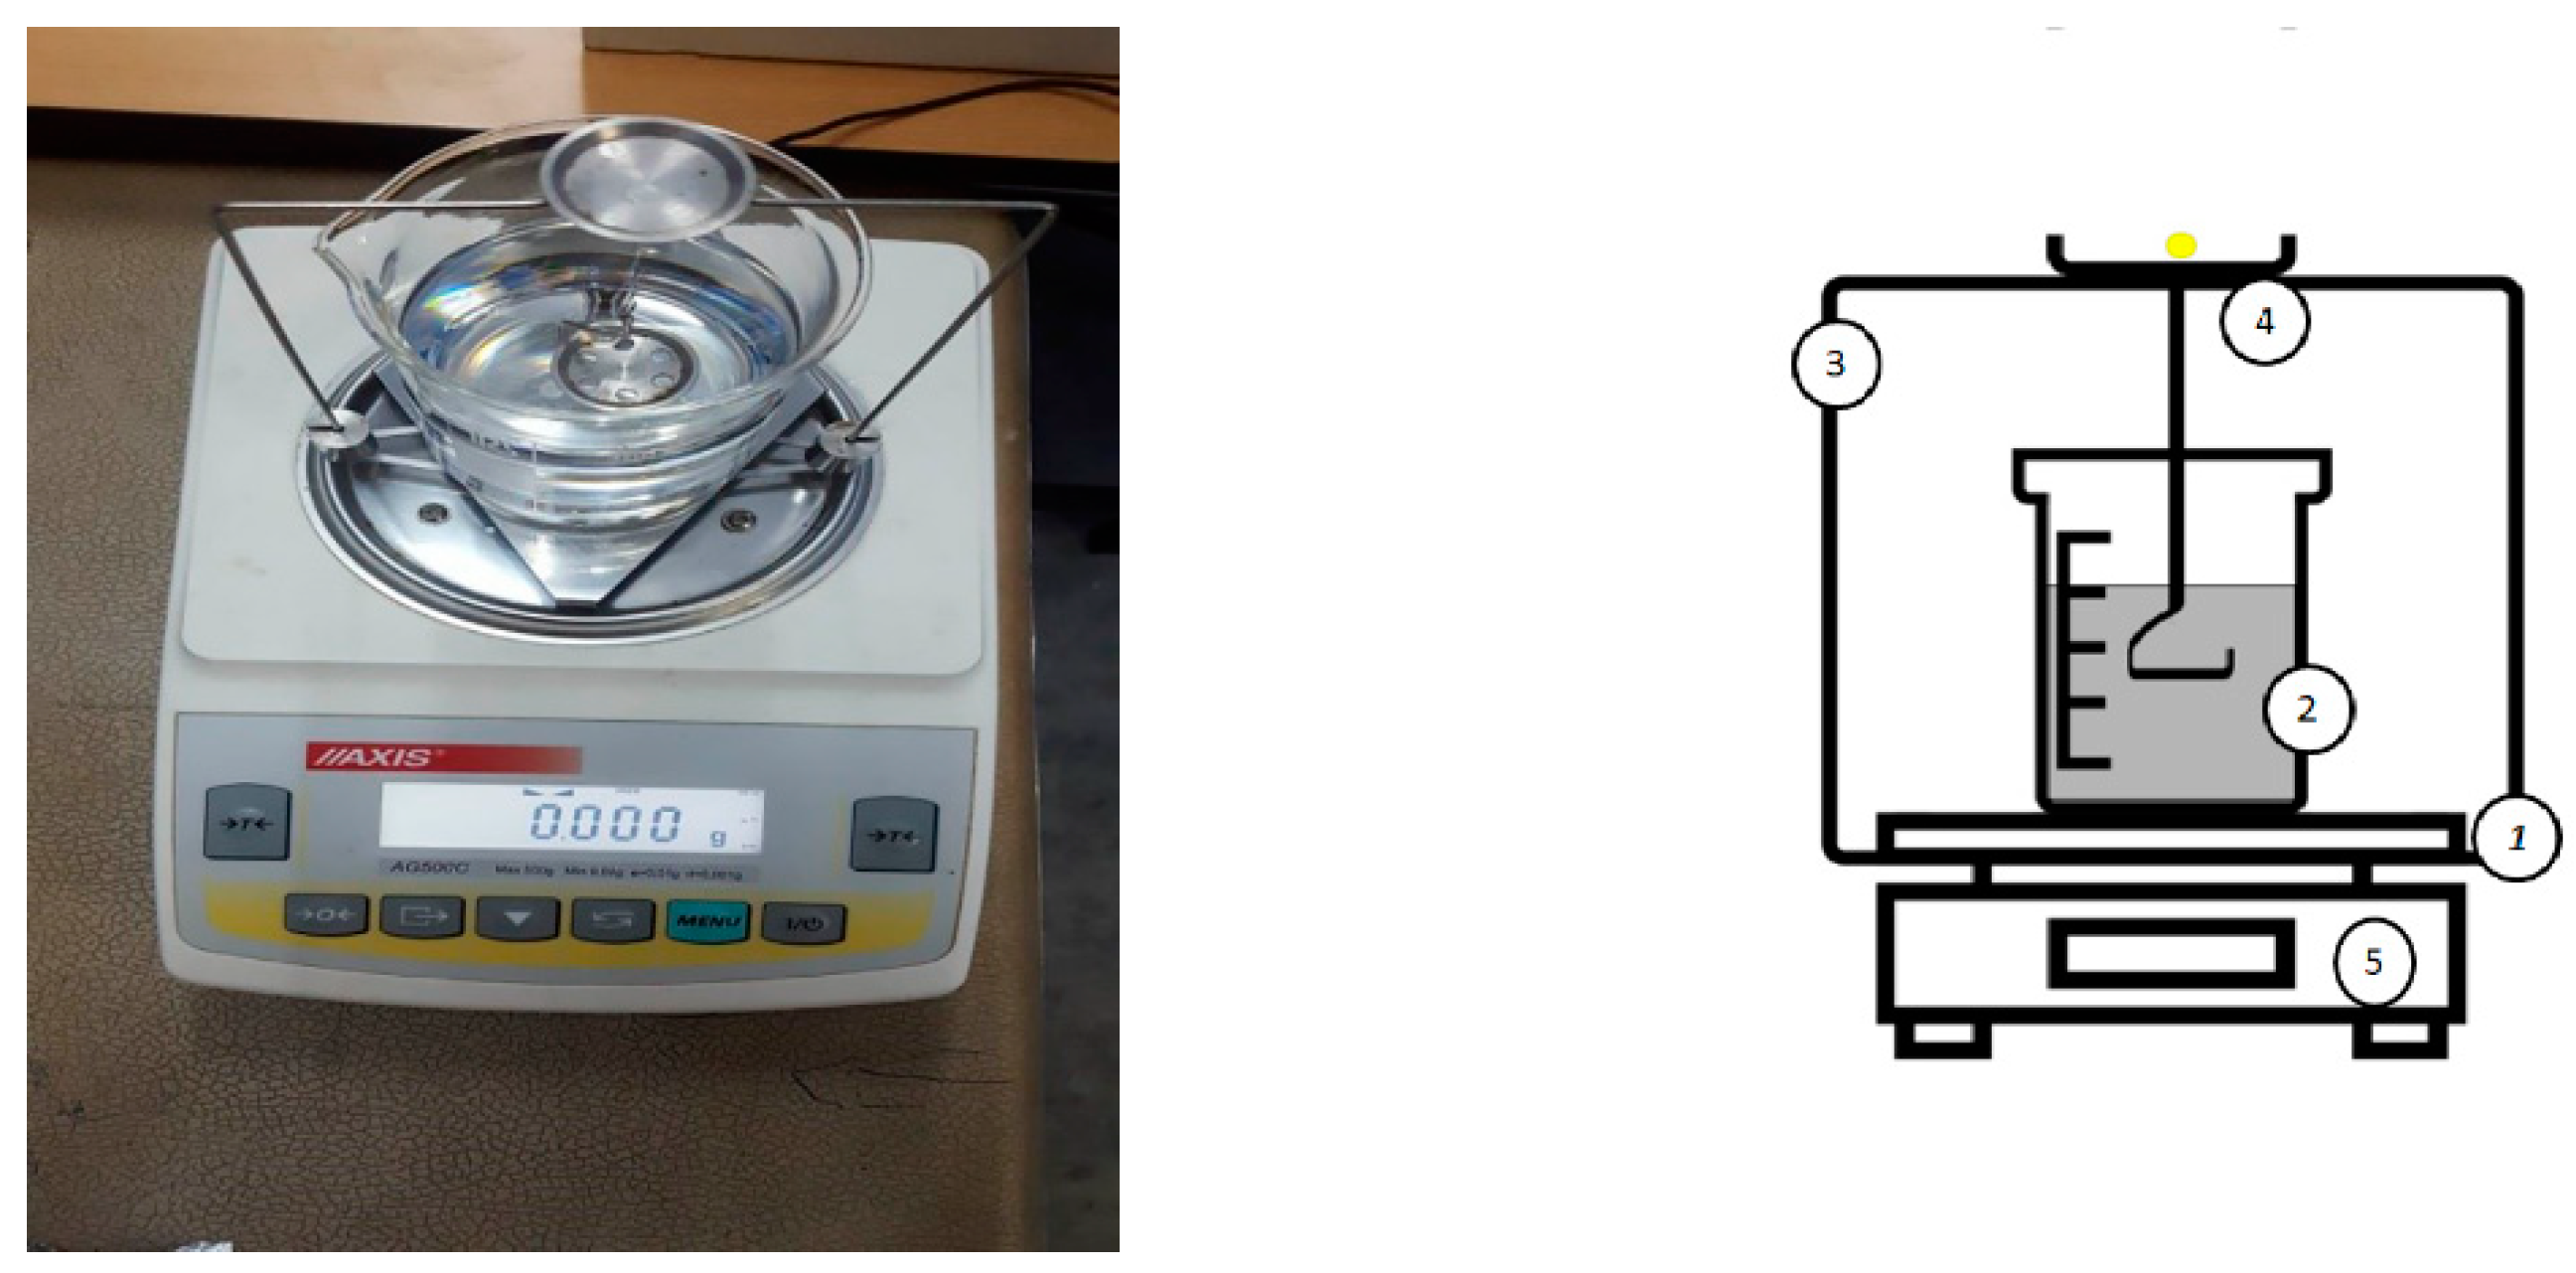
2.1.1. Determination of the Apparent Density

The determination of the apparent density of the studied material is based on Archimedes’ principle. The experimental design is composed of a metal bridge (1), which is mounted on a 75 mm diameter beaker (2), a suspension structure (3) and a basket (4) for the samples. The device is mounted on an electronic scale (5).
Knowing the density of the liquid (toluene) which causes the hydrostatic pressure enables us to determine the density of a solid:
ρ = M a ρ f ρ a 0.99983 × ( M a M f ) + ρ a
where:
ρ f is the fluid density.
ρ a is the density of air under normal conditions (T = 20 °C and P = 1 atm) and is equal to 0.0012 g·cm−3.
Ma and Mf are, respectively, the mass of the sample measured in the air and the measured mass of the sample immersed in the same fluid.
To avoid filling the pores with toluene, the sample is protected by a plastic package (with negligible mass) when immersed in toluene (Figure 1).
First, the sample is placed on the top shelf of the suspension structure and weighed. The mass Ma is recorded. Then, the balance is tared with the sample on the upper plate of the suspension structure. The sample is then placed in the lower basket and the absolute value of the hydrostatic thrust (G = MaMf) displayed with a minus sign is recorded. The density is determined for different moisture contents according to Equation (1).

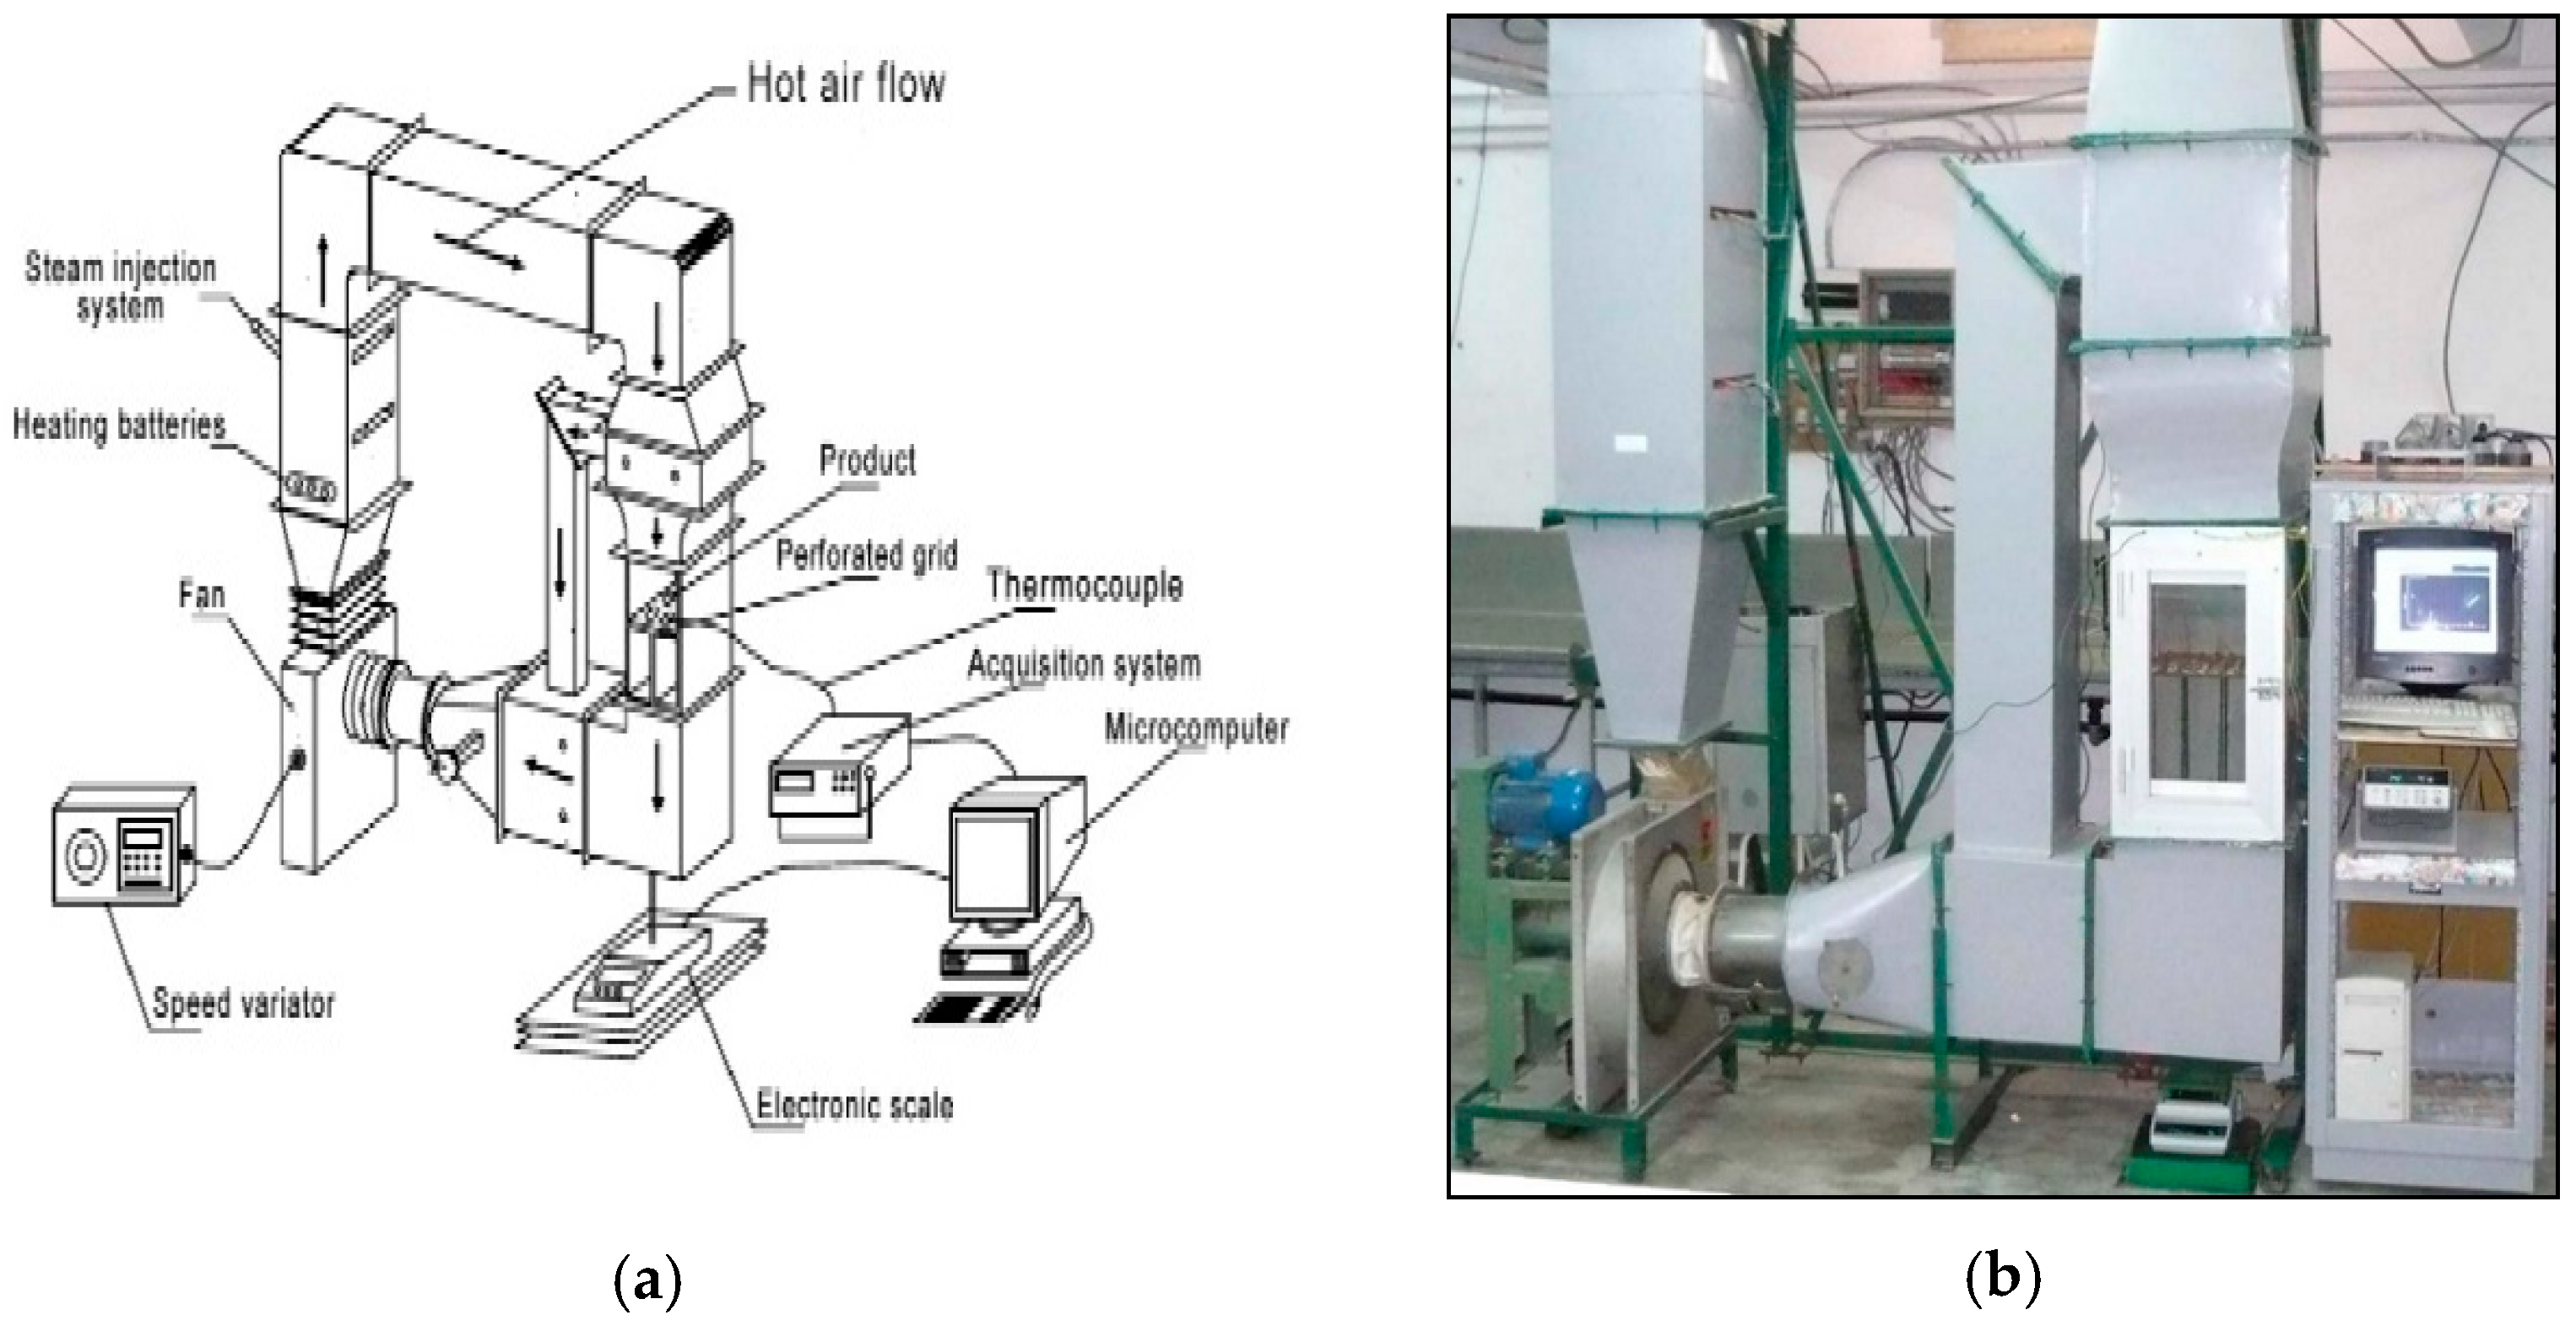
2.1.2. Experimental Apparatus of Drying Kinetics

The closed-circuit wind tunnel is used as a drying unit, used for convective drying, in which the hot air is provided by forced convection (Figure 2a,b).
It can regulate the relative humidity, the temperature of the fluid and velocity. The flow of air is produced by a centrifugal fan of adjustable frequency, using a frequency converter velocity. To raise its temperature, the drying air passes through heating batteries, and then through a plenum chamber. The relative humidity is ensured by a steam generator. To homogenize the air, the flow of air passes through a honeycomb filter before arriving perpendicularly to the product’s surface to be dried in the test vein. Just above the test vein a condenser is placed which ensures the condensation of the water contained in the flow. The water returns to the fan through a seal, which ensures the heating energy gain. The temperature and the relative humidity are automatically verified using a control system (programmable automaton) coupled to a sensor controlled by a computer. The measurement of the mass of the “product-plate” assembly is performed continuously using a precision balance ‘Mettler Toledo’ (Columbus, OH, USA) which is placed above and outside the dryer. The balance is connected to a data acquisition system, allowing measurements to be recorded at regular intervals of time. The evolution of the temperature at the centre of the product is measurable using a thermocouple connected to an acquisition chain, which allows measurements to be recorded for regular time intervals.

2.2. Pre-Treatment of Corn

The pre-treatment is washing the corn in cold water to remove dust and contaminants and then rinsing them with distilled water for 24 h before being kept in the refrigerator at a temperature of 7 °C to preserve their initial conditions.

2.3. Kinetic Drying of Thin Layer of Corn

Experiments are carried on samples of corn kernels with an initial weight of approximately 32 g (about 150 grains) deposed in thin layer. The drying kinetics are determined for different drying conditions (Table 2). In the first case, the air-drying temperature varied from 50 °C, 60 °C and 70 °C while the air velocity was constant and equal to 1 m·s−1. In the second case, the air velocity was varied: 1 m·s−1, 1.5 m·s−1 and 2 m·s−1 while the air temperature was constant and equal to 60 °C. The effects of air relative humidity on kinetic drying while the air temperature and velocity were constant (temperature equal to 60 °C and velocity equal to 1 m·s−1) were studied. The determination of the moisture content is operated through the determination of the dry mass at a temperature of 103 °C in an oven for 24 h.

2.4. Uncertainty Analysis

An uncertainty analysis is necessary to prove the accuracy of the experiments. The calculation method for uncertainty analysis has been used in many studies [70,71,72,73,74]. In this work, air temperatures, velocities, weights and humidity were measured with appropriate instruments (LETTM, Faculty of Sciences of Tunis, Tunisia) (thermocouples type K, anemometer, electronic scale and hygrometer) (Table 3).
Using a similar calculation procedure explained in detail elsewhere [70,74], the maximum absolute uncertainty (Equation (2)) is not more than 4%.
U R = [ i = 1 n ( R V i ) 2 ] 1 2
where UR and UVi are, respectively, the total error and error of each parameter.

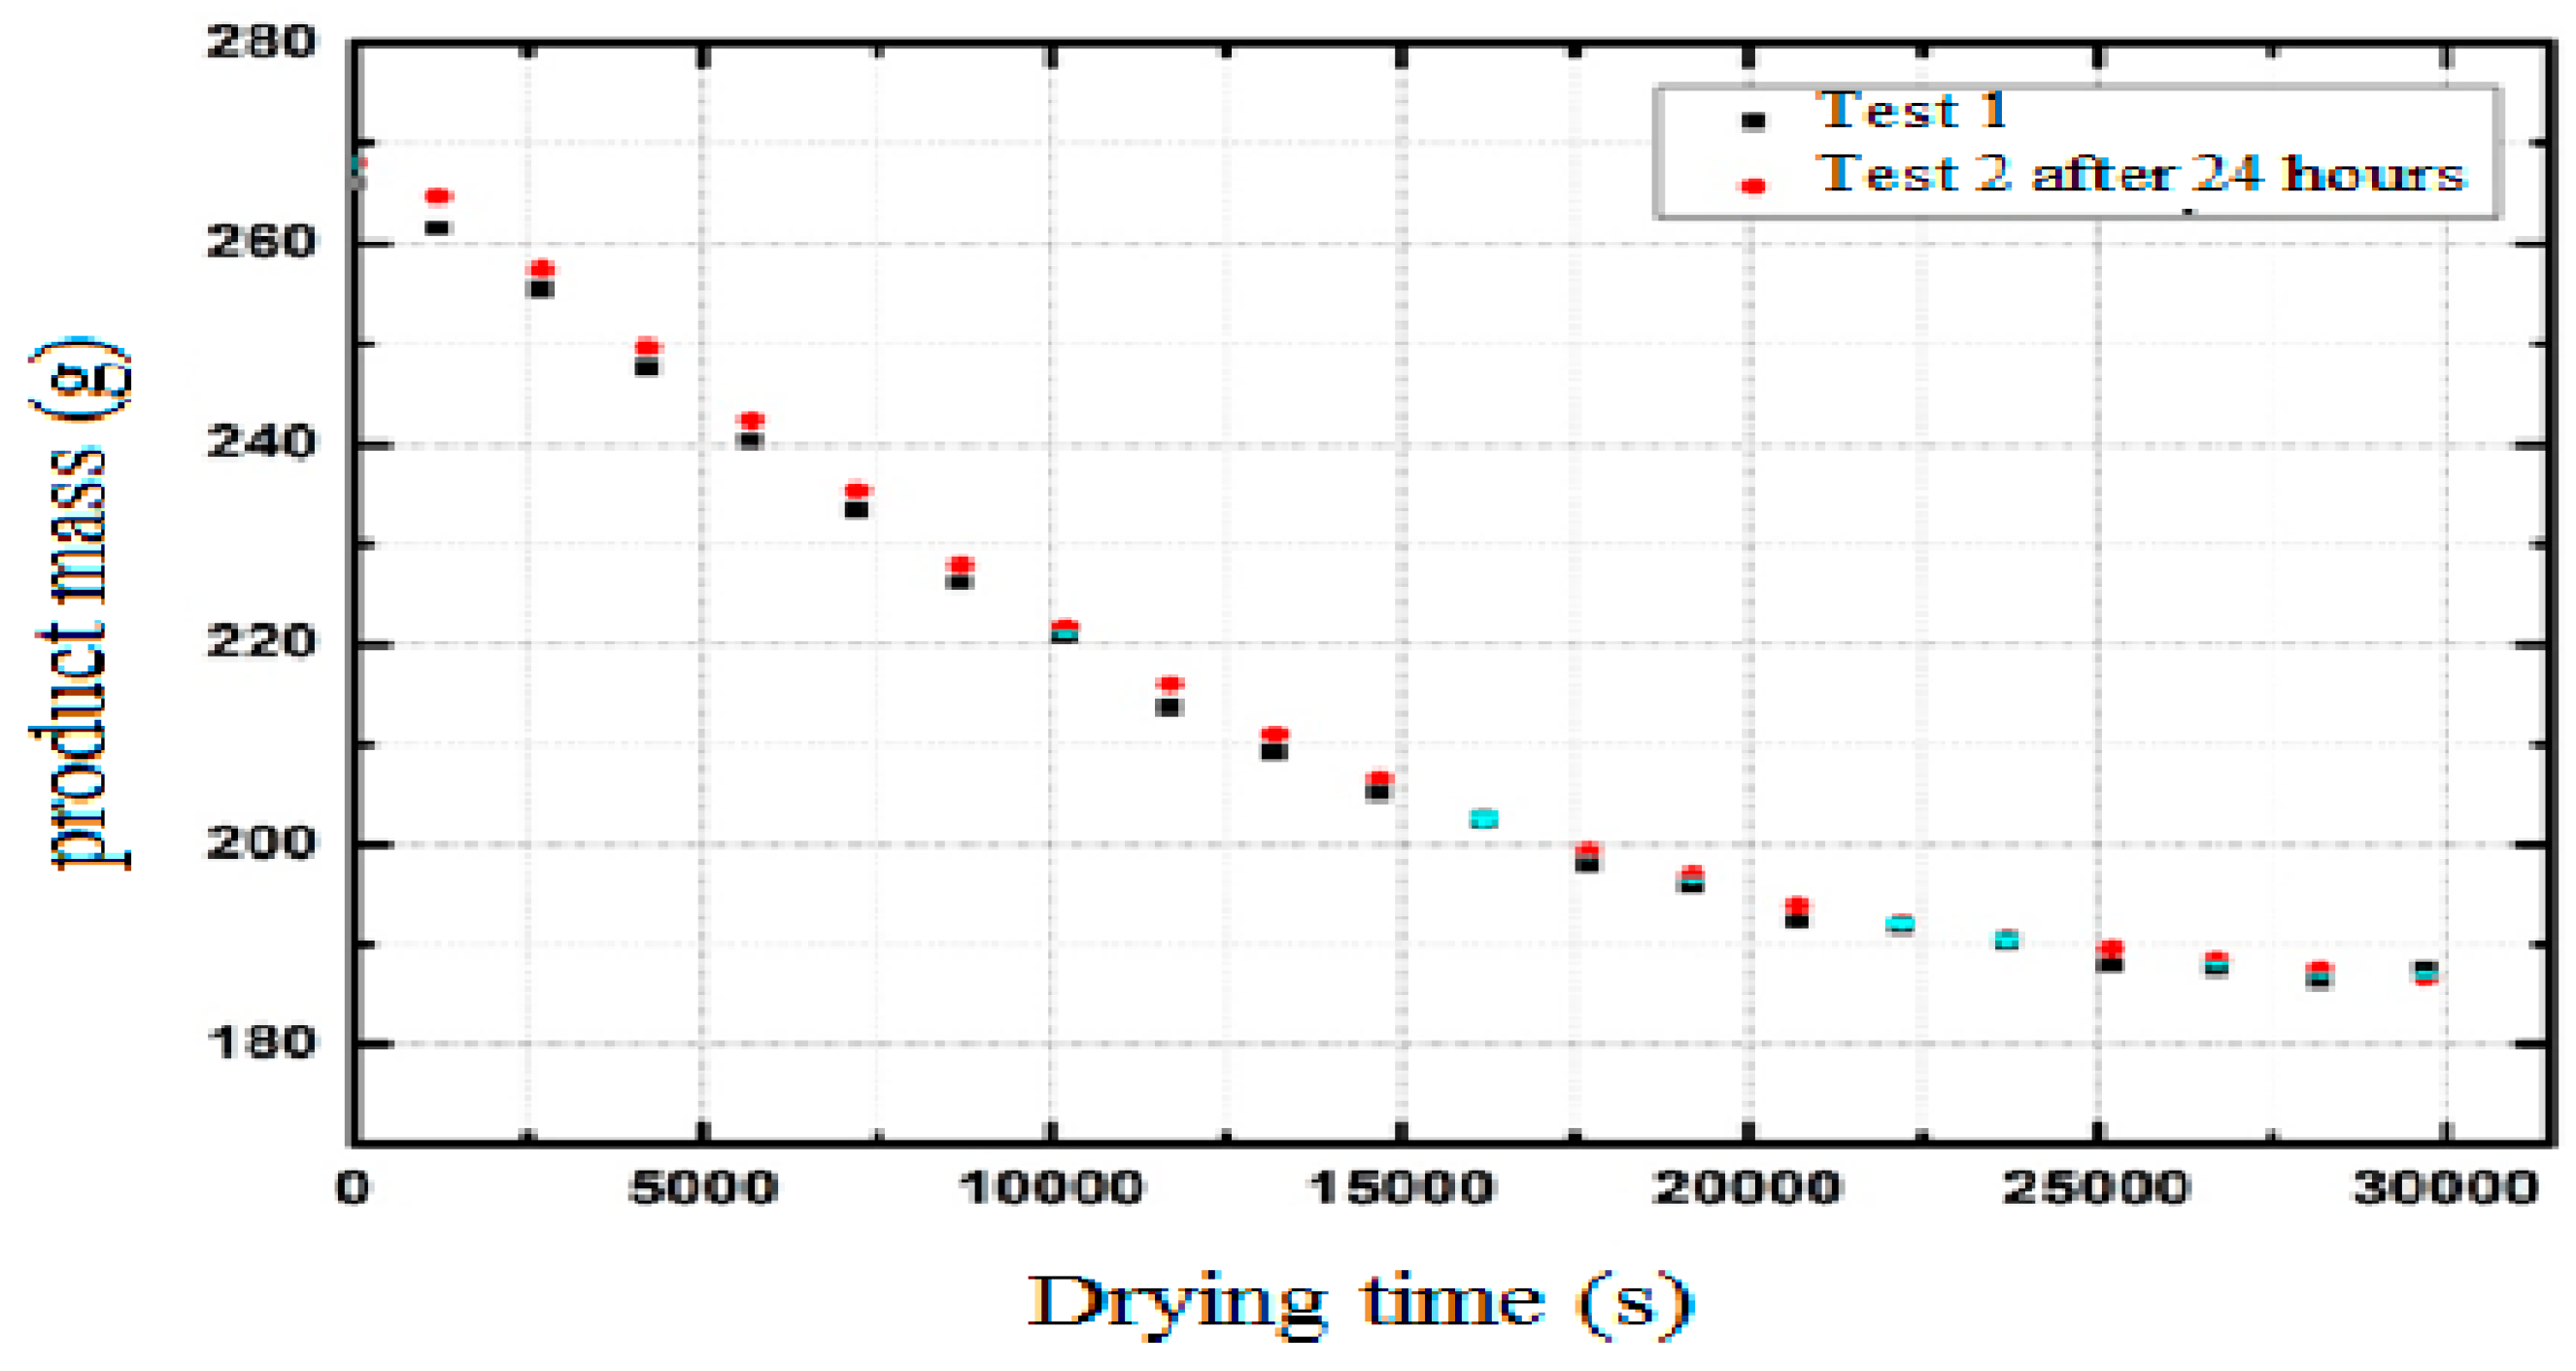
2.5. Reproducibility

The same experiment was performed several times and the results were interpreted statistically, to establish the repeatability of the experimental procedure. Here, repeatability is equated to the standard deviation of the mean, which is calculated by dividing the standard deviation by the square root of the number of samples in each set. Sufficient repeatability is guaranteed with a standard deviation of the mean equal to 0.165 and is close to the ideal value, i.e., zero. It was therefore verified that there are limited variations in the results obtained.
In Figure 3, the drying curves of the two drying tests of a granular bed of corn carried out under identical operating conditions and repeated after 24 h are shown. It has been noted that the difference between the different curves is relatively small, which testifies to the good precision and the reproducibility of the results.

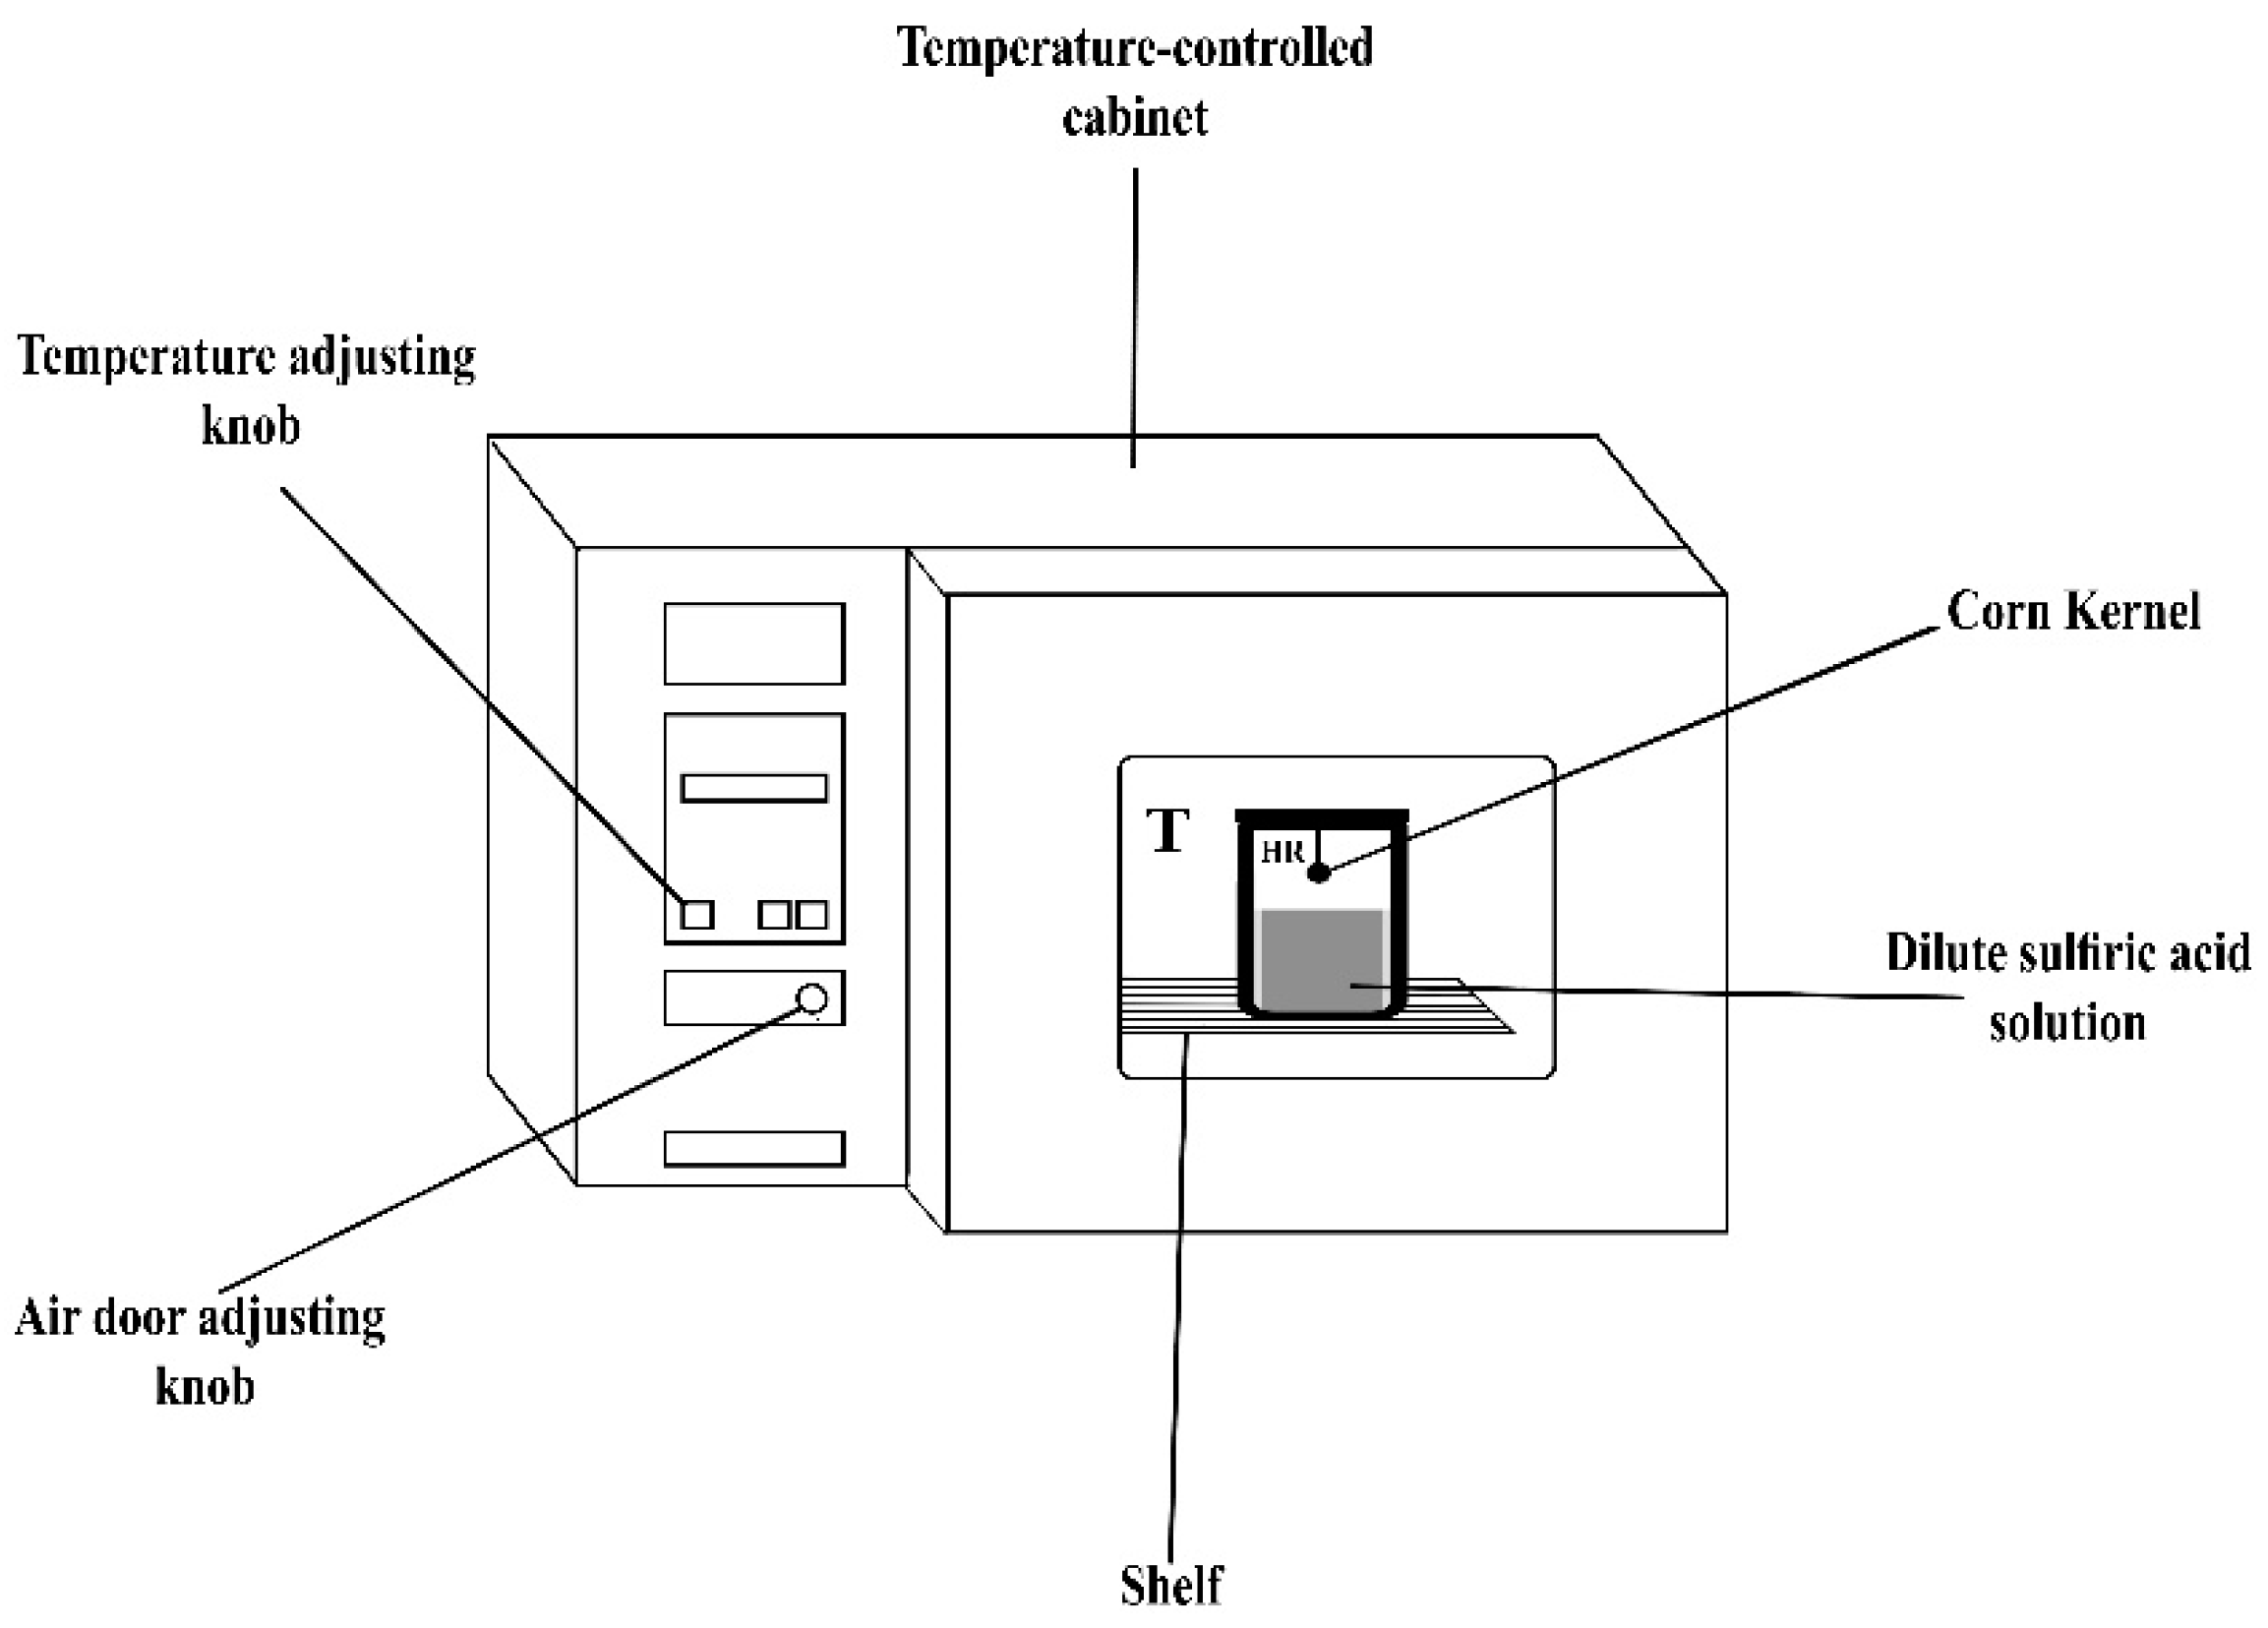
2.6. Desorption Isotherm Method

The equilibrium moisture contents of corn grain (Tunisian variety) were determined based on the static gravimetric method. The sample was disposed of for dehydration in desiccators and its weight was verified periodically in triplicate. The saturated samples of 0.320 ± (0.001) g were placed in a standard static system of hermetic glass jars, thermally stabilized and filled with dilute sulfuric acid solutions. These diluted solutions provided different relative humidities, depending on the acid concentration, and varied from 10% to 90%. These allow the specific relative humidity inside the desiccators to be kept constant. For a given acid concentration, the relative humidity depends slightly on the controlled temperature (Table 4).
The equipped desiccators were placed in a drying oven (Figure 4) operating in the temperature range of 30–250 °C with a fluctuation of ± 1 °C. Isotherm experiments were realized at 50, 60 and 70 °C (±0.1) °C.
During the experiment, the samples were weighed every 3 days using a digital high-precision scale ‘METTLER TOLEDO—PB 153-S, Classic’ with a precision of 10−3 g.
Samples weights were constant or the difference after three consecutive measurements of the mass of the samples was less than 0.001 g every 24 h and the desorption hygroscopic equilibrium was considered to be have been attained. The corn dry masses (Md) were estimated after the desiccation of samples in a vacuum oven at 105 (±1) °C for 4 h [75]. The following expression was used to calculate the equilibrium moisture content (Weq):
W e q = M e q M d M d = M H 2 O M d
where Meq is the equilibrium mass.

2.6.1. Fitting of Various Models to Desorption Isotherm Curves

Several empirical models available in the literature were used to fit corn experimental desorption isotherms. The correlations corresponding to these models are presented in Table 5.
The model parameters were estimated by fitting through nonlinear regression, using a least-squares Levenberg–Maquardt algorithm in the CURVE EXPERT 1.3 software.
The goodness-of-fit desorption model for the data was selected based on two statistical criteria, namely: the correlation coefficient (R2) and the reduced chi-square χ2. The lowest values of standard error and highest values of correlation coefficient had generally an acceptable fitting. The mathematical expressions of these two statical parameters are defined in detail in Appendix A.

2.6.2. Determination of the Net Isosteric Heat of Desorption

The net isosteric heat of desorption, also called the enthalpy of wetting, is closely related to the water state in food products. This property allowed us to predict the energy consumption for the drying process. In hygroscopic materials, the total isosteric heat of desorption required to evaporate pure water is the sum of net isosteric heat Qst,n and vaporization latent heat. The net isosteric heat of desorption can be determined based on the Clausius–Clapeyron equation (Equation (4)) at fixed moisture content) [81,82]:
ln ( a w ) ( 1 T ) = Q s t , n R

3. Results and Discussion

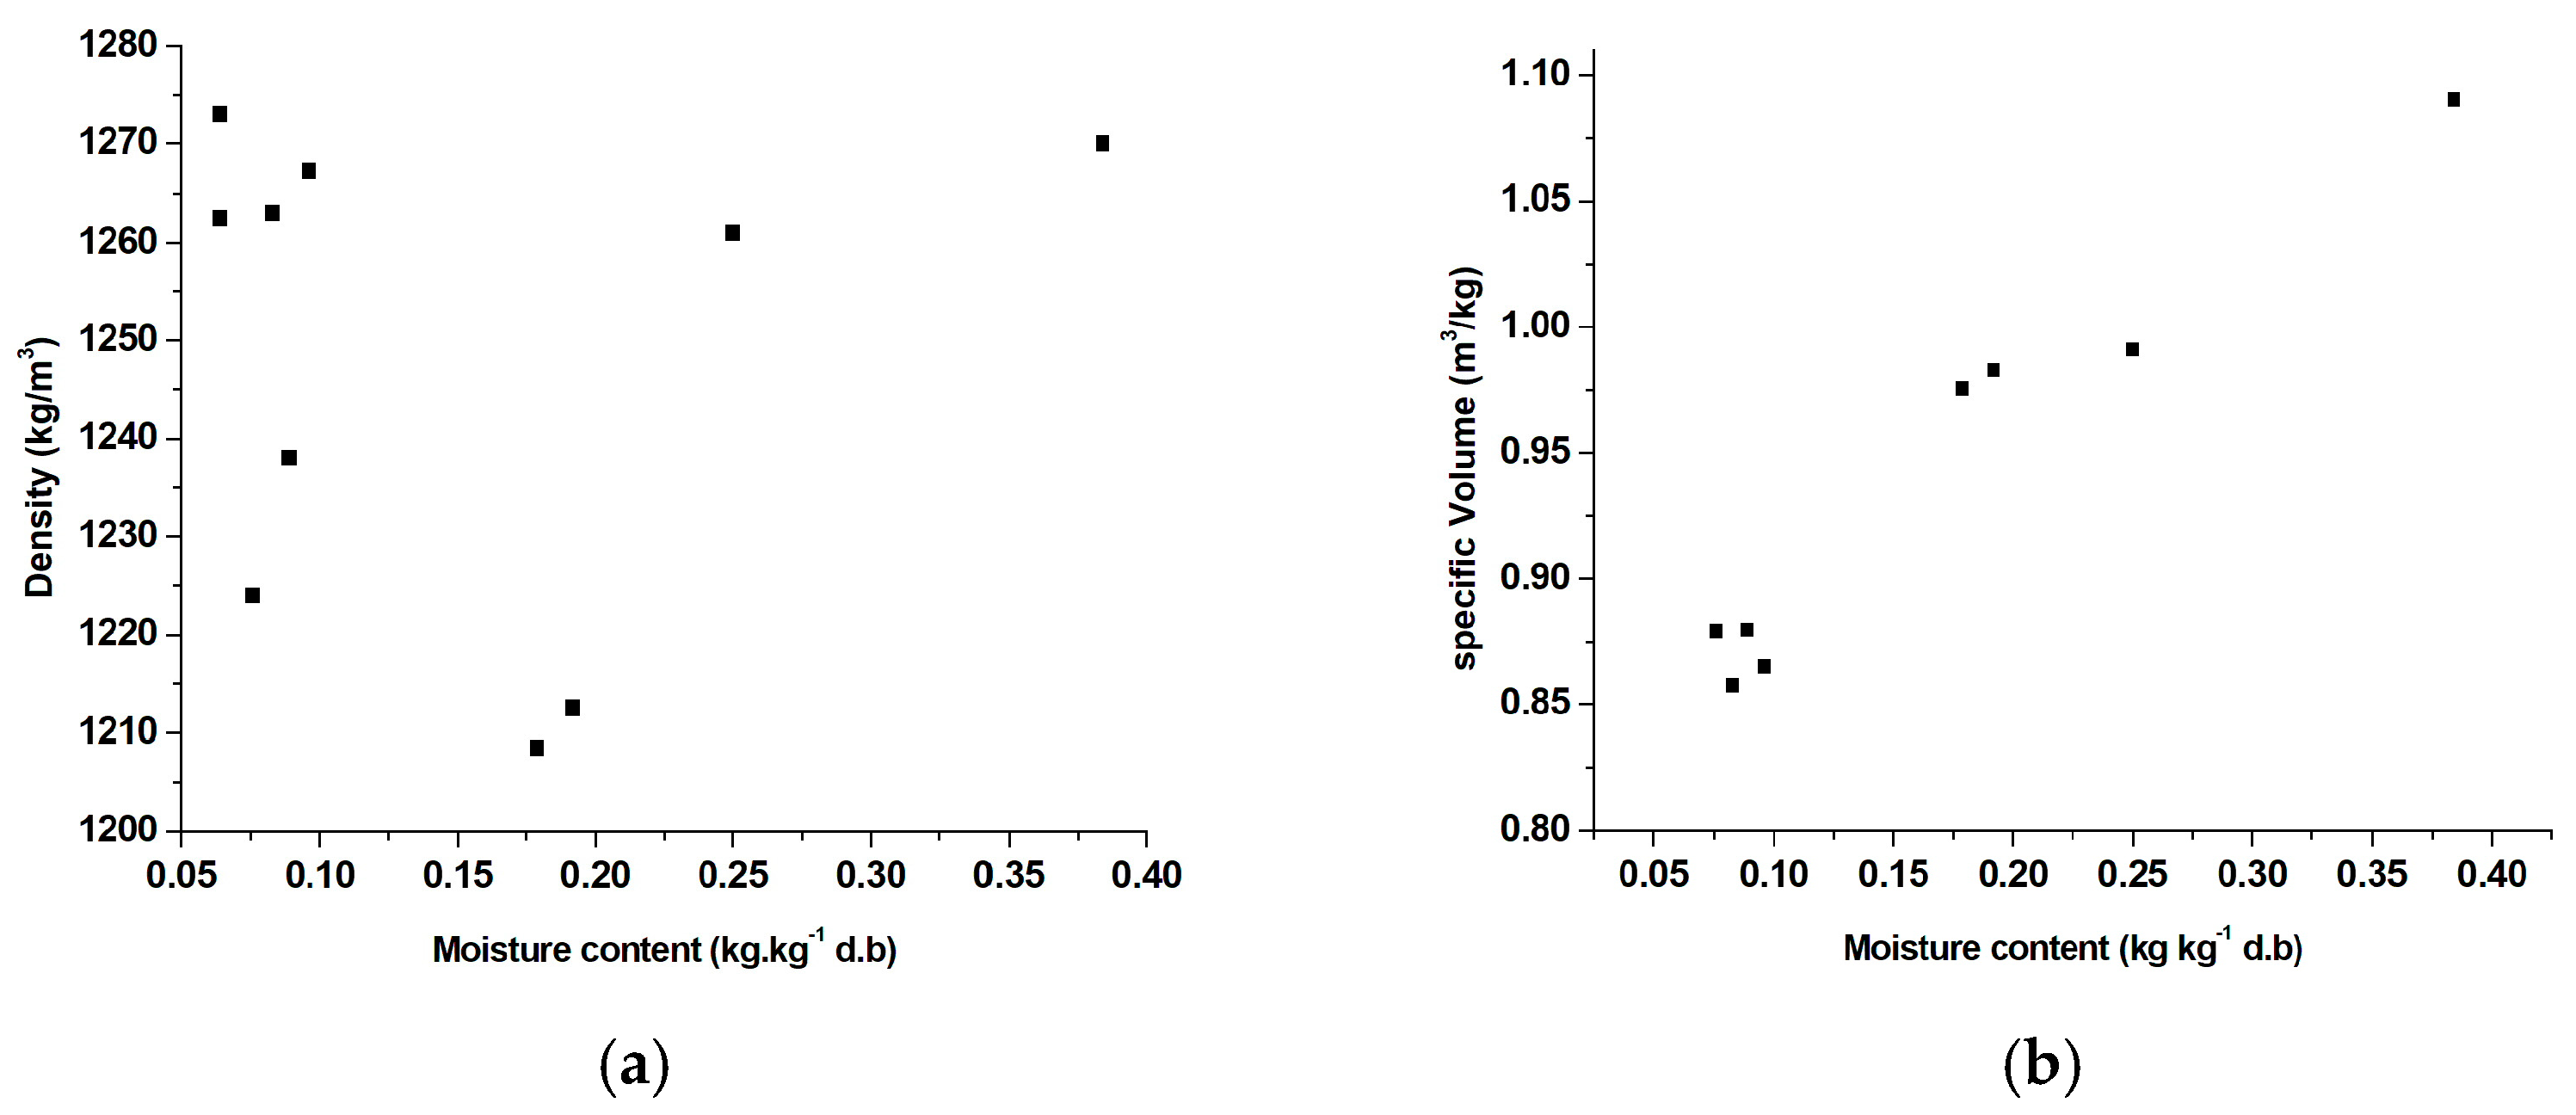
3.1. The Apparent Density

Figure 5a shows the evolution of the apparent density of corn grain as a function of the moisture content.
In this figure, it is observed that the decrease in the moisture content implies a decrease in the density of the material studied. The density adopts a mean evolution taking into account the two phenomena: water loss and volume shrinkage. This is because the porosity of corn is not negligible and increases as water is removed. Each porous material is characterized by its evolution curve. For corn, the weight reduction is followed by a small volume change so the density decreases under the influence of water loss during drying. Similar results were obtained by Martynenko [83], who stated that the drying process resulted in either a decrease or increase in bulk density, depending on the temperature and material shrinkage.

3.2. The Specific Volume

In the initial state, the medium is saturated with liquid; the initial moisture content and the initial density are respectively defined as follows:
W 0 = ρ l l ϕ 0 ρ s s ( 1 ϕ 0 )
ρ 0 = m l 0 + m s v l 0 + v s = ( 1 + m 0 ) W 0 ρ l l + 1 ρ s s
The density of a substance is the ratio of its mass to its volume, defined as follows:
ρ = m s + m l v = ρ s ( 1 + W )
where ρ s is the apparent density of the dry solid.
The partial specific volume reduced to the unit mass of the pure product is expressed by the following relationship:
V ¯ = v m s = 1 + W ρ
Equation (8) allows us to deduce the curves of the specific volume of corn grain depending on the moisture content. The result obtained (Figure 5b) shows that the specific volume varies slightly with the moisture content of the material. Similar results were obtained for pears by Guiné, et al. [84] which suggested that this variation was caused by liquid displacement.

3.3. Drying Kinetic

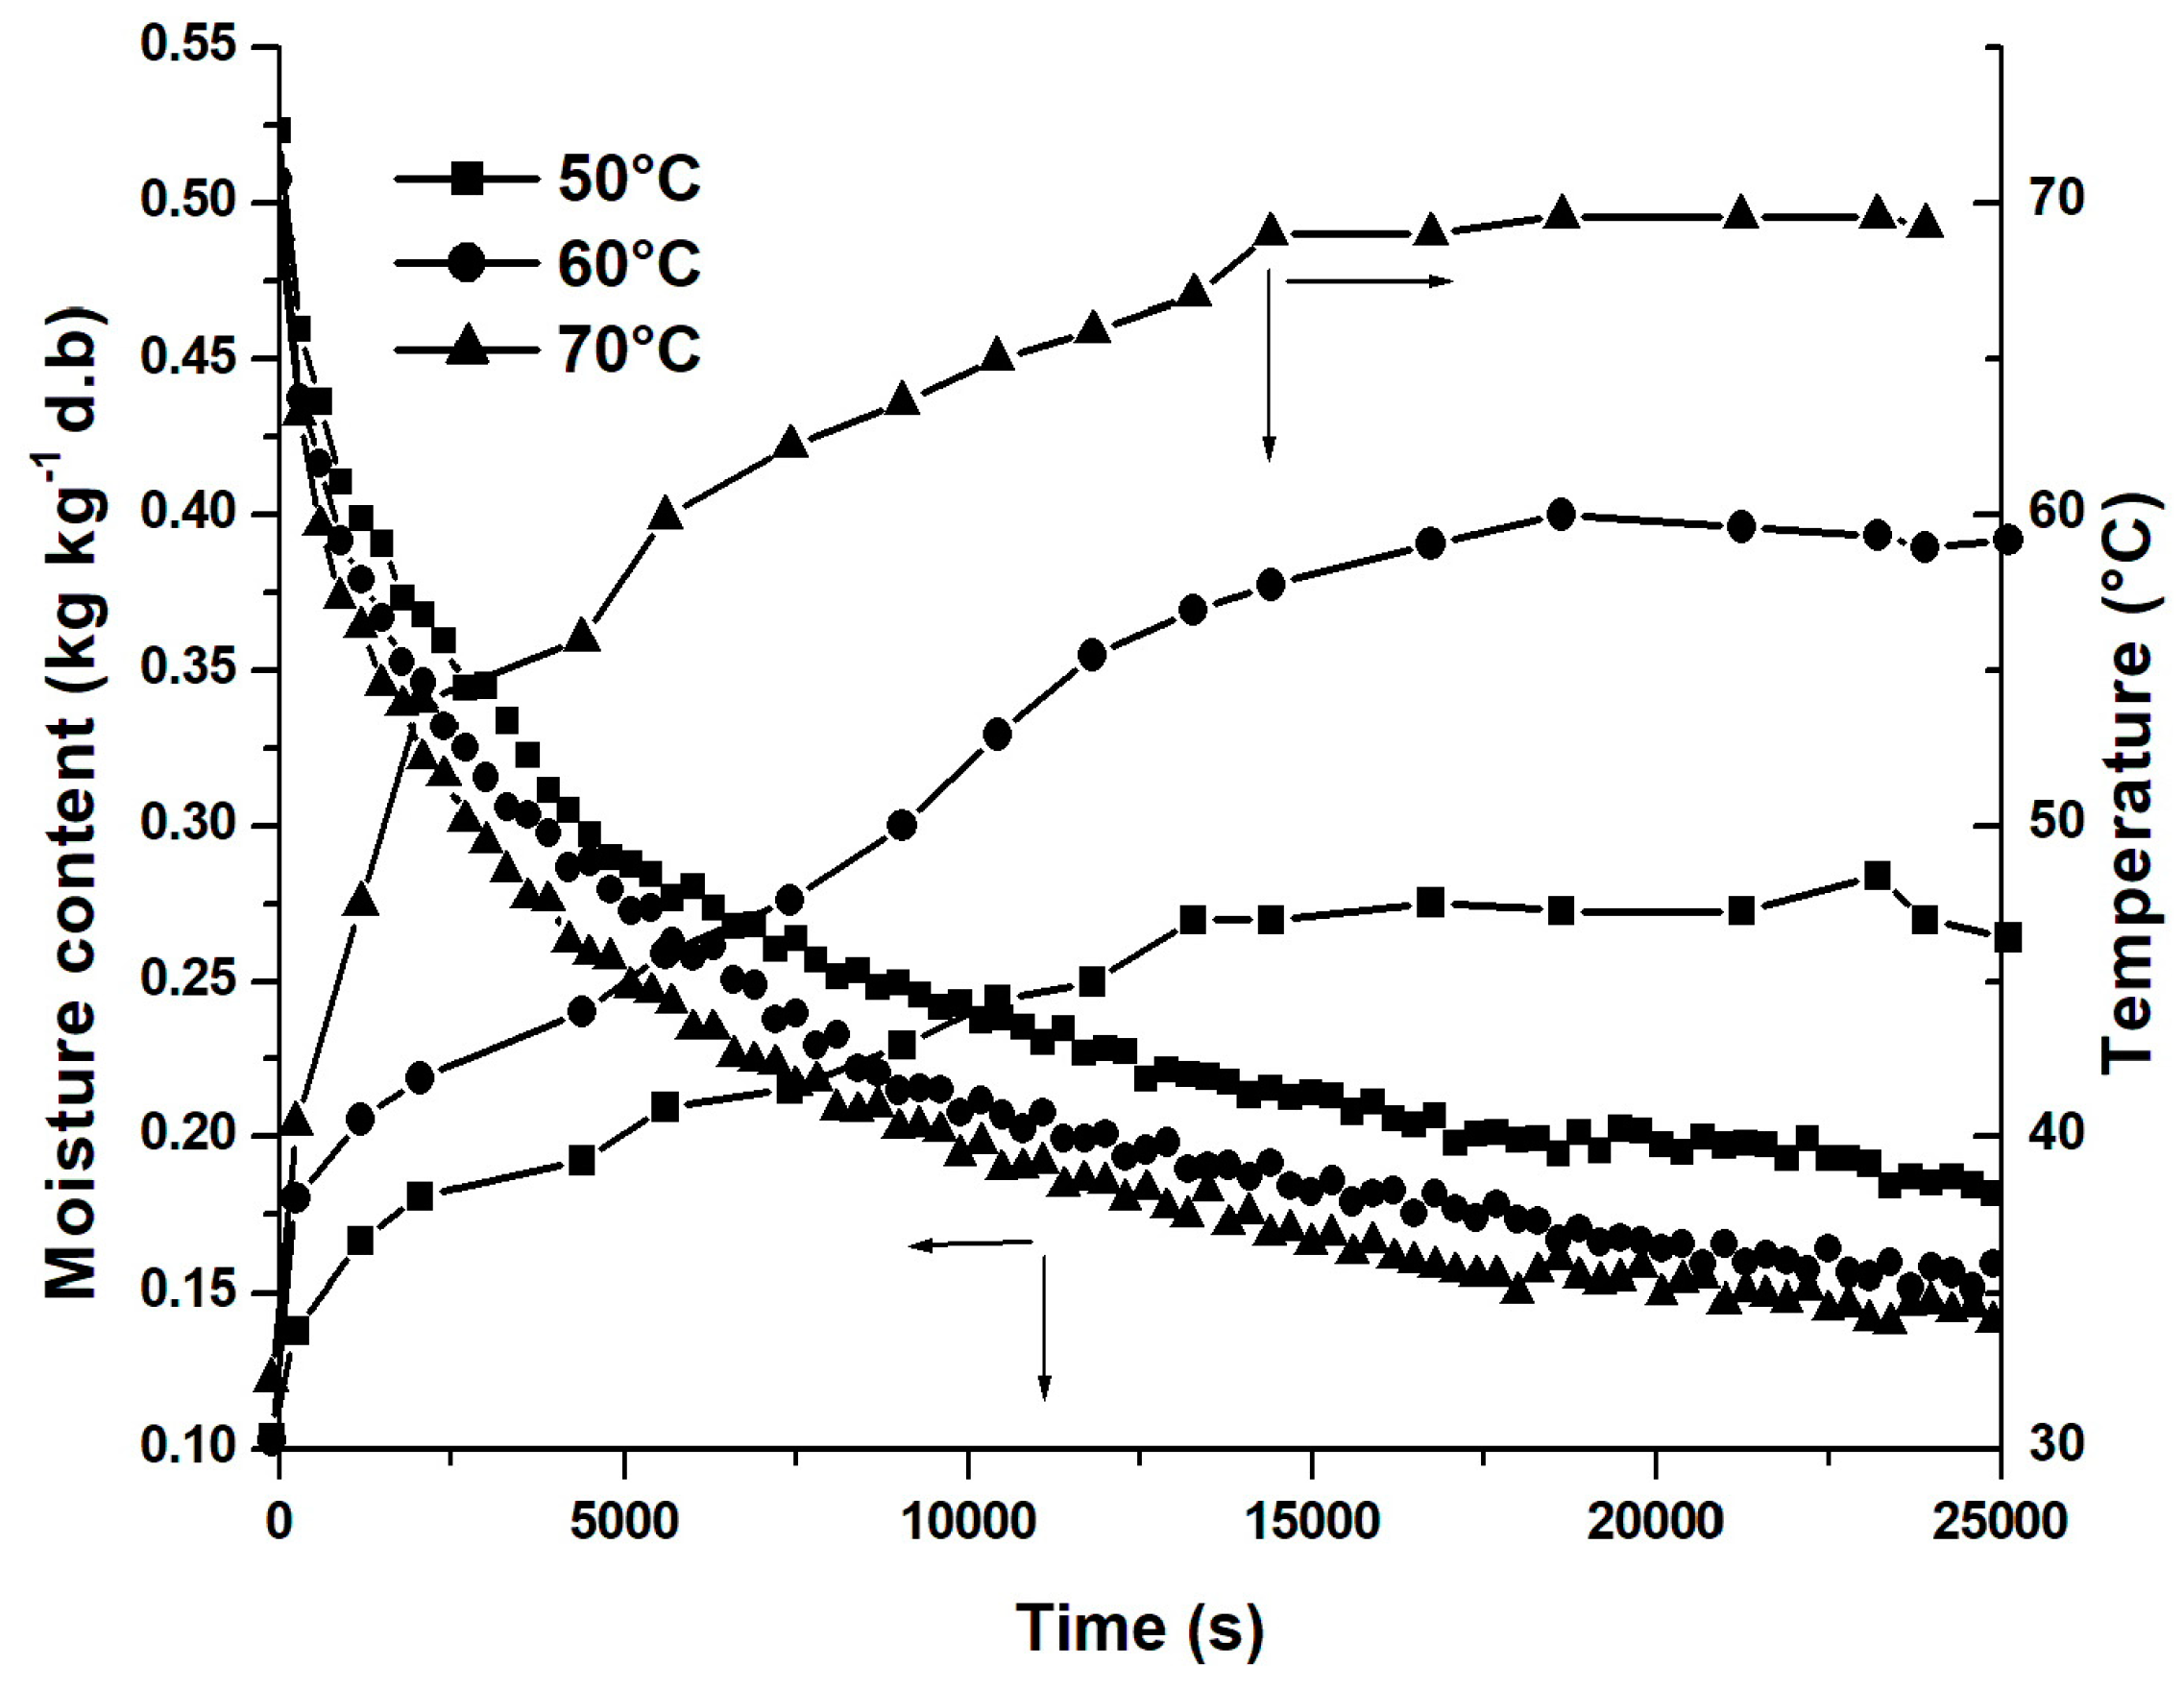
3.3.1. Effect of the Air Temperature

To compare the different kinetics of drying, it is preferable to convert the moisture content (W) of a single non-dimensional form, which can be written by:
W = W t W 0
where Wt and W0 are, respectively, the moisture content at time t and the initial moisture content.
Figure 6 illustrates the effect of the air temperature on the evolution of moisture content and temperature of the thin layer of corn.
It is noted that by increasing the air temperature, the drying time decreases and the drying process becomes faster. For example, to achieve a reduced moisture content equal to 0.2 kg/kg (d.b), the drying time decreases from 280 min for an air-drying temperature equal to T = 50 °C to 200 min for an air temperature equal to T = 60 °C and to 150 min at T = 70 °C.
In all those cases, steady-state conditions are reached. An increase in the air-drying temperature can influence the evolution of the moisture content and the temperature of the product during the time that can cause a decrease in the total time of operation. This causes the moisture diffusion in corn kernels to become greater with a higher kernel temperature, which results from a higher rate of heat transfer between the corn kernels and the drying air [85]. Similar findings were reported by Doymaz [86] and by Pardeshi et al. [87] for the drying of corn and green pea kernels, respectively.

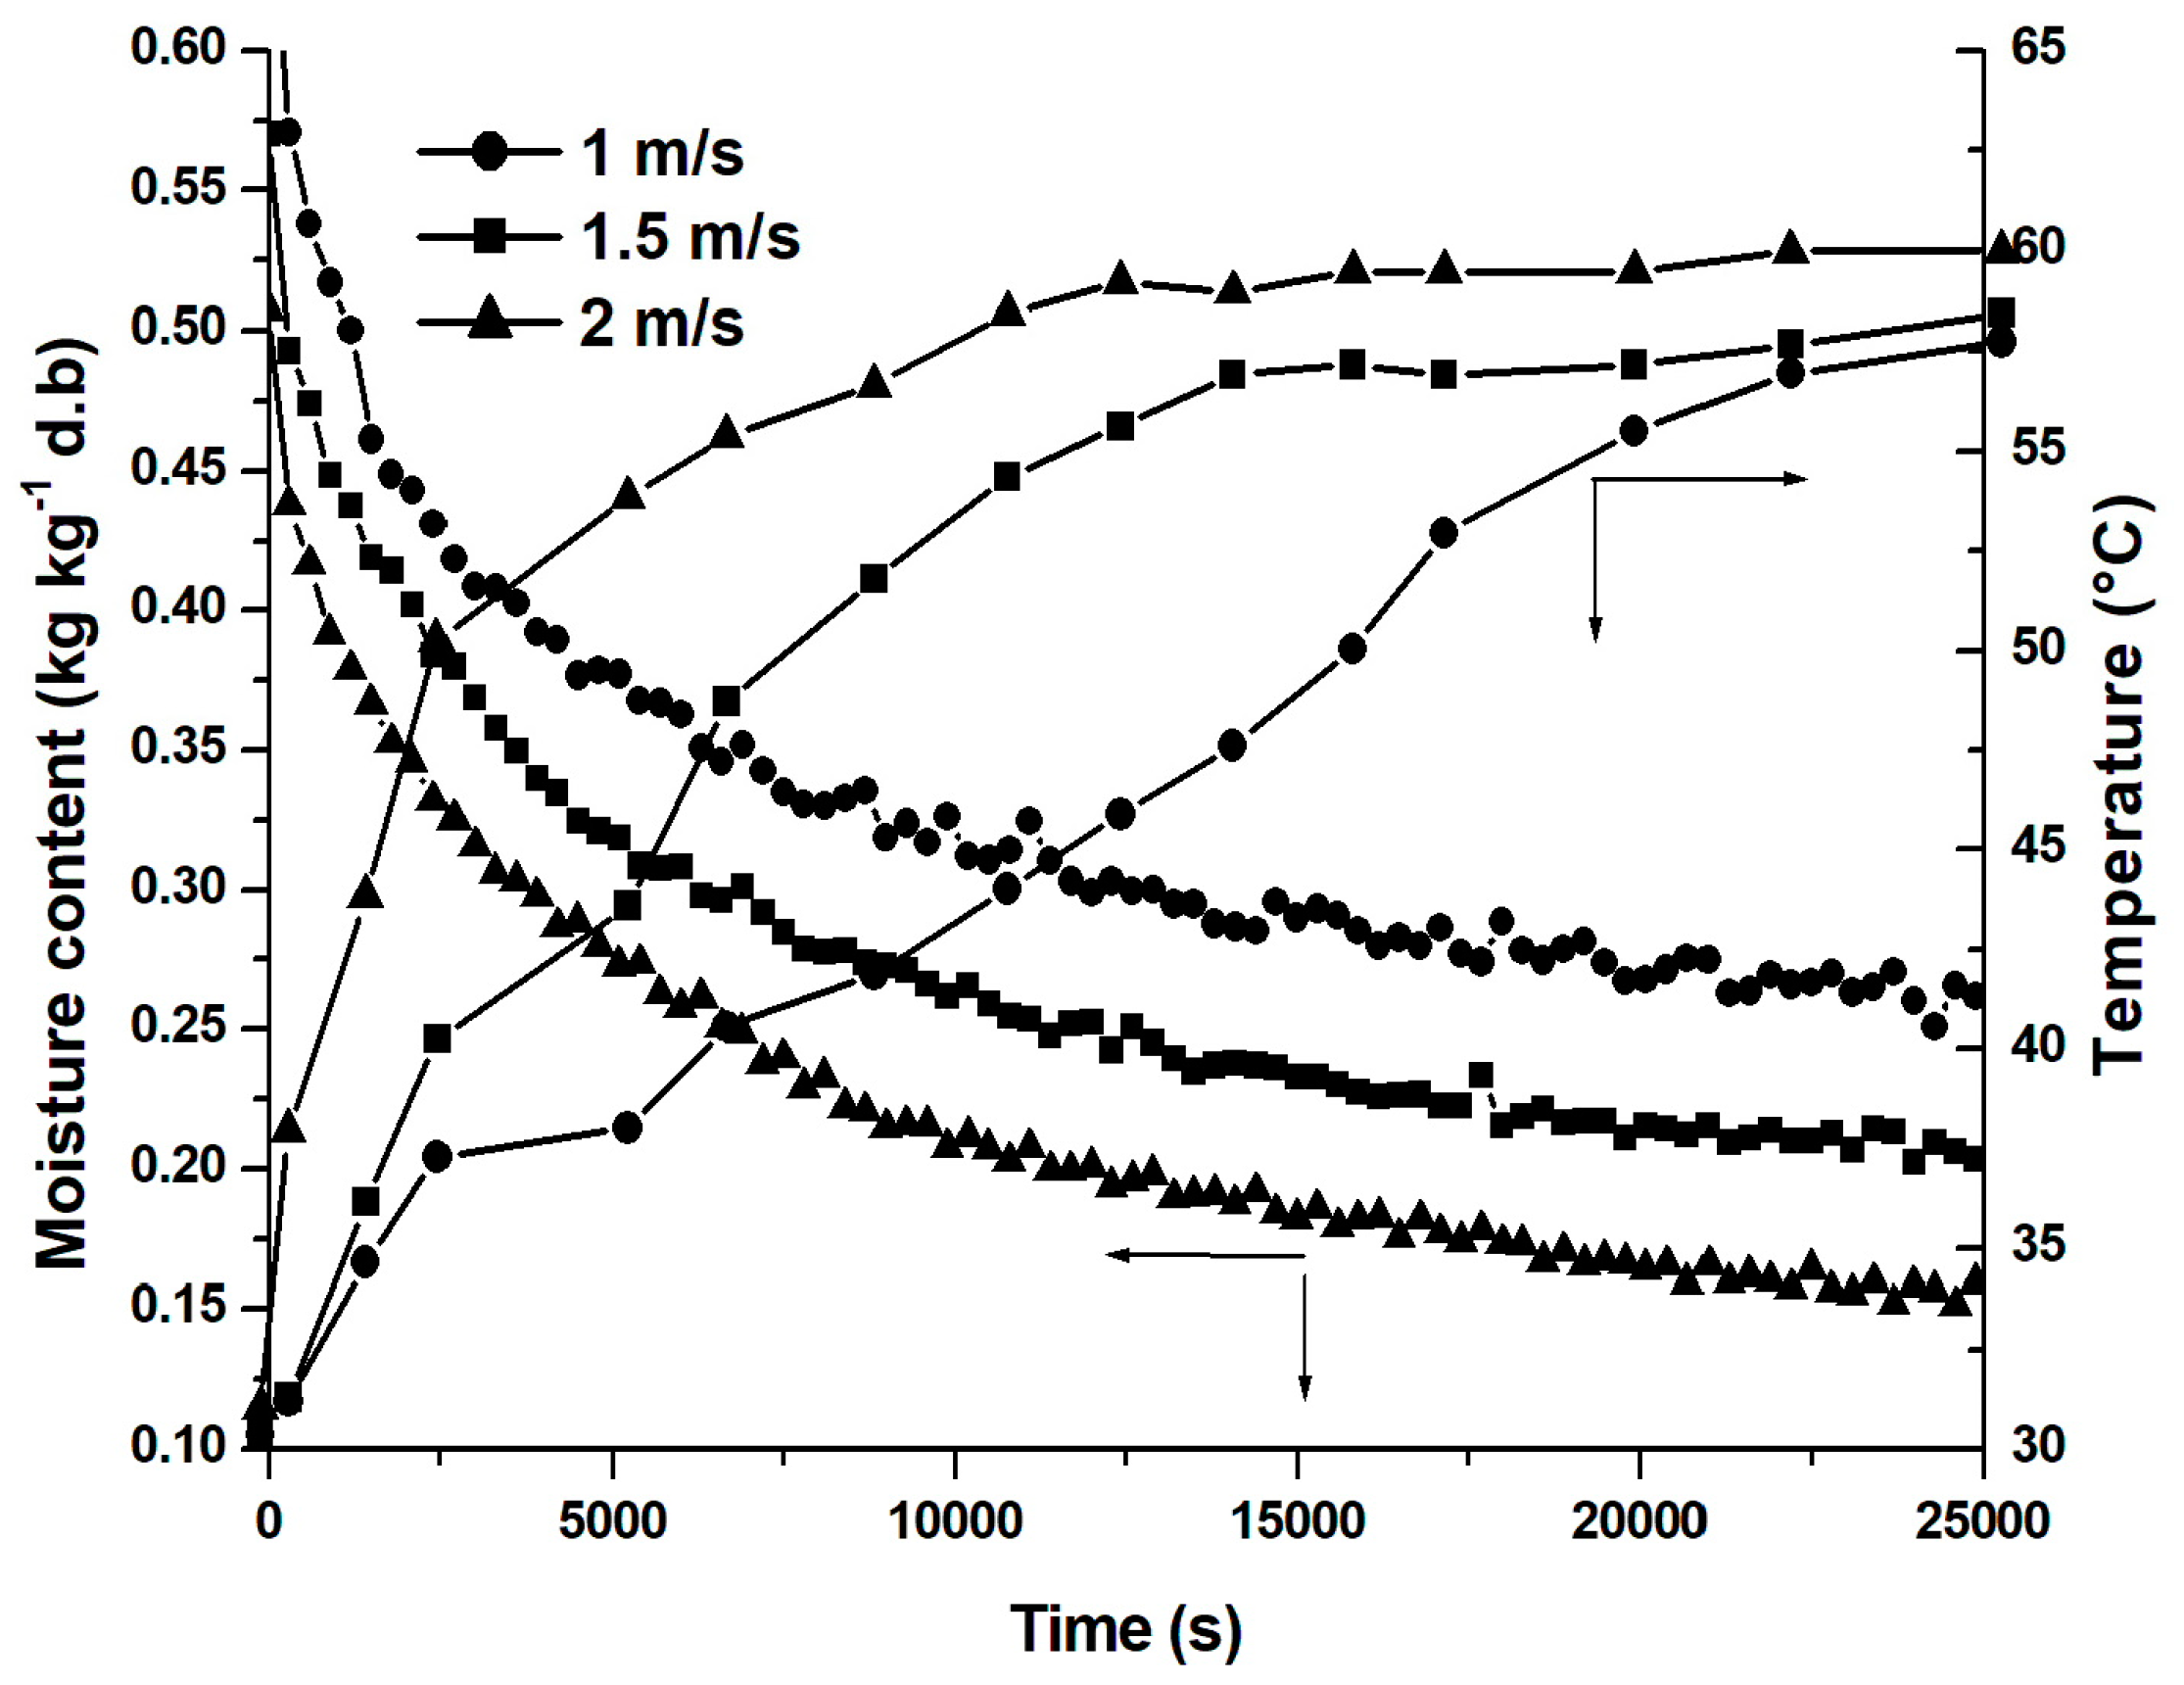
3.3.2. Effect of the Air Velocity

Figure 7 highlights the effect of the fluid velocity on the temporal evolution of the moisture content and the temperature of the thin layer of corn kernels for a temperature of dry air equal to 60 °C and three air velocities of 1 m·s−1, 1.5 m·s−1 and 2 m·s−1. It is observed, from these curves, that an increase in the air velocity causes a decrease in the drying time of the process. These tests show that the drying kinetic increases when the air velocity increases from 1 m·s−1 to 1.5 m·s−1 to 2 m·s−1; this is mainly due to an increase in the convection at the surface of the sample.
Through these results, the existence of the two phases of drying kinetics has also been confirmed. Thus, the most effective force governing the moisture movement in the corn is diffusion, the air velocity (2 m·s−1) is essential to reducing the air-drying resistance inside the product, and the resistance on the outside of the product is not very important [9]. Similar results were observed by several studies, such as Emel et al. [8] and Krokida et al. [88].

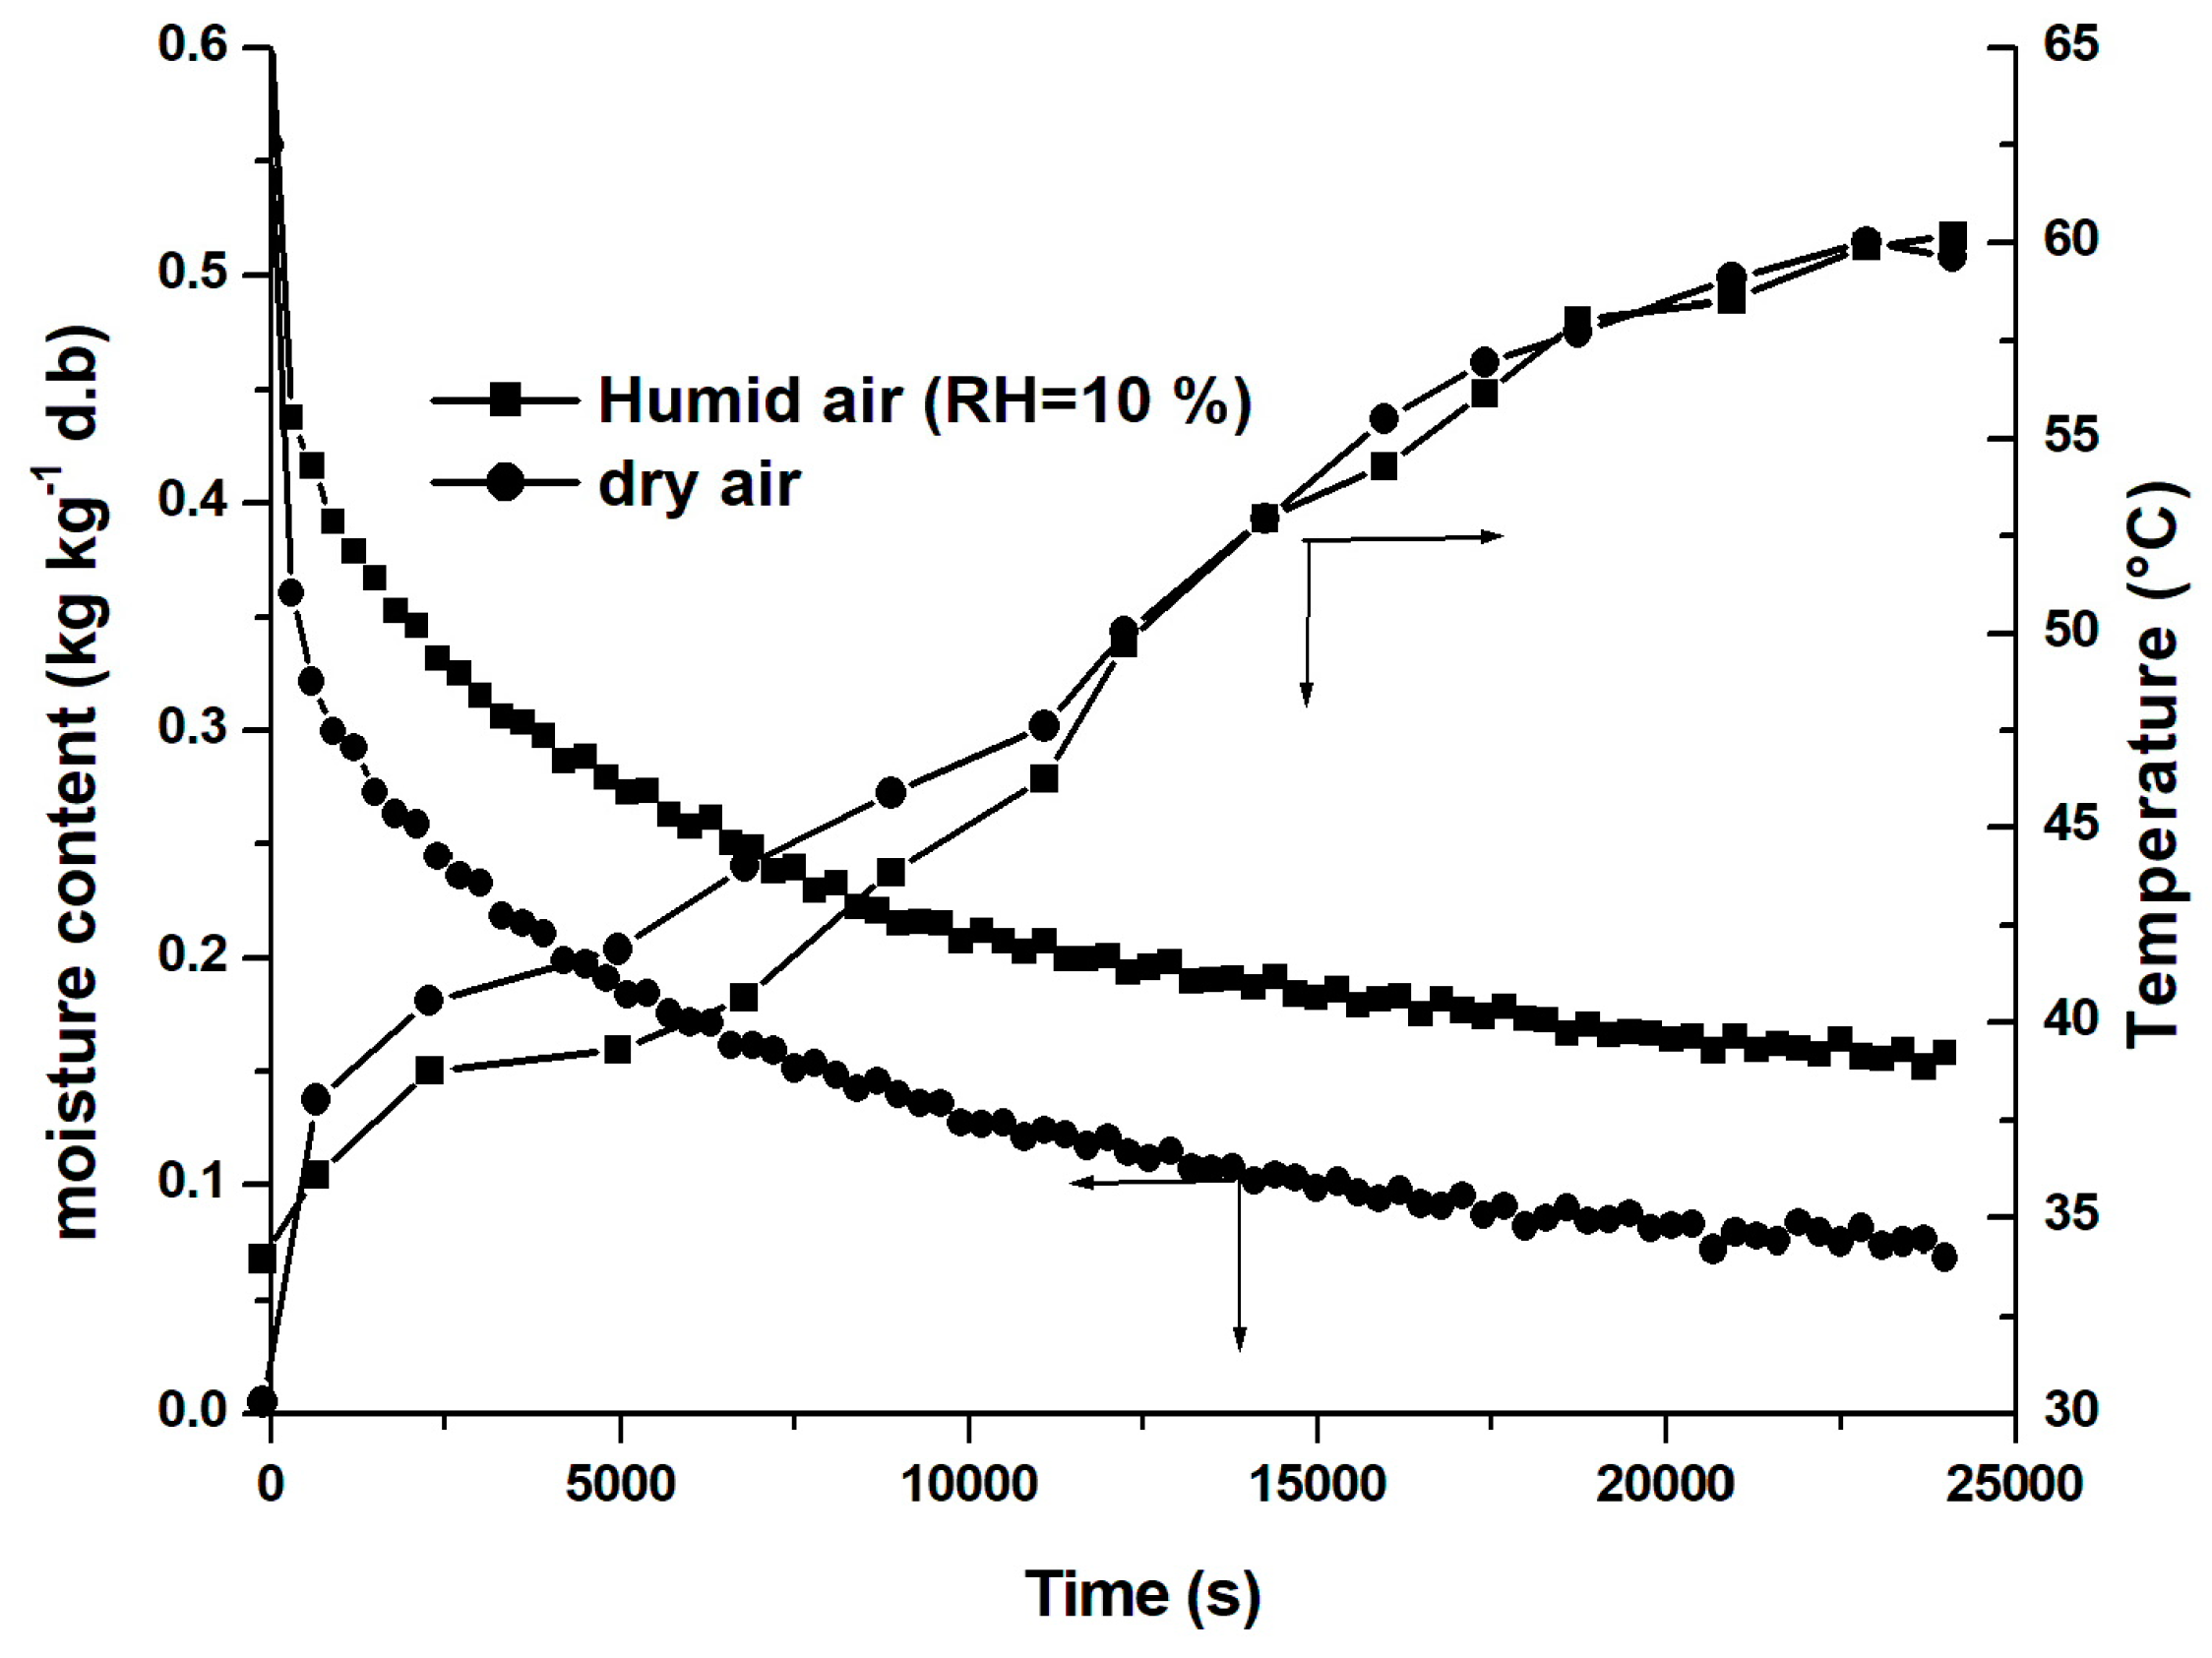
3.3.3. Effect of the Relative Humidity of the Air

Figure 8 shows the effect of air humidity on the evolution of the moisture content and the temperature of the corn. Two cases were studied: humid air (RH = 10%) and dry air (RH = 0%).
It was noted that a rise in relative humidity leads to a 10 min rise in the drying time. The initial moisture content of the corn was found to be 0.45 kg/kg (d.b) and was decreased with a decrease in the relative humidity of the drying air. A period with a constant drying rate was not found and drying was found only in the falling rate period. The absence of a period with a constant rate may be due to the absence of free surface water; therefore, no surface evaporation took place at a constant rate. Indeed, a decrease in the relative humidity increases the difference between the vapor pressure at the surface of the product, and the vapor pressure of the ambient medium improves the evaporation mass flow and accelerates the operation of the extraction of water. So, the drying time is decreased. The result was consistent with the previous works of Curcio et al. [89] and Barati [90] for the drying of carrots and mango, respectively.

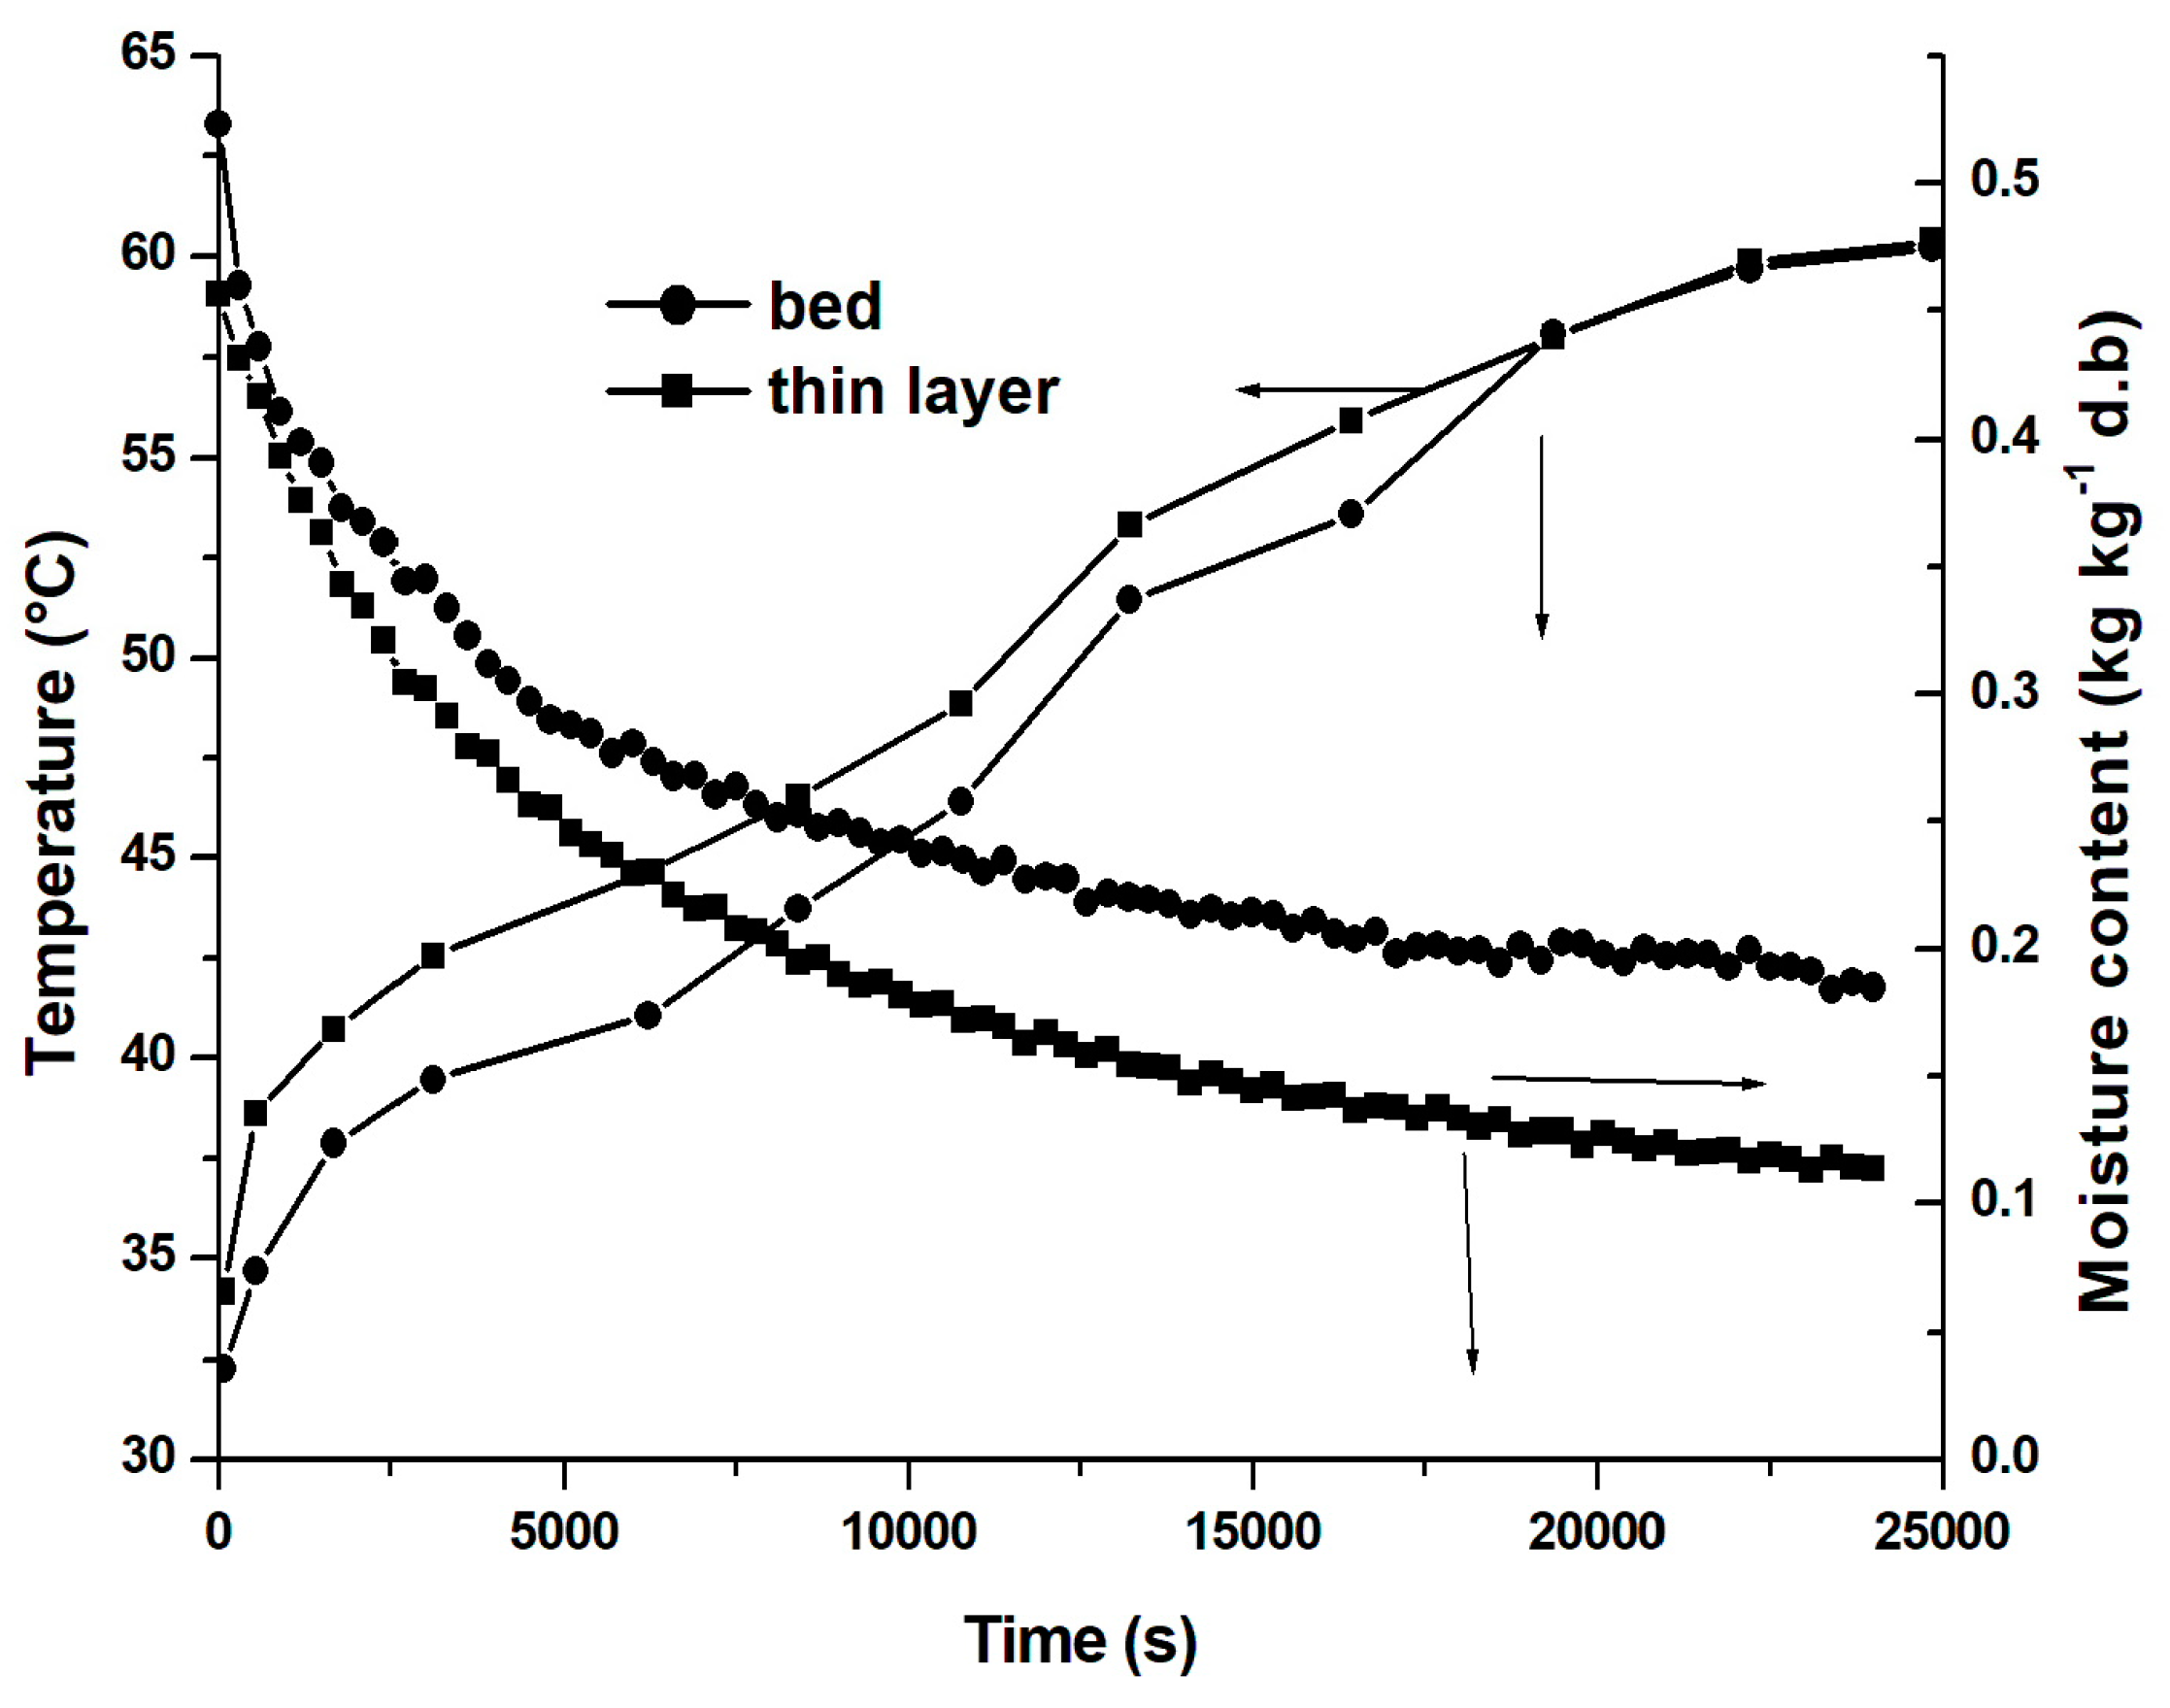
3.3.4. Comparison between the Convective Drying of a Packed Bed and a Thin Layer

In this section, a comparison between the experimental convective drying of a packed bed and a thin layer was performed with the same conditions without varying the total mass of the product. The thin layers of corn were about 7 mm in thickness (a single layer of corn deposit in a square form) and the packed bed was a cylindrical bed with a radius of 4 cm and a height of 4 cm.
Figure 9 shows the difference between the evolution of the moisture content and the solid temperature of the thin layer and the packed bed of corn. Fixing the air velocity at 1 m·s−1 and the initial mass of grain (32 g), the temperature of the drying fluid is equal to 60 °C. The experimental results show that the drying became faster on the thin layer. This can be explained by the decrease in the depth which generates a large surface area for both heat and mass transfer. Therefore, the majority of the supplied energy is used for the evaporation of water from the products. Similar results for shallow beds are also reported in the literature [91,92].

3.4. Desorption Isotherm

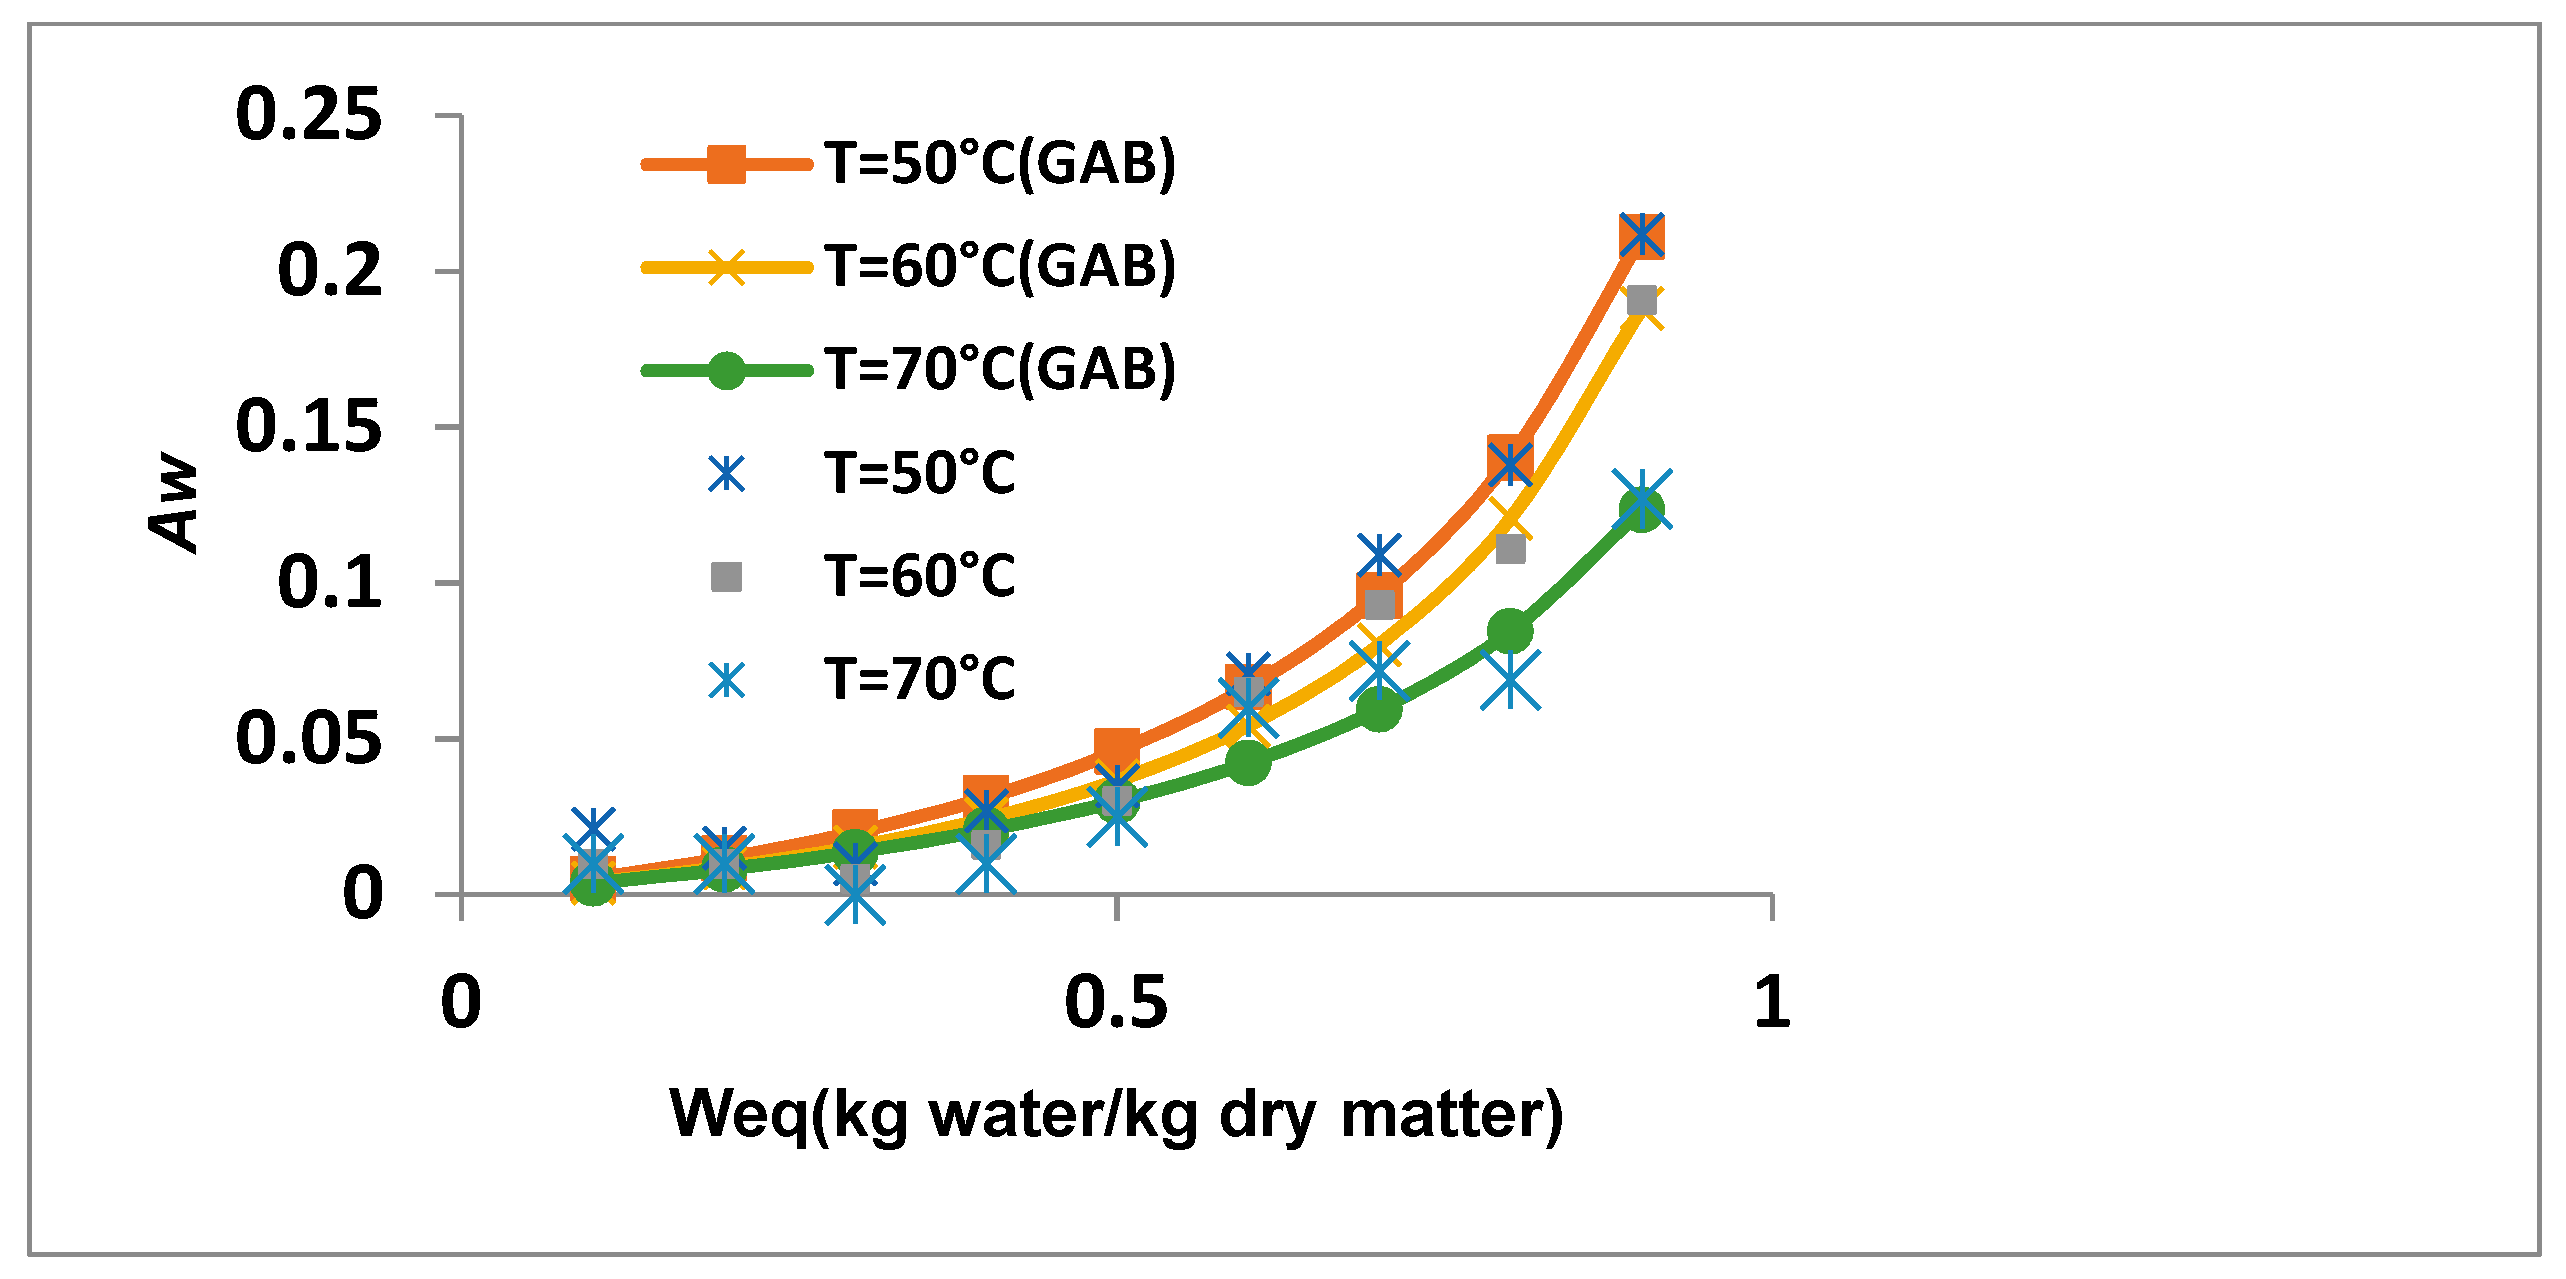
3.4.1. Fitting of Various Models to Desorption Isotherm Curves

The experimental desorption isotherms curves of the corn grain at different temperatures (50 °C, 60 °C and 70 °C) are presented in Figure 10.
According to the BET classification [93], the desorption isotherm of corn kernels takes the sigmoid form of type II as reported by many, namely Shrikant Baslingappa Swami [38], Van Der Berg [94] and Al-Muhtaseb et al. [95] for black gram nuggets, starch and starches powders, respectively.
The results of the regression analysis were submitted by selecting seven mathematical models cited in the literature and comparing the fitting degree of each model using the CURVEEXPERT 1.3 software. The relationship between the studied variables was then determined by the coefficients generated by the used models. The parameters of the seven equations were fitted to desorption experimental curves obtained at different temperatures and summarized in Table 5.
According to the obtained results, the GAB model is the preferred model to fit the corn moisture desorption behaviour in this work, which gives a more suitable adjustment to the experimental data with an R-value above 99% and Χ value of nearly zero. This sorption model is thus suggested to estimate the equilibrium moisture content of corn kernels.
The monolayer moisture content Wm in the GAB model represents the material moisture content when the entire surface is covered with a unimolecular bound layer of moisture. It also represents the optimum moisture content for maximum shelf stability [94]. According to the results shown in Table 6, the monolayer moisture contents in the GAB model are greater than that in the BET model and decrease as the temperature increases; this is justified by modifying the physical and chemical characteristics of the material by the increase in temperature, so that mitigation occurs in a number of the active sites [96]. Similar results for starch powders, walnut kernels and whole yellow dent corn have been found, respectively, by Al-Muhtaseb et al. [97], Togrul et al. [98] and Samapundo et al. [99].

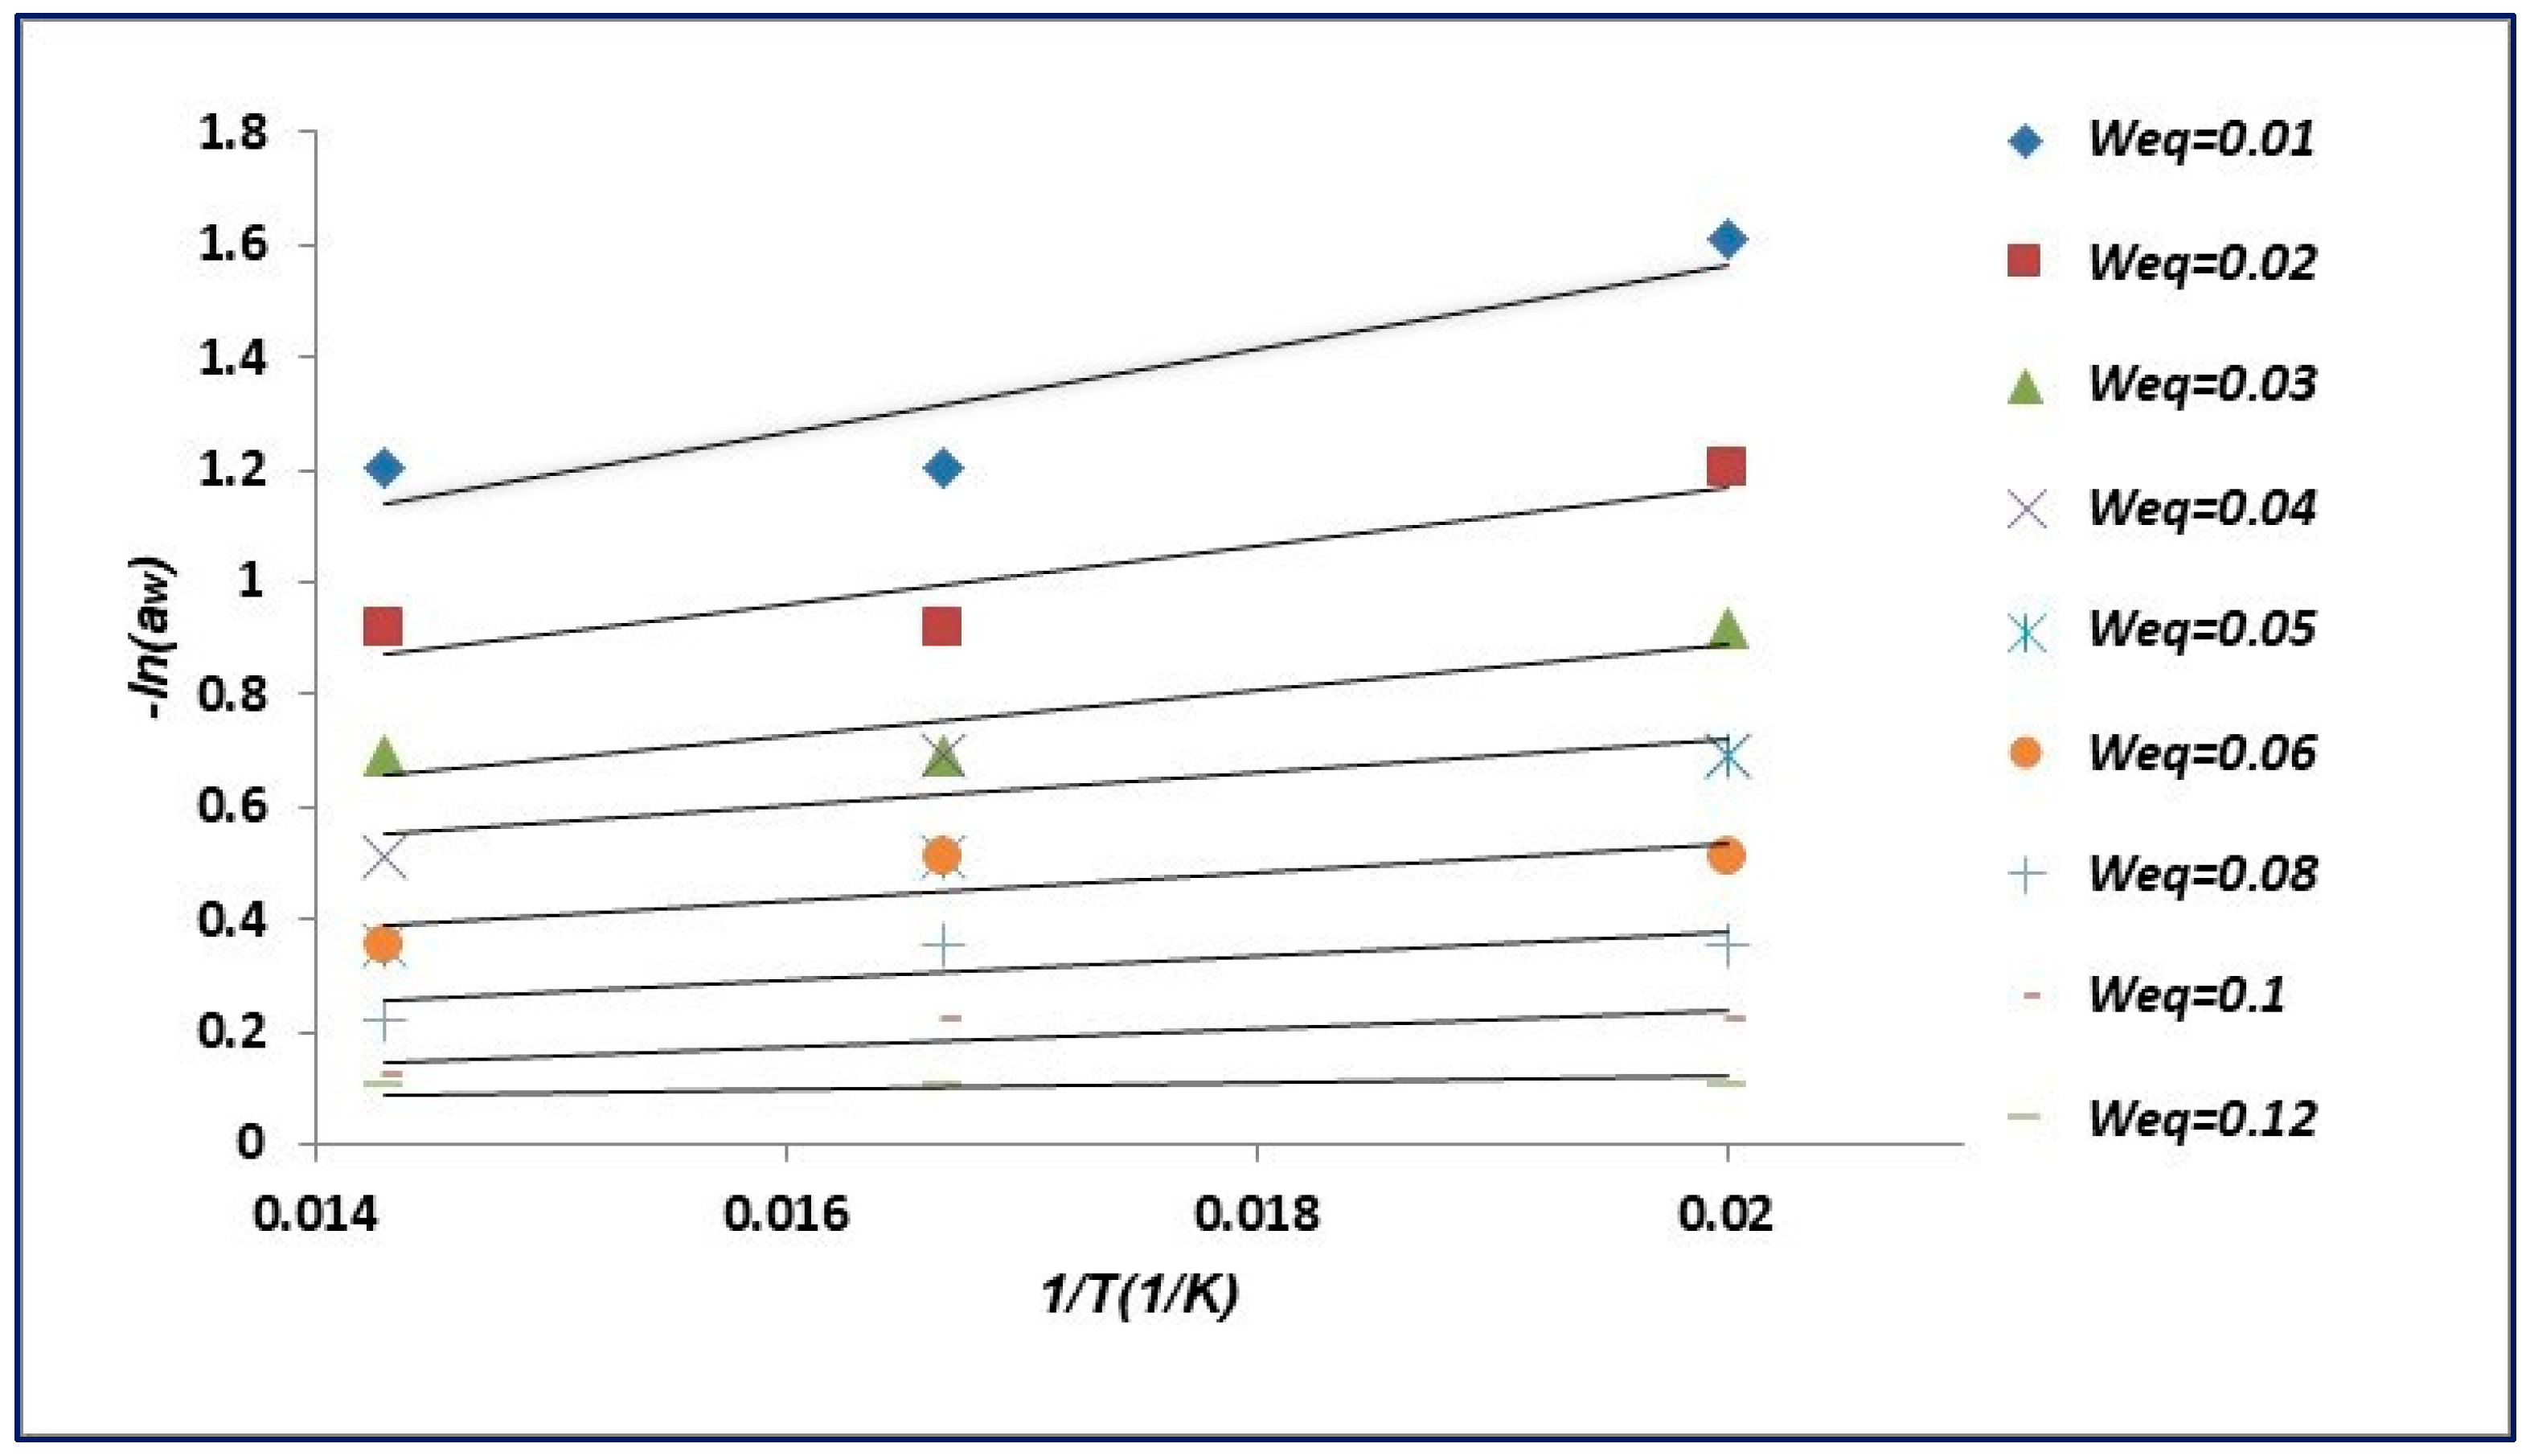
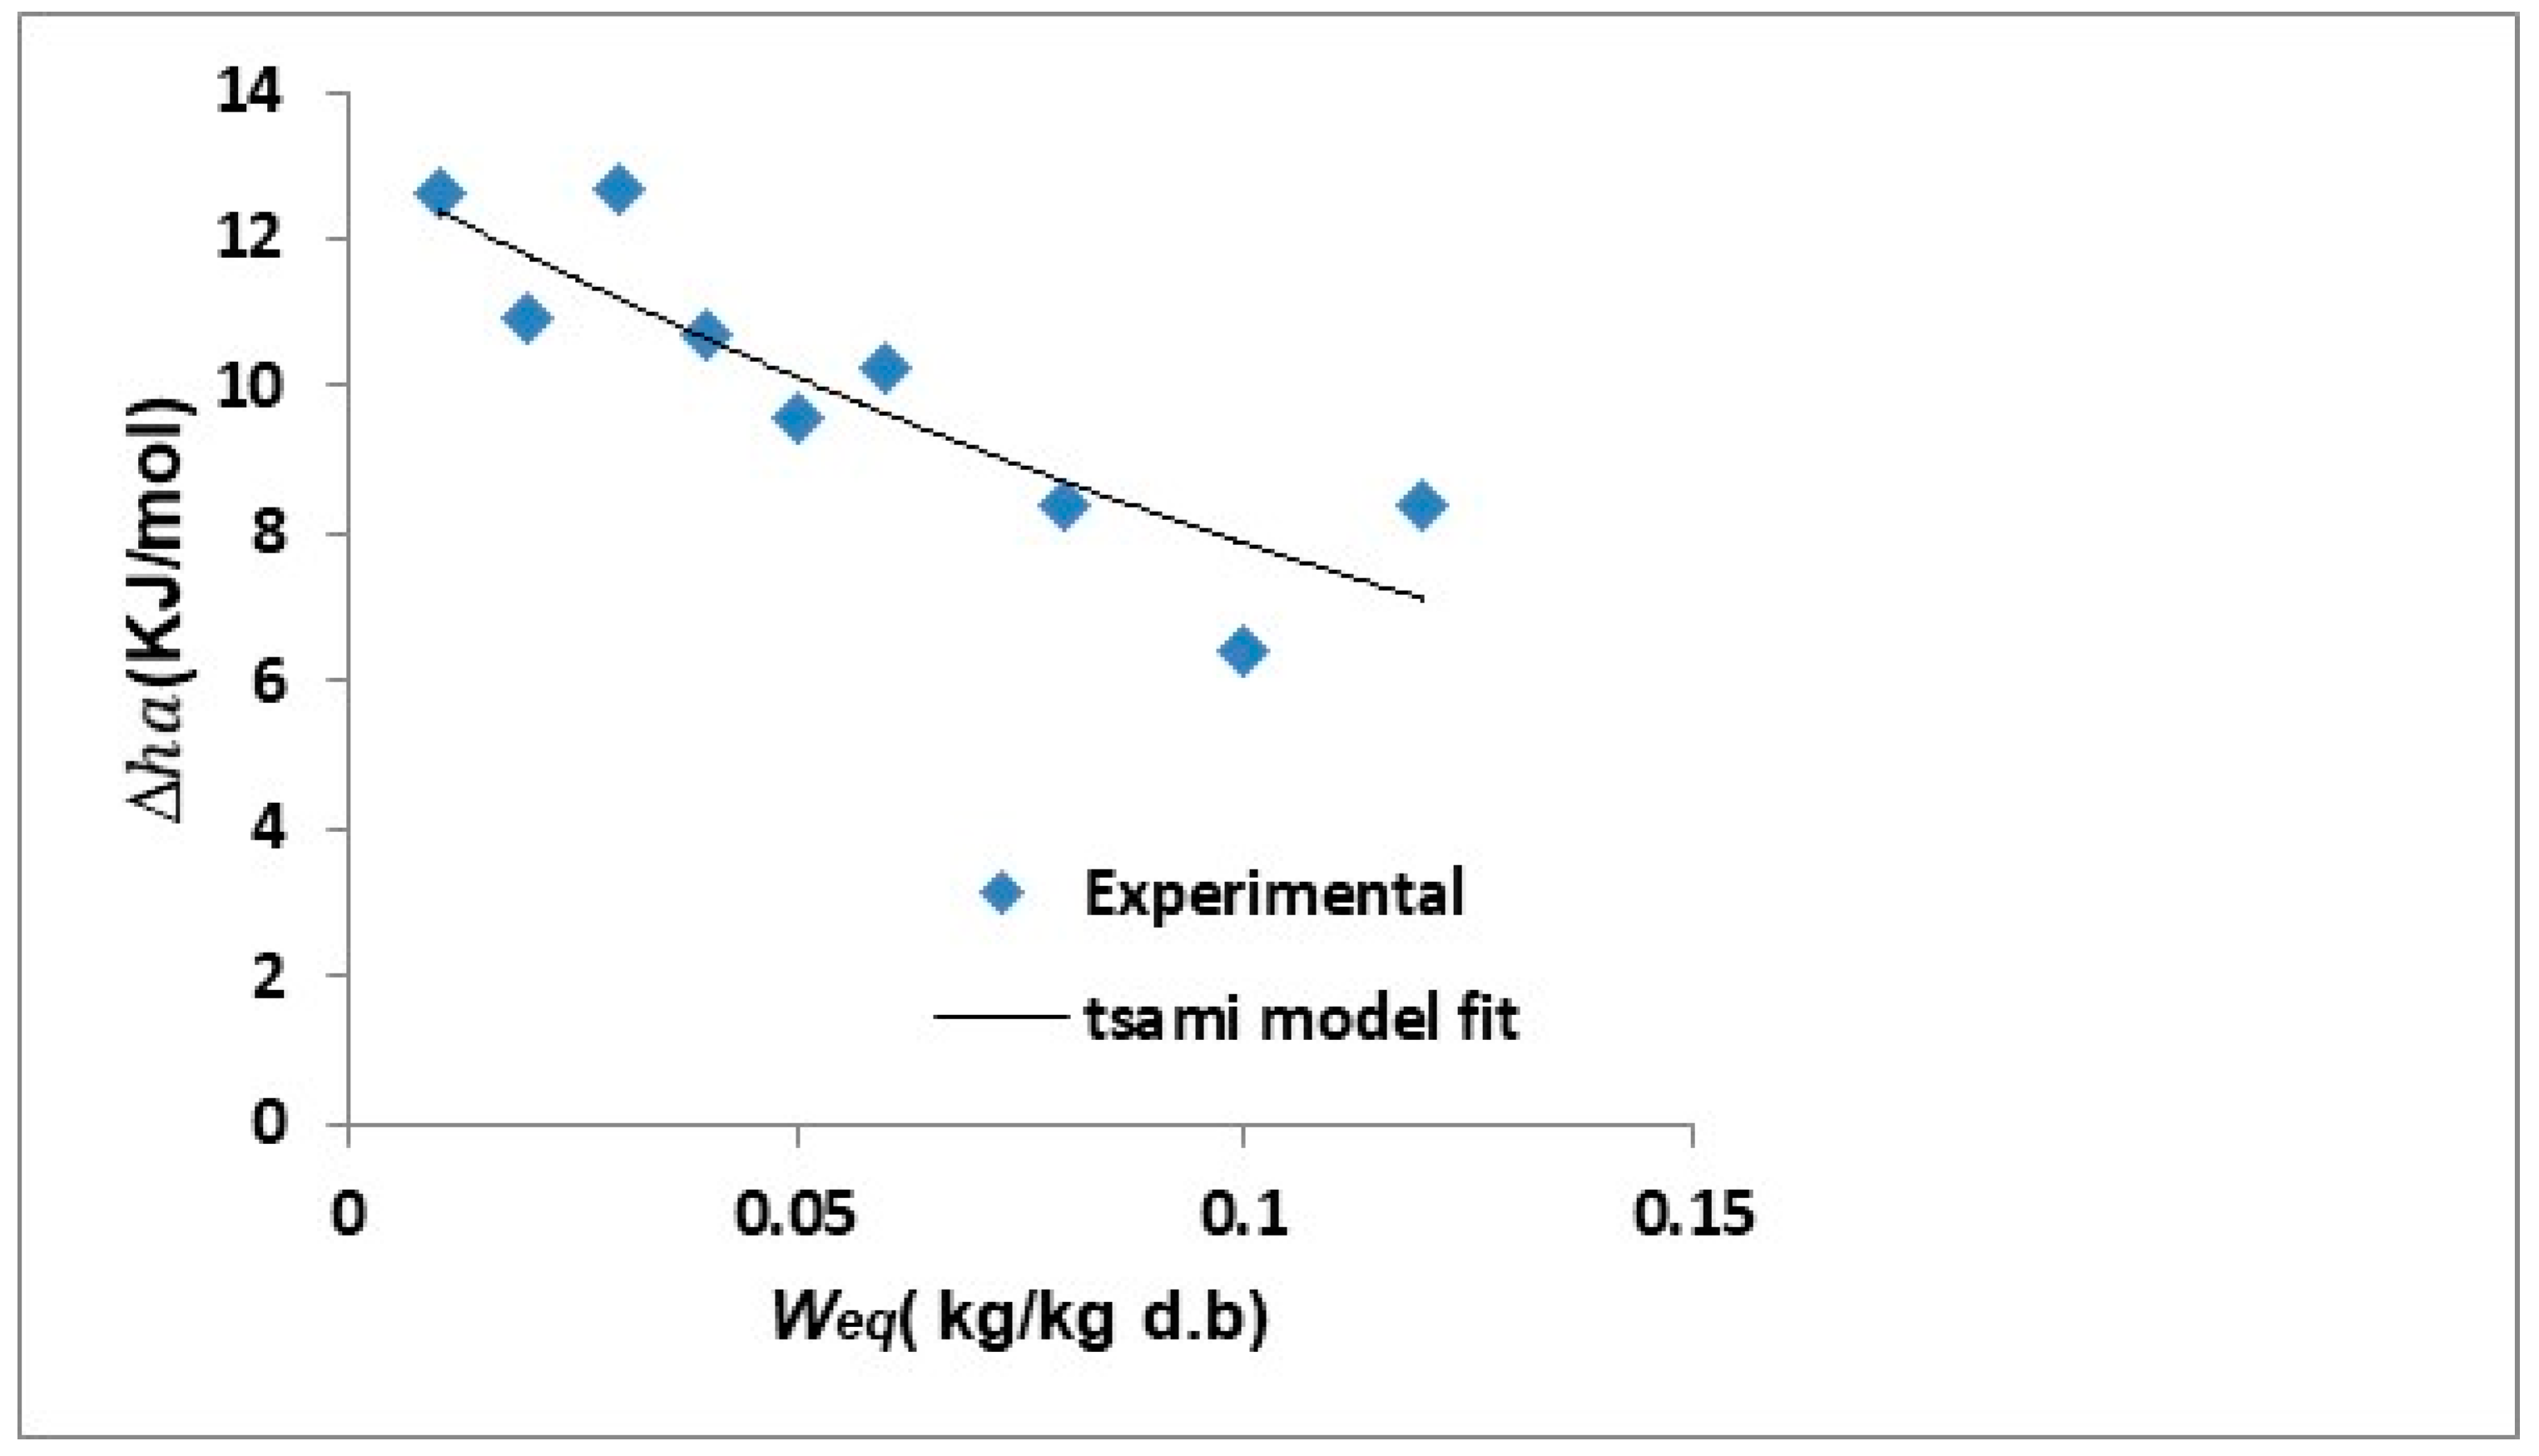
3.4.2. The Determination of the Net Isosteric Heat of Sorption

For a given equilibrium moisture content, the corresponding net isosteric heat of desorption can be obtained from Equation (9), which was obtained from the slope of −Ln (aw) vs. (1/T).
The slope of these linear curves determines, for specific values of the material moisture content, the corresponding isosteric heat of desorption.
This approach assumes that ΔHa is independent of temperature. Hence, the desorption isosters at different moisture levels were obtained as given in Figure 11.
The net isosteric heat of desorption for each equilibrium moisture content is shown in Figure 12.
We observed a progressive increase in the net isosteric heat with the decreasing equilibrium moisture content. At a higher equilibrium moisture content, the heat of desorption is reported to be approximately equal to the heat of water vaporization. Similar results were reported for rice [100], potatoes, [29], prickly pear seeds [30], quinoa grain [101], olive leaves [102], and Jack pine and palm wood [103].
The net isosteric heat of the desorption of corn kernels as a function of the equilibrium moisture content was fitted with a Tsami equation [104].
Δ h a = h 0 ( W e q W 0 ) = 13.028   exp ( W e q 0.198 )

3.4.3. Sorption Entropy

For constant moisture content, the differential entropy ( Δ S ) desorption of water can be determined by applying the following equation [105]:
ln ( a w ) = Δ h a R T = Δ S R
Figure 13 shows the obtained results of the isosteric heat of desorption; the differential entropy increases sharply with the decreasing equilibrium moisture content.
It ranged from 18.486 to 27.830 J/mol·K with the moisture content varying from 0.12 to 0.01 (kg water/kg dry matter).
Sorption entropy is proportional to the number of available sites covered with water molecules sites at a specific energy level [106]. At a higher moisture content, fewer sites are available, which means that there is less mobility for the water molecules as these sites become more accessible, and this is clearly explained by the low values of sorption entropy [107]. Similar results were reported by Goneli et al. [108] for the desorption entropy of pearl millet grains, by Al-Muhtaseb et al. [109] for starch powder sand and by Vishwakarma et al. [110] for guar grain and guar gum splits.
So, the variation in the desorption differential entropy ( Δ S ) in the function of the moisture content for corn grain was best fit via the following exponential function:
Δ S = 28.749   exp ( W e q 0.198 )

3.4.4. The Isokinetic Theory

The theory of enthalpy–entropy compensation (or the isokinetic theory) is a significant tool needed especially for the estimation of different mechanisms which predominate the desorption process [30].
In most biological products, among its characteristics, the linear relationship between enthalpy and entropy for a given value of the specified water desorption can be presented by Equation (13):
Δ h a = T β   Δ S + Δ G β
where T β is the isokinetic temperature [77], as it represents the temperature at which the rates of all reactions of a series of related reactions are equal [111] and Δ G β is the free energy at the specific temperature ( T β ).
Plotting the experimental net desorption isosteric heat versus the experimental differential desorption entropy for the corn grain gives a straight line as shown in Figure 14.
The intrinsic parameters of the enthalpy–entropy relationship for corn kernels are as follows (Figure 14):
Δ h a = 0.4531   Δ S + 8 × 10 14
Those terms were obtained by a linear regression from the experimental data from Equation (13) [80,112].
Equation (14) is used to check the compensation theory and compare the two temperatures mentioned above ( T β and Th) (Equation (15)).
T h = n i = 1 n 1 T
where n is the total number of isotherm experimental curves.
When the product reaches the hygroscopic equilibrium, if ( T β > Th) the process is enthalpy-driven and if ( T β < Th), the process is entropy-controlled. In our case, the isokinetic temperature value ( T β ) is 453.1 K. The harmonic temperature (Th) for corn grain was found to be Th = 332.7997 K (can be determined by applying Equation (15)). It was found then that Th < T β , and this finding confirms the isokinetic theory.
According to our results, the desorption process of corn kernels is thus an enthalpy-driven mechanism. This means that the microstructure of corn is stable and does not undergo any changes during water desorption over the range of temperature 50–70 °C. Similar findings have been reported in the literature for enthalpy–entropy compensation by many researchers, such as Gabas et al. [113] for plum skin and pulp, Beristain et al. [107] for potatoes, macadamia nuts, apricots, figs, currants, prunes and raisins, and Telis et al. [110] for persimmon skin and pulp.

4. Conclusions

In this work, the removal behaviour of the material studied was determined by studying the evolution of its density and specific volume, which is a characteristic property of the tested material. The effect of drying parameters, such as air temperature, relative humidity and air velocity, on the progress of the drying process of a thin layer of corn was then studied, because the main factors that affect the quality of grains during storage are the temperature and the moisture content, which are related to product respiration and the presence of microorganisms. However, the higher temperature and water content of the stored grain mass led to a higher biological activity of the grain and consequently to faster deterioration. As an example of the real-world implications of this, smallholder farmers who are aware of the climate change phenomena and their maize postharvest management are affected by irregular rainfall and fluctuations in temperature attributed to the changing climatic conditions [113,114]. The use of silos after the drying process reduces postharvest losses. Further studies could also investigate how climate change affects maize postharvest storage facilities and management practices as well as the nutrient quality of stored maize grain, quantifying the physical losses. Therefore, it is necessary to control these parameters to reduce the chemical and physical damage to the grains during the simultaneous heat and mass transfer before studying the storage, which is the prospect of this work.
The first part of the experimental study was focused on the study of the temperature and the moisture content distribution during the drying of thin layers and a packed bed of corn under different drying conditions. A comparison of the drying kinetics of the thin layer and granular bed was conducted. It was observed that to achieve a moisture content equal to 0.2 kg/kg (d.b), there was a reduction in the drying time from 400 min in the case of the drying of the packed bed to 150 min using a thin layer; this time reduction consequently translated into an energy gain. From this perspective, the obtained experimental results are used to validate the developed mathematical model [5].
The thermodynamic properties of corn kernels are indispensable, particularly regarding corn drying and storage to guarantee product quality before their use in industrial transformation. In fact, the desorption isotherms of corn kernels were studied in the second step of this work and were obtained by using a static gravimetric method within the temperature range of 50–70 °C and for a range of water activity between 0.1 and 0.9. The GAB model was used to fit the experimental data and it was found that it is the best one to describe the isotherms curves of the kernel. Based on the experimental isotherms’ data, the net isosteric heat in the function of equilibrium moisture content was established. It was also verified that the desorption process of corn grain is an enthalpy-driven mechanism because the isokinetic temperature is greater than the harmonic mean temperature.

Author Contributions

Methodology, A.K.; Software, A.K.; validation, A.K.; writing—original draft preparation, A.K.; writing—review and editing, J.M. and I.S.; supervision, J.S., funding, I.S. All authors have read and agreed to the published version of the manuscript.

Funding

This research was funded by the Deanship of Scientific Research at King Khalid University under the grant number RGP.1/25/43.

Data Availability Statement

No new data were created or analyzed in this study. Data sharing is not applicable to this article.

Acknowledgments

The authors extend their appreciation to the Deanship of Scientific Research at King Khalid University for funding this work through a group project under grant number RGP.1/25/43. Furthermore, the authors would like to express their sincere appreciation to the Physics Department, Faculty of Sciences of Tunis, Tunisia, for its valuable assistance in the drying kinetics experiments, and to the Chemistry Department, Faculty of Sciences of Monastir, Tunisia, for its valuable assistance in the desorption isotherm experiments.

Conflicts of Interest

The authors declare no conflict of interest.

Nomenclature

A, B, C, c, D, k, XmModels’ parameters-
awWater activity-
d.bDry base-
dfNumber of degrees of freedom
GHydrostatic thrustkg
HHeight of the bed of cornM
h0Net isosteric heat of sorption KJ/mol
MeqEquilibrium masskg
MfMass of the sample immersed in the fluidkg
MH2OMass of waterkg
mlSolid masskg
ml0Initial liquid masskg
msSolid masskg
NNumber of experimental points-
PPressurePa
RIdeal gas constantKJ/mol·K
RHRelative humidity of the air%
R2Correlation coefficient-
TTemperatureK
TβIsokinetic temperatureK
ThHarmonic mean temperatureK
VVolumem3
VFluid velocitym/s
V ¯ Partial specific volume m3
Vl0Initial volume of liquidm3
VsSolid volumem3
WMoisture contentkg/kg (d.b)
W0Initial moisture contentkg/kg (d.b)
WtMoisture content at time tkg/kg (d.b)
Wi,calCalculated equilibrium moisture contentkg/kg (d.b)
Wi,eqExperimental equilibrium moisture contentkg/kg (d.b)
Greek symbols:
Ρ Solid densitykg/m3
ρ aAir densitykg/m3
ρ fSolid densitykg/m3
ρ 0 Average initial densitykg/m3
ρ l l Average liquid densitykg/m3
ρ 0 Average initial densitykg/m3
ρ s s Average solid densitykg/m3
ϕ 0 Initial porosity-
Δ S Differential entropyJ/mol·K
χ Standard error-
Δ G β Free energyJ/mol
Δ H a Total heat of sorptionKJ/mol
Δ h a Net isosteric heat of sorptionKJ/mol
Δ H v a p Enthalpy of vaporizationKJ/mol
Δ S Differential entropyJ/mol·K

Appendix A

χ = i = 1 n ( W i , exp W i , c a l ) 2 d f
R = i = 1 n ( W i , exp W i , c a l ) 2 i = 1 n ( W i , exp W exp ) 2
where ; W exp = 1 n i = 1 n W i , exp
W i , exp is the experimental values of the equilibrium moisture content.
W i , c a l is the calculated values of the equilibrium moisture content.
n is the number of experimental points.
d f is the number of degrees of freedom.

References

  1. Torero Cullen, M.M. L’avenir de L’alimentation et de L’agriculture—Facteurs et Déclencheurs de Transformation; FAOSTAT: Rome, Italy, 2022. [Google Scholar]
  2. Lelaalhe, M.; Tidjani, O. Céréales d’été dans le Sahara Algérien; Situation Actuelle et Perspectives. Ph.D. Thesis, Universite Kasdi Merbah–Ouargla, Ouargla, Algeria, 2021. [Google Scholar]
  3. Abass, A.B.; Ndunguru, G.; Mamiro, P.; Alenkhe, B.; Mlingi, N.; Bekunda, M. Post-harvest food losses in a maize-based farming system of semi-arid savannah area of Tanzania. J. Stored Prod. Res. 2014, 57, 49–57. [Google Scholar] [CrossRef] [Green Version]
  4. Kumar, D.; Kalita, P. Reducing Postharvest Losses during Storage of Grain Crops to Strengthen Food Security in Developing Countries. Foods 2017, 6, 8. [Google Scholar] [CrossRef] [PubMed] [Green Version]
  5. Kraiem, A.; Madiouli, J.; Sghaier, J.; Shigidi, I. Significance of Bed Shrinkage on Heat and Mass Transfer during the Transport Phenomenon of Humid Air. Arab. J. Sci. Eng. 2021, 46, 6085–6099. [Google Scholar] [CrossRef]
  6. Motahayyer, M.; Arabhosseini, A.; Samimi-Akhijahani, H. Numerical analysis of thermal performance of a solar dryer and validated with experimental and thermo-graphical data. Sol. Energy 2019, 193, 692–705. [Google Scholar] [CrossRef]
  7. Tuncer, A.D.; Khanlari, A.; Sözen, A.; Gürbüz, E.Y.; Şirin, C.; Gungor, A. Energy-exergy and enviro-economic survey of solar air heaters with various air channel modifications. Renew. Energy 2020, 160, 67–85. [Google Scholar] [CrossRef]
  8. Çelik, E.; Parlak, N.; Çay, Y. Experimental and numerical study on drying behavior of CORN grain. Heat Mass Transf. 2021, 57, 321–332. [Google Scholar] [CrossRef]
  9. Bryś, A.; Kaleta, A.; Górnicki, K.; Głowacki, S.; Tulej, W.; Bryś, J.; Wichowski, P. Some Aspects of the Modelling of Thin-Layer Drying of Sawdust. Energies 2021, 14, 726. [Google Scholar] [CrossRef]
  10. Guclu, G.; Keser, D.; Kelebek, H.; Keskin, M.; Sekerli, Y.E.; Soysal, Y.; Selli, S. Impact of production and drying methods on the volatile and phenolic characteristics of fresh and powdered sweet red peppers. Food Chem. 2021, 338, 128129. [Google Scholar] [CrossRef]
  11. Turan, A.; Karaosmanoğlu, H. Effect of drying methods on long term storage of hazelnut. Food Sci. Technol. 2019, 39, 406–412. [Google Scholar] [CrossRef] [Green Version]
  12. Van Pham, K.; Duc, L.A.; Hay, N. Mathematical Model of Thin Layer Drying of Ganoderma Lucidum by Radio Frequency Assisted Heat Pump Drying. Front. Heat Mass Transf. 2022, 18, 44. [Google Scholar] [CrossRef]
  13. Qiu, L.; Zhang, M.; Tang, J.; Adhikari, B.; Cao, P. Innovative technologies for producing and preserving intermediate moisture foods: A review. Food Res. Int. 2019, 116, 90–102. [Google Scholar] [CrossRef] [PubMed]
  14. Palabinskis, J.; Aboltins, A. Comparison of wheat drying process dynamics at different ventilation speeds. Eng. Rural Dev. 2021, 20, 520–527. [Google Scholar] [CrossRef]
  15. Ramaj, I.; Schock, S.; Müller, J. Drying Kinetics of Wheat (Triticum aestivum L., cv. ‘Pionier’) during Thin-Layer Drying at Low Temperatures. Appl. Sci. 2021, 11, 9557. [Google Scholar] [CrossRef]
  16. Maisnam, D.; Rasane, P.; Dey, A.; Kaur, S.; Sarma, C. Recent advances in conventional drying of foods: A review Recent advances in conventional drying of foods. J. Food Technol. Pres. 2017, 1, 25–34. [Google Scholar]
  17. Iuga, M.; Mironeasa, S. A review of the hydrothermal treatments impact on starch based systems properties. Crit. Rev. Food Sci. Nutr. 2019, 60, 3890–3915. [Google Scholar] [CrossRef] [PubMed]
  18. Sun, L.-X.; Liu, S.-X.; Wang, J.-X.; Wu, C.-L.; Li, Y.; Zhang, C.-Q. The effects of grain texture and phenotypic traits on the thin-layer drying rate in maize (Zea mays L.) inbred lines. J. Integr. Agric. 2016, 15, 317–325. [Google Scholar] [CrossRef]
  19. Jiang, M.; Wu, P.; Liu, H.; Li, L.; Jia, C.; Chen, S.; Zhang, S.; Wang, L. Interaction of swing temperature and alternating airflow with vibration on drying uniformity in deep-bed wheat drying. Dry. Technol. 2020, 38, 1749–1759. [Google Scholar] [CrossRef]
  20. Abasi, S.; Minaei, S. Effect of Drying Temperature on Mechanical Properties of Dried Corn. Dry. Technol. 2014, 32, 774–780. [Google Scholar] [CrossRef]
  21. Tohidi, M.; Sadeghi, M.; Torki-Harchegani, M. Energy and quality aspects for fixed deep bed drying of paddy. Renew. Sustain. Energy Rev. 2017, 70, 519–528. [Google Scholar] [CrossRef]
  22. Liu, Z.; Wu, Z.; Wang, X.; Song, J.; Wu, W. Numerical Simulation and Experimental Study of Deep Bed Corn Drying Based on Water Potential. Math. Probl. Eng. 2015, 2015, 539846. [Google Scholar] [CrossRef] [Green Version]
  23. Veras, O.; Béttega, R.; Freire, F.B.; Barrozo, M.; Freire, J.T. Drying kinetics, structural characteristics and vitamin C retention of dedo-de-moça pepper (Capsicum baccatum) during convective and freeze drying. Braz. J. Chem. Eng. 2012, 29, 741–750. [Google Scholar] [CrossRef]
  24. Moussaoui, H.; Bahammou, Y.; Idlimam, A.; Lamharrar, A.; Abdenouri, N. Investigation of hygroscopic equilibrium and modeling sorption isotherms of the argan products: A comparative study of leaves, pulps, and fruits. Food Bioprod. Process. 2019, 114, 12–22. [Google Scholar] [CrossRef]
  25. Mahato, D.; Devi, S.; Pandhi, S.; Sharma, B.; Maurya, K.; Mishra, S.; Dhawan, K.; Selvakumar, R.; Kamle, M.; Mishra, A.; et al. Occurrence, Impact on Agriculture, Human Health, and Management Strategies of Zearalenone in Food and Feed: A Review. Toxins 2021, 13, 92. [Google Scholar] [CrossRef] [PubMed]
  26. Webb, D.J. Fibre Bragg grating sensors in polymer optical fibres. Meas. Sci. Technol. 2015, 26, 092004. [Google Scholar] [CrossRef]
  27. Bala, B.; Woods, J. Physical and Thermal Properties of Malt. Dry. Technol. 1991, 9, 1091–1104. [Google Scholar] [CrossRef]
  28. Park, S.Y.; Oh, Y.J.; Lho, Y.; Jeong, J.H.; Liu, K.-H.; Song, J.; Kim, S.-H.; Ha, E.; Seo, Y.H. Design, synthesis, and biological evaluation of a series of resorcinol-based N-benzyl benzamide derivatives as potent Hsp90 inhibitors. Eur. J. Med. Chem. 2018, 143, 390–401. [Google Scholar] [CrossRef]
  29. Singh, P.; Talukdar, P. Determination of Desorption Isotherms of Potato Using Gravimetric Method and Fast Isotherm Method. Heat Transf. Eng. 2020, 41, 513–521. [Google Scholar] [CrossRef]
  30. Hassini, L.; Bettaieb, E.; Desmorieux, H.; Torres, S.S.; Touil, A. Desorption isotherms and thermodynamic properties of prickly pear seeds. Ind. Crop. Prod. 2015, 67, 457–465. [Google Scholar] [CrossRef]
  31. Ben Abdelhamid, M.; Mihoubi, D.; Sghaier, J.; Bellagi, A. Water Sorption Isotherms and Thermodynamic Characteristics of Hardened Cement Paste and Mortar. Transp. Porous Media 2016, 113, 283–301. [Google Scholar] [CrossRef]
  32. Manzocco, L.; Plazzotta, S.; Powell, J.; de Vries, A.; Rousseau, D.; Calligaris, S. Structural characterisation and sorption capability of whey protein aerogels obtained by freeze-drying or supercritical drying. Food Hydrocoll. 2021, 122, 107117. [Google Scholar] [CrossRef]
  33. Lestari, R.; Pradani, T.; Digdowiseiso, K. The Effects of Price Perceptions, Food Quality, and Menu Variations on Ordering Decisions and Their Impact on Customer Loyalty in Online Culinary Products. Bp. Int. Res. Crit. Inst.-J. 2022, 5, 1518–1527. [Google Scholar]
  34. Norström, M.; Kristoffersen, A.B.; Görlach, F.S.; Nygard, K.; Hopp, P. An Adjusted Likelihood Ratio Approach Analysing Distribution of Food Products to Assist the Investigation of Foodborne Outbreaks. PLoS ONE 2015, 10, e0134344. [Google Scholar] [CrossRef]
  35. Sormoli, M.E.; Langrish, T.A. Moisture sorption isotherms and net isosteric heat of sorption for spray-dried pure orange juice powder. LWT Food Sci. Technol. 2015, 62, 875–882. [Google Scholar] [CrossRef]
  36. Labuza, T.P.; Altunakar, B. Water activity prediction and moisture sorption isotherms. Water Act. Foods Fundam. Appl. 2020, 2, 161–205. [Google Scholar]
  37. Onwude, D.I.; Hashim, N.; Janius, R.B.; Nawi, N.M.; Abdan, K. Modeling the Thin-Layer Drying of Fruits and Vegetables: A Review. Compr. Rev. Food Sci. Food Saf. 2016, 15, 599–618. [Google Scholar] [CrossRef] [PubMed] [Green Version]
  38. Nienke, T.; Kwade, A.; Eggerath, D. Influence of Moisture, Temperature and Bleaching on the Mechanical Properties of Coated Fiber-Based Substrates. Coatings 2022, 12, 1287. [Google Scholar] [CrossRef]
  39. Marques, R.C.D.; de Oliveira, R.; Coutinho, G.S.M.; Ribeiro, A.E.C.; Teixeira, C.S.; Júnior, M.S.S.; Caliari, M. Modeling sorption properties of maize by-products obtained using the Dynamic Dewpoint Isotherm (DDI) method. Food Biosci. 2020, 38, 100738. [Google Scholar] [CrossRef]
  40. César, L.-V.E.; Lilia, C.-M.A.; Octavio, G.-V.; Isaac, P.F.; Rogelio, B.O. Thermal performance of a passive, mixed-type solar dryer for tomato slices (Solanum lycopersicum). Renew. Energy 2020, 147, 845–855. [Google Scholar] [CrossRef]
  41. Peleg, M. Models of Sigmoid Equilibrium Moisture Sorption Isotherms With and Without the Monolayer Hypothesis. Food Eng. Rev. 2020, 12, 1–13. [Google Scholar] [CrossRef]
  42. Susilo, B.; Maharani, D.M.; Hawa, L.C.; Fitri, D.N.K. Study of sorption isotherm and isosteric heat of Kepok Banana (Musa paradisiaca F.) slice. IOP Conf. Ser. Earth Environ. Sci. 2019, 230, 012017. [Google Scholar] [CrossRef]
  43. Amadou, I.; Diadie, H.O.; Gbadamosi, O.S.; Akanbi, C.T. Characterization and sorption isotherm of dehydrated beef made in Nigeria. Cogent Food Agric. 2019, 5, 1710440. [Google Scholar] [CrossRef]
  44. Engin, D. Effect of drying temperature on color and desorption characteristics of oyster mushroom. Food Sci. Technol. 2020, 40, 187–193. [Google Scholar] [CrossRef] [Green Version]
  45. Staniszewska, I.; Dzadz, L.; Nowak, K.W.; Zielinska, M. Evaluation of storage stability of dried powdered coriander, parsley and celery leaves based on the moisture sorption isotherms and glass transition temperature. LWT 2021, 146, 111440. [Google Scholar] [CrossRef]
  46. Martinez-Monteagudo, S.I.; Salais-Fierro, F. Moisture sorption isotherms and thermodynamic properties of Mexican Mennonite-style cheese. J. Food Sci. Technol. 2014, 51, 2393–2403. [Google Scholar] [CrossRef] [PubMed] [Green Version]
  47. Cagabhion, A.; Emnace, I. Moisture Sorption Characteristics and Isosteric Heat of Sorption of Vacuum Fried Chicken (Gallus gallus domesticus L.) “Isaw”. Philipp. J. Sci. 2020, 150, 43–52. [Google Scholar] [CrossRef]
  48. Baptestini, F.M.; Corrêa, P.C.; Ramos, A.M.; Junqueira, M.D.S.; Zaidan, I.R. GAB model and the thermodynamic properties of moisture sorption in soursop fruit powder. Rev. Cienc. Agron. 2020, 51, 1–9. [Google Scholar] [CrossRef]
  49. Yan, H.; Yu, Z.; Liu, L. Lactose crystallization and Maillard reaction in simulated milk powder based on the change in water activity. J. Food Sci. 2022, 87, 4956–4966. [Google Scholar] [CrossRef] [PubMed]
  50. Barretto, T.L.; Polachini, T.; Barretto, A.C.D.S.; Telis-Romero, J. Water sorption isotherms of cooked hams as affected by temperature and chemical composition. Food Sci. Technol. 2019, 39, 677–683. [Google Scholar] [CrossRef] [Green Version]
  51. Chauhan, O.P. (Ed.) Advances in Food Chemistry: Food Components, Processing and Preservation; Springer: Singapore, 2022. [Google Scholar]
  52. Hurley, B.R.A.; Ouzts, A.; Fischer, J.; Gomes, T. Effects of Private and Public Label Packaging on Consumer Purchase Patterns. Packag. Technol. Sci. 2013, 29, 399–412. [Google Scholar] [CrossRef]
  53. Nguyen, G.T.; Sopade, P.A. Modeling Starch Digestograms: Computational Characteristics of Kinetic Models for in vitro Starch Digestion in Food Research. Compr. Rev. Food Sci. Food Saf. 2018, 17, 1422–1445. [Google Scholar] [CrossRef] [PubMed] [Green Version]
  54. Majd, K.M.; Karparvarfard, S.H.; Farahnaky, A.; Jafarpour, K. Thermodynamic of Water Sorption of Grape Seed: Temperature Effect of Sorption Isotherms and Thermodynamic Characteristics. Food Biophys. 2013, 8, 1–11. [Google Scholar] [CrossRef]
  55. Aguirre-Loredo, R.Y.; Rodriguez-Hernandez, A.I.; Velazquez, G. Modelling the effect of temperature on the water sorption isotherms of chitosan films. Food Sci. Technol. 2017, 37, 112–118. [Google Scholar] [CrossRef] [Green Version]
  56. Nassar, M.Y.; Abdelrahman, E.A.; Aly, A.A.; Mohamed, T.Y. A facile synthesis of mordenite zeolite nanostructures for efficient bleaching of crude soybean oil and removal of methylene blue dye from aqueous media. J. Mol. Liq. 2017, 248, 302–313. [Google Scholar] [CrossRef]
  57. Bejar, A.K.; Mihoubi, N.B.; Kechaou, N. Moisture sorption isotherms—Experimental and mathematical investigations of orange (Citrus sinensis) peel and leaves. Food Chem. 2012, 132, 1728–1735. [Google Scholar] [CrossRef]
  58. Maestri, D.; Cittadini, M.C.; Bodoira, R.; Martínez, M. Tree Nut Oils: Chemical Profiles, Extraction, Stability, and Quality Concerns. Eur. J. Lipid Sci. Technol. 2020, 122, 1900450. [Google Scholar] [CrossRef]
  59. Koua, B.K.; Koffi, P.M.E.; Gbaha, P.; Toure, S. Thermodynamic analysis of sorption isotherms of cassava (Manihot esculenta). J. Food Sci. Technol. 2014, 51, 1711–1723. [Google Scholar] [CrossRef] [PubMed] [Green Version]
  60. Nascimento, A.; Cavalcanti-Mata, M.E.R.M.; Duarte, M.E.M.; Pasquali, M.; Lisboa, H.M. Construction of a design space for goat milk powder production using moisture sorption isotherms. J. Food Process Eng. 2019, 42, e13228. [Google Scholar] [CrossRef]
  61. Tolera, K.D.; Abera, S. Nutritional quality of Oyster Mushroom (Pleurotus Ostreatus) as affected by osmotic pretreatments and drying methods. Food Sci. Nutr. 2017, 5, 989–996. [Google Scholar] [CrossRef] [PubMed]
  62. Sasongko, S.B.; Hadiyanto, H.; Djaeni, M.; Perdanianti, A.M.; Utari, F.D. Effects of drying temperature and relative humidity on the quality of dried onion slice. Heliyon 2020, 6, e04338. [Google Scholar] [CrossRef]
  63. Udomkun, P.; Argyropoulos, D.; Nagle, M.; Mahayothee, B.; Müller, J. Sorption behaviour of papayas as affected by compositional and structural alterations from osmotic pretreatment and drying. J. Food Eng. 2015, 157, 14–23. [Google Scholar] [CrossRef]
  64. Koc, B.; Isleroglu, H.; Turker, I. Sorption behavior and storage stability of microencapsulated transglutaminase by ultrasonic spray–freeze–drying. Dry. Technol. 2020, 40, 337–351. [Google Scholar] [CrossRef]
  65. Zeymer, J.S.; Corrêa, P.C.; Oliveira, G.H.H.; Baptestini, F.M.; Campos, R.C. Mathematical modeling and hysteresis of sorption isotherms for paddy rice grains. Eng. Agric. 2019, 39, 524–532. [Google Scholar] [CrossRef] [Green Version]
  66. Gichau, A.W.; Okoth, J.K.; Makokha, A. Moisture sorption isotherm and shelf life prediction of complementary food based on amaranth–sorghum grains. J. Food Sci. Technol. 2019, 57, 962–970. [Google Scholar] [CrossRef]
  67. Groundnut, B.; Flour, N.; Adeoye, B.K.; Oladejo, C.J.; Adeniran, A.D.; Opawuyi, H.T. Sorption Isotherm of Corn Chips Made from Blends of Corn Flour and Bambara Groundnut Nut Flour. Am. J. Chem. Eng. 2021, 8, 70. [Google Scholar] [CrossRef]
  68. Panyathitipong, W.; Tempiam, S.; Suttha, W.; Chomshome, N.; Masavang, S. Effect of Storage Conditions on Qualities and Water Sorption Isotherm of Khanom La. Trends Sci. 2022, 19, 3466. [Google Scholar] [CrossRef]
  69. Adebowale, A.A.; Akinniyi, G.; Shittu, T.A.; Adegoke, A.F.; Omohimi, C.I.; Sobukola, O.P.; Onabanjo, O.O.; Adegunwa, M.O.; Kajihausa, O.E.; Dairo, O.U.; et al. Adsorption Isotherms and Thermodynamic Properties of Dried Tomato Slices. Adv. Nutr. Food Sci. 2022, 7, 249–262. [Google Scholar]
  70. Soodmand-Moghaddam, S.; Sharifi, M.; Zareiforoush, H.; Mobli, H. Mathematical modelling of lemon verbena leaves drying in a continuous flow dryer equipped with a solar pre-heating system. Qual. Assur. Saf. Crop. Foods 2020, 12, 57–66. [Google Scholar] [CrossRef]
  71. Jalil, E.; Molaeimanesh, G.R. Effects of turbulator shape, inclined magnetic field, and mixed convection nanofluid flow on thermal performance of micro-scale inclined forward-facing step. J. Cent. South Univ. 2021, 28, 3310–3326. [Google Scholar] [CrossRef]
  72. Muruganantham, P.; Kamalakannan, K.; Sathyamurthy, R.; Sundaram, K.M. Performance analysis of a tubular solar dryer for drying Mexican mint (Plectranthus amboinicus)—An experimental approach. Energy Rep. 2021, 7, 7–12. [Google Scholar] [CrossRef]
  73. Sheikholeslami, M.; Ganji, D. Heat transfer improvement in a double pipe heat exchanger by means of perforated turbulators. Energy Convers. Manag. 2016, 127, 112–123. [Google Scholar] [CrossRef]
  74. Lucia, U.; Simonetti, M.; Chiesa, G.; Grisolia, G. Ground-source pump system for heating and cooling: Review and thermodynamic approach. Renew. Sustain. Energy Rev. 2017, 70, 867–874. [Google Scholar] [CrossRef]
  75. Mejouyo, P.W.H.; Tiaya, E.M.; Tagne, N.R.S.; Tiwa, S.T.; Njeugna, E. Experimental study of water-sorption and desorption of several varieties of oil palm mesocarp fibers. Results Mater. 2022, 14, 100284. [Google Scholar] [CrossRef]
  76. Falade, K.O.; Ayetigbo, O.E. Influence of physical and chemical modifications on granule size frequency distribution, fourier transform infrared (FTIR) spectra and adsorption isotherms of starch from four yam (Dioscorea spp.) cultivars. J. Food Sci. Technol. 2022, 59, 1865–1877. [Google Scholar] [CrossRef]
  77. Montes, D.; Orozco, W.; Taborda, E.A.; Franco, C.A.; Cortés, F.B. Development of Nanofluids for Perdurability in Viscosity Reduction of Extra-Heavy Oils. Energies 2019, 12, 1068. [Google Scholar] [CrossRef]
  78. Martynenko, A. True, Particle, and Bulk Density of Shrinkable Biomaterials: Evaluation from Drying Experiments. Dry. Technol. 2014, 32, 1319–1325. [Google Scholar] [CrossRef]
  79. Silva, V.; Figueiredo, A.; Costa, J.; Guiné, R. Experimental and mathematical study of the discontinuous drying kinetics of pears. J. Food Eng. 2014, 134, 30–36. [Google Scholar] [CrossRef]
  80. Özahi, E.; Demir, H. Drying performance analysis of a batch type fluidized bed drying process for corn and unshelled pistachio nut regarding to energetic and exergetic efficiencies. Measurement 2015, 60, 85–96. [Google Scholar] [CrossRef]
  81. Asemu, A.M.; Habtu, N.G.; Delele, M.A.; Subramanyam, B.; Alavi, S. Drying characteristics of maize grain in solar bubble dryer. J. Food Process Eng. 2020, 43, e13312. [Google Scholar] [CrossRef]
  82. Ertekin, C.; Firat, M.Z. A comprehensive review of thin-layer drying models used in agricultural products. Crit. Rev. Food Sci. Nutr. 2017, 57, 701–717. [Google Scholar] [CrossRef]
  83. Katsoufi, S.; Lazou, A.E.; Giannakourou, M.C.; Krokida, M.K. Air drying kinetics and quality characteristics of osmodehydrated-candied pumpkins using alternative sweeteners. Dry. Technol. 2020, 39, 2194–2205. [Google Scholar] [CrossRef]
  84. Lamidi, R.O.; Jiang, L.; Pathare, P.B.; Wang, Y.; Roskilly, A. Recent advances in sustainable drying of agricultural produce: A review. Appl. Energy 2019, 233–234, 367–385. [Google Scholar] [CrossRef] [Green Version]
  85. Barati, E.; Esfahani, J. A novel approach to evaluate the temperature during drying of food products with negligible external resistance to mass transfer. J. Food Eng. 2013, 114, 39–46. [Google Scholar] [CrossRef]
  86. Perazzini, M.T.B.; Freire, F.B.; Freire, J.T. Influence of Bed Geometry on the Drying of Skimmed Milk in a Spouted Bed. Adv. Chem. Eng. Sci. 2015, 5, 447–460. [Google Scholar] [CrossRef] [Green Version]
  87. Moradkhani, M.; Hosseini, S.; Olazar, M.; Altzibar, H.; Valizadeh, M. Estimation of the minimum spouting velocity and pressure drop in open-sided draft tube spouted beds using genetic programming. Powder Technol. 2021, 387, 363–372. [Google Scholar] [CrossRef]
  88. Zhou, X.; Zong, X.; Wang, S.; Yin, C.; Gao, X.; Xiong, G.; Xu, X.; Qi, J.; Mei, L. Emulsified blend film based on konjac glucomannan/carrageenan/ camellia oil: Physical, structural, and water barrier properties. Carbohydr. Polym. 2020, 251, 117100. [Google Scholar] [CrossRef]
  89. Sahu, S.N.; Tiwari, A.; Sahu, J.K.; Naik, S.N.; Baitharu, I.; Kariali, E. Moisture sorption isotherms and thermodynamic properties of sorbed water of chironji (Buchanania lanzan Spreng.) kernels at different storage conditions. J. Food Meas. Charact. 2018, 12, 2626–2635. [Google Scholar] [CrossRef]
  90. Goneli, A.; Corrêa, P.; Oliveira, G.; Júnior, P.A. Water sorption properties of coffee fruits, pulped and green coffee. LWT 2013, 50, 386–391. [Google Scholar] [CrossRef]
  91. Zaheer, Z.; Bawazir, W.A.; Al-Bukhari, S.M.; Basaleh, A.S. Adsorption, equilibrium isotherm, and thermodynamic studies to the removal of acid orange 7. Mater. Chem. Phys. 2019, 232, 109–120. [Google Scholar] [CrossRef]
  92. Buitrago-Torres, I.D.; Torres-Osorio, J.; Restrepo-Parra, E. Experimental and modeling methodologies for the analysis of water adsorption in food products. A review. arXiv 2021, arXiv:2106.02999. [Google Scholar]
  93. Pagire, S.G.; Warrier, A.S.; Sawhney, I.K. Moisture sorption characteristics of heat desiccated milk sweet ‘Khoa-peda’ prepared from Buffalo milk. Indian J. Dairy Sci. 2020, 73, 321–329. [Google Scholar] [CrossRef]
  94. Zhang, Z.; Scherer, G.W. Evaluation of drying methods by nitrogen adsorption. Cem. Concr. Res. 2019, 120, 13–26. [Google Scholar] [CrossRef]
  95. Martins, M.R.; Johann, G.; Palú, F.; da Silva, E.A. Drying of guaco leaves: Experimental and modeling kinetic, equilibrium isotherms and heat of desorption. J. Therm. Anal. Calorim. 2022, 147, 7411–7420. [Google Scholar] [CrossRef]
  96. Hossain, M.A.; Gottschalk, K.; Hassan, M.S. Mathematical Model for a Heat Pump Dryer for Aromatic Plant. Procedia Eng. 2013, 56, 510–520. [Google Scholar] [CrossRef] [Green Version]
  97. Hawa, L.C.; Aini, K.N.N.; Maharani, D.M.; Susilo, B. Moisture Sorption Isotherm and Isosteric Heat of Dried Cabya (Piper retrofractum Vahl) Powder. IOP Conf. Ser. Earth Environ. Sci. 2020, 515, 012029. [Google Scholar] [CrossRef]
  98. Mbarek, R.; Mihoubi, D. Thermodynamic properties and water desorption isotherms of Golden Delicious apples. Heat Mass Transf. 2018, 55, 1405–1418. [Google Scholar] [CrossRef]
  99. Mallek-Ayadi, S.; Bahloul, N.; Kechaou, N. Mathematical modelling of water sorption isotherms and thermodynamic properties of Cucumis melo L. seeds. LWT 2020, 131, 109727. [Google Scholar] [CrossRef]
  100. Luthra, K.; Shafiekhani, S.; Sadaka, S.S.; Atungulu, G.G. Determination of moisture sorption isotherms of rice and husk flour composites. Appl. Eng. Agric. 2020, 36, 859–867. [Google Scholar] [CrossRef]
  101. Bustos-Vanegas, J.D.; Corrêa, P.C.; Zeymer, J.S.; Baptestini, F.M.; Campos, R. Moisture sorption isotherms of quinoa seeds: Thermodynamic analysis. Eng. Agrícola 2018, 4430, 941–950. [Google Scholar] [CrossRef] [Green Version]
  102. Jiang, X.; Yu, Y.; Zhu, S.; Li, H. Response Surface Modeling Equilibrium Moisture Content of High Pressure Treated Paulownia Wood. In Proceedings of the 2018 ASABE Annual International Meeting, Detroit, MI, USA, 29 July–1 August 2018; pp. 1–8. [Google Scholar] [CrossRef]
  103. Ouertani, S.; Azzouz, S.; Hassini, L.; Koubaa, A.; Belghith, A. Moisture sorption isotherms and thermodynamic properties of Jack pine and palm wood: Comparative study. Ind. Crop. Prod. 2014, 56, 200–210. [Google Scholar] [CrossRef]
  104. Aksil, T.; Abbas, M.; Trari, M.; Benamara, S. Water adsorption on lyophilized Arbutus unedo L. fruit powder: Determination of thermodynamic parameters. Microchem. J. 2019, 145, 35–41. [Google Scholar] [CrossRef]
  105. Rosa, D.P.; Evangelista, R.R.; Machado, A.L.B.; Sanches, M.A.R.; Telis-Romero, J. Water sorption properties of papaya seeds (Carica papaya L.) formosa variety: An assessment under storage and drying conditions. LWT 2021, 138, 110458. [Google Scholar] [CrossRef]
  106. Ouaabou, R.; Ennahli, S.; Di Lorenzo, C.; Hanine, H.; Bajoub, A.; Lahlali, R.; Idlimam, A.; Oubahou, A.A.; Mesnaoui, M. Hygroscopic Properties of Sweet Cherry Powder: Thermodynamic Properties and Microstructural Changes. J. Food Qual. 2021, 2021, 3925572. [Google Scholar] [CrossRef]
  107. Campos, R.C.; Correa, P.C.; Zaidan, I.R.; Zaidan, R.; Leite, R.A. Moisture sorption isotherms of sunflower seeds: Thermodynamic analysis. Cienc. Agrotecnologia 2019, 43, 2. [Google Scholar] [CrossRef]
  108. García-Parra, M.A.; Roa-Acosta, D.F.; Stechauner-Rohringer, R.; García-Molano, F.; Bazile, D.; Plazas-Leguizamón, N. Effect of temperature on the growth and development of quinoa plants (Chenopodium quinoa Willd.): A review on a global scale. SYLWAN 2020, 164, 411–433. [Google Scholar]
  109. Zeymer, J.S.; Corrêa, P.C.; de Oliveira, G.H.H.; de Araujo, M.E.V.; Guzzo, F.; Baptestini, F.M. Moisture sorption isotherms and hysteresis of soybean grains. Acta Scientiarum. Agron. 2023, 45, e56615. [Google Scholar] [CrossRef]
  110. González, C.M.; Llorca, E.; Quiles, A.; Hernando, I.; Moraga, G. Water sorption and glass transition in freeze-dried persimmon slices. Effect on physical properties and bioactive compounds. LWT 2020, 130, 109633. [Google Scholar] [CrossRef]
  111. EL Melki, M.N.; EL Moueddeb, K.; Beyaz, A. Cooling Potential of Bin Stored Wheat by Summer and Autumn Aeration. J. Agric. Sci. 2022, 28, 145–158. [Google Scholar] [CrossRef]
  112. Kuete, I.-H.T.; Tchuifon, R.D.T.; Bopda, A.; Ngakou, C.S.; Nche, G.N.-A.; Anagho, S.G. Adsorption of Indigo Carmine onto Chemically Activated Carbons Derived from the Cameroonian Agricultural Waste Garcinia cola Nut Shells and Desorption Studies. J. Chem. 2022, 2022, 1236621. [Google Scholar] [CrossRef]
  113. Velazquez, G.; Guadarrama-Lezama, A.Y.; Viveros-Contreras, R.; Martin-Polo, M.O.; Diaz-Bandera, D.; Castaño, J. Thermodynamics of Moisture Vapor Sorption and Mechanical Characterization of Methylcellulose and Ethylcellulose Based Films. J. Polym. Environ. 2022, 13, 1–23. [Google Scholar] [CrossRef]
  114. Kutyauripo, I.; Masamha, B.; Maringe, P. Exploring climate change adaptation strategies in maize (Zea mays) postharvest management practices among smallholder farmers. Outlook Agric. 2021, 50, 148–157. [Google Scholar] [CrossRef]
Figure 1. Schematic diagram of the equipment used for determining density.
Processes 11 00184 g001
Figure 2. (a) Convective drying (wind tunnel, Faculty of Sciences of Tunis). (b) Photographic image of the convective drying unit.
Processes 11 00184 g002
Figure 3. Reproducibility of the curves of the mass of corn during drying, T = 70 °C, V = 1 m·s−1, RH = 5 %, and h = 5 cm.
Processes 11 00184 g003
Figure 4. Schematic diagram of the experimental device.
Processes 11 00184 g004
Figure 5. The evolution of the apparent density (a) and the specific volume (b) of corn grain as a function of the moisture content.
Processes 11 00184 g005
Figure 6. The effect of the air temperature on the evolution of moisture content and temperature of the thin layer of corn; V = 1 m·s−1, (dry air: RH = 0%).
Processes 11 00184 g006
Figure 7. The effect of the air velocity on the evolution of moisture content and temperature of the thin layer of corn; T = 60 °C (dry air RH = 0%).
Processes 11 00184 g007
Figure 8. The effect of the relative humidity on the evolution of moisture content and the temperature of the thin layer of corn; V = 1 m·s−1, T = 60 °C.
Processes 11 00184 g008
Figure 9. Comparison between the evolution of moisture content and the temperature of the thin layer and the packed bed as a function of time; T = 60 °C, V = 1 m·s−1 (dry air RH = 0%).
Processes 11 00184 g009
Figure 10. Experimental desorption isotherms for corn kernels at different temperatures and the results estimated with the GAB model.
Processes 11 00184 g010
Figure 11. Desorption isosters of corn kernel.
Processes 11 00184 g011
Figure 12. Isosteric heat of water desorption from corn kernels as a function of equilibrium moisture content Weq.
Processes 11 00184 g012
Figure 13. Differential entropy for water desorption from corn kernels as a function of equilibrium moisture content Weq.
Processes 11 00184 g013
Figure 14. Enthalpy–entropy relationship in the corn kernel.
Processes 11 00184 g014
Table 2. Properties of the corn particles used in the experiment.
ParametersRange Values
V (m s−1)1–2
T (°C)50–70
H (mm)7–40
RH (%)0–10
Xi0.45–0.65
Mi (g)32
Ti (°C)30
Table 3. Uncertainties in the measurement of parameters during drying of corn.
InstrumentRangeEstimated Uncertainty
Electronic scale
‘Mettler Toledo’
0.5–6000 g±0.01 g (based on manufacturer’s specification)
HygrometerHumidity: 0–100% RHTemperature: from −20 to +120 °C (polycarbonate probe)
from −40 to +180 °C (st. steel probe)
±1.5% RH (from 3 to 98% RH and if 15 °C ˂ T ˂ 25 °C)
±0.3% of reading ±0.25 °C
Thermocouples
(type K)
Temp −270 to 1372 °C2.2% to 0.75% (based on manufacturer’s specification)
Anemometer0.30 to 15 m/s±0.05 m/s or ±1%
Table 4. Water activity of sulfuric acid solutions at specific concentrations and temperatures ranging from 50 to 70 °C for the corn kernels.
H2SO4 Solution % (v/v)Water Activity (aw)
50 °C60 °C70 °C
100.92680.93150.9382
200.86290.86520.8782
300.73960.74500.7531
400.57270.58100.5906
500.37240.38200.3929
600.18650.19530.2050
700.05580.06140.0675
800.00820.00980.0116
900.00640.00820.0103
Table 5. Used models of the moisture desorption isotherm.
ModelMathematical EquationParameters
Henderson [76] W e q = ( ln ( 1 a w ) A ) 1 B A, B
Chung and Pfost [77] W e q = ln ( A   ln ( a w ) ) R T B A, B
BET [36] W e q = W m   c   a w ( 1 a w ) ( 1 + ( c 1 ) a w ) Wm, c
GAB [78] W e q = W m   c m   k   a w ( 1 k   a w ) ( 1 k   a w + c   k   a w ) Wm, cm, k
Halsey [79] W e q = ( A ln ( a w ) ) 1 B A, B
Oswin [80] W e q = A ( a w 1 a w ) B A, B
Peleg [41] W e q = A ( a w ) B + C ( a w ) D A, B, C, D
Table 6. Parameters of the models used for the prediction of experimental desorption data of corn grain.
ModelParameters50 °C60 °C70 °C
HendersonA
B
Χ
R2
7.81588
0.79598
0.01068
0.98954
7.80923
0.73925
0.00946
0.99007
13.23623
0.84434
0.01238
0.96174
Chung and PfostA
B
Χ
R2
1521.53594
14.92854
0.02256
0.95247
1719.32891
16.38211
0.01998
0.95490
0.01377
24.80268
0.01549
0.93943
BETWm
C
Χ
R2
0.02348
12.13207
0.02018
0.96213
0.02954
5.25950
0.01646
0.96963
0.01399
11.23162
0.01686
0.92777
GABWm
C
K
Χ
R2
0.12577
0.46201
0.77350
0.01070
0.99100
0.14317
0.29733
0.77159
0.01029
0.98992
0.05939
0.69460
0.78024
0.01346
0.96118
HalseyA
B
Χ
R2
0.01597
1.25518
0.01688
0.97366
0.01586
1.16985
0.01525
0.97397
0.00766
1.29008
0.01516
0.94202
OswinA
B
Χ
R2
0.05000
0.67496
0.01423
0.98136
0.03989
0.72519
0.01264
0.98218
0.03101
0.65103
0.01382
0.95210
PelegA
B
C
D
Χ
R2
0.28051
2.90319
0.00152
−1.13955
0.00738
0.99644
0.20225
2.45031
1.83905
37.79465
0.00894
0.99367
0.07696
2.33712
0.07696
2.52032
0.01440
0.96306
Disclaimer/Publisher’s Note: The statements, opinions and data contained in all publications are solely those of the individual author(s) and contributor(s) and not of MDPI and/or the editor(s). MDPI and/or the editor(s) disclaim responsibility for any injury to people or property resulting from any ideas, methods, instructions or products referred to in the content.

