Article

The Effects of Logistics Websites’ Technical Factors on the Optimization of Digital Marketing Strategies and Corporate Brand Name

by
Damianos P. Sakas
1,
Dimitrios P. Reklitis
1,*,
Panagiotis Trivellas
2,
Costas Vassilakis
3 and
Marina C. Terzi
1
1
Business Information and Communication Technologies in Value Chains Laboratory (BICTEVAC LABORATORY), Department of Agribusiness and Supply Chain Management, School of Applied Economics and Social Sciences, Agricultural University of Athens, 11855 Athens, Greece
2
Organizational Innovation and Management Systems (ORIMAS LABORATORY), Department of Agribusiness and Supply Chain Management, School of Applied Economics and Social Sciences, Agricultural University of Athens, 11855 Athens, Greece
3
Department of Informatics and Telecommunications, Akadimaikou G.K. Vlachou, 22100 Tripoli, Greece
*
Author to whom correspondence should be addressed.
Processes 2022, 10(5), 892; https://doi.org/10.3390/pr10050892
Submission received: 10 April 2022 / Revised: 28 April 2022 / Accepted: 29 April 2022 / Published: 1 May 2022

Abstract

:
In a world overwhelmed with unstructured information, logistics companies increasingly depend on their websites to acquire new customers and maintain existing ones. Following this rationale, a series of technical elements may set the ground for differentiating one logistics website from another. Nevertheless, a suitable digital marketing strategy should be adopted in order to build competitive advantage. In this paper, the authors attempt to respond by implementing an innovative methodology building on web analytics and big data. The first phase of the research collects data for 180 days from 7 world-leading logistics companies. The second phase presents the statistical analysis of the gathered data, including regression, correlations, and descriptive statistics. Subsequently, Fuzzy Cognitive Mapping (FCM) was employed to illustrate the cause-and-effect links among the metrics in question. Finally, a predictive simulation model is developed to show the intercorrelation among the metrics studied as well as various optimization strategies. Research findings reveal a significant correlation between the logistics websites’ technical factors and the growth of the corporate brand name.

1. Introduction

1.1. Digital Marketing in Logistics Companies

According to previous research, the total size of the logistics industry in 2018 was USD 5.58 trillion, and it has been predicted that in 2024 will be USD 6.88 trillion worldwide [1]. This prediction illustrates a 12.3% increase in the total market, and the main questions that the marketers and strategists must respond to are the following. (a) How can logistics firms gain more market share in this highly competitive environment? (b) What marketing strategy needs to be followed in order to maintain the existing customers and attract new ones faster? (c) Considering those predictions, digital marketing can highly contribute to the growth of logistics companies by analyzing the web analytics that plays a crucial role in building a competitive advantage [2,3]. In this paper, the authors attempt to answer these questions based on big data and web analytics and to examine websites’ technical factors as well as users’ behavior in the websites. Previous studies advocated that logistics companies need to develop their websites in an easy-to-use and user-friendly way to attract new consumers and maintain the existing ones [4,5]. A well-designed website, in addition to the user experience benefits, also provides an opportunity for better implementation of the corporate digital marketing strategy [6].
Since one of the main forces widening the gap between markets and businesses is the internet [7], digital marketing may play a crucial role in filling this gap [8]. According to previous research, digital marketing contributes to logistics companies’ competitive advantage since its adoption is more economical and more targeted than conventional marketing methods [8,9]. For example, if a television campaign costs USD 40.00 per month, the Search Engine Marketing (SEM) campaign costs approximately 100 times less to attract the same number of customers [10]. Another interesting example is the comparison between the placed advertisements in newspapers and digital advertisements. To reach the same number of customers, newspapers’ advertisements are 1000% more expensive in comparison to digital ones [11]. Finally, one of the main advantages of the adoption of a well-designed digital marketing strategy is “Interactivity” [8,12], which is the company’s ability to create strong communication paths between the entity and the customers [13]. An increase in interactivity leads to an increase in user engagement between the corporate website and the clients and also leads to increased sales and brand name recognition [13,14]. The following subsections discuss how interactivity can be optimized with the accurate analysis and implementation of the website’s big data and web analytics [15,16].
This paper is divided into five sections: Section 1 depicts the introduction and literature review; Section 2 defines the materials and methods used in this study; Section 3 presents the results of descriptive statistics, correlation, and regression analyses, as well as the Fuzzy Cognitive Map (FCM) and the Agent-Based Model (ABM) approaches. Next, Section 4 discusses the findings, followed by Section 5 with the conclusions, which include research and practical implications.

1.2. Big Data in Logistics Websites

Big data analytics is growing more popular in a variety of fields, from logistics [17] and marketing [18] to neuroscience [19] and psychology [20]. The reason behind that is the growing necessity of structuring and using all that unstructured information [21]. This logic came to the surface 2500 years ago when Thucydides, in his work “Peloponnesian war”, explained that the person that possesses the ability to structure all the unstructured information can create intelligence, which leads to power [22]. Consequently, big data analytics can play a crucial role in corporate competitive advantage [23,24]. Big data may well be described as large volumes of complex data that need advanced tools and processes to gather and critically analyze for intelligence production [25,26].
According to previous researchers, four crucial elements can be found underlying big data [8,27]. Big data “Volume” refers to the volume and size of unstructured data that businesses gather and attempt to manage [8,25], for instance, the number of visitors that entered a website and the analysis of their behavior. Second, big data “Variety” refers to the variety and diversity of dissimilar and incompatible data types, such as raw data that need to be processed to provide an added value to the corporate marketing strategy [8,26,27]. Third, big data “Velocity” refers to the speed at which businesses collect and handle those data [8]. For instance, every 24 h, Google has to process 3,500,000,000 searches and Twitter 500,000,000 tweets [28]. Finally, big data “Value” from a corporate point of view is the most important one [25,27,29]. Big data’s value is generally derived from pattern detection or an algorithm analysis, which leads to increased efficiency, greater customer interactivity, and other tangible and measurable benefits [25,27,29].
According to the above logic of big data, the following questions have emerged. What will happen if a logistics website does not process a parcel quote fast enough and the customer must wait? What will happen if the customer must wait too long for the webpage to fully load? To respond to these research questions, we have to estimate “how much time exactly” is the waiting period and why. With the valuable assistance of big data analytics, web analytics marketers and developers can respond to those questions and possibly revert the unwanted outcomes. Consequently, the adoption of big data analytics is crucial for logistics companies to acquire a competitive advantage [30]. There are different types of big data analytics, such as audio analytics, social media analytics, video analytics, and predictive analytics [25,31,32,33,34]; this research is focused on predictive analytics. Predictive analytics refers to the extraction of historic unstructured data and the creation of predictions based on them [25,35,36,37]. Predictive analytics are useful in environmental research [38] and retailing [39] but are commonly used in the logistics industry also [40,41,42,43,44].

1.3. Web Analytics Key Performance Indicators (KPIs) and Corporate Brand Name

Our study is based on predictive analytics as well as their connection with logistics websites’ web analytics. More specifically, that kind of analytics provides researchers and marketers the ability to gather logistics websites’ historical data and then create a simulation to investigate the correlations between the examined metrics [37,39]. Another crucial factor that logistics companies have to take into consideration is the incorporation of web analytics into their marketing strategy to acquire a competitive advantage [2,45]. Web analytics (WA) can play a role in the acquisition of competitive advantage through the extraction and analysis of various metrics that contribute to a website’s visibility and brand name, such as “Organic Traffic” and “Global Rank” [46,47,48]. Predictive analytics were obtained in the type of web analytics for this study since those were acquired from seven world-leading logistics webpages. The chosen companies are among the top 10 third-party logistics (3PL) companies based on their size and profit [49]. The main prerequisites were the use of Facebook and Instagram for their social media promotion as well as the use of their website for the digital promotion of their services. Following several research recommendations, the authors chose seven logistics websites, as that is considered an adequate number for the type of analysis that this research performs and depicts a sufficient number to produce results for the logistics sector [9,14].
The procedure of studying the behavior of users on a website is known as web analytics [2,3]. Previous studies have shown that logistics websites’ brand name, as well as the digital marketing strategy, can be dramatically improved by the correct implementation of web analytics [4,5,9]. Key performance indicators are web analytics that have been extracted from the examined websites and have been utilized quantitatively [50]. The WA KPIs are divided into two categories; on the one hand, there are the technical factors which include “Fully Loaded Time”, Total Page Size”, and website’s “Requests”, and on the other hand, the behavioral KPIs, such as “Organic Traffic”, “Average Duration”, and “Pages per Visits” [4,51,52]. The authors extracted the behavioral KPIs from the SEMrush and Alexa platforms, and the technical factors were extracted from the GTmetrix platform. The examined metrics are presented in Table 1.

1.4. Research Hypotheses

In order to build a competitive advantage, logistics companies have to analyze their environment through all the available sources, including digital ones. Among the digital sources that affect their strategy are the technical factors of the websites, which include “Fully Loaded Time”, “Total Page Size”, and “Request”. Those factors are crucial since we can identify in a tangible quantitative view the efficiency of the website [4]. Additionally, the examination of the behavioral factors such as “Average Time on Site” provides added value to marketing strategy since those factors offer indirect information for the user experience [9,14]. The intercorrelated examination of both factors will present available digital marketing optimization strategies. The research gap can be located in the previously limited research in the field of digital marketing in the logistics sector with the assistance of big data and web analytics. Additionally, since it is crucial for logistics companies to acquire a competitive advantage, it is useful to incorporate big data in this analysis. The unique perceptiveness of this research is important since raw undisputed big data have been extracted and analyzed to provide useful results for the actual behavior of the users on these websites, which could provide valuable insights for the increase of the digital brand name in logistics companies.
The findings of this study will be useful for decision-makers, developers, and marketers to identify the specific technical elements that differentiate one logistics website from another as well as the best digital marketing strategy that should be adopted. More specifically, decision-makers can optimize digital investments by the examination of those web analytics and incorporating them into a general strategy to increase corporate brand name [66,67,68]. Additionally, website developers can get useful insights on why and how a user-friendly website can optimize visibility [4,69,70]. Finally, marketers can identify ways to accomplish competitive differentiation leading to a competitive advantage [71,72]. As a consequence, the following hypotheses have been generated to gain a better understanding of the significance of big data and WA implementation and their impact on the corporate brand name.
Hypothesis 1 (H1).
“Total Page Size” of logistics companies affects “Organic Traffic” variable through their “Total Visitors” metric.
The first hypothesis attempts to identify if the technical parameter “Total Page Size” and the behavioral parameter “Total Visitors” affect the metric “Organic Traffic”. This hypothesis aims to identify if the above technical factors affect logistics webpage visibility.
Hypothesis 2 (H2).
“Total Visitors” of logistics companies affects “Social Traffic” variable through their “Fully Loaded Time” metric.
The second hypothesis focuses on the investigation of the effects of the behavioral parameter “Total Visitors” and the technical “Fully Loaded Time” with the metric “Social Traffic”. This hypothesis attempts to identify the effects of the websites’ technical factors on the traffic generated from social media platforms such as Facebook and Instagram.
Hypothesis 3 (H3).
“Requests” of logistics companies affect “Paid Traffic” variable through their “Bounce Rate” metric.
This hypothesis attempts to determine if the technical parameter “Requests” and the behavioral parameter “Bounce Rate” affect the metric “Paid Traffic”. This research hypothesis is important since logistics managers have to understand the effectiveness of their advertisements in correlation to the users that exit the website immediately after they enter.
Hypothesis 4 (H4).
“Average Visits Duration” of logistics companies affects “Paid Traffic” variable through their “Total Visitors” metric.
The fourth hypothesis focuses on the effects of the parameters “Average Visits Duration” and “Total Visitors” on the “Paid Traffic”. This hypothesis is crucial since the effectiveness of the behavioral metrics on paid advertisements can be identified.
Hypothesis 5 (H5).
“Global Rank” of logistics companies is affected by “Fully Loaded Time”, “Total Page Size”, and “Requests”.
The final hypothesis attempts to discover the effects of the logistics websites’ technical factors “Fully Loaded Time”, “Total Page Size”, and “Requests” on the corporate brand name. The findings will provide interesting insights to developers and marketers about the usability and efficiency of corporate websites.
The purpose of the study is to examine the impact of the websites’ technical factors on the corporate brand name. For this reason, five research questions have been formulated to provide a holistic assessment of the main research purpose. More specifically, it is crucial for the companies to know the impact of the website size and loading time on the website’s visibility (H1, H2). Additionally, it is important to know the efficiency of their paid advertisements and how to optimize them (H3, H4), and finally, how all the previous elements combined affect the corporate brand name (H5).

2. Materials and Methods

In this study, the authors adopted an alternative methodology to evaluate the effects of the logistics websites’ technical and behavioral factors on the corporate website visibility and brand name. This methodology was adopted since the raw extracted data are not affected by any potential cognitive bias [73,74]. At the first stage of the study, web metrics were gathered for seven world-leading logistics companies. Those data were gathered from internet platforms daily for 180 days for the behavioral and technical data, respectively. Additionally, statistical analysis was performed, more specifically, descriptive statistics, correlations, and regression analysis.
In the second part of the study, an exploration model was developed to present the intercorrelations between the examined metrics, as well as three optimization scenarios, to provide decision-makers with a clear picture of the examined metrics. Finally, after the macro-scale analysis, a microanalysis was implemented supported by regression and correlation analysis to create a simulation model that illustrates users’ activity on a corporate website [75].

2.1. Selection, Retrieval, and Statistical Analysis

Web analytics were gathered from seven logistics websites. The logistics firms were selected based on their profitability [49,76]. SEMrush was used for the extraction of the behavioral data and, more specifically, for the metrics: “Organic Traffic”, “Global Rank”, “Bounce Rate”, “Average Time on Site”, “Pages per Visit”, “Paid Traffic”, “Social Traffic”, and “Total Visitors”. GTmetrix was used for gathering technical metrics, such as: “Fully Loaded Time”, “Total Page Size”, and “Requests”. After the extraction of data, the authors conducted a statistical analysis. This statistical analysis provides a comprehensive picture of all the factors and how those interconnected factors affect the marketing strategy.

2.2. Exploratory Model Creation

The statistical analysis revealed various correlations among the examined factors. The adoption of the Fuzzy Cognitive Map (FCM) is based on this statistical analysis. The FCM’s main aim is to provide a graphic representation of the positive and negative, cause and effect connections between the web metrics that are being examined [75,77]. Additionally, the authors use this method to create three optimization scenarios since this macro-scale model was created to show the strength of correlations and can be utilized in the construction of a successful marketing strategy [75,77,78].

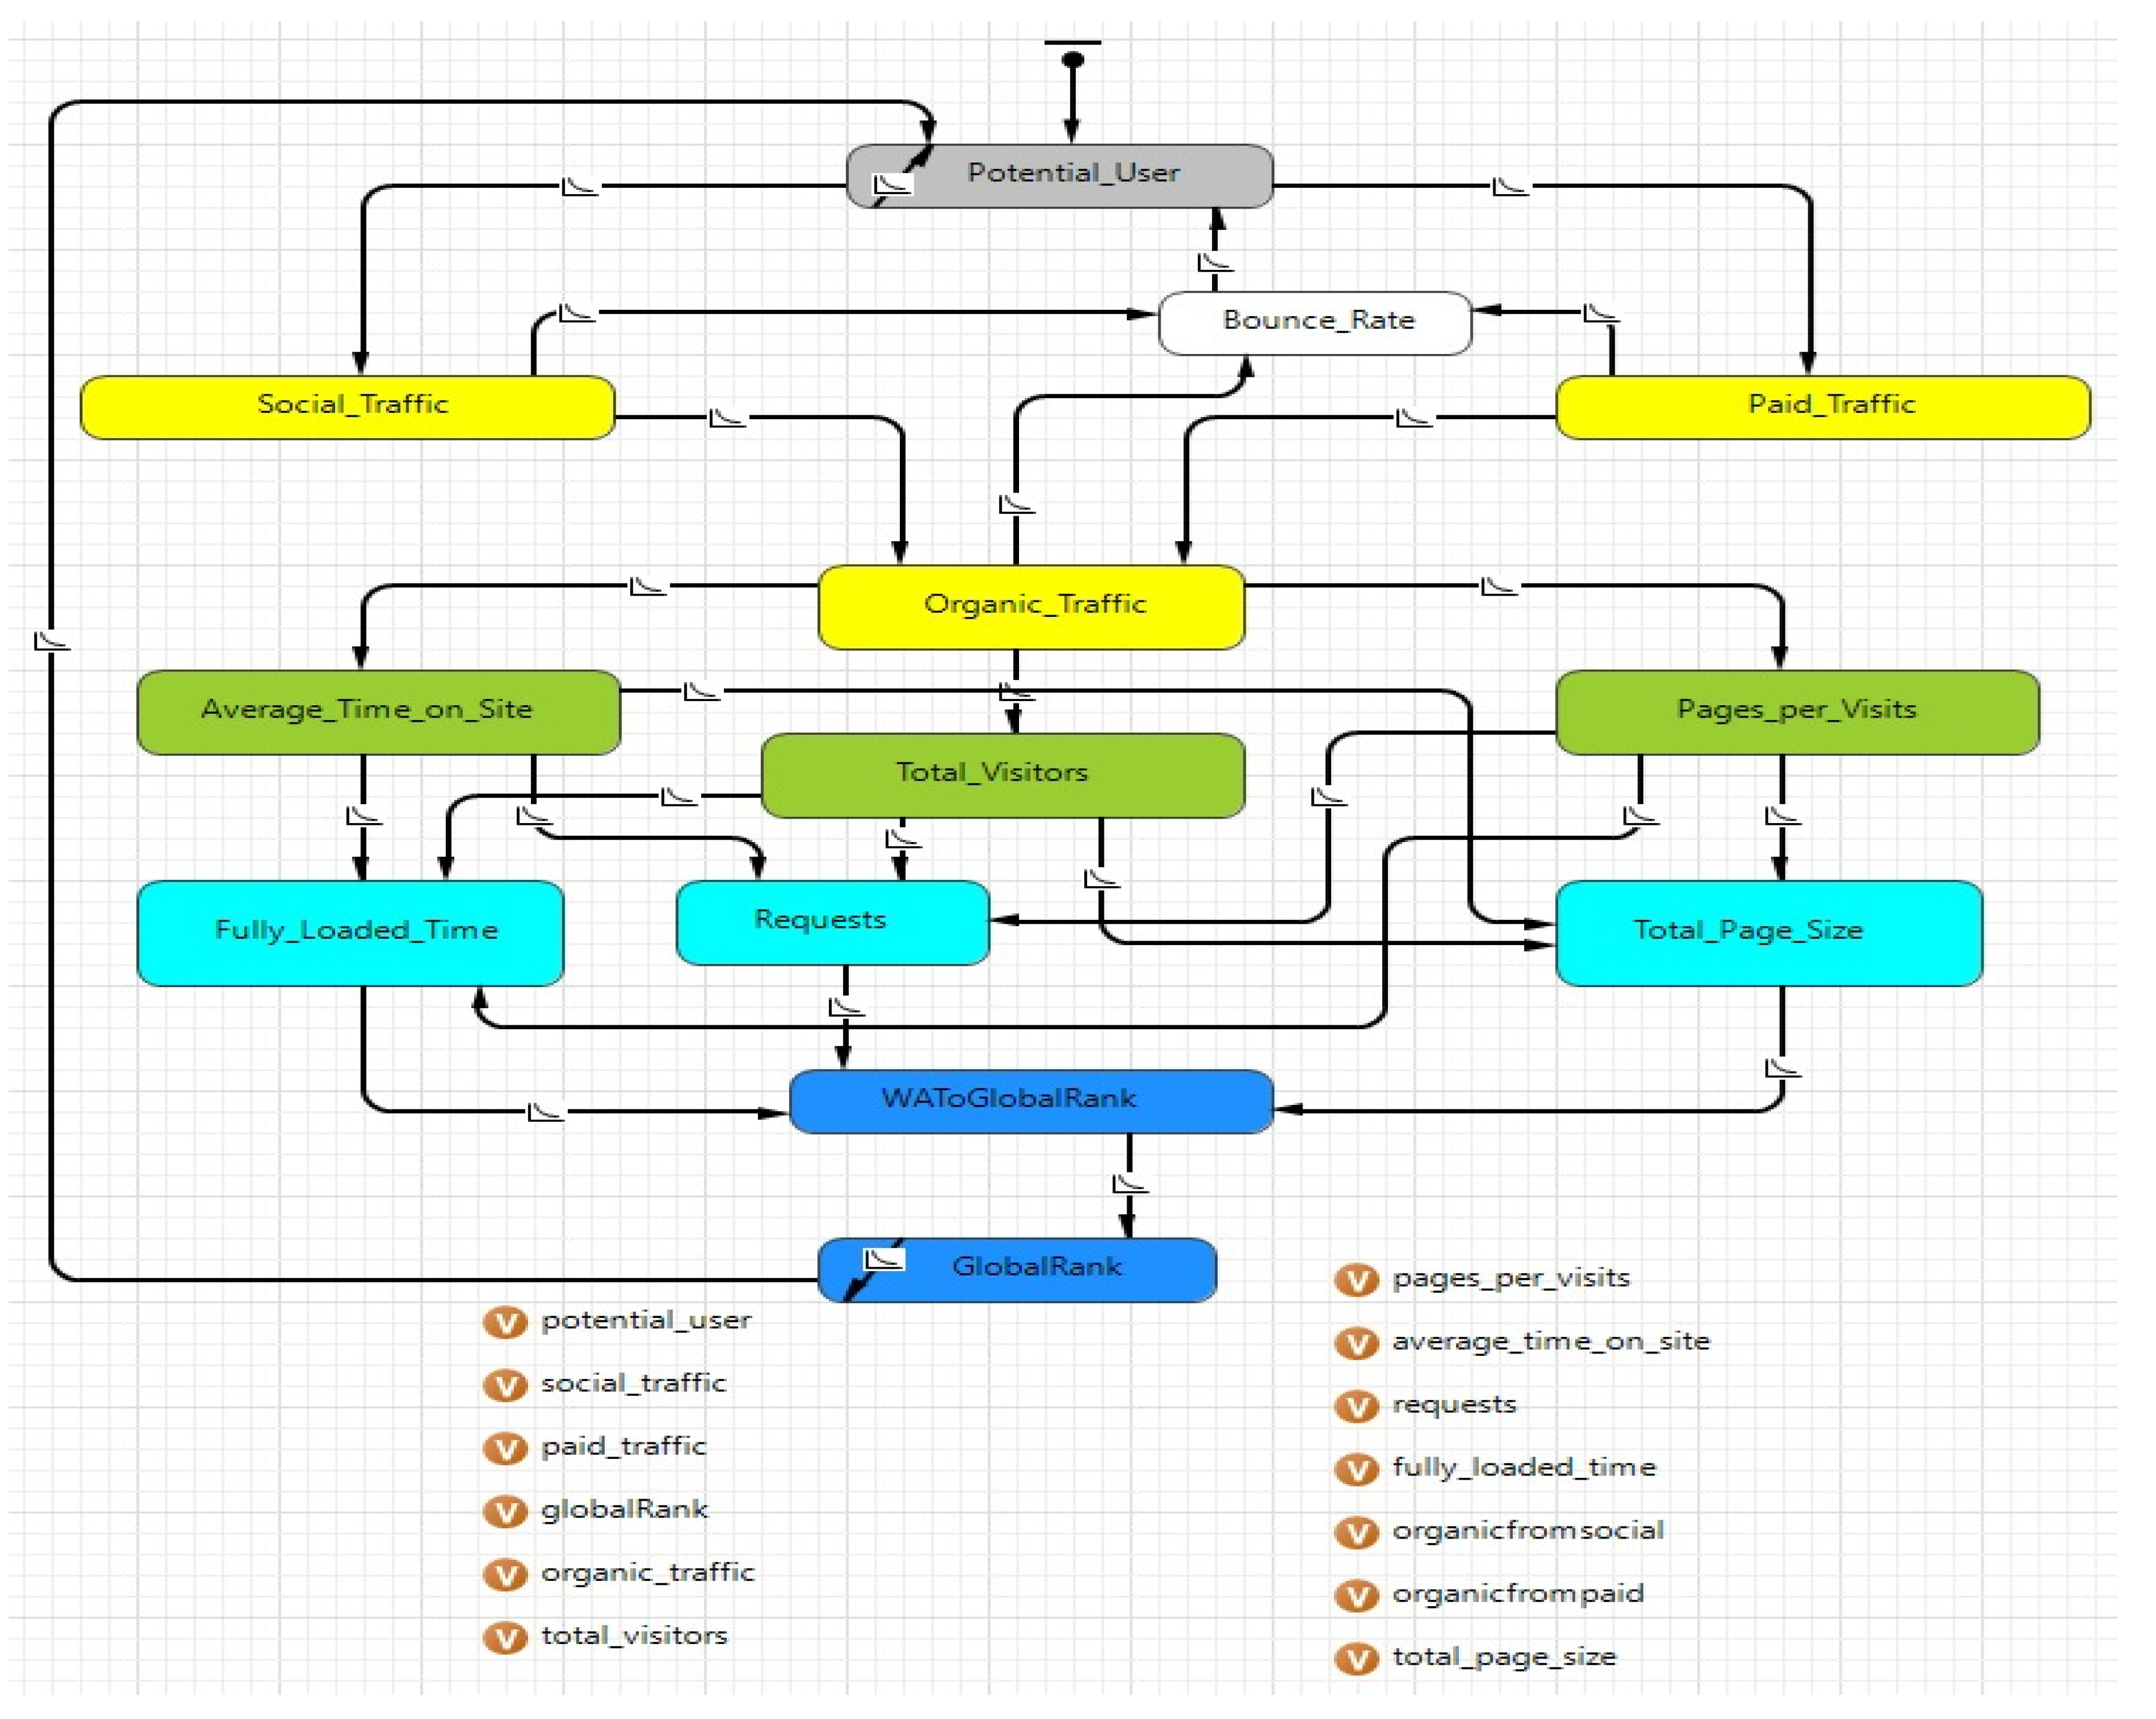
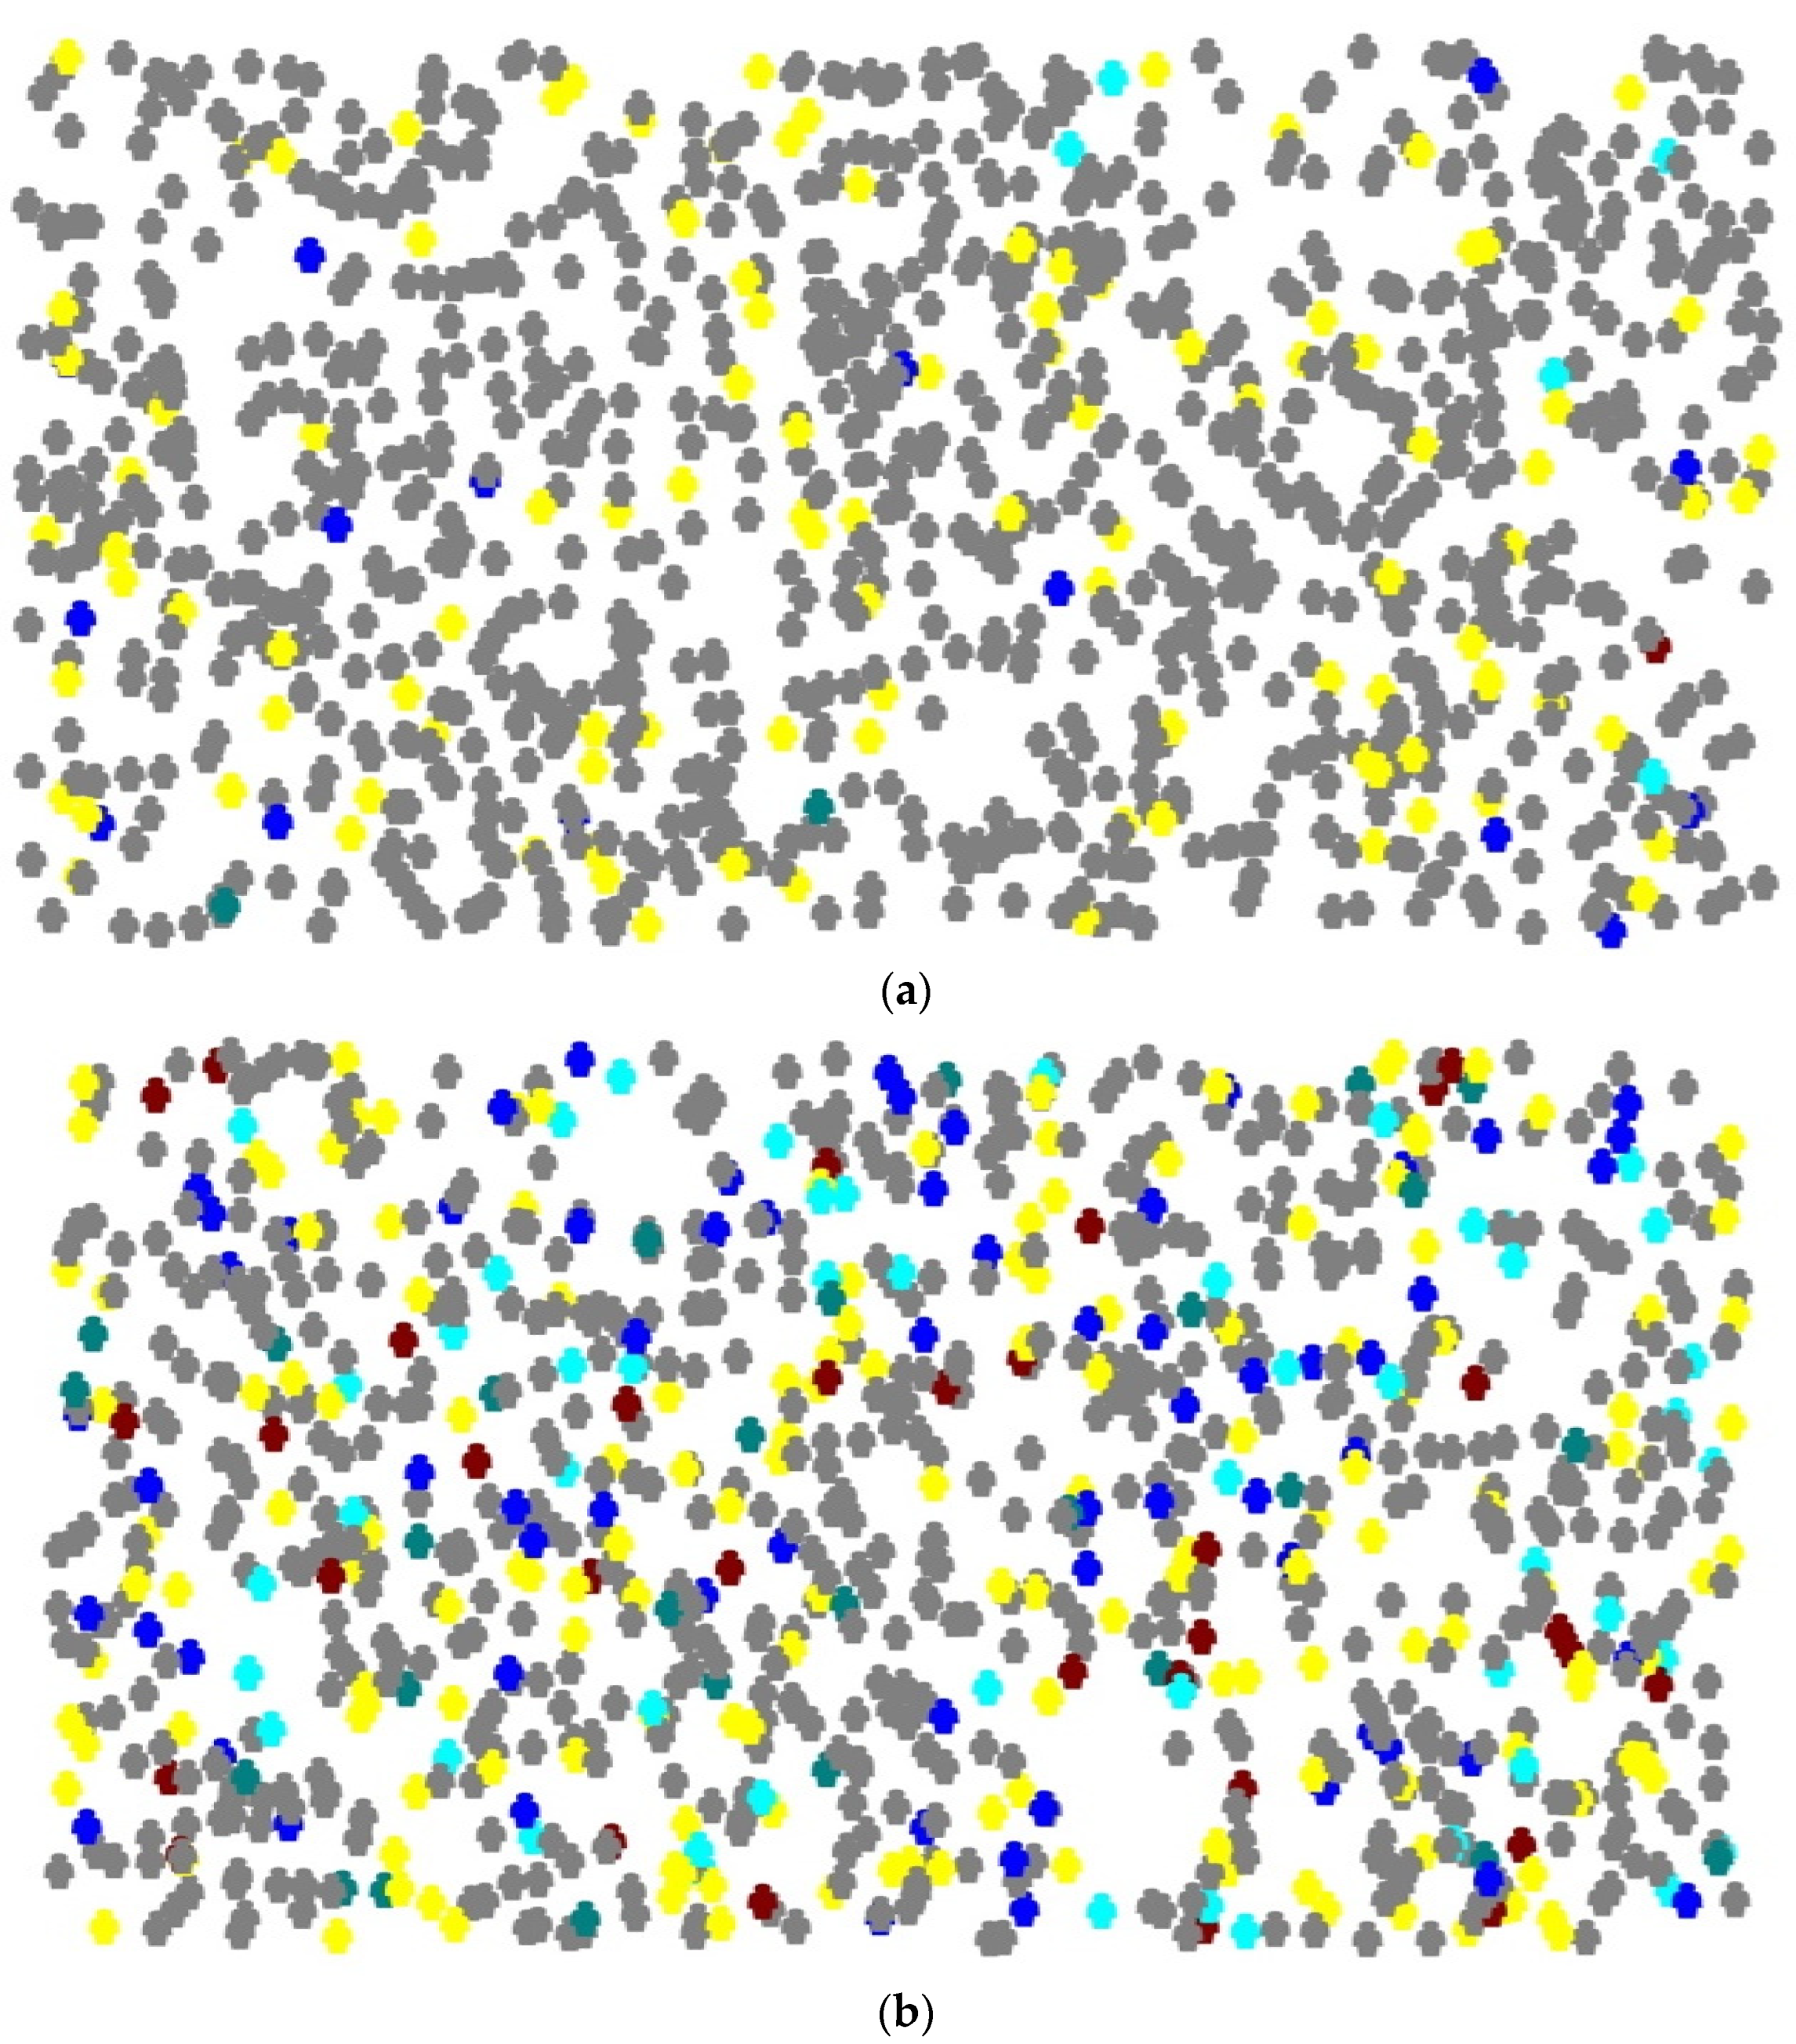
2.3. Agent-Based Model

After the creation of the macro-scale model (FCM), a micro-scale model was developed. Agent-Based Models (ABM) provide the ability to simulate and estimate all the behavioral and technical factors that affect the corporate brand name and visibility [9,75,79]. The contribution of the ABMs to digital marketing and decision-making is profound and has been analyzed in various previous research [80,81]. More specifically, ABMs provide the ability for marketers to create simulations for real-life problems and to analyze user behavior with no cost for the extraction of valuable decision-making strategies [79,81]. The following section presents the results of the study.

3. Results

3.1. Statistical Analysis

The results of the data gathering platforms, presented in Table 1, are discussed in this section. The results are based on data collected from seven world-leading logistics companies [76]. The collected data were merged per category to present the total results for the logistics sector. For instance, the metric “Webpages’ Total Page Size” represents the analysis of all logistics companies. Table 2 illustrates the descriptive statistics from the data collection of 180 days.
Table 3 and Table 4 illustrate Pearson’s coefficients and regression analysis testing the first hypothesis (H1).
As illustrated in Table 3, a significant positive correlation with ρ = 0.962 ** was observed between the traffic and Total Visitors, implying that as traffic increases, more people will visit the logistics webpage. Furthermore, non-significant correlations have been found between the total page size, the total visitors, and organic traffic with ρ = 0.018 and ρ = 0.033 , respectively. This result illustrates that there is no correlation between the total webpage size and visibility. The regression analysis is presented in Table 4. The regression analysis model is significant, with p-values < 5%. The results are significant, and more specifically, with every 1% increase in organic traffic, the total visitors and total page size increase by 1.5% and 96.2% accordingly.
Table 5 and Table 6 illustrate the Pearson’s coefficients and the regression of the second hypothesis (H2).
As presented in Table 5, a significant positive correlation with ρ = 0.931 ** has been detected between the social traffic and total visitors, suggesting that as the social traffic increases, more people will visit the corporate website. Additionally, non-significant negative correlations have been found between the fully loaded time, the total visitors, and social traffic with ρ = 0.029 and ρ = 0.012 , respectively. That indicates that when the webpage takes less time to load, more visitors access the website. This is the expected behavior since if the webpage takes too long to load, visitors exit the website [82]. As for the regression, with every 1% increase in Social Traffic, the total visitors increased by 93.1%, and fully loaded time decreased by 1.8%.
Table 7 and Table 8 illustrate the Pearson’s coefficients and the regression of the third hypothesis (H3).
Table 7 illustrates a significant positive correlation with ρ = 0.675 ** between the paid traffic and the bounce rate. This is interesting since it indicates that most of the users that entered the websites from a paid advertisement exited from it without any activity. Additionally, non-significant correlations have been observed between the requests, the bounce rate, and social traffic with ρ = 0.024 and ρ = 0.013 , respectively. The latter illustrates that paid advertisements, to be effective, need to be placed on a targeted crowd. The regression is presented in Table 8. Regression is significant, with p-values < 5%. The results of the H3 are significant, and with every 1% increase in paid traffic, the bounce rate increased by 67.6%, and requests decreased by 2.9%.
Table 9 and Table 10 present the Pearson’s coefficients and the regression of the fourth hypothesis (H4).
As illustrated in Table 9, significant positive correlations with ρ = 0.766 ** and ρ = 0.275 ** were observed between the paid traffic, total visitors, and average time on site, respectively. This is as expected since paid advertisements increase the number of visitors and the time spent on site. On the other hand, a negative significant correlation was observed between the total number of visitors and the average time on site with =−0.149 **. This result indicates that the vast majority of the visitors who entered from a paid advertisement on the website might have entered accidentally and exited after some seconds. The regression is presented in Table 10. Regression is significant, with p-values < 5%. More specifically, the results are significant since, with every 1% increase in paid traffic, the total visitors and average time on site increase by 82.6% and 39.8%, respectively.
Table 11 and Table 12 illustrate the Pearson’s coefficients and the regression of the fifth hypothesis (H5).
As illustrated in Table 1, multiple significant correlations were observed among global rank, fully loaded time, and requests with ρ = 0.088 *, ρ = −0.268 **, and ρ = 0.101 **, respectively, implying that as traffic increases, more users will visit the logistics webpage. Drawing from this finding, it can be seen that the global rank and, as a consequence, the brand name of a logistics website is affected by the technical factors of the website. Additionally, the regression is presented in Table 12. More specifically, the results are significant, and with every 1% increase in global rank, an increase can be observed in fully loaded time and requests as well as a decrease in total page size by 11.7%, 15.7%, and 30%, respectively. Given that R2 is rather restricted (0.107), although this hypothesis is accepted, generalizations should be made with caution.

3.2. Fuzzy Cognitive Map

The above statistical analysis was used for the creation of the Fuzzy Cognitive Map. An FCM can illustrate the fundamental parameters of a system as well as present the level of correlations (−1,1) between the examined metrics [75,78]. This feature is important for decision-makers and useful for big data analysts. Since big data are unstructured information, the illustration on a map of the cause and effects relationships of a system is very useful for marketers [83]. This method was used in this paper since it was frequently used in earlier SEO and SEM studies [14,79,84,85]. Figure 1 presents the FCM with the degree of correlation. The thicker the line, the higher the correlation.

3.2.1. Adoption of Fuzzy Cognitive Map Scenarios to Analyze the Data

Supporting the progress of the FCM model, three optimization scenarios were run to assess the predicted variations in the KPIs at different phases of user activity on the corporate website. In these scenarios, the Sigmoid function has been used because it provides the ability to use the interval (−1,1) and illustrates the degree of impact between the examined metrics [86]. Figure 2 presents the technical factors optimization scenario. According to this scenario, if the company manages to reduce the loading time of the webpage by 5%, it will observe a 1% decrease in global rank, which is beneficial because the second website in rankings is better than the 15th, and the average time on site spent from a user by 1%. This is expected behavior because, according to previous research, a lot of users exit the website if a page takes more time than expected to load [82].
Figure 3 presents the visibility optimization scenario, and in this case, some interesting outcomes have been observed. If the company increases the visitors and the organic traffic by 10%, the total pages per visit will increase by 2%, the average time on site by 5%, and the bounce rate will decrease by 8%. This is expected because the sudden rise brings the corporate website more users that spend more time and search more pages on the corporate website.
Figure 4 presents the brand name optimization scenario. If the company’s target is to decrease its global rank by 40%, it has to increase the organic traffic by 1%, the paid traffic by 1%, and the social media traffic by 3%. This interesting observation relies on the fact that social media advertisements have more impact on the logistics brand name than paid advertisements through search engines. Additionally, in order to acquire a better brand name, the logistics websites need to generate 1% more visitors well as decrease the fully loaded time by 2%.

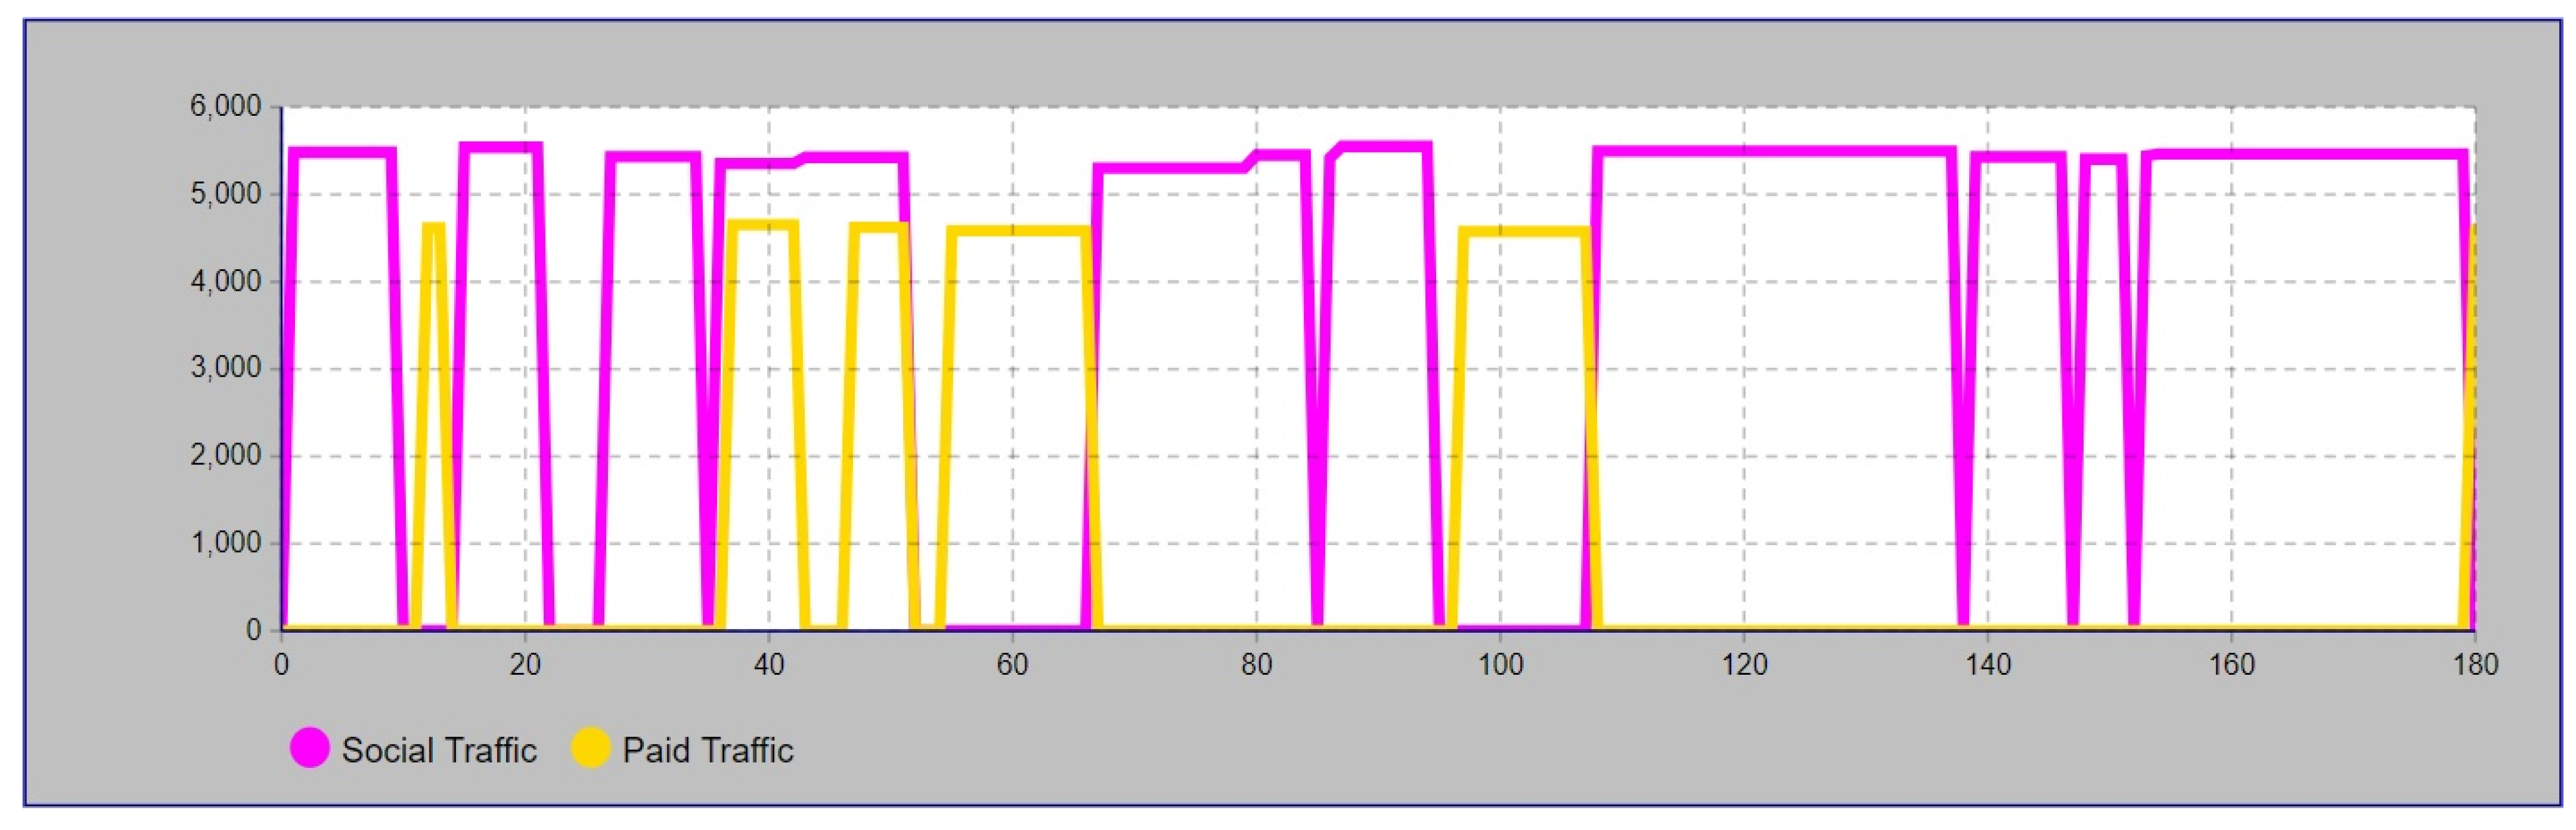
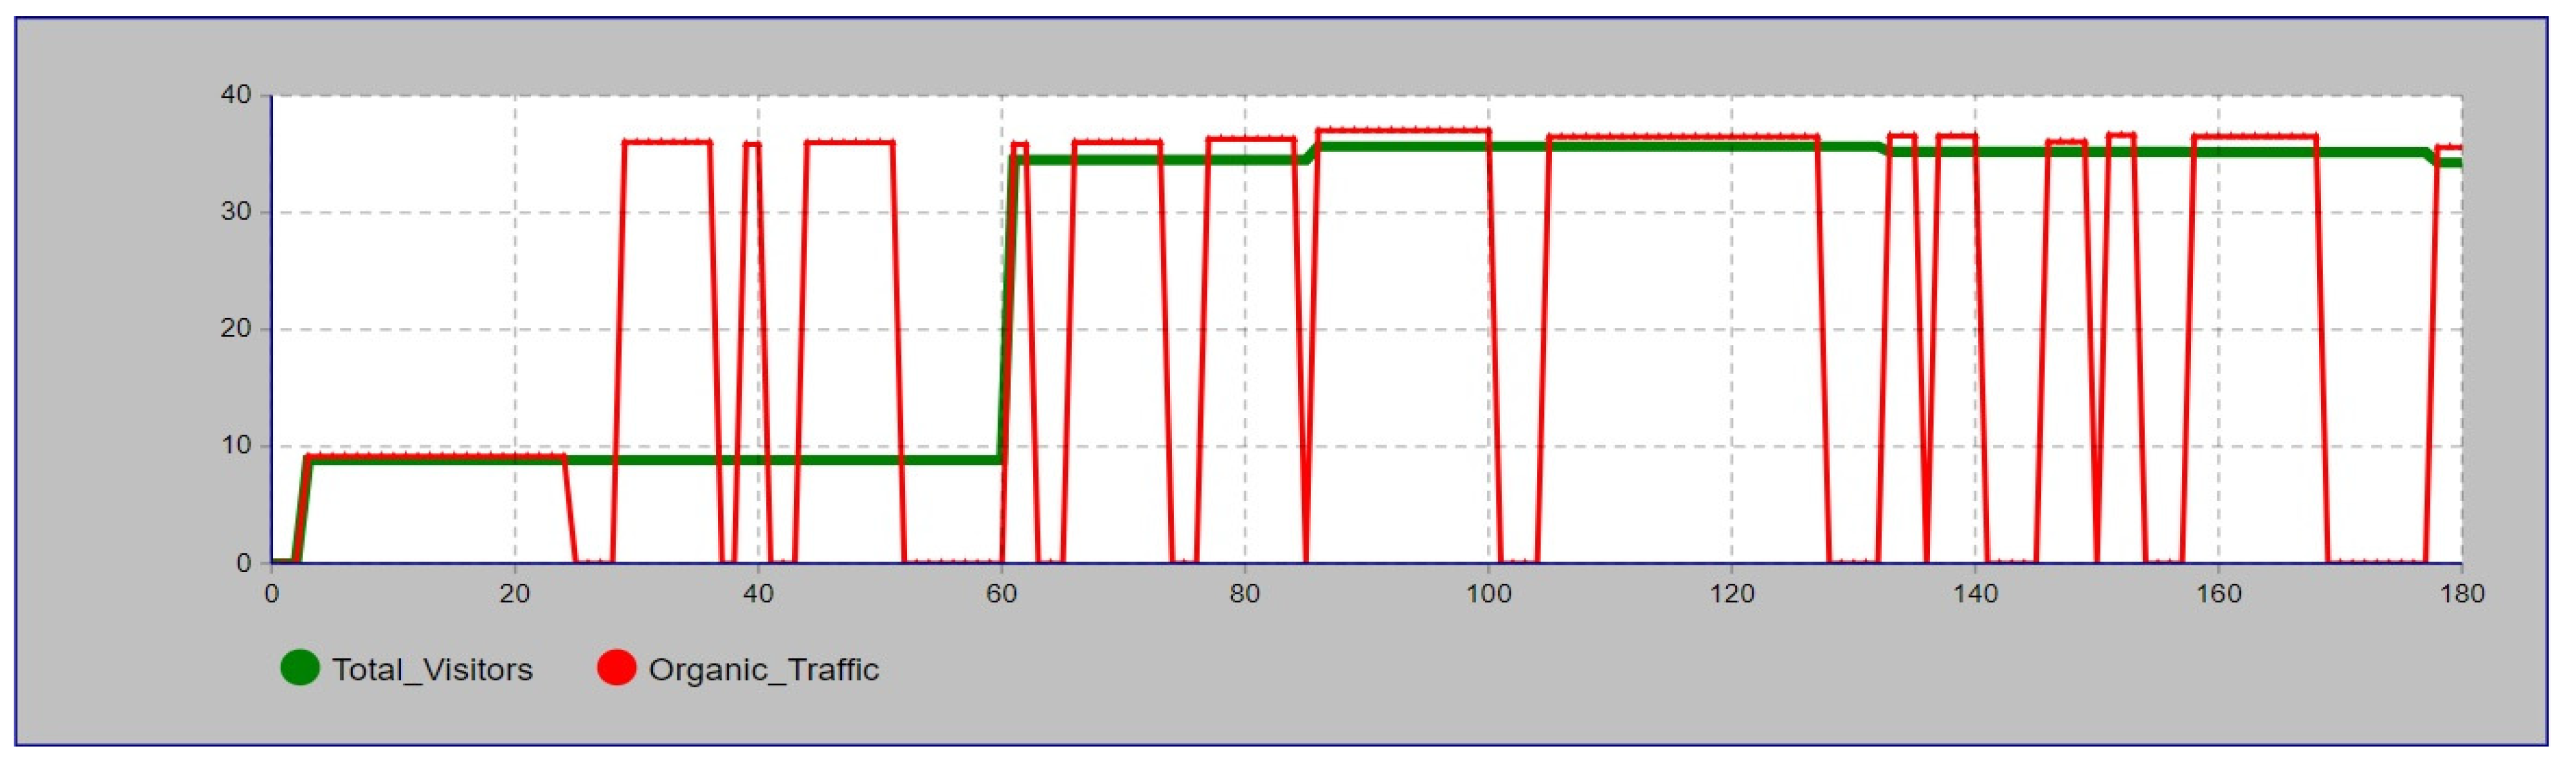
3.3. Adoption of ABM

An agent-based model was adopted to provide a microanalysis of the issue [75]. Its adoption is beneficial for marketers and decision-makers since the agent-based models provide simulations for real-world situations and evaluate user behavior to extract useful decision-making and marketing strategies [9,79,81]. Additionally, the usage of Agent-Based Models allows organizations to fully comprehend the insights provided by big data in terms of user interaction with their websites, as well as chances for growth [79,81]. The complete model was created using the Anylogic 8.7.9 software and the programming language “Java.”
The model depicts the usual behavior of a customer that enters a logistics website. More specifically, the gray top box illustrates the initial position of an agent. The model simulates all the processes from the way that a customer enters the website (traffics) up to the production of the global rank. Changes to the needed circumstances are shown as variables (V) at the bottom of the image in Figure 5 that cause movement among the blocks, which is displayed on the ABM with black arrows. For this model, the Poisson distribution was used because it provides the ability to incorporate into the model the statistical analysis presented in Section 3.1 [87,88].
The simulation starts from the top gray box where agents are distributed, with the assistance of the statistical analysis, to the logistics website either through paid, social, or organic traffic (yellow boxes). Following, a part of the agents exits the website through the bounce rate white box, and another part continues to the website providing the well-known behavioral metrics, average time on site, total visitors, and pages per visit (green boxes). After that, the agents moved to the technical factors following the Poisson distribution. The technical factors are presented in Figure 5 in cyan boxes. Finally, the agents arrive at the global ranking box (blue), which provides the global rank, and then proceed to the general agents’ pool on the top (gray box).
Figure 6a,b illustrate the population allocation results over a period of 180 days. Figure 6a illustrates the 12th day of the simulation, where the gray agents represent the potential visitors and the yellow agents the traffic sources, either social, paid, or organic traffic, of the logistics websites. Figure 6b presents the simulation after the 71st day and illustrates that more cyan agents are created that represent the technical factors and more blue agents that represent the global rank. This is expected behavior because, after 70 days, the brand name has been created. Additionally, the red agents represent the bounce rate, and the green agents represent the behavioral factors. The following Figures illustrate the results of the simulation.
Figure 7 and Figure 8 depict the simulation’s results of the visibility factors, and more specifically, Figure 8 illustrates the total visitors and the organic traffic, and Figure 7 presents the social traffic and paid traffic. The horizontal axis represents the duration of the model for 180 consequent days, and the vertical axis illustrates the values given from the simulation. The yellow line in Figure 7 shows a stream of advertisements (paid traffic) placed from the logistics companies, and the pink line depicts the visitors that access the websites from social media advertisements. In Figure 8, it can be observed that the paid advertisements in Figure 7 have slightly affected the number of visitors to the logistics websites. On the other hand, the placements of social media advertisements in Figure 7 had a crucial impact on the total number of visitors. This interesting result illustrates that the logistics sector websites are affected much more by social media advertisements than the general Google or website advertisements and suggests to logistics industry marketers to invest much more in social media than in other sources to promote visibility.
Figure 9 depicts the simulation results for the global rank variable. As can be identified, there is a significant improvement when social media advertisement is placed. The major change can be observed again after day 23 and the spike of the social media advertisements, where the global ranking gets much better values day after day (negative values because the 2nd place in the global ranking is better than the 150th place). This finding highlights to decision-makers the importance of social media to the logistics industry as well as the possible beneficial impact of investing in social media in order to optimize the corporate brand name [89]. Finally, the global ranking seems to be impacted much more by social media advertisements than the general paid traffic which means that the social media advertisements have a better return on investment than the general paid advertisements (Google ads or ads on other websites).

4. Discussion

The main goals of this study are, on the one hand, to examine the effects of the websites’ technical factors and behavioral factors on the logistics websites’ visibility and brand name, and on the other hand, to suggest digital marketing optimization strategies in order to improve corporate brand name. More specifically, the first hypothesis (H1), which is built on previous studies [90,91], highlights the importance of developing websites with low size to optimize visibility, as presented in the technical optimization scenario in Section 3.2.1. The second hypothesis (H2) illustrates the necessity of placing more advertisements on social media than on other websites since the return on investment could be higher. This significant result is illustrated in the agent-based model and supported by previous researchers [92,93]. Additionally, the findings, as also presented in the technical optimization scenario in Section 3.2.1, highlight the necessity of minimizing the fully loaded time because if a customer must wait too long for a page to load, they are more likely to exit the website immediately [94,95].
The results of the third hypothesis (H3) revealed no correlation between the request and the percentage of visitors that exit the website but illustrated a great correlation between bounce rate and paid traffic. This finding illustrates that a large number of visitors that entered the website from a paid advertisement exit without viewing anything. This practically means that visitors clicked the advertisement and entered accidentally, and this underlines the finding of the first hypothesis. The fourth hypothesis (H4) found a correlation between the time spent on the website, the visibility, and the paid traffic, as presented in the visibility optimization scenario in Section 3.2.1, and on the execution of the agent-based model in Section 3.3, the paid advertisements (social and general) have a beneficial impact on corporate websites’ traffic and visibility [14,16,92,93]. Finally, the findings for the fifth hypothesis (H5) were very interesting. Statistical analysis and the brand name optimization scenario illustrated a great impact of technical factors on the corporate global ranking. More specifically, when the website takes less time to load, it increases the ranking and the corporate brand name. Companies must construct user-friendly websites to increase their brand name. For example, the consumer must be able to find a tracking number as fast as possible and without waiting for a webpage to load, which will contribute to the development of brand loyalty [96]. An additional finding highlights the beneficial effects of social media advertisements on the brand name [97,98].

5. Conclusions

5.1. Theoretical Implications

This research contributed by developing a three-stage data-driven technique for measuring the effect of technical and behavioral factors on seven logistics companies’ websites. Additionally, the study broadens researchers’ toolbox while attempting to extend crucial digital marketing previous results and future strategies. More specifically, this study presented the usefulness of Fuzzy Cognitive Maps in the examination of macro-level situations and the creation of optimum digital marketing scenarios. Additionally, the adoption of agent-based models provides the researchers with the ability to run iconic simulations for free. This research perspective moves digital marketing research forward to a new and more practical approach.

5.2. Practical Implications

The practical implications of this study are three-fold. First, marketers can benefit from the implementation of both general paid and social media advertisements, but they have to emphasize social media advertisements because it will increase the website’s visibility and brand name faster. Second, developers need to make sure that the logistics website will be easy to use and user-friendly since the technical factors are highly related to the corporate brand name. Third, decision-makers need to consider the adoption of Fuzzy Cognitive Maps and Agent-based models while designing their corporate strategy. The adoption of those methods will save cost, effort, time, and potential damage for the companies, since there is no need to test the scenarios in real life but on a platform instead.

5.3. Future Research and Limitations

This study implemented an innovative methodology and provided useful insights for logistics managers globally. There are several limitations and suggestions for future research. The current research is based on the seven biggest world-leading logistics websites and provides global practical implications. The next step must be based on microenvironments. For instance, the competition among the logistics websites in the Mediterranean Sea [99]. This will give more accurate findings for SMEs. Another limitation is that there is no in-depth examination of the above advertisements either on social media or on websites. Future research can examine the optimal website advertisements for social media based on neuromarketing [100]. Finally, research data are extracted from data platforms which, on the one hand, provide accurate and indisputable big data, but on the other hand, the organizational culture cannot be identified. Finally, future research could examine and correlate both big data and qualitative research through interviews to reveal underlying mechanisms [101].

Author Contributions

Conceptualization, D.P.R., D.P.S., P.T., M.C.T. and C.V.; methodology, D.P.R., D.P.S. and P.T.; software, D.P.R., D.P.S. and P.T.; validation, D.P.R., D.P.S. and P.T.; formal analysis, D.P.R.; investigation D.P.R., D.P.S. and P.T.; resources, D.P.R., D.P.S. and P.T.; data curation, D.P.R., D.P.S. and P.T.; writing—original draft preparation, D.P.R. and M.C.T.; writing—review and editing, D.P.R.; visualization, D.P.R., D.P.S. and P.T.; supervision, D.P.S. and P.T.; project administration, D.P.R., D.P.S. and P.T. All authors have read and agreed to the published version of the manuscript.

Funding

This research received no external funding.

Institutional Review Board Statement

Not applicable.

Informed Consent Statement

Not applicable.

Data Availability Statement

Not applicable.

Conflicts of Interest

The authors declare no conflict of interest.

References

  1. Statista. Size of the Global Logistics Industry from 2018 to 2024. Available online: https://www.statista.com/statistics/943517/logistics-industry-global-cagr/ (accessed on 3 February 2022).
  2. de Oliveira, C.L.C.; Laurindo, F.J.B. A Framework of Web Analytics: Deploying the Emergent Knowledge of Customers to Leverage Competitive Advantage. In Proceedings of the International Conference on e-Business, Seville, Spain, 18–21 July 2011; pp. 1–6. [Google Scholar]
  3. Kumar, V.; Ogunmola, G.A. Web Analytics for Knowledge Creation: A Systematic Review of Tools, Techniques, and Practices. Int. J. Cyber Behav. Psychol. Learn. 2020, 10, 14. [Google Scholar] [CrossRef]
  4. Sakas, D.P.; Reklitis, D.P. Predictive Model for Estimating the Impact of Technical Issues on Consumers Interaction in Agri-Logistics Websites. In Information and Communication Technologies for Agriculture―Theme IV: Actions; Bochtis, D., Pearson, S., Lampridi, M., Marinoudi, V., Pardalos, P., Eds.; Springer Optimization and Its Applications; Springer: Berlin/Heidelberg, Germany, 2022; ISBN 9783030841553. [Google Scholar]
  5. Nasiopoulos, D.Κ.; Sakas, D.P.; Trivellas, P. The Role of Digital Marketing in the Development of a Distribution and Logistics Network of Information Technology Companies. In Business Intelligence and Modelling; Springer International Publishing: Cham, Switzerland, 2021; pp. 267–276. ISBN 9783030570644. [Google Scholar]
  6. Drivas, I.C.; Sakas, D.P.; Giannakopoulos, G.A.; Kyriaki-Manessi, D. Big Data Analytics for Search Engine Optimization. Big Data Cogn. Comput. 2020, 4, 5. [Google Scholar] [CrossRef] [Green Version]
  7. Day, G.S. Closing the Marketing Capabilities Gap. J. Mark. 2011, 75, 183–195. [Google Scholar] [CrossRef]
  8. Chaffey, D.; Ellis-Chadwick, F. Digital Marketing: Strategy, Implementation & Practice; Pearson: London, UK, 2019; ISBN 9781292241623. [Google Scholar]
  9. Sakas, D.P.; Reklitis, D.P. The Impact of Organic Traffic of Crowdsourcing Platforms on Airlines’ Website Traffic and User Engagement. Sustainability 2021, 13, 8850. [Google Scholar] [CrossRef]
  10. TV Advertising vs. Digital Marketing—Infographic. Available online: https://www.digivate.com/blog/seo/tv-advertising-vs-digital-marketing-infographic/ (accessed on 20 February 2022).
  11. Bhargava, M. Up keeping with the new era of the digital world: Digital marketing & prospects. Indian Streams Res. J. 2015, 4, 7. [Google Scholar]
  12. McDonald, M. Marketing Plans: How to Prepare Them, How to Use Them; Wiley: Chichester, UK, 2011; ISBN 9780470669976. [Google Scholar]
  13. Levy, S.; Gvili, Y. How Credible Is E-Word of Mouth across Digital-Marketing Channels? The Roles of Social Capital, Information Richness, and Interactivity. J. Advert. Res. 2015, 55, 95–109. [Google Scholar] [CrossRef]
  14. Sakas, D.P.; Kamperos, I.D.G.; Reklitis, D.P.; Giannakopoulos, N.T.; Nasiopoulos, D.K.; Terzi, M.C.; Kanellos, N. The Effectiveness of Centralized Payment Network Advertisements on Digital Branding during the COVID-19 Crisis. Sustainability 2022, 14, 3616. [Google Scholar] [CrossRef]
  15. Zelenkauskaite, A.; Simões, B. Big Data through Cross-Platform Interest-Based Interactivity. In Proceedings of the 2014 International Conference on Big Data and Smart Computing (BIGCOMP), Bangkok, Thailand, 15–17 January 2014; pp. 191–196. [Google Scholar]
  16. Sakas, D.P.; Giannakopoulos, N.T.; Reklitis, D.P.; Dasaklis, T.K. The Effects of Cryptocurrency Trading Websites on Airlines’ Advertisement Campaigns. J. Theor. Appl. Electron. Commer. Res. 2021, 16, 3099–3119. [Google Scholar] [CrossRef]
  17. Wang, G.; Gunasekaran, A.; Ngai, E.W.T.; Papadopoulos, T. Big Data Analytics in Logistics and Supply Chain Management: Certain Investigations for Research and Applications. Int. J. Prod. Econ. 2016, 176, 98–110. [Google Scholar] [CrossRef]
  18. Erevelles, S.; Fukawa, N.; Swayne, L. Big Data Consumer Analytics and the Transformation of Marketing. J. Bus. Res. 2016, 69, 897–904. [Google Scholar] [CrossRef]
  19. Sejnowski, T.J.; Churchland, P.S.; Movshon, J.A. Putting Big Data to Good Use in Neuroscience. Nat. Neurosci. 2014, 17, 1440–1441. [Google Scholar] [CrossRef] [PubMed] [Green Version]
  20. Woo, S.E.; Tay, L.; Proctor, R.W. Big Data in Psychological Research. In American Psychological Association; American Psychological Association: Washington, DC, USA, 2020; ISBN 9781433831676. [Google Scholar]
  21. LaValle, S.; Lesser, E.; Shockley, R.; Hopkins, M.S.; Kruschwitz, N. Big Data, Analytics and the Path from Insights to Value. MIT Sloan Manag. Rev. 2011, 52, 21–32. [Google Scholar]
  22. Knox, B.M.W. Thucydides and The Peloponnesian War: Politics and Power. Nav. War Coll. Rev. 1973, 25, 3–15. [Google Scholar]
  23. Kubina, M.; Varmus, M.; Kubinova, I. Use of Big Data for Competitive Advantage of Company. Procedia Econ. Financ. 2015, 26, 561–565. [Google Scholar] [CrossRef] [Green Version]
  24. Bartosik-Purgat, M.; Ratajczak-Mrożek, M. Big Data Analysis as a Source of Companies’ Competitive Advantage: A Review. Entrep. Bus. Econ. Rev. 2018, 6, 197–215. [Google Scholar] [CrossRef] [Green Version]
  25. Gandomi, A.; Haider, M. Beyond the Hype: Big Data Concepts, Methods, and Analytics. Int. J. Inf. Manag. 2015, 35, 137–144. [Google Scholar] [CrossRef] [Green Version]
  26. Emmanuel, I.; Stanier, C. Defining Big Data. In Proceedings of the International Conference on Big Data and Advanced Wireless Technologies, Association for Computing Machinery, Blagoevgrad, Bulgaria, 10 November 2016; pp. 1–6. [Google Scholar]
  27. Khan, M.A.-U.-D.; Uddin, M.F.; Gupta, N. Seven V’s of Big Data Understanding Big Data to Extract Value. In Proceedings of the 2014 Zone 1 Conference of the American Society for Engineering Education, Bridgeport, CT, USA, 3–5 April 2014; pp. 1–5. [Google Scholar]
  28. Coforge.com. Understanding The 3 Vs of Big Data—Volume, Velocity and Variety? Available online: https://www.coforge.com/salesforce/blog/data-analytics/understanding-the-3-vs-of-big-data-volume-velocity-and-variety/ (accessed on 20 February 2022).
  29. Teradata What Are the 5 V’s of Big Data? Available online: https://www.teradata.com/Glossary/What-are-the-5-V-s-of-Big-Data (accessed on 20 February 2022).
  30. Ertemel, A.V. Consumer Insight as Competitive Advantage Using Big Data and Analytics. Int. J. Commer. Financ. 2015, 1, 45–51. [Google Scholar]
  31. Verma, J.P.; Agrawal, S.; Patel, B.; Patel, A. Big Data Analytics: Challenges and Applications for Text, Audio, Video, and Social Media Data. Int. J. Soft Comput. Artif. Intell. Appl. (IJSCAI) 2016, 5, 41–51. [Google Scholar] [CrossRef]
  32. Ghani, N.A.; Hamid, S.; Targio Hashem, I.A.; Ahmed, E. Social Media Big Data Analytics: A Survey. Comput. Human Behav. 2019, 101, 417–428. [Google Scholar] [CrossRef]
  33. Alam, A.; Ullah, I.; Lee, Y.-K. Video Big Data Analytics in the Cloud: A Reference Architecture, Survey, Opportunities, and Open Research Issues. IEEE Access 2020, 8, 152377–152422. [Google Scholar] [CrossRef]
  34. Tavana, M.; Shaabani, A.; Raeesi Vanani, I.; Kumar Gangadhari, R. A Review of Digital Transformation on Supply Chain Process Management Using Text Mining. Processes 2022, 10, 842. [Google Scholar] [CrossRef]
  35. Govindan, K.; Cheng, T.C.E.; Mishra, N.; Shukla, N. Big data analytics and application for logistics and supply chain management. Transp. Res. Part E Logist. Trans. Rev. 2018, 114, 343–349. [Google Scholar] [CrossRef]
  36. Sodero, A.; Henry, J.Y.; Barratt, M. The social process of Big Data and predictive analytics use for logistics and supply chain management. Int. J. Phys. Distrib. Logist. Manag. 2019, 49, 706–726. [Google Scholar] [CrossRef]
  37. Jeble, S.; Kumari, S.; Patil, Y. Role of Big Data and Predictive Analytics. Int. J. Autom. Logist. 2016, 2, 307–331. [Google Scholar] [CrossRef]
  38. Dubey, R.; Gunasekaran, A.; Childe, S.J.; Papadopoulos, T.; Luo, Z.; Wamba, S.F.; Roubaud, D. Can Big Data and Predictive Analytics Improve Social and Environmental Sustainability? Technol. Forecast. Soc. Chang. 2019, 144, 534–545. [Google Scholar] [CrossRef]
  39. Bradlow, E.T.; Gangwar, M.; Kopalle, P.; Voleti, S. The Role of Big Data and Predictive Analytics in Retailing. J. Retail. 2017, 93, 79–95. [Google Scholar] [CrossRef] [Green Version]
  40. Hazen, B.T.; Skipper, J.B.; Ezell, J.D.; Boone, C.A. Big Data and Predictive Analytics for Supply Chain Sustainability: A Theory-Driven Research Agenda. Comput. Ind. Eng. 2016, 101, 592–598. [Google Scholar] [CrossRef]
  41. Ayhan, S.; Pesce, J.; Comitz, P.; Sweet, D.; Bliesner, S.; Gerberick, G. Predictive Analytics with Aviation Big Data. In Proceedings of the 2013 Integrated Communications, Navigation and Surveillance Conference (ICNS), Herndon, VA, USA, 22–25 April 2013; pp. 1–13. [Google Scholar]
  42. Schoenherr, T.; Speier-Pero, C. Data Science, Predictive Analytics, and Big Data in Supply Chain Management: Current State and Future Potential. J. Bus. Logist. 2015, 36, 120–132. [Google Scholar] [CrossRef]
  43. Gunasekaran, A.; Papadopoulos, T.; Dubey, R.; Wamba, S.F.; Childe, S.J.; Hazen, B.; Akter, S. Big Data and Predictive Analytics for Supply Chain and Organizational Performance. J. Bus. Res. 2017, 70, 308–317. [Google Scholar] [CrossRef]
  44. Waller, M.A.; Fawcett, S.E. Data Science, Predictive Analytics, and Big Data: A Revolution That Will Transform Supply Chain Design and Management. J. Bus. Logist. 2013, 34, 77–84. [Google Scholar] [CrossRef]
  45. Alazab, A.; Bevinakoppa, S.; Khraisat, A. Maximising Competitive Advantage on E-Business Websites: A Data Mining Approach. In Proceedings of the 2018 IEEE Conference on Big Data and Analytics (ICBDA), Langkawi, Malaysia, 21–22 November 2018; pp. 111–116. [Google Scholar]
  46. Christov, A.; Hausmann, V.; Williams, S. Measuring Brand Awareness, Campaign Evaluation and Web Analytics. Digit. Soc. Media 2020, 296, 21. [Google Scholar]
  47. Peterson, E.T. Web Analytics Demystified: A Marketer’s Guide to Understanding How Your Web Site Affects Your Business; Celilo Group Media: Portland, OR, USA, 2004; ISBN 9780974358420. [Google Scholar]
  48. Järvinen, J.; Karjaluoto, H. The Use of Web Analytics for Digital Marketing Performance Measurement. Ind. Mark. Manag. 2015, 50, 117–127. [Google Scholar] [CrossRef] [Green Version]
  49. Statista. The World’s Leading Third-Party Logistics Providers in 2020, Based on Gross Logistics Revenue (in Million U.S. Dollars) *. Available online: https://www.statista.com/statistics/250879/leading-third-party-logistics-providers-worldwide-based-on-revenue/ (accessed on 3 February 2022).
  50. Saura, J.R.; Palos-Sánchez, P.; Cerdá Suárez, L.M. Understanding the Digital Marketing Environment with KPIs and Web Analytics. Future Internet 2017, 9, 76. [Google Scholar] [CrossRef] [Green Version]
  51. Kirsh, I.; Joy, M. Splitting the Web Analytics Atom: From Page Metrics and KPIs to Sub-Page Metrics and KPIs. In Proceedings of the 10th International Conference on Web Intelligence, Mining and Semantics; Association for Computing Machinery: New York, NY, USA, 2020; pp. 33–43. [Google Scholar]
  52. Warren, J. Key Performance Indicators (KPI)–Definition and Action; ATI: London, UK, 2011. [Google Scholar]
  53. Baye, M.R.; De los Santos, B.; Wildenbeest, M.R. Search Engine Optimization: What Drives Organic Traffic to Retail Sites? J. Econ. Manag. Strategy 2016, 25, 6–31. [Google Scholar] [CrossRef] [Green Version]
  54. Chen, D.; Jin, J.; Zhang, W.; Pan, F.; Niu, L.; Yu, C.; Wang, J.; Li, H.; Xu, J.; Gai, K. Learning to Advertise for Organic Traffic Maximization in E-Commerce Product Feeds. In Proceedings of the 28th ACM International Conference on Information and Knowledge Management, Biarritz, France, 30 June 2020; pp. 2527–2535. [Google Scholar]
  55. GTmetrix New Performance Timings Available/Default to Fully Loaded Time. Available online: https://gtmetrix.com/blog/new-performance-timings-available-default-to-fully-loaded-time/ (accessed on 21 February 2022).
  56. Manhas, J. Comparative Study of Website Page Size as Design Issue in Various Websites. Int. J. Inf. Eng. Electron. Bus. 2014, 6, 33–39. [Google Scholar] [CrossRef] [Green Version]
  57. Libert, T. Exposing the Hidden Web: An Analysis of Third-Party HTTP Requests on 1 Million Websites. arXiv 2015, arXiv:1511.00619. [Google Scholar]
  58. Vyas, C. Evaluating State Tourism Websites Using Search Engine Optimization Tools. Tourism Manag. 2019, 73, 64–70. [Google Scholar] [CrossRef]
  59. Sculley, D.; Malkin, R.G.; Basu, S.; Bayardo, R.J. Predicting Bounce Rates in Sponsored Search Advertisements. In Proceedings of the 15th ACM SIGKDD International Conference on Knowledge Discovery and data Mining, Paris, France, 28 June 2009; pp. 1325–1334. [Google Scholar]
  60. Semrush. Traffic Analytics Overview Report Manual. Available online: https://www.semrush.com/kb/895-traffic-analytics-overview-report (accessed on 23 February 2022).
  61. Plaza, B. Google Analytics for Measuring Website Performance. Tourism Manag. 2011, 32, 477–481. [Google Scholar] [CrossRef]
  62. Wolk, A.; Theysohn, S. Factors Influencing Website Traffic in the Paid Content Market. J. Mark. Manag. 2007, 23, 769–796. [Google Scholar] [CrossRef]
  63. Blake, T.; Nosko, C.; Tadelis, S. Consumer Heterogeneity and Paid Search Effectiveness: A Large-Scale Field Experiment. Econometrica 2015, 83, 155–174. [Google Scholar] [CrossRef]
  64. Wanichayapong, N.; Pruthipunyaskul, W.; Pattara-Atikom, W.; Chaovalit, P. Social-Based Traffic Information Extraction and Classification. In Proceedings of the 2011 11th International Conference on ITS Telecommunications, St. Petersburg, Russia, 23–25 August 2011; pp. 107–112. [Google Scholar]
  65. Parmenter, D. Key Performance Indicators: Developing, Implementing, and Using Winning KPIs; John Wiley & Sons: Hoboken, NJ, USA, 2015; ISBN 9781119620778. [Google Scholar]
  66. Chessell, M.; Scheepers, F.; Nguyen, N.; van Kessel, R.; van der Starre, R. Governing and Managing Big Data for Analytics and Decision Makers. IBM Redguides Bus. Lead. 2014, 1, 28. [Google Scholar]
  67. Nakatani, K.; Chuang, T. A Web Analytics Tool Selection Method: An Analytical Hierarchy Process Approach. Internet Res. 2011, 21, 171–186. [Google Scholar] [CrossRef]
  68. Gour, A.; Aggarwal, S.; Erdem, M. Reading between the Lines: Analyzing Online Reviews by Using a Multi-Method Web-Analytics Approach. Int. J. Contemp. Hosp. Manag. 2021, 33, 490–512. [Google Scholar] [CrossRef]
  69. Lamberz, J.; Litfin, T.; Meeh-Bunse, G.; Teckert, Ö. User-Friendly Website Design: A Combined Eye-Tracking Study. In Proceedings of the ENTRENOVA—ENTerprise REsearch InNOVAtion, Dubrovnik, Croatia, 7–9 September 2017; IRENET—Society for Advancing Innovation and Research in Economy: Zagreb, Croatia, 2017; Volume 3, pp. 308–315. [Google Scholar]
  70. Nasiopoulos, D.Κ.; Sakas, D.P.; Reklitis, P. The Interaction of Users’ Behavior to the Development of a Distribution and Logistics Network of the Information Technology Companies. In Business Intelligence and Modelling; Springer International Publishing: Cham, Switzerland, 2021; pp. 219–227. ISBN 9783030570644. [Google Scholar]
  71. Denga, E.M.; Vajjhala, N.R.; Rakshit, S. The Role of Digital Marketing in Achieving Sustainable Competitive Advantage. In Digital Transformation and Internationalization Strategies in Organizations; IGI Global: Hershey, PA, USA, 2022; pp. 44–60. [Google Scholar]
  72. Singla, M.L.; Apoorv, D. How Social Media Gives You Competitive Advantage. Indian J. Sci. Technol. 2015, 8, 90. [Google Scholar] [CrossRef]
  73. Rao, R.J.; Stewart, C.; Perez, A.; Renganathan, S.M. Assessing Learning Behavior and Cognitive Bias from Web Logs. In Proceedings of the 2018 IEEE Frontiers in Education Conference (FIE), San Jose, CA, USA, 3–6 October 2018; pp. 1–5. [Google Scholar]
  74. Pohl, M.; Winter, L.-C.; Pallaris, C.; Attfield, S.; Wong, B.L.W. Sensemaking and Cognitive Bias Mitigation in Visual Analytics. In Proceedings of the 2014 IEEE Joint Intelligence and Security Informatics Conference, The Hague, The Netherlands, 24–26 September 2014; p. 323. [Google Scholar]
  75. Giabbanelli, P.J.; Gray, S.A.; Aminpour, P. Combining Fuzzy Cognitive Maps with Agent-Based Modeling: Frameworks and Pitfalls of a Powerful Hybrid Modeling Approach to Understand Human-Environment Interactions. Environ. Model. Softw. 2017, 95, 320–325. [Google Scholar] [CrossRef]
  76. Statista. Logistics Companies Worldwide in 2020, Based on Logistics Revenue. Available online: https://www.statista.com/statistics/270168/logistics-companies-worldwide-by-revenue/ (accessed on 25 February 2022).
  77. Felix, G.; Nápoles, G.; Falcon, R.; Froelich, W.; Vanhoof, K.; Bello, R. A Review on Methods and Software for Fuzzy Cognitive Maps. Artif. Intell. Rev. 2019, 52, 1707–1737. [Google Scholar] [CrossRef]
  78. Behrooz, F.; Mariun, N.; Marhaban, M.H.; Mohd Radzi, M.A.; Ramli, A.R. Review of Control Techniques for HVAC Systems—Nonlinearity Approaches Based on Fuzzy Cognitive Maps. Energies 2018, 11, 495. [Google Scholar] [CrossRef] [Green Version]
  79. Sakas, D.P.; Giannakopoulos, N.T. Big Data Contribution in Desktop and Mobile Devices Comparison, Regarding Airlines’ Digital Brand Name Effect. Big Data Cogn. Comput. 2021, 5, 48. [Google Scholar] [CrossRef]
  80. Negahban, A.; Yilmaz, L. Agent-Based Simulation Applications in Marketing Research: An Integrated Review. J. Simul. 2014, 8, 129–142. [Google Scholar] [CrossRef]
  81. Rand, W.; Rust, R.T. Agent-Based Modeling in Marketing: Guidelines for Rigor. Int. J. Res. Mark. 2011, 28, 181–193. [Google Scholar] [CrossRef]
  82. Hubspot. 12 Statistics That Show How Page Load Time Impacts Conversion Rate. Available online: https://blog.hubspot.com/marketing/page-load-time-conversion-rates (accessed on 25 February 2022).
  83. Son, C.; Kim, J.; Kim, Y. Developing Scenario-Based Technology Roadmap in the Big Data Era: An Utilisation of Fuzzy Cognitive Map and Text Mining Techniques. Technol. Anal. Strateg. Manag. 2020, 32, 272–291. [Google Scholar] [CrossRef]
  84. Salmeron, J.L. Supporting Decision Makers with Fuzzy Cognitive Maps. Res.-Technol. Manag. 2009, 52, 53–59. [Google Scholar] [CrossRef]
  85. Yamagishi, K.; Ocampo, L.; Abellana, D.P.; Tanaid, R.A.; Tiu, A.M.; Medalla, M.E.; Selerio, E.; Go, C.; Olorvida, R.C.; Maupo, A.; et al. The Impact of Social Media Marketing Strategies on Promoting Sustainability of Tourism with Fuzzy Cognitive Mapping: A Case of Kalanggaman Island (Philippines). Environ. Dev. Sustain. 2021, 23, 14998–15030. [Google Scholar] [CrossRef]
  86. Tsadiras, A.K. Comparing the Inference Capabilities of Binary, Trivalent and Sigmoid Fuzzy Cognitive Maps. Inf. Sci. 2008, 178, 3880–3894. [Google Scholar] [CrossRef]
  87. Hamill, L.; Gilbert, G. Social Circles: A Simple Structure for Agent-Based Social Network Models. J. Artif. Soc. Soc. Simul. 2009, 12, 1–3. [Google Scholar]
  88. Hoertel, N.; Blachier, M.; Blanco, C.; Olfson, M.; Massetti, M.; Rico, M.S.; Limosin, F.; Leleu, H. Author Correction: A Stochastic Agent-Based Model of the SARS-CoV-2 Epidemic in France. Nat. Med. 2020, 26, 1801. [Google Scholar] [CrossRef]
  89. Ismail, A.R. The Influence of Perceived Social Media Marketing Activities on Brand Loyalty: The Mediation Effect of Brand and Value Consciousness. Asia Pac. J. Mark. Logist. 2017, 29, 129–144. [Google Scholar] [CrossRef]
  90. Rajiullah, M.; Mohideen, A.C.; Weinrank, F.; Secchi, R.; Fairhurst, G.; Brunstrom, A. Understanding Multistreaming for Web Traffic: An Experimental Study. In Proceedings of the 2017 IFIP Networking Conference (IFIP Networking) and Workshops, Stockholm, Sweden, 12–16 June 2017; pp. 1–6. [Google Scholar]
  91. Secchi, R.; Sathiaseelan, A.; Fairhurst, G. Evaluating Web Traffic Performance over DVB-RCS2. In Proceedings of the Personal Satellite Services, Bradford, UK, 22 March 2012; pp. 148–155. [Google Scholar]
  92. Orji, I.J.; Kusi-Sarpong, S.; Gupta, H. The Critical Success Factors of Using Social Media for Supply Chain Social Sustainability in the Freight Logistics Industry. Int. J. Prod. Res. 2020, 58, 1522–1539. [Google Scholar] [CrossRef]
  93. Denktaş-Şakar, G.; Sürücü, E. Stakeholder Engagement via Social Media: An Analysis of Third-Party Logistics Companies. Serv. Ind. J. 2020, 40, 866–889. [Google Scholar] [CrossRef]
  94. Wang, X.; Kochtanek, T.; Borwick, J.B. Comparing Image Users and Uses with Web Analytics. Proc. Am. Soc. Inf. Sci. Technol. 2010, 47, 1–2. [Google Scholar] [CrossRef]
  95. Trueger, N.S.; Bokarius, A.V.; Carroll, S.; April, M.D.; Thoma, B. Impact of a Physician-Led Social Media Sharing Program on a Medical Journal’s Web Traffic. J. Am. Coll. Radiol. 2018, 15, 184–189. [Google Scholar] [CrossRef] [PubMed] [Green Version]
  96. Erdoğmuş, İ.E.; Çiçek, M. The Impact of Social Media Marketing on Brand Loyalty. Procedia-Soc. Behav. Sci. 2012, 58, 1353–1360. [Google Scholar] [CrossRef] [Green Version]
  97. Serbetcioglu, C.; Göçer, A. Examining Social Media Branding Profiles of Logistics Service Providers. J. Bus. Ind. Mark. 2020, 35, 2023–2038. [Google Scholar] [CrossRef]
  98. Cheung, M.L.; Pires, G.; Rosenberger, P.J. The Influence of Perceived Social Media Marketing Elements on Consumer–brand Engagement and Brand Knowledge. Asia Pac. J. Mark. Logist. 2020, 39, 88. [Google Scholar] [CrossRef]
  99. Reklitis, P.; Trivellas, P.; Mantzaris, I.; Mantzari, E.; Reklitis, D. Employee Perceptions of Corporate Social Responsibility Activities and Work-Related Attitudes: The Case of a Greek Management Services Organization. In Sustainability and Social Responsibility: Regulation and Reporting; Gal, G., Akisik, O., Wooldridge, W., Eds.; Springer: Singapore, 2018; pp. 225–240. ISBN 9789811045028. [Google Scholar]
  100. Constantinescu, M.; Orindaru, A.; Pachitanu, A.; Rosca, L.; Caescu, S.-C.; Orzan, M.C. Attitude Evaluation on Using the Neuromarketing Approach in Social Media: Matching Company’s Purposes and Consumer’s Benefits for Sustainable Business Growth. Sustain. Sci. Pract. Policy 2019, 11, 7094. [Google Scholar] [CrossRef] [Green Version]
  101. Mills, K.A. What Are the Threats and Potentials of Big Data for Qualitative Research? Qual. Res. 2018, 18, 591–603. [Google Scholar] [CrossRef] [Green Version]
Figure 1. Fuzzy Cognitive Map illustration of the examined parameters.
Processes 10 00892 g001
Figure 2. Technical Factors Optimization Scenario.
Processes 10 00892 g002
Figure 3. Visibility Factor Optimization Scenario.
Processes 10 00892 g003
Figure 4. Brand Name Optimization Scenario.
Processes 10 00892 g004
Figure 5. Agent-Based simulation model.
Processes 10 00892 g005
Figure 6. (a) Simulation’s population allocation with 10,000 agents during 180 days. Day 12. (b) Population allocation of 10,000 agents during 180 days. Day 71.
Processes 10 00892 g006
Figure 7. The time chart depicts the history of the contribution of the following traffic factors: Social traffic and Paid Traffic during 180 days.
Processes 10 00892 g007
Figure 8. The time chart depicts the history of the contribution of the following visibility factors: Organic traffic and Total visitors during 180 days.
Processes 10 00892 g008
Figure 9. The time chart depicts the history of the contribution of the global rank during 180 days.
Processes 10 00892 g009
Table 1. Presentation of the extracted Web analytics KPIs.
Web Analytics KPIsDescription of the Web Analytics KPIs
Organic TrafficOrganic traffic refers to users that arrive at the corporate website through a non-paid way [9,53,54].
Fully Loaded TimeAccording to GTmetrix, Fully Loaded Time refers to the time in seconds that it takes for a website to fully load [55].
Total Page SizeThe sum of the totality of the components required to load a website is referred to as Total Page Size. This contains the HTML and CSS, as well as the pictures [56].
RequestsThe number of requests necessary to render a website is reduced as the number of elements on the page is reduced, resulting in quicker page loading [57].
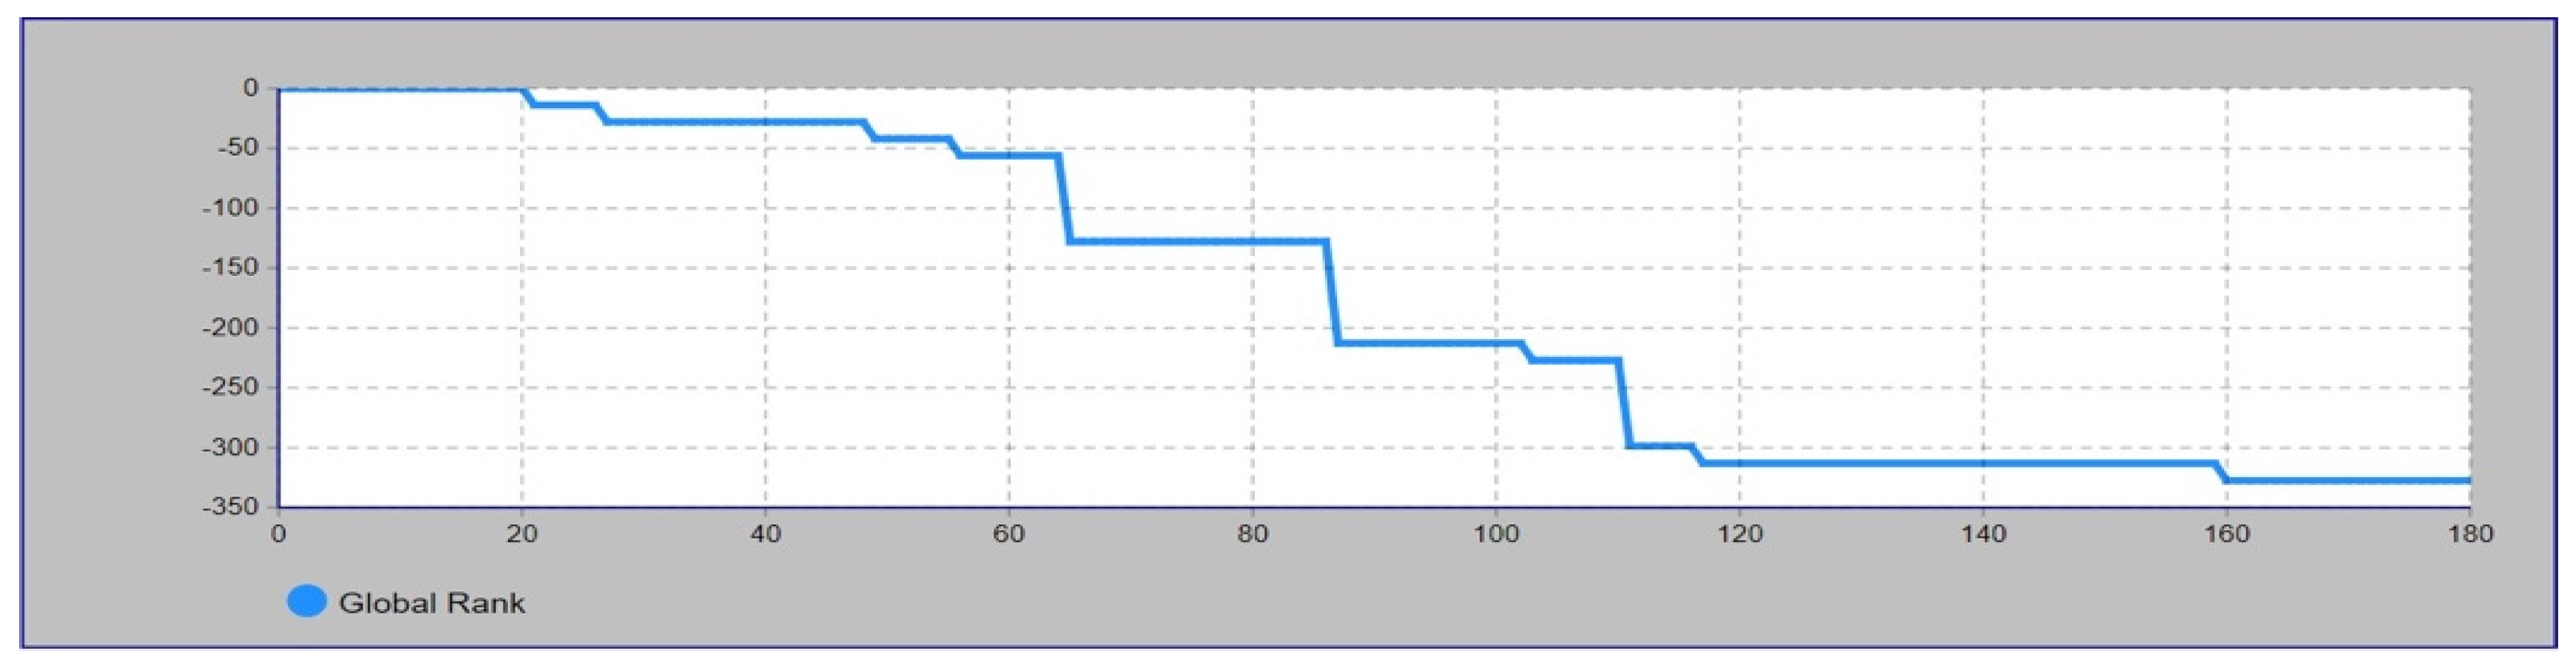
Global RankThis WA Key Performance Indicator is derived from the overall traffic on the platform, including organic, social, and paid traffic. The lower the worldwide rank, the more well-known the website, since a website in the 1st place has a better ranking in comparison to a website in the 15th place [14,58].
Bounce RateWhen a customer enters a website and immediately exits without seeing anything more, this is known as a bounce rate [59].
Average Time on SiteThis KPI measures how long a user remains on a corporate website [60].
Pages per VisitWhen users enter a corporate webpage, they view a number of pages; the KPI “Pages per Visits” calculates this number [61].
Paid TrafficPaid Traffic is generated solely through paid methods. For instance, when a user selects a Google ad and is redirected to the corporate website. [62,63].
Social TrafficWhen a user is redirected from Facebook, Instagram, or social media in general to the corporate website, it produces the KPI Social Traffic. [60,64]. This research is limited to Instagram and Facebook.
Total VisitorsThis KPI calculates the total number of users that enter a corporate website each day [60,65].
Table 2. Descriptive Statistics for 7 logistics webpages during 180 consequent days.
MeanMinMaxStd. Deviation
Webpages’ Organic Traffic31,199,621.473,123,349.0067,839,204.0019,997,235.96
Webpages’ Paid Traffic 445,757.3511,435.001,564,843.00502,902.50
Webpages’ Average Time on Site517.69412.00766.00103.45
Webpages’ Bounce Rate0.4680.3490.5920.079
Webpages’ Pages/Visit2.812.203.540.51
Webpages’ Total Visitors141,205,016.265,418,390.00375,118,623.00128,953,195.18
Webpages’ Global Rank11,944.908983.0014,445.001900.42
Webpages’ Total Page Size1.9470.8749.1981.0784
Webpages’ Requests90.802715224.983
Webpages’ Fully Loaded Time4.3731.4849.553.21452
Webpages’ Social Traffic1,410,459.4217,309.003,837,538.001,431,734.58
Table 3. Coefficients between the examined metrics for H1.
CorrelationsOrganic TrafficTotal Page SizeTotal Visitors
Organic Traffic1
Total Page Size0.0331
Total Visitors0.962 **0.0181
** Correlation is significant at the 0.01 level (1-tailed).
Table 4. First hypothesis’ Regression.
VariablesStandardized CoefficientR2Fp-Value
Constant (Organic Traffic)-0.9275357.912<0.001
Total Page Size0.015 0.087
Total Visitors0.962 ** 0.000
** Correlation is significant at the 0.01 level (1-tailed).
Table 5. Coefficients between the examined metrics for H2.
CorrelationsSocial TrafficFully Loaded TimeTotal Visitors
Social Traffic1
Fully Loaded Time−0.0291
Total Visitors0.931 **−0.0121
** Correlation is significant at the 0.01 level (1-tailed).
Table 6. Second hypothesis’ Regression.
VariablesStandardized CoefficientR2Fp-Value
Constant (Social Traffic)-0.8682749.0900.683
Fully Loaded Time−0.018 0.150
Total Visitors0.931 ** 0.000
** Correlation is significant at the 0.01 level (1-tailed).
Table 7. Coefficients between the examined metrics for H3.
CorrelationsPaid TrafficBounce RateRequests
Paid Traffic1
Bounce Rate0.675 **1
Requests−0.0130.0241
** Correlation is significant at the 0.01 level (1-tailed).
Table 8. Third hypothesis’ Regression.
VariablesStandardized CoefficientR2Fp-Value
Constant (Paid Traffic)-0.457351.929<0.001
Bounce Rate0.676 ** <0.001
Requests−0.029 0.249
** Correlation is significant at the 0.01 level (1-tailed).
Table 9. Coefficients between the examined metrics for H4.
CorrelationsPaid TrafficTotal VisitorsAverage Time on Site
Paid Traffic1
Total Visitors0.766 **1
Average Time on Site0.275 **−0.149 **1
** Correlation is significant at the 0.01 level (1-tailed).
Table 10. Fourth hypothesis’ Regression.
VariablesStandardized CoefficientR2Fp-Value
Constant (Paid Traffic)-0.7421204.316<0.001
Total Visitors0.826 ** <0.001
Average Time on Site0.398 ** <0.001
** Correlation is significant at the 0.01 level (1-tailed).
Table 11. Coefficients between the examined metrics for H5.
CorrelationsGlobal RankFully Loaded TimeTotal Page SizeRequests
Global Rank1
Fully Loaded Time0.088 *1
Total Page Size−0.268 **0.0591
Requests0.101 **−0.071 *0.158 *1
* Correlation is significant at the 0.05 level (2-tailed). ** Correlation is significant at the 0.01 level (1-tailed).
Table 12. Fifth hypothesis’ Regression.
VariablesStandardized CoefficientR2Fp-Value
Constant (Global Rank)-0.10733.291<0.001
Fully Loaded Time0.117 ** <0.001
Total Page Size−0.300 ** <0.001
Requests0.157 ** <0.001
** Correlation is significant at the 0.01 level (1-tailed).
Publisher’s Note: MDPI stays neutral with regard to jurisdictional claims in published maps and institutional affiliations.

