Abstract
Sugarcane molasses is an agricultural by-product containing sucrose. In this study, the exopolysaccharide (M-EPS) produced by Leuconostoc citreum B-2 in molasses-based medium was characterized, optimized, and its application in set yogurt was investigated. The structure analysis, including gel permeation chromatography, Fourier transform infrared spectroscopy, and nuclear magnetic resonance, revealed that the M-EPS was a linear dextran composed of D-glucose units, which were linked by α-(1→6) glycosidic bonds with 19.3% α-(1→3) branches. The M-EPS showed a lower molecular weight than that produced from sucrose. The M-EPS was added into the set yogurt, and then the water holding capacity, pH, and microstructure of set yogurt were evaluated. Compared with the controls, the addition of M-EPS improved the water holding capacity and reduced the pH of set yogurt. Meanwhile, the structure of the three-dimensional network was also observed in the set yogurt containing M-EPS, indicating that M-EPS had a positive effect on the stability of set yogurt. The results provide a theoretical basis for the cost-effective utilization of sugarcane molasses.
1. Introduction
Exopolysaccharides (EPS) are produced by bacteria in the process of growth and metabolism regulation to adapt to the culture environment [1]. In recent decades, exopolysaccharides produced by lactic acid bacteria have been intensively researched and developed due to their particular advantages in product structure, performance, and production [2]. Exopolysaccharides are mainly divided into two categories: homopolysaccharides, which are formed by the polymerization of one kind of monosaccharide, and heteropolysaccharides, which are composed of two or more types of monosaccharides [3]. According to the composition of monosaccharides and types of glycosidic bonds, homopolysaccharides can be further divided into α-D-glucans, β-D-glucans, fructans, and poly-galactans [4]. Among them, the EPS synthesized by LAB is dominated by α-D-glucans with a linear backbone [5], especially in the Leuconostoc and Weissella species [6]. Dextran is a long-chain polymer polymerized from D-glucose units catalyzed by dextransucrase, usually with at least 50% α-1, 6-glycosidic bonds as the main chain, or with different percentages of α-1,3, α-1,2, or α-1,4 branched chains [7,8,9,10]. In 1861, Louis Pasteur, the father of microbiology, isolated this microbial product in wine for the first time, and Scheibler named it dextran in 1869 according to the characteristics of this product [7]. Dextran is regarded as one of the most promising microbial exopolysaccharides due to its excellent properties and various physiological functions [11,12,13,14]. Until now, dextran has been used in various industrial applications, especially in food, medicine, and toiletries [15]. For example, dextran with relatively low molecular weights (70, 60, and 40 kDa) was used as a plasma volume expander [16,17], and dextran has also been used as a carrier for drug delivery [18]. Moreover, its capacity to bind water and hold moisture enables dextran to be used as a stabilizer or adjunct in fermented yogurt and cheese [19].
Molasses is a by-product of the sugar cane crushing process. It is high in sugar and rich in proteins, trace elements, and inorganic salts, which are conducive to microbial fermentation [20]. About 4.8 million tons/year of sugarcane molasses are available in China, with a keen price below $150/ton [21]. So far, molasses has been utilized to produce ethanol, gum, levan, 5-hydroxymethylfurfural, and lactic acid [22]. Classical medium components used for EPS production resulted in a high fermentation cost, which has become a major constraint for the industrial production of EPS [23]. Although the yield of dextran has been improved due to the optimization of culture conditions [24,25,26], relatively few studies have been conducted to reduce the cost of dextran production using an inexpensive substrate. Therefore, it is of great significance to find economical and efficient substrates for the industrial production of dextran.
The texture of set yogurt determines whether it is accepted by consumers. Dehydration shrinkage is the main problem with set yogurt. Many methods have been used to inhibit dehydration shrinkage, such as increasing the solid content in milk or using food additives [27]. However, the use of food additives is contrary to the current consumer desire for natural and safe foods. EPS produced by LAB can affect the texture of yogurt, improve sensory properties, and also act as prebiotics to improve the intestinal flora [28]. Current information on the use of EPS in set yogurt is mainly in the form of additives or fermentation with EPS-producing LAB [29]. Strain B-2 is a gram-positive bacterium isolated from pineapple fermentation broth and identified as Leuconostoc citreum by the morphological observation of colonies, physiological and biochemical experiments, and 16s rDNA sequence alignment, and is high in EPS production [30]. To our knowledge, EPS from Leuconostoc citreum has not been studied for use as a food additive. Therefore, with the goal of the efficient and low-cost production of LAB EPS, this present work investigated the feasibility of sugarcane molasses as a carbon source for M-EPS (EPS produced in molasses medium) production by the fermentation of Leuconostoc citreum B-2; optimized the composition of the molasses medium and culture conditions for M-EPS production using the RSM method; and characterized the structure of M-EPS produced by fermentation with molasses as a carbon source using GPC, FT-IR, and NMR. On the basis of these studies, the M-EPS was initially applied to the processing of set yogurt. The results not only provide a theoretical basis for the value-added utilization of sugarcane molasses and the production and application of LAB EPS, but also the use of M-EPS with food additive properties for yogurt processing to improve its texture, which will reflect the foresight of the dairy industry.
2. Materials and Methods
2.1. Materials
2.1.1. Chemicals and Reagents
Sugarcane molasses for fermentation were purchased from Tianjin Lifa Long Chemical Technology Co., Ltd. (Cangzhou, China) with 47.7% (w/w) sucrose, 1.05% fructose, and 10.35% glucose, and was stored at 4 °C. Commercial yogurt starter (YO-PROX 973, French) was purchased for yogurt production. Whole fat pasteurized milk was purchased from Mengniu (Hong Kong, China). MRS medium preparation reagents, trichloroacetic acid, 95% ethanol, trifluoroacetic acid, KBr, NaNO3, NaOH, acetonitrile, anhydrous methanol, HCl, and ultrapure water were purchased from Jiangtian Chemical. Sephadex G-100 was purchased from Yuanye Biotechnology (Shanghai, China). D2O (99.96%) was purchased from Tengloweibo. Twelve monosaccharide standards (≥99%) and dextran standards (Ultrapure) were purchased from Sigma (Burlington, MA, USA). PMP was purchased from Aladdin (Seattle, WA, USA).
2.1.2. Bacterium and Culture Conditions
Leu. citreum B-2 was originally isolated from homemade pineapple fermentation broth [30] and preserved in 30% (v/v) glycerol at −20 °C. MRS liquid culture medium was used to enrich and culture the strain B-2. For strain activation, B-2 preserved in glycerol tubes was inoculated into MRS liquid medium at a ratio of 2% and incubated at 30 °C for 24 h. Then, plate scribing was performed to obtain the single colonies. For primary seed activation, a single colony was picked and inoculated into MRS liquid medium under an aseptic environment and incubated at 30 °C for 12 h. For secondary seed activation, 200 µL of primary seed activation solution was inoculated into 10 mL of MRS liquid medium and incubated at 30 °C for 6 h. It was used as the seed solution. The seed solution was inoculated into the molasses medium at a ratio of 2% (v/v) for the production of M-EPS. The initial molasses medium was prepared by using molasses instead of sucrose and glucose in the traditional MRS-S medium, while other components remained the same.
2.2. Methods for Determination of the Biomass and Crude M-EPS Yield
After being cultured in molasses medium at 30 °C at 100 rpm for 30 h, 1.0 mL of fermentation broth was added to 4 mL of distilled water, mixed thoroughly, and then the OD600nm was determined [31]. Meanwhile, the remaining fermentation culture was used to determine the polysaccharide yield through the pre-cooled ethanol precipitation method [26,32], which is as follows: (i) bacterial cells were removed by centrifugation at 12,000 rpm for 20 min at 4 °C; (ii) the three times volume of pre-cooled ethanol (95%) was added to the supernatant to precipitate the polysaccharide overnight at 4 °C; (iii) the polysaccharide precipitate was collected and redissolved in pure water; (iv) an equal amount of 10% (v/v) trichloroacetic acid was added, incubated for 10 h at 4 °C, and then removed the proteins by centrifugation (12,000 rpm, 20 min); and (v) steps (ii) and (iii) were repeated once. Finally, crude M-EPS was obtained by freeze-drying. The yield of crude M-EPS was weighed with an electronic analytical balance.
2.3. Purification of Crude M-EPS and UV-Vis Spectroscopy Analysis
The crude M-EPS was packed into a dialysis bag (Mw cut-off, 14,000 Da) and stirred continuously at 4 °C for 72 h, aiming to remove the unnecessary impurities. The intercepted polysaccharide was fractionated on a 1.6 cm × 50 cm Sephadex G-100 column by gel-filtration chromatography (eluted with ultrapure water at a flow rate of 0.2 mL/min and detection wavelength of 220 nm) [33]. Ultimately, the purified M-EPS was obtained and freeze-dried to determine its purity and structure.
The purity of M-EPS was identified by UV-vis spectroscopy, and the absorption peak of nucleic acid or protein was observed in the scanning spectrum in order to prevent the interference of a subsequent structure determination caused by incomplete purification [34,35]. Five mg of purified M-EPS was prepared as a 1 mg/mL solution with ultrapure water and scanned between 190–350 nm by UV-3300 (Mapada, Shanghai, China) [36].
2.4. Structural Analysis of M-EPS
2.4.1. Determination of Monosaccharide Composition
The monosaccharide composition of purified M-EPS was identified by high performance liquid chromatography-PMP derivatization (U3000, Thermo Fisher, Waltham, MA, USA) with an Xtimate C18 column (4.6 m × 200 mm, 5 μm). The specific method was referenced [31,37] and slightly modified. The purified M-EPS (22.75 mg) was hydrolyzed with 5 mL of 2 mol/L trifluoroacetic acid at 110 °C for 8 h. The hydrolysis product without TFA residue was redissolved with 5.0 mL of ultrapure water. After that, 250 μL of NaOH (0.6 mol/L) and 500 μL of PMP methanol (0.4 mol/L) were added to 250 μL of M-EPS hydrolysate for derivatization at 70 °C for 1 h. Then, the sample was cooled for 10 min; 500 μL of HCl (0.3 mol/L) was added; and 1 mL of chloroform was added, vortexed for 1 min, and then centrifuged (3000 r/min, 10 min). This extraction step was repeated three times. Finally, the supernatant was kept for monosaccharide determination. A mixed control solution (1 mL) containing 50 μg each of glucose, mannose, ribose, xylose, and other monosaccharides (a total of 13) was treated with the same method.
2.4.2. Determination of Molecular Weight
The Mw of purified M-EPS was determined by the Tetra Detector Array GPC system (Viscotek TDA305-GPCmax, Malvern Instruments Ltd., Malvern, WR UK) [38]. The same concentration of M-EPS and T-series of dextran standard solutions (5 mg/mL) were prepared and filtered through a 0.22 μm filter membrane prior to detection. Finally, the Mw was estimated by establishing a standard curve based on the data of T-series dextran standards (Mw 1480, 3870, 8160, 16,100 and 21,160 Da).
2.4.3. FT-IR Spectrum
FT-IR can be used to analyze and identify the glycosidic bond structure and characteristic functional groups of M-EPS. The lyophilized M-EPS and KBr were dried in a vacuum oven for 2 h. Subsequently, the two were mixed and ground well at a ratio of about 1:100. Then, the mixture was pressed into a 0.1 mm thick tablet and subjected to FT-IR spectral detection (Nicolet 460, Thermo Nicolet, Waltham, MA, USA) with the detector resolution set to 1 cm−1 and the wavenumber range of 4000–400 cm−1.
2.4.4. NMR Spectroscopy
NMR analysis was performed through a 400 MHz liquid nuclear magnetic spectrometer (AVANCE III, Bruker, Fällanden, AG, Switzerland) to further characterize the linkage composition of the polysaccharide [39]. Fifty mg of the purified M-EPS was repeatedly frozen and thawed in 0.55 mL D2O three times, and then stored in a nuclear magnetic tube for the determination of one-dimensional NMR (1H-NMR, 13C-NMR) and two-dimensional NMR (1H-1H COSY, 1H-13C HSQC). Mestrenova software (version 12.0.0, Mestrelab Research, Santiago de Compostela, GZ, Spain) was used to analyze the data.
2.4.5. Scanning Electron Microscope (SEM)
The microscopic morphology and other physical characteristics of the purified M-EPS surface were observed through SEM. The lyophilized M-EPS (10 mg) was fixed on the sample stage with a double-sided adhesive, plated with a thin gold film of about 10 nm thickness, and subjected to observe the microstructure using a scanning electron microscope (Zeiss Merlin Compact, Oberkochen, BWD, Germany) under the accelerating voltage of 10 kV.
2.5. Statistical Optimization of M-EPS Production
2.5.1. Plackett–Burman Design (PB)
In order to improve the yield of M-EPS, the medium compositions and culture conditions were optimized by response surface methodology (RSM) [24,40]. Initially, the media compositions and culture conditions were optimized separately using single-factor experiments and then eight factors (molasses, tryptone, yeast extract, beef extract, sodium acetate anhydrous, ammonium citrate, K2HPO4, pH) were chosen as eight variables (X1, X2, X3, X4, X5, X6, X7, X8) in the PB design (Table 1). Each factor was tested at three separate levels, with high levels indicated by (+1), medium levels indicated by (0), and low levels indicated by (−1), respectively. The actual coding levels are shown in Table S1. The results were analyzed by fitting the first-order polynomial model:
where Y represents the response value; β0 represents the model intercept; β1, β2, β3, β4, β5, β6, β7, and β8 are assigned to the linear coefficients; and X1, X2, X3, X4, X5, X6, X7, and X8 are the coded values of the variables.

Table 1.
Experimental design and results of the Plackett-Burman design.
2.5.2. Steepest Ascent Experiment
After the significant factors affecting the target value were obtained by the PB experiment, it was necessary to determine the optimal area for these factors through the steepest climbing design [41,42]. According to the positive and negative effects of the significant factors and their influence values, a reasonable step size was designed to approach the best region and narrow the range of optimization [40]. The experimental scheme is shown in Table 2.
Table 2.
Experimental design and results of the steepest ascent.
2.5.3. Central Composite Design (CCD)
Based on the central point determined by the PB and steepest climbing experiment, a 20-run central composite design with 3 factors and 5 levels (Table 3 and Table S2) was used to investigate the effect of the interaction of the significant factors on M-EPS yield. The experimental data were fitted by a second-order polynomial equation:
where Y is the predicted M-EPS yield; β0 is the model constant; βi, βii, and βij are the linear coefficient, quadratic term coefficient, and interaction relationship coefficient, respectively; and xi, xii2, and xixj are independent variables.
Table 3.
Experimental design and results of central composite designs.
2.5.4. Validation Test and Determination of Optimal Sugar Production Time
In order to verify the accuracy of the model, strain B-2 was cultured for 30 h according to the predicted optimal conditions for M-EPS production [43]. Six repeated experiments were carried out to determine the exopolysaccharide yield (g/L) and the results were compared with the predicted value. Under the optimized conditions, the M-EPS yield was measured every 12 h to determine the optimal fermentation time.
2.6. Manufacture of Set Yogurt
Whole fat pasteurized milk used for the production of set yogurt was purchased from a local supermarket. The manufacture of set yogurt was referenced in Pan et al. [44] and Ale et al. [45]. At first, the milk was preheated to 70 °C in a water bath, followed by the addition of 7% white granulated sugar. The milk mixture was heated at 95 °C for 5 min and divided into three portions. Then, the crude M-EPS was added to the milk mixture and mixed thoroughly, where the final concentration of M-EPS was 0% (control), 0.1%, and 0.5%, respectively. When the milk cooled to 43 °C, a moderate dose (40 mg/L) of set yogurt starter (YO-PROX 973) was added. Then, the mixture was sub packed into 100 mL yogurt bottles and fermented at 43 °C for 4–5 h until the pH value reached 4.5. At this time, all set yogurt samples stopped fermenting and were stored at 4 °C for 24 h for further analysis of WHC, pH, and SEM.
2.7. Characterization of M-EPS-Added Set Yogurt
2.7.1. Measurement of Water Holding Capacity (WHC) and pH
The WHC of set yogurt was determined according to the centrifugation method adopted by Fu et al. [46], and some modifications were made. Ten g of set yogurt with 0%, 0.1%, and 0.5% M-EPS were weighed and centrifuged at 3000 g for 30 min at 4 °C, respectively. Then, the supernatant was removed, and the precipitate was weighed. The WHC of set yogurt samples containing different concentrations of M-EPS were calculated and expressed as follows:
The pH of set yogurt not only affects the taste and flavor, but also affects the gelatinous nature of set yogurt [28,47]. Therefore, it is important to stop fermentation in time when the right pH is reached for set yogurt quality control. The pH of set yogurt samples containing 0%, 0.1%, and 0.5% M-EPS were measured using a microprocessor pH meter (pH 213, HANNA, Villafranca, PD, Italy).
2.7.2. Microstructure of Yogurt
The microstructure of the set yogurt samples was observed by scanning electron microscopy (SEM) [48]. First, 1 g of each set yogurt sample was uniformly distributed in 6 g of pure water, frozen at −80 °C, and subsequently vacuum freeze-dried. A small amount of the dried sample was fixed on the sample stage with conductive adhesive for gold spraying. The microscopic morphology of the yogurt was observed by Field Emission Scanning Electron Microscopy (Regulus 8100, Hitachi, Chiyoda-ku, TKY, Japan) at the accelerating voltage of 3 kV.
2.8. Statistical Analysis
The tests were conducted according to the design concept and all data were presented as the mean ± the standard error of the mean. SPSS software (version 23.0, IBM, Armonk, NY, USA) was used for statistical analysis. The statistical significance was determined by analysis of variance (ANOVA), with p < 0.05 and p < 0.01 being considered significant and extremely significant differences, respectively.
3. Results and Discussion
3.1. Production and Purification of the M-EPS
After incubating the strain B-2 in the molasses-based medium at 30 °C for 30 h, the M-EPS was successfully extracted through the pre-cooled ethanol precipitation method, which proved that molasses could be used as a carbon source for EPS fermentation. Next, the crude M-EPS was purified by protein removal, dialysis, and a Sephadex G-100 gel column to obtain the purified M-EPS. The elution curve showed a single symmetric peak by passing under the filter at 490 nm (Figure 1a), which indicated that the M-EPS component had a high purity and good homogeneity. The UV-vis spectra of the purified M-EPS displayed no absorption peaks at 260 or 280 nm (Figure 1b), indicating the absence of nucleic acids and proteins [34], so their influences on the subsequent structural determination of the polysaccharide sample could be excluded.
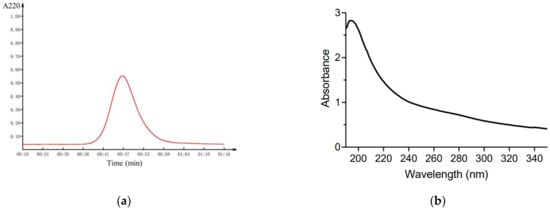
Figure 1.
Purity of purified M-EPS. (a) Elution profile on Sephadex G-100 column; (b) UV spectrum over the range 190–350 nm.
3.2. Structural Analysis of M-EPS
3.2.1. Monosaccharide Composition of M-EPS
After acid hydrolysis and derivatization of the purified M-EPS, its monosaccharide composition was determined (Figure 2a). By comparing the chromatographic result of the M-EPS sample with the retention times of different monosaccharide standards, it was found that the repeating units of this M-EPS were glucose. This finding suggested that strain B-2 produced a homopolysaccharide in molasses medium with glucose as the component units. This result was similar to previous observations reporting the EPS structure of Leuconostoc pseudomesenteroides [49], where glucose was reported as the major repeating monomer in the polysaccharide chain.
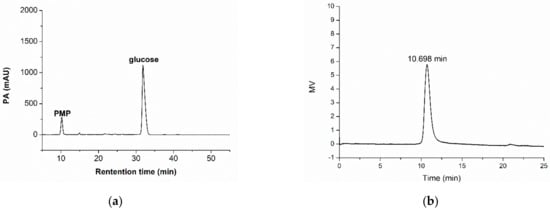
Figure 2.
Monosaccharide composition (a) and molecular weight (b) of the purified M-EPS.
3.2.2. Molecular Weight
The GPC elution diagram showed a single and symmetrical elution peak (Figure 2b), which also indicated that the purified M-EPS was a homogeneous polysaccharide. According to the retention time of the sample (10.698 min) and the calibration curve of dextran standards, the relative Mw of M-EPS was deduced as 4.1 × 10⁵ Da, which was lower than that of EPS derived from MRS-S medium [30]. In general, the Mw of EPS is affected by different microbial species and growth conditions [50], but the range of Mw of bacterial dextran is usually between 104 and 108 Da. For example, the Mw of EPS synthesized by Leu. mesenteroides TDS2-19 on sucrose (117.48 g/L) was 3.77 × 10⁶ Da [26]; produced by Leuconostoc mesenteroides strains in milk permeate was less than 10,000 Da [8]; and produced by Lactobacillus lactis MB2-1 on whey was 2.0 × 10⁵ Da [51]. It has been demonstrated that the Mw of dextran was lower in molasses-containing medium than in sucrose-containing medium. Also from molasses medium, the high molecular weight dextran produced by Leuconostoc mesenteroides also showed a decrease. This effect might have to do with the fact that the molasses already contains glucose and fructose, as well as other complex components in the molasses [52].
3.2.3. FT-IR Spectrum Analysis
Generally, FT-IR spectroscopy is used to determine the characteristic absorption peaks of polysaccharides to understand the structural information, such as the conformation of glycosidic linkages, functional groups on the sugar chains, etc. The large intensity broad absorption peak at 3413.9 cm−1 in the figure (Figure 3) was the absorption peak of the telescopic vibration of the hydroxyl group [53]. The absorption peaks at 2926.9 and 1416 cm−1 were generated by the stretching vibration of C-H [54]. The peak at 1638.2 cm−1 was the signal of bound water. The band at 1153.2 cm−1 was the result of the stretching vibration of the C-O-C, indicating the presence of pyranoside in the sample [36]. The peak at 1018.2 cm−1 revealed the presence of the α-(1→6) glycosidic bonds [55]. The signals located at 847.6 and 920.8 cm−1 were characteristic of the existence of α-(1→3)-D-glucan and α-pyranose [30]. In addition, the weak peak at 764.6 cm−1 provided evidence for the presence of glycosidic bonds [56]. Moreover, the absence of any peak at 812 or 890 cm−1 indicated the absence of the β-configuration in M-EPS. Thus, the FT-IR mapping analysis revealed little change in the structure of M-EPS from that of EPS produced with sucrose as a substrate, both being α-configuration pyranose linked by α-(1→6) and α-(1→3) glucosides, which will be further verified by NMR analysis.
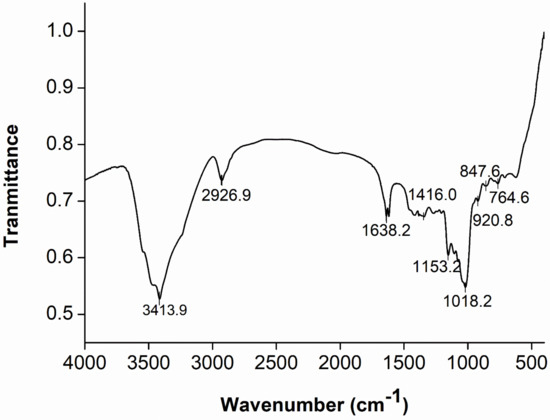
Figure 3.
FT-IR analysis of the purified M-EPS over the range 400 to 4000 cm−1.
3.2.4. NMR Spectroscopy Analysis
NMR spectroscopy, a spectroscopic method, is commonly used to study the molecular structure and physical properties of substances. In the 1H spectrum of B-2 M-EPS (Figure 4a), two regions could be clearly seen: the anomeric region (4.5–5.5 ppm) and the ring proton region (3.1–4.5 ppm) [57]. The signals in the anomeric region usually represent the types of glycosidic bond [49]. In the 1H spectrum, the intense anomeric signal at 4.91 ppm was a typical dextran α-(1→6) chain-extending signal, which was in good accordance with the FT-IR absorption signal at 1018.2 cm−1. In addition, a low intensity anomeric signal (5.25 ppm) was assigned to the signal of α-(1→3) linkages [30,58]. The relative intensities (%) of the two peaks were 80.7% (4.91 ppm) and 19.3% (5.25 ppm), respectively. In the ring proton region, the analysis was more difficult because there were many overlaps. However, it could be roughly judged that 3.51, 3.65, 3.36, and 3.84 ppm corresponded to the hydrogen signals to H-2 and H-5, respectively, and the hydrogen signals of H-6 were at 3.94 and 3.67 ppm [49]. Likewise, the 13C NMR spectrum (Figure 4b) of B-2 M-EPS included an anomeric carbon region (95–110 ppm) and ring carbon (50–85 ppm) region [59]. According to the chemical shifts of the substituents on the anomeric carbon, the configuration of the sugar ring was determined. The carbon signals of 97.73 and 99.33 ppm appeared in the 97–101 ppm region, which proved that the M-EPS was linked by α-glycosides [49]. Meanwhile, the absorption peaks of 73.42, 71.43, 70.21, 69.55, and 65.58 ppm corresponded to C3, C2, C5, C4, and C6, respectively [39]. In order to fully analyse the cross-signal peaks on 1D NMR, especially the attribution of carbon and hydrogen signals, 2D NMR was performed. From the COSY spectrum (Figure 4c), two cross peaks appeared at 4.91 ppm and 5.25 ppm as the characteristic signal peaks of H-1 and H-1′. In the HSQC spectrum (Figure 4d), the proton signals at 4.91 ppm and 5.25 ppm showed cross peaks with the C1 signals at 97.73 ppm and 99.33 ppm, respectively, thereby indicating that the M-EPS had two α-configuration sugar residues. Combined with Figure 4b, the presence of α-(1→6) and α-(1→3) glucose residues were further confirmed. Based on the literature data and Figure 4d, single bond relationships between the protons and corresponding carbons could also be observed: 4.91/97.73 (H1/C1), 5.25/99.33 (H1′/C1′), 3.51/71.43 (H2/C2), 3.65/73.42 (H3/C3), 3.36/69.55 (H4/C4), 3.85/70.21 (H5/C5), and 3.67, 3.94/65.58 (H6, H6′/C6). Comparing the NMR spectrum of M-EPS, we could conclude that the α-1,6- and α-1,3-linked residues present in M-EPS, and the structure of M-EPS as well, was speculated as Figure 4e. Different from what Feng et al. reported, the signal peak of α-(1→2) (5.14 ppm) was not found and the branching degree decreased and the proportion of α-(1→6) glycoside bonds in the main chain increased (from 75% to 80.7%), while the overall branching degree decreased [30]. This might be due to changes in the carbon sources and culture conditions. The structural characteristics of LAB dextran were greatly affected by the strains and culture conditions.
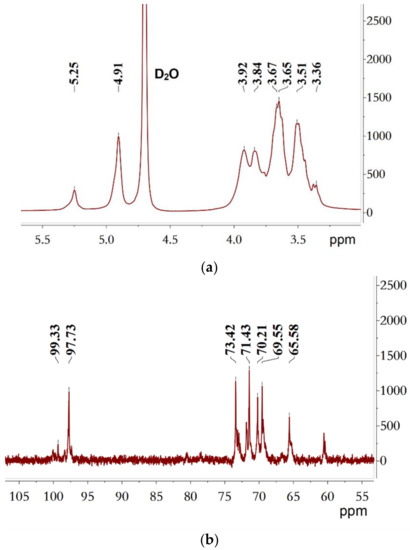
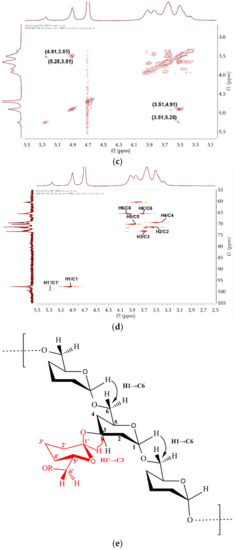
Figure 4.
NMR spectra of the purified M-EPS recorded on a Bruker AVANCE 400 MHz spectrometer in D2O (a) 1H-NMR; (b) 13C-NMR; (c) COSY; (d) HSQC and the schematic diagram of the structure of M-EPS (e).
3.2.5. SEM Analysis
The surface properties of M-EPS are studied by SEM, which is helpful to understand its physical capabilities. At low magnification (400×, Figure 5a), it appeared as a lamellar structure with pores and a smooth and glossy surface. The difference was that at higher magnification (1000× and 3000×, Figure 5b,c), serrations could be observed at the edge of the lamellar structure, suggesting that the M-EPS polymer might be hydrophilic [60]. Due to its potential water retention capacity, it could be used as thickeners and gelling agents in the food and cosmetics industries. The structure of B-2 M-EPS was roughly similar to the properties of the polymer reported in reference [30] and by Ye [55], but differed from the lamellar network permeated with pore structures seen in Weissella confusa R003 [61], and the hollow fibrous tubes of the Leu. lactis L2 EPS polymer [56]. The differences among these polysaccharide polymers might be owed to the sources of strains, monosaccharide compositions, and extraction methods [53].
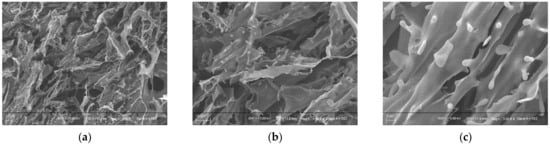
Figure 5.
Scanning electron micrographs of purified aggregated M-EPS polymer at three magnifications. (a) 400×, (b) 1000×, (c) 3000×.
3.3. Optimization of M-EPS Production
3.3.1. Plackett–Burman Design
The PB experiment with 15 test points, including 3 zero points and 12 factorial points, was conducted with M-EPS as the response value (Y). Based on the PB experiment results, the first-order simulation Equation (4), expressing the relationship between each variable and the M-EPS yield, was obtained:
A regression analysis was performed on the results of the PB design (Table 4). The p-values were used to determine whether the effects of the variables on M-EPS yield were significant. The values of the regression coefficients of the variables were used to assess their impact effects. Therefore, based on the p-values and regression coefficients of the variables, it was determined that molasses showed a significant positive effect. In contrast, beef powder and initial pH showed a significant negative impact. Other components of the medium that had a significant effect on M-EPS yield were not found. The significance of the fitting equation was checked by an F-test. The model was extremely significant (p = 0.0045 < 0.01) and the R2 was 0.9922 and the adjusted R2 was 0.9713, which indicated a good model fit.
Table 4.
ANOVA analysis for the Plackett–Burman factorial model of the yield of M-EPS.
3.3.2. Path of Steepest Ascent
The F-test and t-test were conducted between the mean response values of the central points (Runs 13–15) and test points (Runs 1–12) in the PB test results (Table 1) to determine whether there was a significant difference. In the equivariance test (Table S3), the variance between the central points and the test points was non-homogeneous (p = 0.0016 < 0.01). According to the t-test results (Table S4), when the variance was assumed to be different, there was no significant difference between the two response values (p = 0.0777 > 0.05), that is, the central point selected by the PB design was not close to the optimal value region. Therefore, it was necessary to perform the path of steepest ascent along the direction of increasing molasses, decreasing beef powder, and initial pH. Under the conditions of molasses 275 g/L, beef extract powder 10.5 g/L, and initial pH 8.4, the maximum yield of M-EPS was 44.00 ± 0.16 g/L (Table 2). Therefore, the point (Run 3) was considered to be close to the optimal value and was selected as the central point of the CCD for further optimization. Other medium composition levels were set according to previous experiments.
3.3.3. Response Optimization
The effects of different media components on M-EPS production showed that media optimization is essential to improve M-EPS yield. The results of the CCD experiments (Table 3) were analyzed using Design Expert software (version 12.0.3, stat ease, Minneapolis, MN, USA). Meanwhile, a model used to predict the maximum response value was obtained:
The data in Table 3 was subjected to a regression analysis and the results are presented in Table 5. The p-value (p < 0.0001) indicated that the linear relationship between the independent and dependent variables was highly significant and also indicated that the established regression equation had a good fit with the response surface [62]. The determination coefficient (R2) of the model was 0.9542, the adjustment coefficient (Adj R2) was 0.9130, and the low coefficient of variation (CV) value was 3.1%, all of which attested to the high accuracy and credibility of the test results [40,63] so the model could be used to analyze the variation in the M-EPS yield. Also, the p-value corresponding to the lack of fit (p = 0.0561 > 0.05) indicated that the model equation could predict the yield of M-EPS well enough for any combination of variables. From the significance coefficient of the regression equation of each factor in Table 5, it could be seen that the quadratic terms X12 (molasses, p < 0.0001) and X82 (initial pH, p < 0.0001) were highly significant, and that X42 (beef extract, p = 0.0365) was significant. The 3D response surfaces obtained based on the quadratic regression equation are shown in Figure 6, which can intuitively show the influence trend of the various factors on the response value. The coefficients of the quadratic terms in the model equation are all negative, and the surface opening of the 3D response surface is obviously downward, indicating that the equation has a maximum value. Therefore, the model was used to predict the maximum response value, and the combination of factors was obtained as molasses 294.3 g/L, beef powder 10.10 g/L, and pH 8.50. Under this fermentation condition, the maximum predicted yield of M-EPS was 47.61 g/L, which was much higher compared to the actual yield before optimization (14.80 ± 0.10 g/L). The results indicated that the carbon source, nitrogen source, and initial pH played important roles in EPS production, especially the carbon source, which was also shown in many studies [62,64,65]. A carbon source is an important substrate for microbial growth and the synthesis of EPS. A high concentration of a carbon source usually promotes EPS production [66]. Molasses is rich in sucrose, so in the screening of influencing factors molasses showed a significant effect on the yield of M-EPS. Similarly, molasses as a carbon source showed significant effects on EPS production by Anoxybacillus gonensis YK25 [66], Bacillus subtilis [67], and Aureobasidium pullulans MTCC 2195 [68]. The pH affects fermentation by influencing the dissolution and absorption of nutrients and the enzyme activity [69]. In many studies on the fermentation of EPS by lactic acid bacteria, the maximum yield was achieved at an initial pH of about 7.0 [26,43,70]. In this study, the optimal initial pH was 8.50, which might be due to the presence of some organic acids and metal ions in the molasses resulting in the molasses-containing medium being acidic. A nitrogen source is also a nutrient required by microorganisms, and its type and concentration will significantly affect the growth and EPS production of microorganisms. Beef extract powder showed a significant effect on M-EPS production, which was consistent with the findings of Li et al. [31].
Table 5.
ANOVA analysis for quadratic regression model of the yield of M-EPS in central composite design.
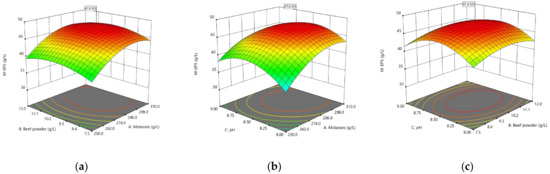
Figure 6.
The 3D response surface showing the interactive effect of independent variables on M-EPS yield. (a) Molasses and Beef powder; (b) Molasses and Initial pH; (c) Beef powder and Initial pH.
3.3.4. Validation Test and Determination of Optimal Sugar Production Time
Six replicate tests were carried out under the optimal combination conditions (Table S5). Next, a t-test was performed between the validation test results and the model predictions and p = 0.1234 > 0.05 was determined (Table S6), indicating that the model obtained by optimization could fit the test results well [63]. In the study of fermentation time (Figure S1), M-EPS yield showed a trend of first increasing and then decreasing, and reached a maximum of 48.45 ± 0.24 g/L at 36 h, which was 3.27-folds of that unoptimized [30]. However, it was lower than that under the condition of optimization with sucrose as a substrate (59.33 ± 1.34 g/L) [63]. This might be due to the presence of some harmful metal ions and suspended colloid in molasses, which will affect the pH of the culture medium and the enzyme activities related to EPS biosynthesis [71].
3.4. Characterization of M-EPS-Added Set Yogurt
3.4.1. WHC and pH of Set Yogurt Product
In the previous structural characterization of M-EPS, it was deduced that M-EPS has a potential water retention capacity. Using this property, we used it in set yogurt fermentation and investigated the water holding capacity of set yogurt samples. It could be seen from Table 6 that the addition of M-EPS increased the water holding capacity of set yogurt, and the WHC increased with the increase of M-EPS addition. This aptly illustrated the water holding capacity of M-EPS [72]. Moreover, it has been shown that the hydroxyl group present in EPS can bind with water and reduce the free movement of water, thus contributing to the stability of the protein network in set yogurt and improving the WHC [45,46,73].
Table 6.
Water holding capacity (WHC) and pH in set yogurt with the presence of M-EPS.
The pH results were shown in Table 6. With the increase of M-EPS concentration, the pH of set yogurt showed a gradual decrease, probably because the addition of M-EPS increased the acid production capacity of microorganisms during yogurt acidification. It also indicated that the addition of M-EPS could significantly increase the fermentation rate and shorten the fermentation time of yogurt [74].
3.4.2. Micromorphology of Set Yogurt
Compared with the control group (Figure 7a), the microstructure of set yogurt products with M-EPS was significantly changed (Figure 7b,c). A kind of porous structure was observed in the set yogurt with M-EPS, and there was viscosity around the pores [75]. It could be observed that the higher the concentration of M-EPS added, the set yogurt showed a larger pore size with a more pronounced porous mesh structure. In addition, protein condensates were more fused, which confirmed the viscosity-enhancing effect of M-EPS [48]. This might be due to the fact that the thin layer structure of M-EPS molecules would interact with the protein network in the set yogurt, thus changing the nature of the set yogurt.
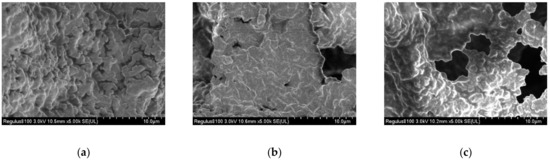
Figure 7.
Scanning electron micrographs of set yogurt containing different concentrations of M-EPS with magnification of 5000×. (a) +0% M-EPS; (b) +0.1% M-EPS; (c) +0.5% M-EPS.
4. Conclusions
In this study, the production of M-EPS by Leu. citreum B-2 using molasses as a substrate was studied, and the yield of M-EPS was increased to 48.45 ± 0.24 g/L by RSM, which was 3.27-folds of that of unoptimized. M-EPS produced by Leu. citreum B-2 in a molasses medium has some structural similarities with the EPS produced by Leu. citreum B-2 in a sucrose medium: both exopolysaccharides of the two substrates are linear dextrans, with essentially identical FT-IR absorption peaks and high branching. However, M-EPS is lower than sucrose EPS in terms of molecular weight and overall branched chain ratio. Based on the structural analysis of M-EPS, it was inferred that the dextran has some potential properties similar to food additives. Therefore, M-EPS was applied to set yogurt fermentation. SEM images showed that the three-dimensional network was observed in the set yogurt containing M-EPS, indicating that M-EPS had a positive effect for the stability of set yogurt. Therefore, this study provided new insights into the exploitation of sugarcane molasses and the theoretical supports for the application of molasses-based microbial exopolysaccharides.
Supplementary Materials
The following supporting information can be downloaded at: https://www.mdpi.com/article/10.3390/pr10050891/s1, Table S1: Assigned concentrations of variables at different levels in Plackett-Burman design for M-EPS production; Table S2: Range of different factors studied in the central composite design; Table S3: The equal variance test of Plackett-Burman experimental results; Table S4: The t-test of Plackett-Burman experimental results; Table S5: Verification results of RSM optimization model; Table S6: The t-test of verification results of RSM optimization model; Figure S1: Time course for cellular growth and M-EPS yield by Leu. citreum B-2 under the optimized conditions. Different condition was illustrated as triangle (▲: M-EPS production), circle (●: OD600nm).
Author Contributions
Conceptualization, L.L., Z.Z.; Methodology, L.L.; Data curation, L.L.; Writing-original draft, L.L.; Software, M.X. and L.P.; Writing—Review & Editing, M.X., L.P. and Z.Z.; Resources, L.P.; Supervision, Y.H.; Validation, Y.H.; Funding acquisition, Y.H. All authors have read and agreed to the published version of the manuscript.
Funding
This study was funded by Tianjin Key Research and Development Plan (grant number, 19YFZCSN00100).
Institutional Review Board Statement
Not applicable.
Informed Consent Statement
Not applicable.
Data Availability Statement
Not applicable.
Conflicts of Interest
The authors declare no conflict of interest.
References
- Wang, J.; Zhao, X.; Tian, Z.; Yang, Y.; Yang, Z. Characterization of an exopolysaccharide produced by Lactobacillus plantarum YW11 isolated from Tibet Kefir. Carbohydr. Polym. 2015, 125, 16–25. [Google Scholar] [CrossRef] [PubMed]
- Li, W.; Ji, J.; Chen, X.; Jiang, M.; Rui, X.; Dong, M. Structural elucidation and antioxidant activities of exopolysaccharides from Lactobacillus helveticus MB2-1. Carbohydr. Polym. 2014, 102, 351–359. [Google Scholar] [CrossRef] [PubMed]
- Zhou, Y.; Cui, Y.; Qu, X. Exopolysaccharides of lactic acid bacteria: Structure, bioactivity and associations: A review. Carbohydr. Polym. 2019, 207, 317–332. [Google Scholar] [CrossRef] [PubMed]
- Nabot, M.; Guérin, M.; Sivakumar, D.; Remize, F.; Garcia, C. Variability of Bacterial Homopolysaccharide Production and Properties during Food Processing. Biology 2022, 11, 171. [Google Scholar] [CrossRef] [PubMed]
- Llamas-Arriba, M.G.; Hernandez-Alcantara, A.M.; Mohedano, M.L.; Chiva, R.; Celador-Lera, L.; Velazquez, E.; Prieto, A.; Duenas, M.T.; Tamame, M.; Lopez, P. Lactic Acid Bacteria Isolated from Fermented Doughs in Spain Produce Dextrans and Riboflavin. Foods 2021, 10, 2004. [Google Scholar] [CrossRef]
- Kim, G.; Bae, J.H.; Cheon, S.; Lee, D.H.; Kim, D.H.; Lee, D.; Park, S.H.; Shim, S.; Seo, J.H.; Han, N.S. Prebiotic activities of dextran from Leuconostoc mesenteroides SPCL742 analyzed in the aspect of the human gut microbial ecosystem. Food Funct. 2022, 13, 1256–1267. [Google Scholar] [CrossRef]
- Banerjee, A.; Bandopadhyay, R. Use of dextran nanoparticle: A paradigm shift in bacterial exopolysaccharide based biomedical applications. Int. J. Biol. Macromol. 2016, 87, 295–301. [Google Scholar] [CrossRef]
- Esmaeilnejad-Moghadam, B.; Mokarram, R.R.; Hejazi, M.A.; Khiabani, M.S.; Keivaninahr, F. Low molecular weight dextran production by Leuconostoc mesenteroides strains: Optimization of a new culture medium and the rheological assessments. Bioact. Carbohydr. Diet. Fibre. 2019, 18, 100181. [Google Scholar] [CrossRef]
- Diana, C.R.; Humberto, H.S.; Jorge, Y.F. Structural characterization and rheological properties of dextran produced by native strains isolated of Agave salmiana. Food Hydrocoll. 2019, 90, 1–8. [Google Scholar] [CrossRef]
- Zhao, D.; Liu, L.; Jiang, J.; Guo, S.; Ping, W.; Ge, J. The response surface optimization of exopolysaccharide produced by Weissella confusa XG-3 and its rheological property. Prep. Biochem. Biotechnol. 2020, 50, 1014–1022. [Google Scholar] [CrossRef]
- Angelin, J.; Kavitha, M. Exopolysaccharides from probiotic bacteria and their health potential. Int. J. Biol. Macromol. 2020, 162, 853–865. [Google Scholar] [CrossRef] [PubMed]
- Sharma, M.; Patel, S.N.; Lata, K.; Singh, U.; Krishania, M.; Sangwan, R.S.; Singh, S.P. A novel approach of integrated bioprocessing of cane molasses for production of prebiotic and functional bioproducts. Bioresour. Technol. 2016, 219, 311–318. [Google Scholar] [CrossRef] [PubMed]
- Wang, K.; Niu, M.; Song, D.; Song, X.; Zhao, J.; Wu, Y.; Lu, B.; Niu, G. Preparation, partial characterization and biological activity of exopolysaccharides produced from Lactobacillus fermentum S1. J. Biosci. Bioeng. 2020, 129, 206–214. [Google Scholar] [CrossRef] [PubMed]
- Nacher-Vazquez, M.; Ballesteros, N.; Canales, A.; Rodriguez Saint-Jean, S.; Perez-Prieto, S.I.; Prieto, A.; Aznar, R.; Lopez, P. Dextrans produced by lactic acid bacteria exhibit antiviral and immunomodulatory activity against salmonid viruses. Carbohydr. Polym. 2015, 124, 292–301. [Google Scholar] [CrossRef] [PubMed]
- Amaretti, A.; Bottari, B.; Morreale, F.; Savo Sardaro, M.L.; Angelino, D.; Raimondi, S.; Rossi, M.; Pellegrini, N. Potential prebiotic effect of a long-chain dextran produced by Weissella cibaria: An in vitro evaluation. Int. J. Food Sci. Nutr. 2020, 71, 563–571. [Google Scholar] [CrossRef]
- Chen, Z.; Ni, D.; Zhang, W.; Stressler, T.; Mu, W. Lactic acid bacteria-derived α-glucans: From enzymatic synthesis to miscellaneous applications. Biotechnol. Adv. 2021, 47, 107708. [Google Scholar] [CrossRef]
- Naessens, M.; Cerdobbel, A.; Soetaert, W.; Vandamme, E.J. Leuconostoc dextransucrase and dextran: Production, properties and applications. J. Chem. Technol. Biotechnol. 2005, 80, 845–860. [Google Scholar] [CrossRef]
- Huang, S.; Huang, G. Design and application of dextran carrier. J. Drug Delivery Sci. Technol. 2020, 55, 101392. [Google Scholar] [CrossRef]
- Lynch, K.M.; Zannini, E.; Coffey, A.; Arendt, E.K. Lactic Acid Bacteria Exopolysaccharides in Foods and Beverages: Isolation, Properties, Characterization, and Health Benefits. Annu. Rev. Food Sci. Technol. 2018, 9, 155–176. [Google Scholar] [CrossRef]
- Valli, V.; Gomez-Caravaca, A.M.; Di Nunzio, M.; Danesi, F.; Caboni, M.F.; Bordoni, A. Sugar cane and sugar beet molasses, antioxidant-rich alternatives to refined sugar. J. Agric. Food Chem. 2012, 60, 12508–12515. [Google Scholar] [CrossRef]
- Luo, J.; Guo, S.; Wu, Y.; Wan, Y. Separation of Sucrose and Reducing Sugar in Cane Molasses by Nanofiltration. Food Bioprocess Technol. 2018, 11, 913–925. [Google Scholar] [CrossRef]
- Zhang, S.; Wang, J.; Jiang, H. Microbial production of value-added bioproducts and enzymes from molasses, a by-product of sugar industry. Food Chem. 2020, 346, 128860. [Google Scholar] [CrossRef] [PubMed]
- Muhammadi; Afzal, M. Optimization of water absorbing exopolysaccharide production on local cheap substrates by Bacillus strain CMG1403 using one variable at a time approach. J. Microbiol. 2014, 52, 44–52. [Google Scholar] [CrossRef] [PubMed]
- Kanimozhi, J.; Moorthy, I.G.; Sivashankar, R.; Sivasubramanian, V. Optimization of dextran production by Weissella cibaria NITCSK4 using Response Surface Methodology-Genetic Algorithm based technology. Carbohydr. Polym. 2017, 174, 103–110. [Google Scholar] [CrossRef]
- Jiang, J.; Guo, S.; Ping, W.; Zhao, D.; Ge, J. Optimization production of exopolysaccharide from Leuconostoc lactis L2 and its partial characterization. Int. J. Biol. Macromol. 2020, 159, 630–639. [Google Scholar] [CrossRef]
- Du, R.; Xing, H.; Yang, Y.; Jiang, H.; Zhou, Z.; Han, Y. Optimization, purification and structural characterization of a dextran produced by L. mesenteroides isolated from Chinese sauerkraut. Carbohydr. Polym. 2017, 174, 409–416. [Google Scholar] [CrossRef]
- Han, X.; Yang, Z.; Jing, X.; Yu, P.; Zhang, Y.; Yi, H.; Zhang, L. Improvement of the Texture of Yogurt by Use of Exopolysaccharide Producing Lactic Acid Bacteria. Biomed. Res. Int. 2016, 2016, 7945675. [Google Scholar] [CrossRef]
- Tiwari, S.; Kavitake, D.; Devi, P.B.; Halady Shetty, P. Bacterial exopolysaccharides for improvement of technological, functional and rheological properties of yoghurt. Int. J. Biol. Macromol. 2021, 183, 1585–1595. [Google Scholar] [CrossRef]
- Doleyres, Y.; Schaub, L.; Lacroix, C. Comparison of the Functionality of Exopolysaccharides Produced In Situ or Added as Bioingredients on Yogurt Properties. J. Dairy Sci. 2005, 88, 4146–4156. [Google Scholar] [CrossRef]
- Feng, F.; Zhou, Q.; Yang, Y.; Zhao, F.; Du, R.; Han, Y.; Xiao, H.; Zhou, Z. Characterization of highly branched dextran produced by Leuconostoc citreum B-2 from pineapple fermented product. Int. J. Biol. Macromol. 2018, 113, 45–50. [Google Scholar] [CrossRef]
- Li, Q.; Zhou, Y.; Ke, C.; Bai, Y.; Liu, X.; Li, S. Production of welan gum from cane molasses by Sphingomonas sp. FM01. Carbohydr. Polym. 2020, 244, 116485. [Google Scholar] [CrossRef] [PubMed]
- Kim, K.N.; Lee, Y.J.; Cho, D.-H.; Ahn, K.-H.; Hong, J.-E.; Park, Y.-I.; Kim, H.-S. A Novel Galactoglucomannan Exopolysaccharide Produced by Oil Fermentation with Pseudozyma sp. SY16. Biotechnol. Bioprocess Eng. 2020, 25, 742–748. [Google Scholar] [CrossRef]
- Yang, Y.; Feng, F.; Zhou, Q.; Zhao, F.; Du, R.; Zhou, Z.; Han, Y. Isolation, Purification, and Characterization of Exopolysaccharide Produced by Leuconostoc citreum N21 from Dried Milk Cake. Trans. Tianjin Univ. 2018, 25, 161–168. [Google Scholar] [CrossRef]
- Du, R.; Pei, F.; Kang, J.; Zhang, W.; Wang, S.; Ping, W.; Ling, H.; Ge, J. Analysis of the structure and properties of dextran produced by Weissella confusa. Int. J. Biol. Macromol. 2022, 204, 677–684. [Google Scholar] [CrossRef]
- Zhao, D.; Jiang, J.; Liu, L.; Wang, S.; Ping, W.; Ge, J. Characterization of exopolysaccharides produced by Weissella confusa XG-3 and their potential biotechnological applications. Int. J. Biol. Macromol. 2021, 178, 306–315. [Google Scholar] [CrossRef]
- Yang, Y.; Peng, Q.; Guo, Y.; Han, Y.; Xiao, H.; Zhou, Z. Isolation and characterization of dextran produced by Leuconostoc citreum NM105 from manchurian sauerkraut. Carbohydr. Polym. 2015, 133, 365–372. [Google Scholar] [CrossRef]
- Jaros, D.; Kobsch, J.; Rohm, H. Exopolysaccharides from Basidiomycota: Formation, isolation and techno-functional properties. Eng. Life Sci. 2018, 18, 743–752. [Google Scholar] [CrossRef] [Green Version]
- Choudhuri, I.; Khanra, K.; Maity, P.; Patra, A.; Maity, G.N.; Pati, B.R.; Nag, A.; Mondal, S.; Bhattacharyya, N. Structure and biological properties of exopolysaccharide isolated from Citrobacter freundii. Int. J. Biol. Macromol. 2021, 168, 537–549. [Google Scholar] [CrossRef]
- Maina, N.H.; Tenkanen, M.; Maaheimo, H.; Juvonen, R.; Virkki, L. NMR spectroscopic analysis of exopolysaccharides produced by Leuconostoc citreum and Weissella confusa. Carbohydr. Res. 2008, 343, 1446–1455. [Google Scholar] [CrossRef]
- Wang, Q.; Wang, X.; Zou, Q.S.; Pu, Y.Y.; Chen, S. Optimization of the Components of Medium Producing Dextran from Immobilized Cells of Leuconostoc mesenteroides. Adv. Mater. Res. 2011, 418–420, 212–216. [Google Scholar] [CrossRef]
- Aramsangtienchai, P.; Kongmon, T.; Pechroj, S.; Srisook, K. Enhanced production and immunomodulatory activity of levan from the acetic acid bacterium, Tanticharoenia sakaeratensis. Int. J. Biol. Macromol. 2020, 163, 574–581. [Google Scholar] [CrossRef] [PubMed]
- Gao, X.; Yan, P.; Liu, X.; Wang, J.; Yu, J. Optimization of Cultural Conditions for Antioxidant Exopolysaccharides from Xerocomus badius Grown in Shrimp Byproduct. Biomed Res. Int. 2016, 2016, 2043787. [Google Scholar] [CrossRef] [PubMed] [Green Version]
- Xing, H.; Du, R.; Zhao, F.; Han, Y.; Xiao, H.; Zhou, Z. Optimization, chain conformation and characterization of exopolysaccharide isolated from Leuconostoc mesenteroides DRP105. Int. J. Biol. Macromol. 2018, 112, 1208–1216. [Google Scholar] [CrossRef] [PubMed]
- Pan, L.; Wang, Q.; Qu, L.; Liang, L.; Han, Y.; Wang, X.; Zhou, Z. Pilot-scale production of exopolysaccharide from Leuconostoc pseudomesenteroides XG5 and its application in set yogurt. J. Dairy Sci. 2022, 105, 1072–1083. [Google Scholar] [CrossRef]
- Ale, E.C.; Perezlindo, M.J.; Pavon, Y.; Peralta, G.H.; Costa, S.; Sabbag, N.; Bergamini, C.; Reinheimer, J.A.; Binetti, A.G. Technological, rheological and sensory characterizations of a yogurt containing an exopolysaccharide extract from Lactobacillus fermentum Lf2, a new food additive. Food Res. Int. 2016, 90, 259–267. [Google Scholar] [CrossRef]
- Fu, R.; Li, J.; Zhang, T.; Zhu, T.; Cheng, R.; Wang, S.; Zhang, J. Salecan stabilizes the microstructure and improves the rheological performance of yogurt. Food Hydrocoll. 2018, 81, 474–480. [Google Scholar] [CrossRef]
- Körzendörfer, A.; Hinrichs, J. Manufacture of high-protein yogurt without generating acid whey—Impact of the final pH and the application of power ultrasound on texture properties. Int. Dairy J. 2019, 99, 104541. [Google Scholar] [CrossRef]
- Zannini, E.; Jeske, S.; Lynch, K.M.; Arendt, E.K. Development of novel quinoa-based yoghurt fermented with dextran producer Weissella cibaria MG1. Int. J. Food Microbiol. 2018, 268, 19–26. [Google Scholar] [CrossRef]
- Wang, B.; Song, Q.; Zhao, F.; Xiao, H.; Zhou, Z.; Han, Y. Purification and characterization of dextran produced by Leuconostoc pseudomesenteroides PC as a potential exopolysaccharide suitable for food applications. Process Biochem. 2019, 87, 187–195. [Google Scholar] [CrossRef]
- Du, B.; Yang, Y.; Bian, Z.; Xu, B. Characterization and Anti-Inflammatory Potential of an Exopolysaccharide from Submerged Mycelial Culture of Schizophyllum commune. Front. Pharmacol. 2017, 8, 252. [Google Scholar] [CrossRef]
- Li, W.; Ji, J.; Rui, X.; Yu, J.; Tang, W.; Chen, X.; Jiang, M.; Dong, M. Production of exopolysaccharides by Lactobacillus helveticus MB2-1 and its functional characteristics in vitro. LWT—Food Sci. Technol. 2014, 59, 732–739. [Google Scholar] [CrossRef]
- Vedyashkina, T.A.; Revin, V.V.; Gogotov, I.N. Optimizing the Conditions of Dextran Synthesis by the Bacterium Leuconostoc mesenteroides Grown in a Molasses-Containing Medium. Appl. Biochem. Microbiol. 2005, 41, 361–364. [Google Scholar] [CrossRef]
- Zhou, Q.; Feng, F.; Yang, Y.; Zhao, F.; Du, R.; Zhou, Z.; Han, Y. Characterization of a dextran produced by Leuconostoc pseudomesenteroides XG5 from homemade wine. Int. J. Biol. Macromol. 2018, 107, 2234–2241. [Google Scholar] [CrossRef] [PubMed]
- Du, R.; Qiao, X.; Zhao, F.; Song, Q.; Zhou, Q.; Wang, Y.; Pan, L.; Han, Y.; Zhou, Z. Purification, characterization and antioxidant activity of dextran produced by Leuconostoc pseudomesenteroides from homemade wine. Carbohydr. Polym. 2018, 198, 529–536. [Google Scholar] [CrossRef] [PubMed]
- Ye, G.; Li, G.; Wang, C.; Ling, B.; Yang, R.; Huang, S. Extraction and characterization of dextran from Leuconostoc pseudomesenteroides YB-2 isolated from mango juice. Carbohydr. Polym. 2019, 207, 218–223. [Google Scholar] [CrossRef] [PubMed]
- Zhao, D.; Jiang, J.; Du, R.; Guo, S.; Ping, W.; Ling, H.; Ge, J. Purification and characterization of an exopolysaccharide from Leuconostoc lactis L2. Int. J. Biol. Macromol. 2019, 139, 1224–1231. [Google Scholar] [CrossRef]
- Zehir Senturk, D.; Dertli, E.; Erten, H.; Simsek, O. Structural and technological characterization of ropy exopolysaccharides produced by Lactobacillus plantarum strains isolated from Tarhana. Food Sci. Biotechnol. 2020, 29, 121–129. [Google Scholar] [CrossRef]
- Wangpaiboon, K.; Waiyaseesang, N.; Panpetch, P.; Charoenwongpaiboon, T.; Nepogodiev, S.A.; Ekgasit, S.; Field, R.A.; Pichayangkura, R. Characterisation of insoluble α-1,3-/α-1,6 mixed linkage glucan produced in addition to soluble α-1,6-linked dextran by glucansucrase (DEX-N) from Leuconostoc citreum ABK-1. Int. J. Biol. Macromol. 2020, 152, 473–482. [Google Scholar] [CrossRef]
- Wang, B.; Song, Q.; Zhao, F.; Zhang, L.; Han, Y.; Zhou, Z. Isolation and characterization of dextran produced by Lactobacillus sakei L3 from Hubei sausage. Carbohydr. Polym. 2019, 223, 115111. [Google Scholar] [CrossRef]
- Yang, F.; Li, H.; Wang, S.; Zhao, F.; Fang, F.; Guo, J.; Long, M.; Shen, Y. Differences in exopolysaccharides of three microbial aggregates. Environ. Technol. 2021, 1–13. [Google Scholar] [CrossRef]
- Netsopa, S.; Niamsanit, S.; Sakloetsakun, D.; Milintawisamai, N. Characterization and Rheological Behavior of Dextran from Weissella confusa R003. Int. J. Polym. Sci. 2018, 2018, 5790526. [Google Scholar] [CrossRef] [Green Version]
- Tilwani, Y.M.; Lakra, A.K.; Domdi, L.; Yadav, S.; Jha, N.; Arul, V. Optimization and physicochemical characterization of low molecular levan from Enterococcus faecium MC-5 having potential biological activities. Process Biochem. 2021, 110, 282–291. [Google Scholar] [CrossRef]
- Wang, Y.; Du, R.; Qiao, X.; Zhao, B.; Zhou, Z.; Han, Y. Optimization and characterization of exopolysaccharides with a highly branched structure extracted from Leuconostoc citreum B-2. Int. J. Biol. Macromol. 2020, 142, 73–84. [Google Scholar] [CrossRef] [PubMed]
- Qamar, S.A.; Asgher, M.; Bilal, M. Sustainable Production, Optimization, and Partial Characterization of Exopolysaccharides by Macrococcus brunensis. Waste Biomass Valorization 2021, 12, 6847–6859. [Google Scholar] [CrossRef]
- Sathishkumar, R.; Thirumalaikumar, E.; Rajeswari, M.V.; Arun, J.; Vimal, S.; Babu, M.M.; Citarasu, T. Extraction, statistical optimization, and immunomodulatory activity of exopolysaccharide from seaweed-associated Bacillus megaterium DSKPDF CMST3. Biomass Convers. Biorefin. 2022. [Google Scholar] [CrossRef]
- Karadayi, Y.I.; Aykutoglu, G.; Arslan, N.P.; Baltaci, M.O.; Adiguzel, A.; Taskin, M. Production of water-soluble sulfated exopolysaccharide with anticancer activity from Anoxybacillus gonensis YK25. J. Chem. Technol. Biotechnol. 2020, 96, 1258–1266. [Google Scholar] [CrossRef]
- Razack, S.A.; Velayutham, V.; Thangavelu, V. Medium optimization and in vitro antioxidant activity of exopolysaccharide produced by Bacillus subtilis. Korean J. Chem. Eng. 2013, 31, 296–303. [Google Scholar] [CrossRef]
- Srikanth, S.; Swathi, M.; Tejaswini, M.; Sharmila, G.; Muthukumaran, C.; Jaganathan, M.K.; Tamilarasan, K. Statistical optimization of molasses based exopolysaccharide and biomass production by Aureobasidium pullulans MTCC 2195. Biocatal. Agric. Biotechnol. 2014, 3, 7–12. [Google Scholar] [CrossRef]
- Hassan, S.W.; Ibrahim, H.A. Production, Characterization and Valuable Applications of Exopolysaccharides from Marine Bacillus subtilis SH1. Pol. J. Microbiol. 2017, 66, 449–461. [Google Scholar] [CrossRef] [Green Version]
- Wang, B.; Song, Q.; Zhao, F.; Han, Y.; Zhou, Z. Production optimization, partial characterization and properties of an exopolysaccharide from Lactobacillus sakei L3. Int. J. Biol. Macromol. 2019, 141, 21–28. [Google Scholar] [CrossRef]
- Ai, H.; Liu, M.; Yu, P.; Zhang, S.; Suo, Y.; Luo, P.; Li, S.; Wang, J. Improved welan gum production by Alcaligenes sp. ATCC31555 from pretreated cane molasses. Carbohydr. Polym. 2015, 129, 35–43. [Google Scholar] [CrossRef] [PubMed]
- Abarquero, D.; Renes, E.; Fresno, J.M.; Tornadijo, M.E. Study of exopolysaccharides from lactic acid bacteria and their industrial applications: A review. Int. J. Food Sci. Technol. 2021, 57, 16–26. [Google Scholar] [CrossRef]
- Xu, K.; Guo, M.; Du, J.; Zhang, Z. Okra polysaccharide: Effect on the texture and microstructure of set yoghurt as a new natural stabilizer. Int. J. Biol. Macromol. 2019, 133, 117–126. [Google Scholar] [CrossRef] [PubMed]
- Bai, M.; Huang, T.; Guo, S.; Wang, Y.; Wang, J.; Kwok, L.-Y.; Dan, T.; Zhang, H.; Bilige, M. Probiotic Lactobacillus casei Zhang improved the properties of stirred yogurt. Food Biosci. 2020, 37, 100718. [Google Scholar] [CrossRef]
- Zhao, Y.; Fu, R.; Li, J. Effects of the β-glucan, curdlan, on the fermentation performance, microstructure, rheological and textural properties of set yogurt. LWT 2020, 128, 109449. [Google Scholar] [CrossRef]
Publisher’s Note: MDPI stays neutral with regard to jurisdictional claims in published maps and institutional affiliations. |
© 2022 by the authors. Licensee MDPI, Basel, Switzerland. This article is an open access article distributed under the terms and conditions of the Creative Commons Attribution (CC BY) license (https://creativecommons.org/licenses/by/4.0/).