Enhanced Marketing Decision Making for Consumer Behaviour Classification Using Binary Decision Trees and a Genetic Algorithm Wrapper
Abstract
:1. Introduction
2. Literature Review
3. Materials and Methods
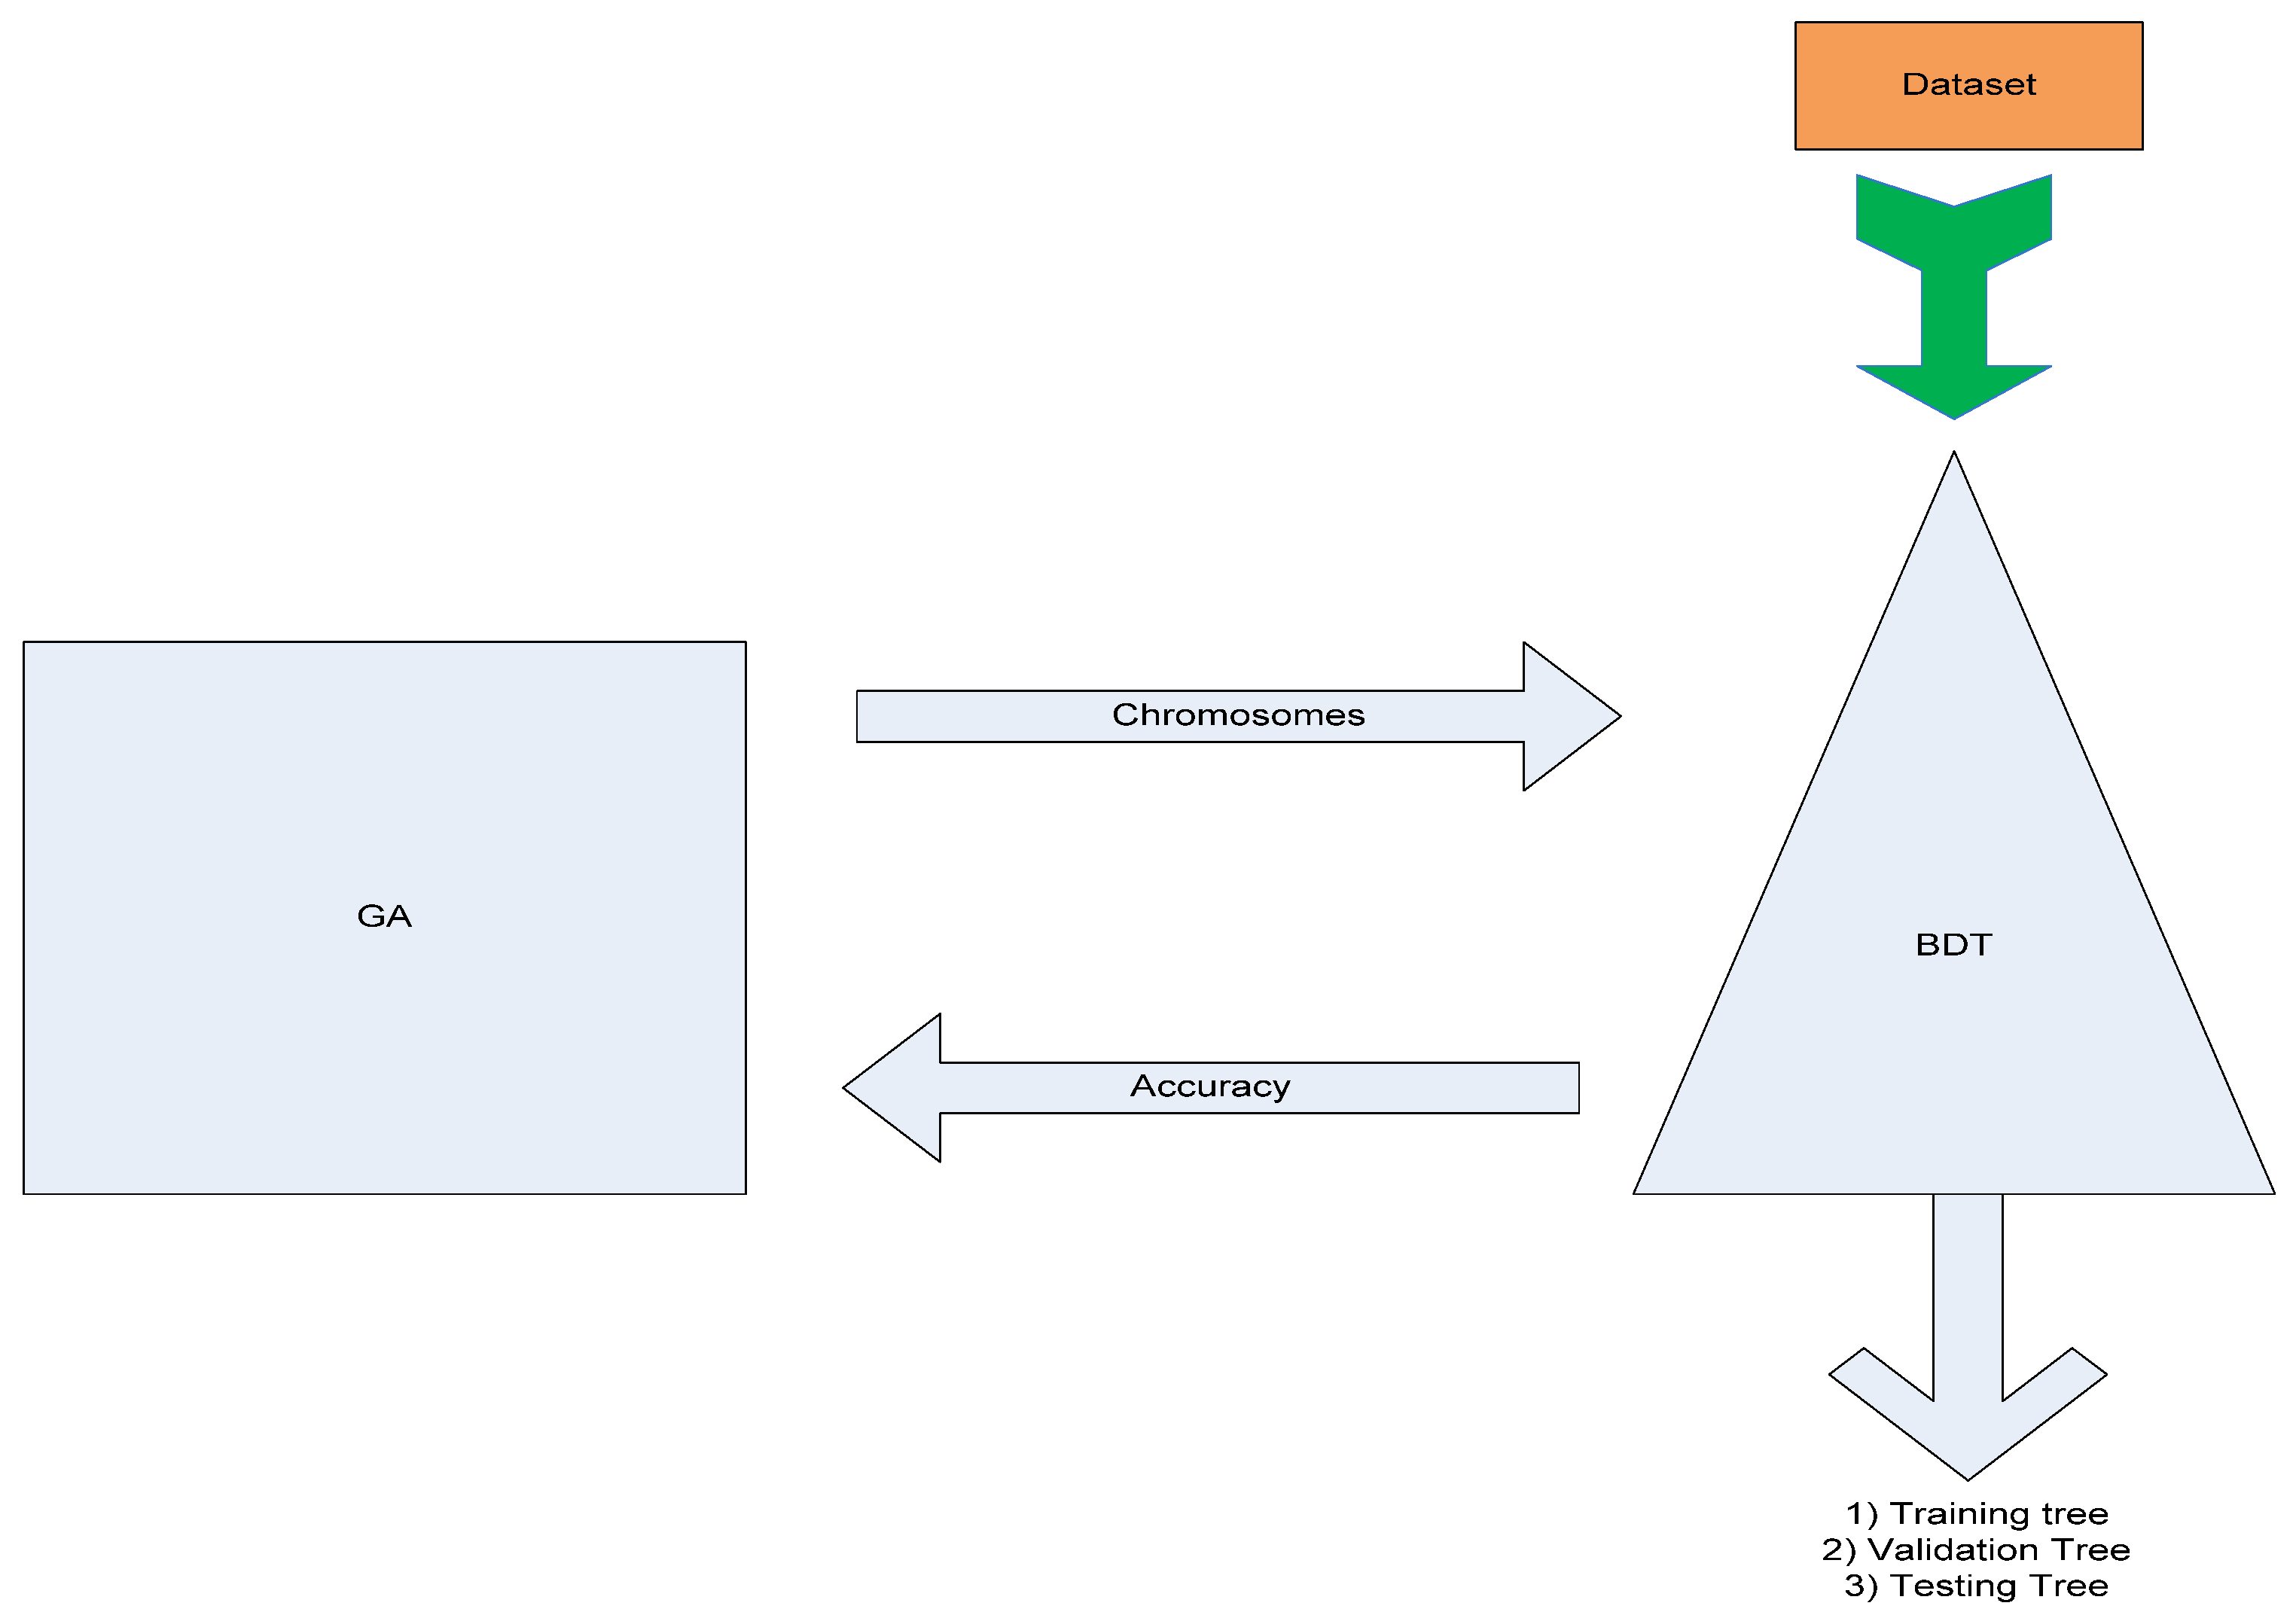
3.1. Method Overview
3.2. Fitness Model
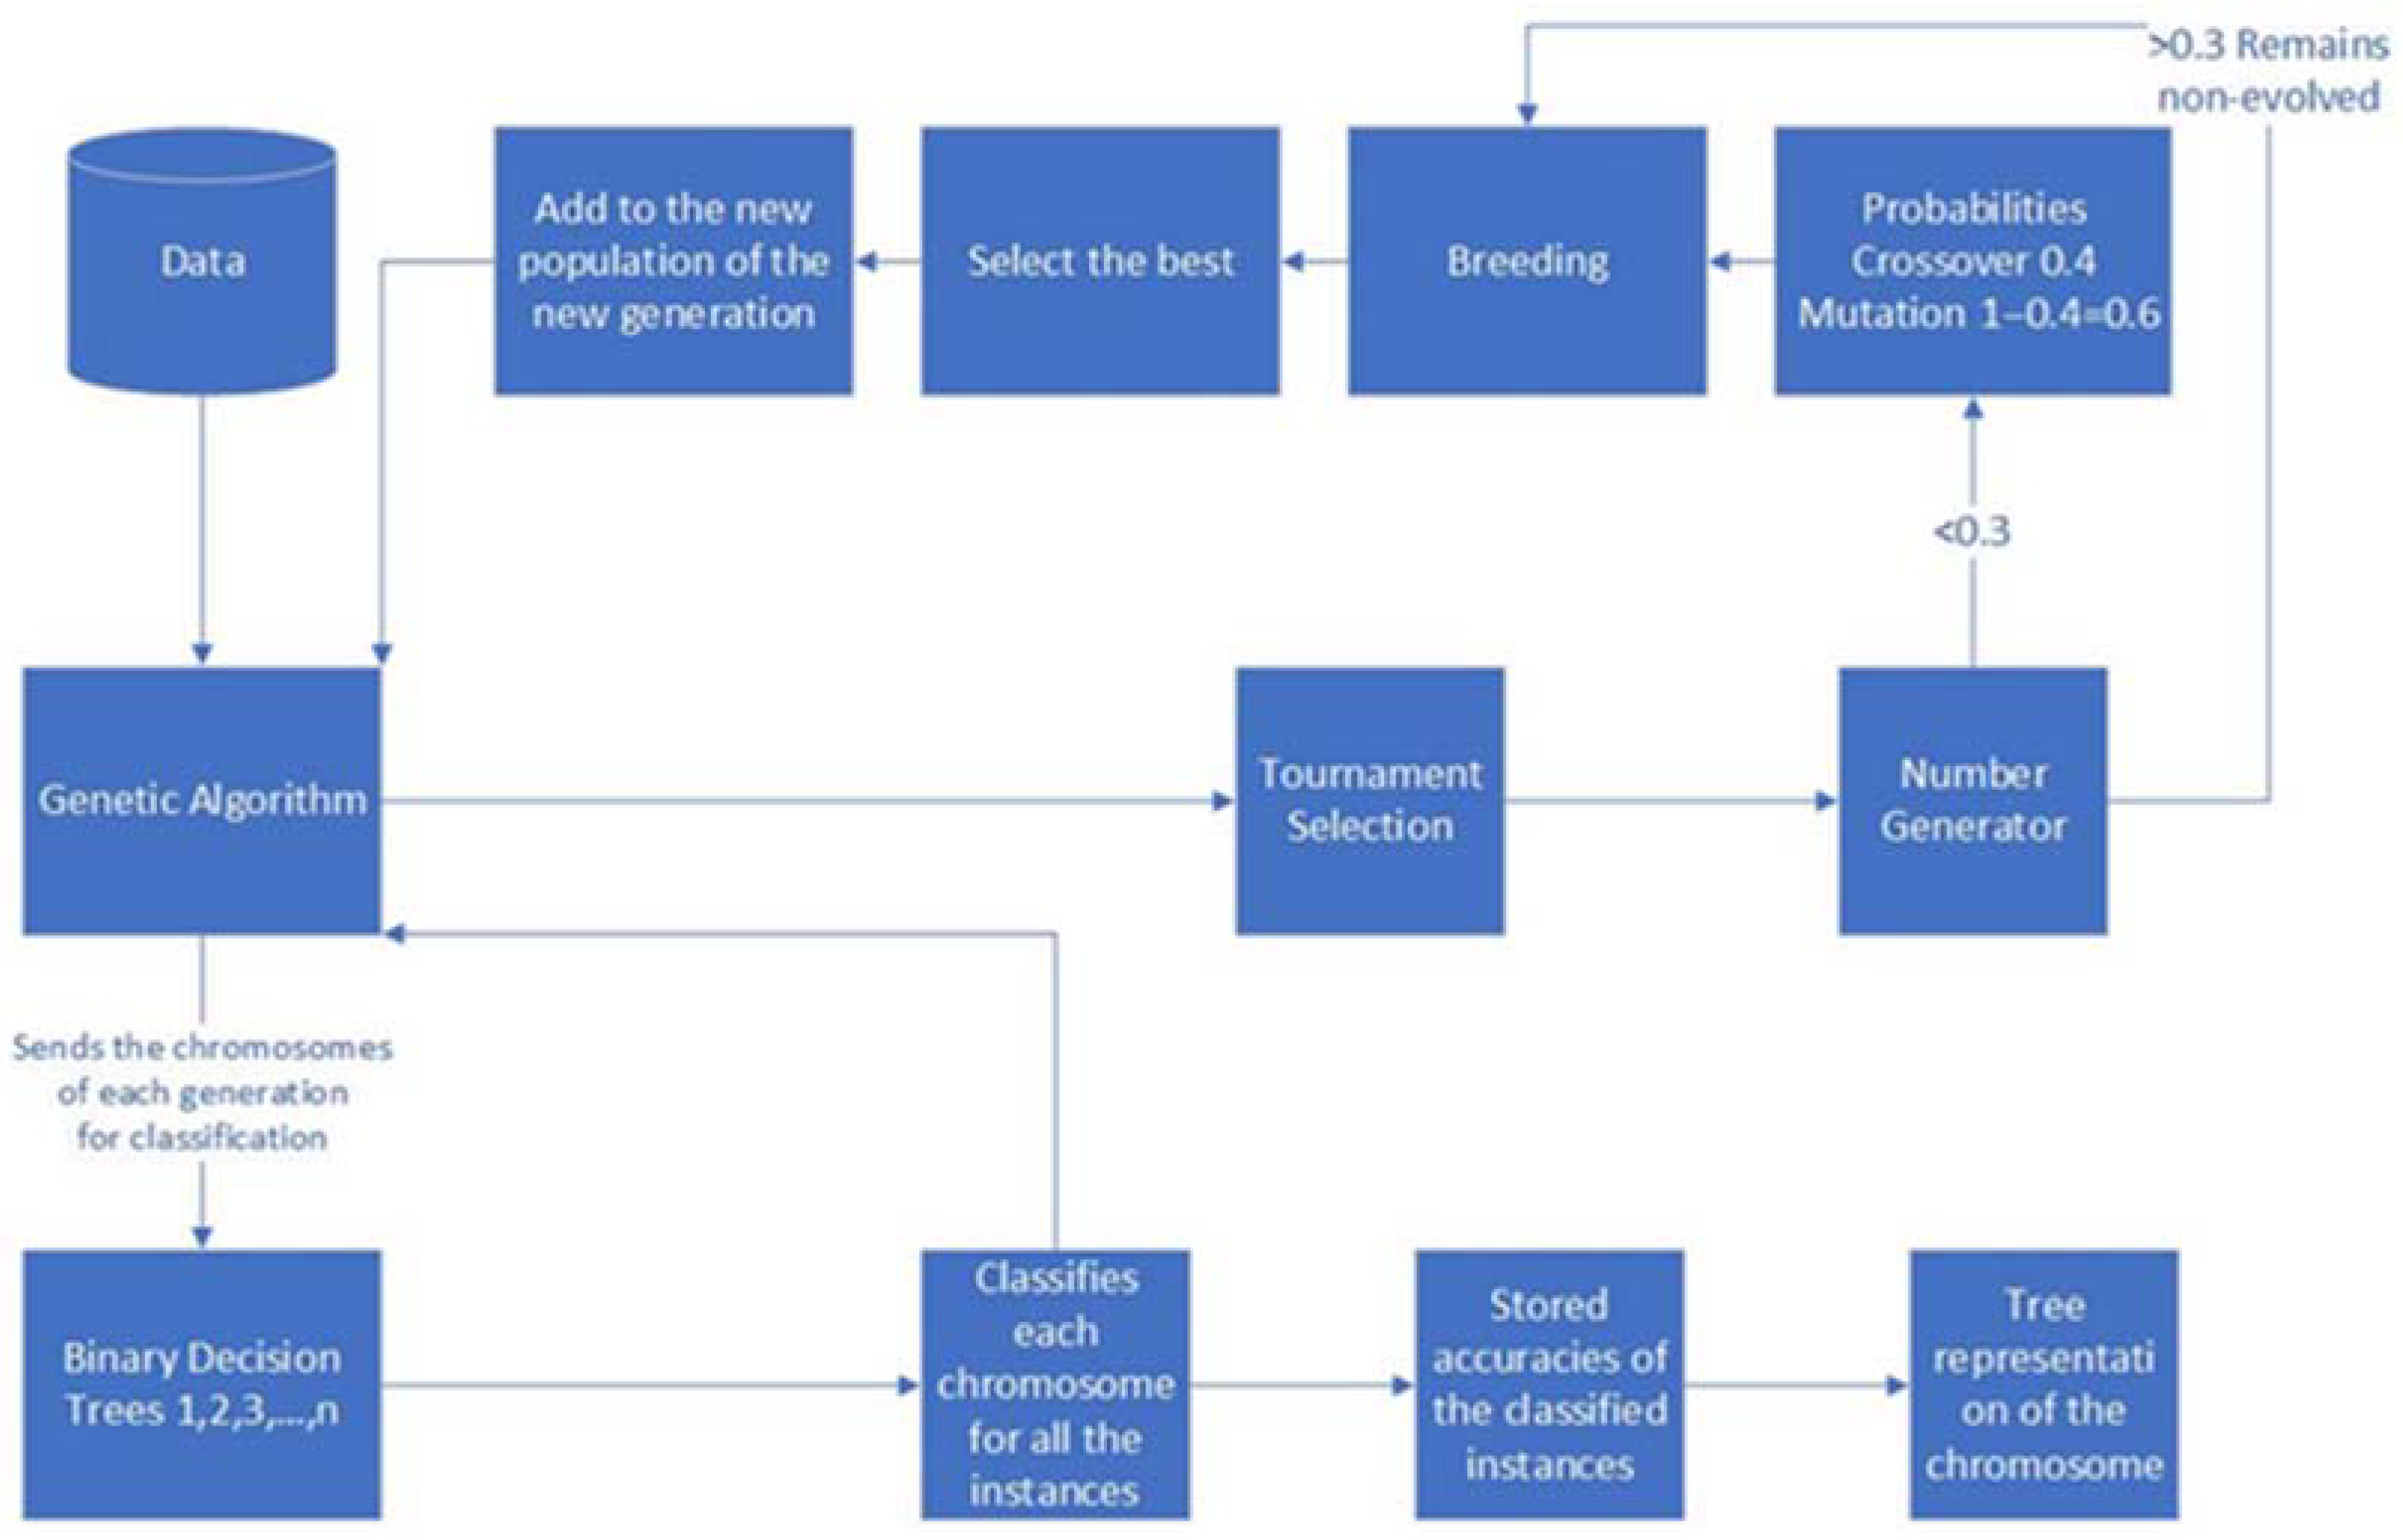
3.3. GA Wrapper Model Design
3.4. GA Wrapper Analysis
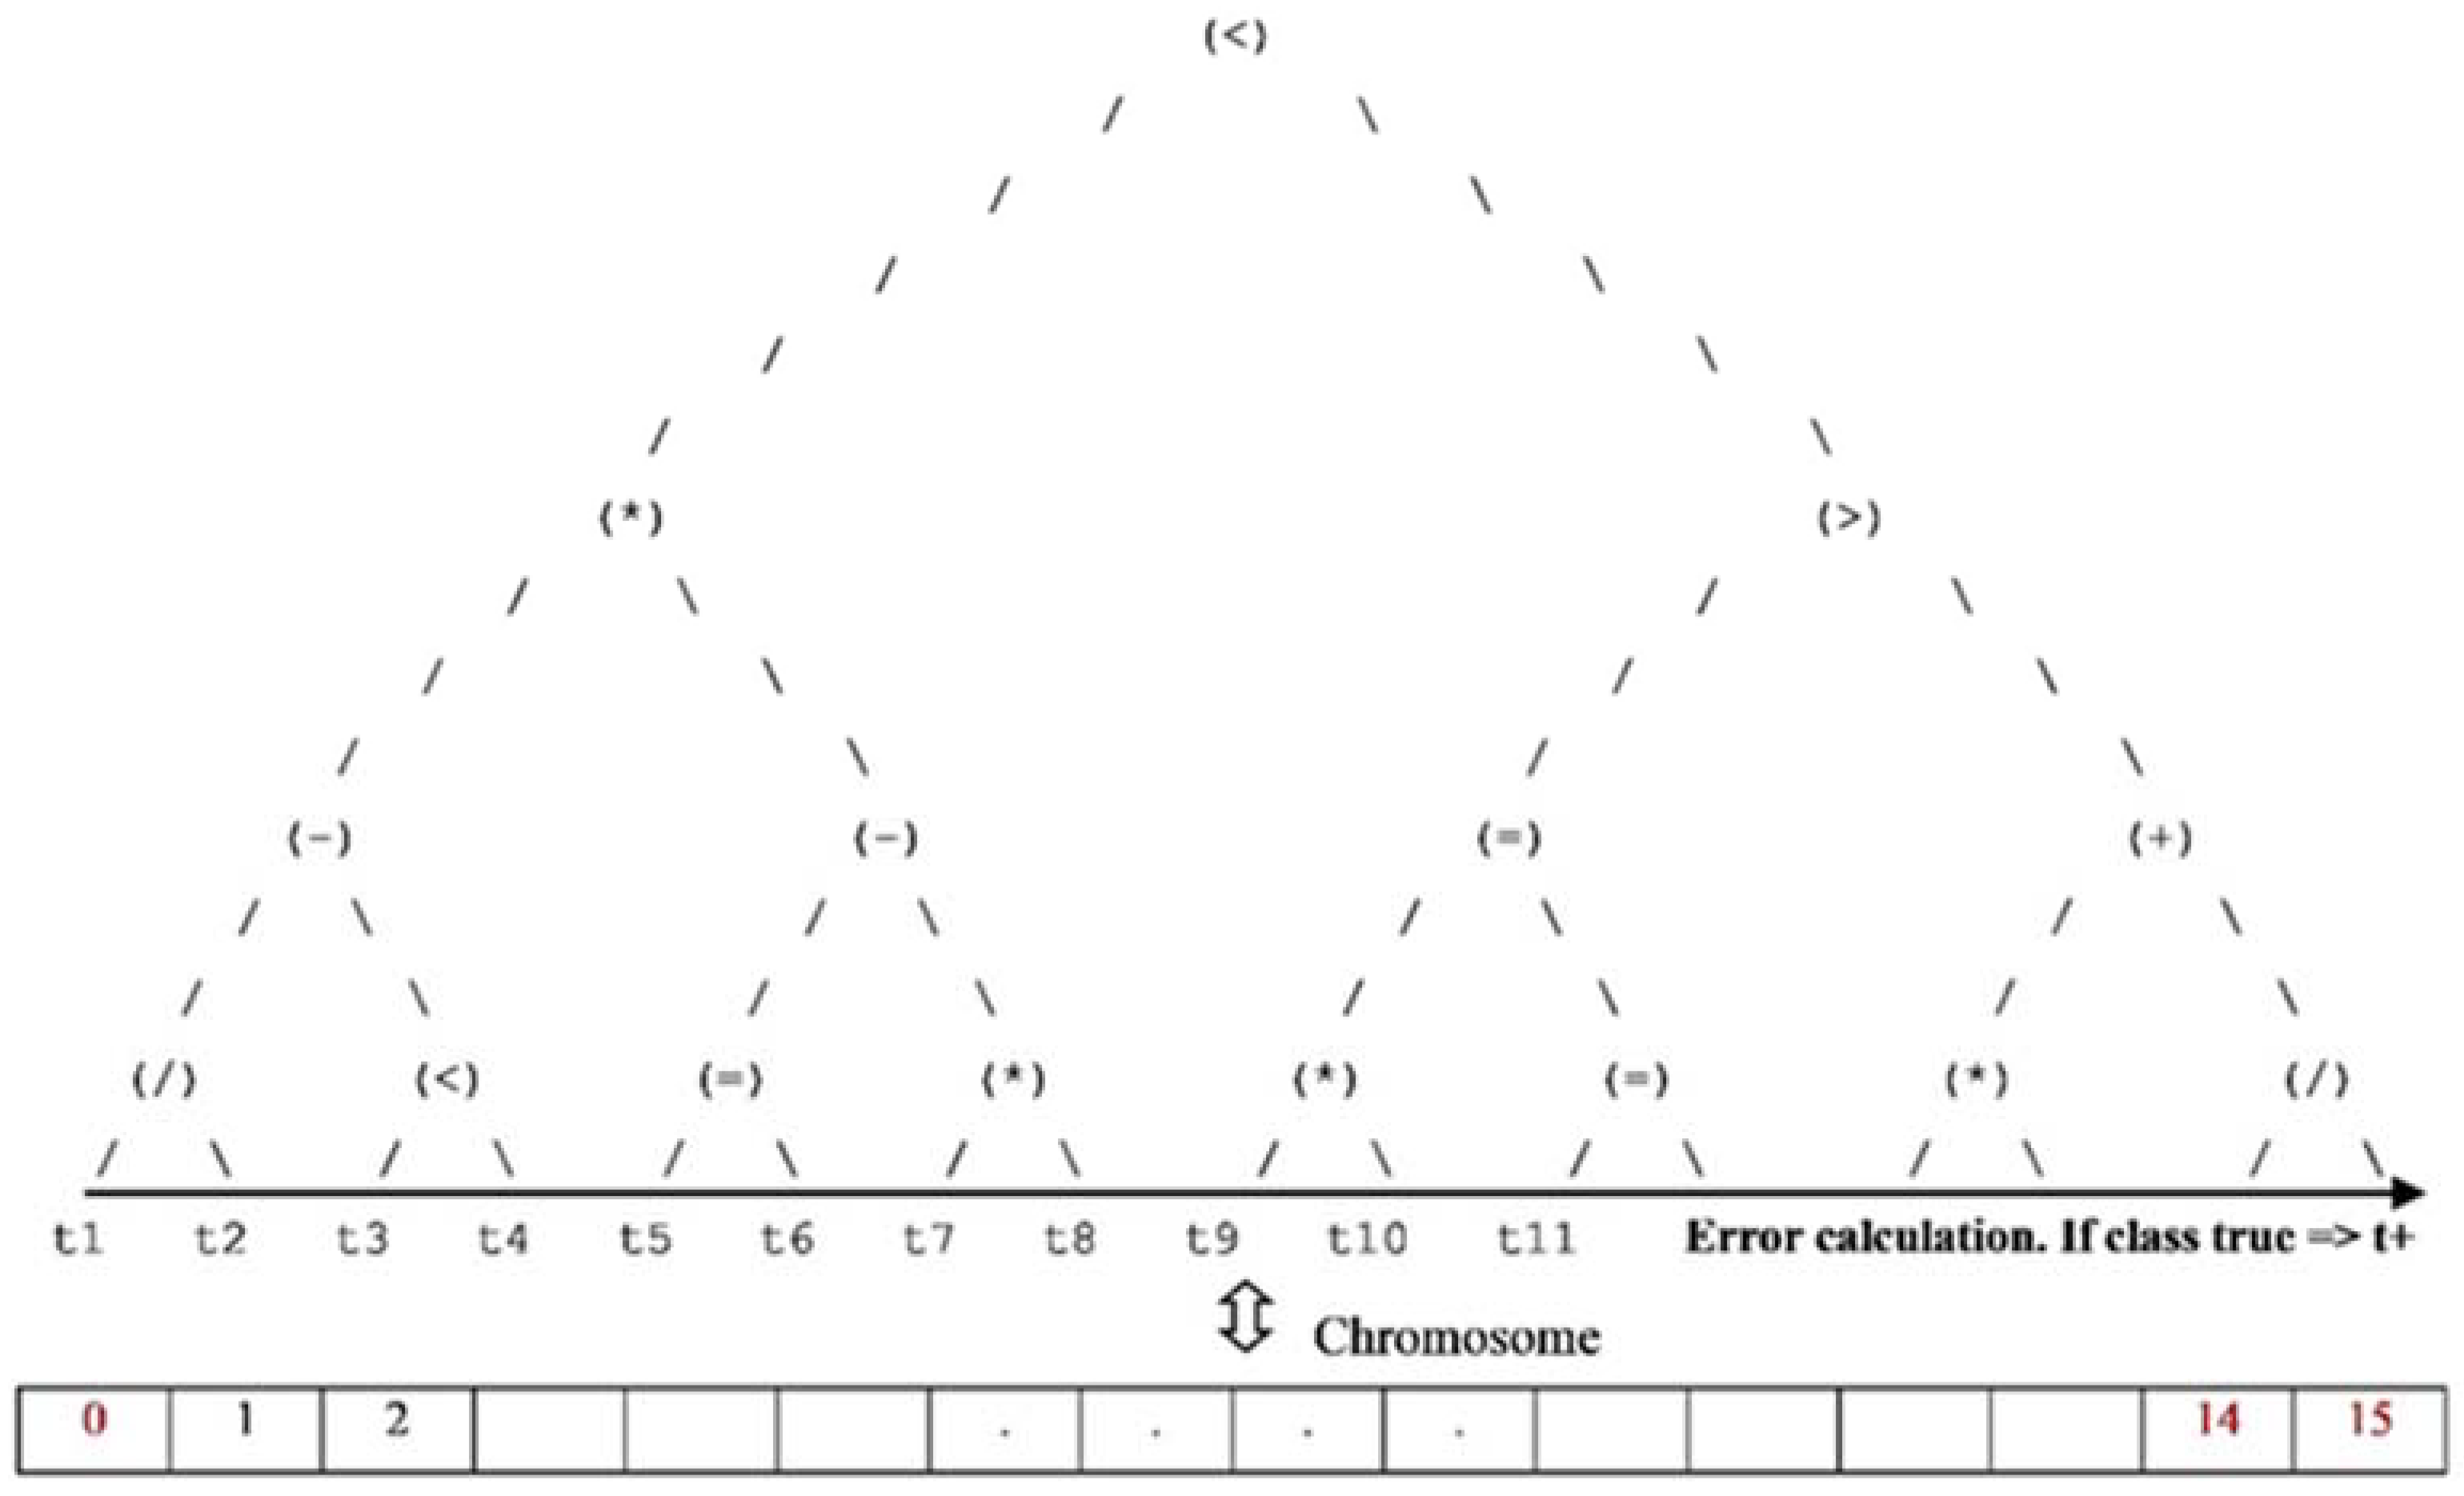
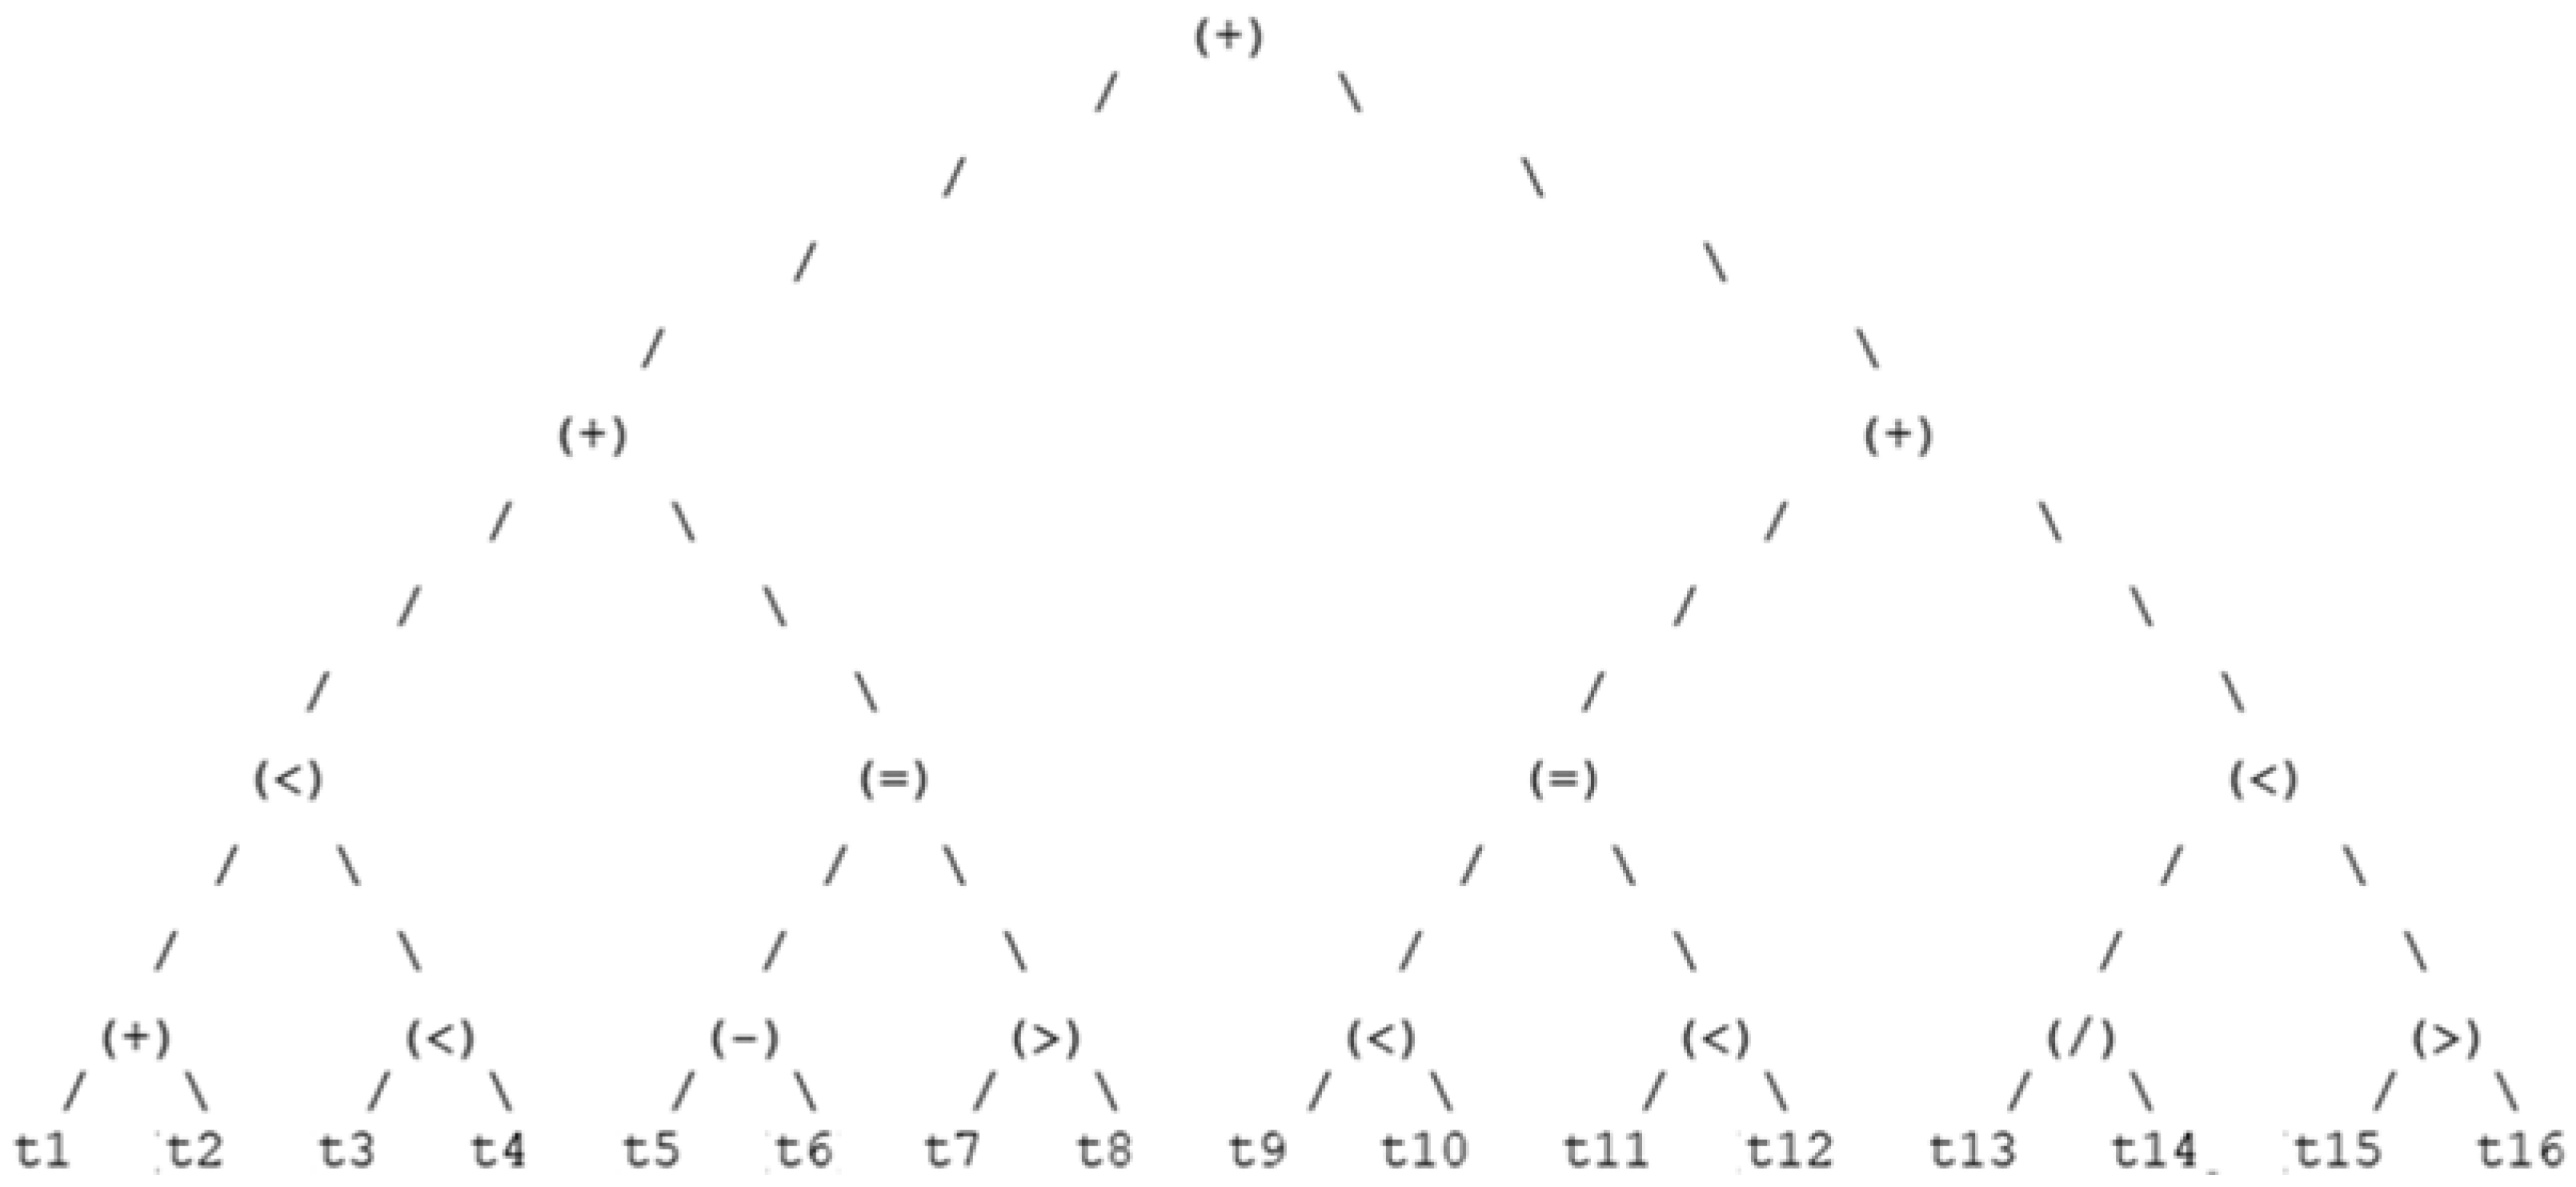
3.5. GA Wrapper Chromosome Representation
3.6. Dataset
4. Results
4.1. Average and Best Generation Fitness
4.1.1. Best Fitness
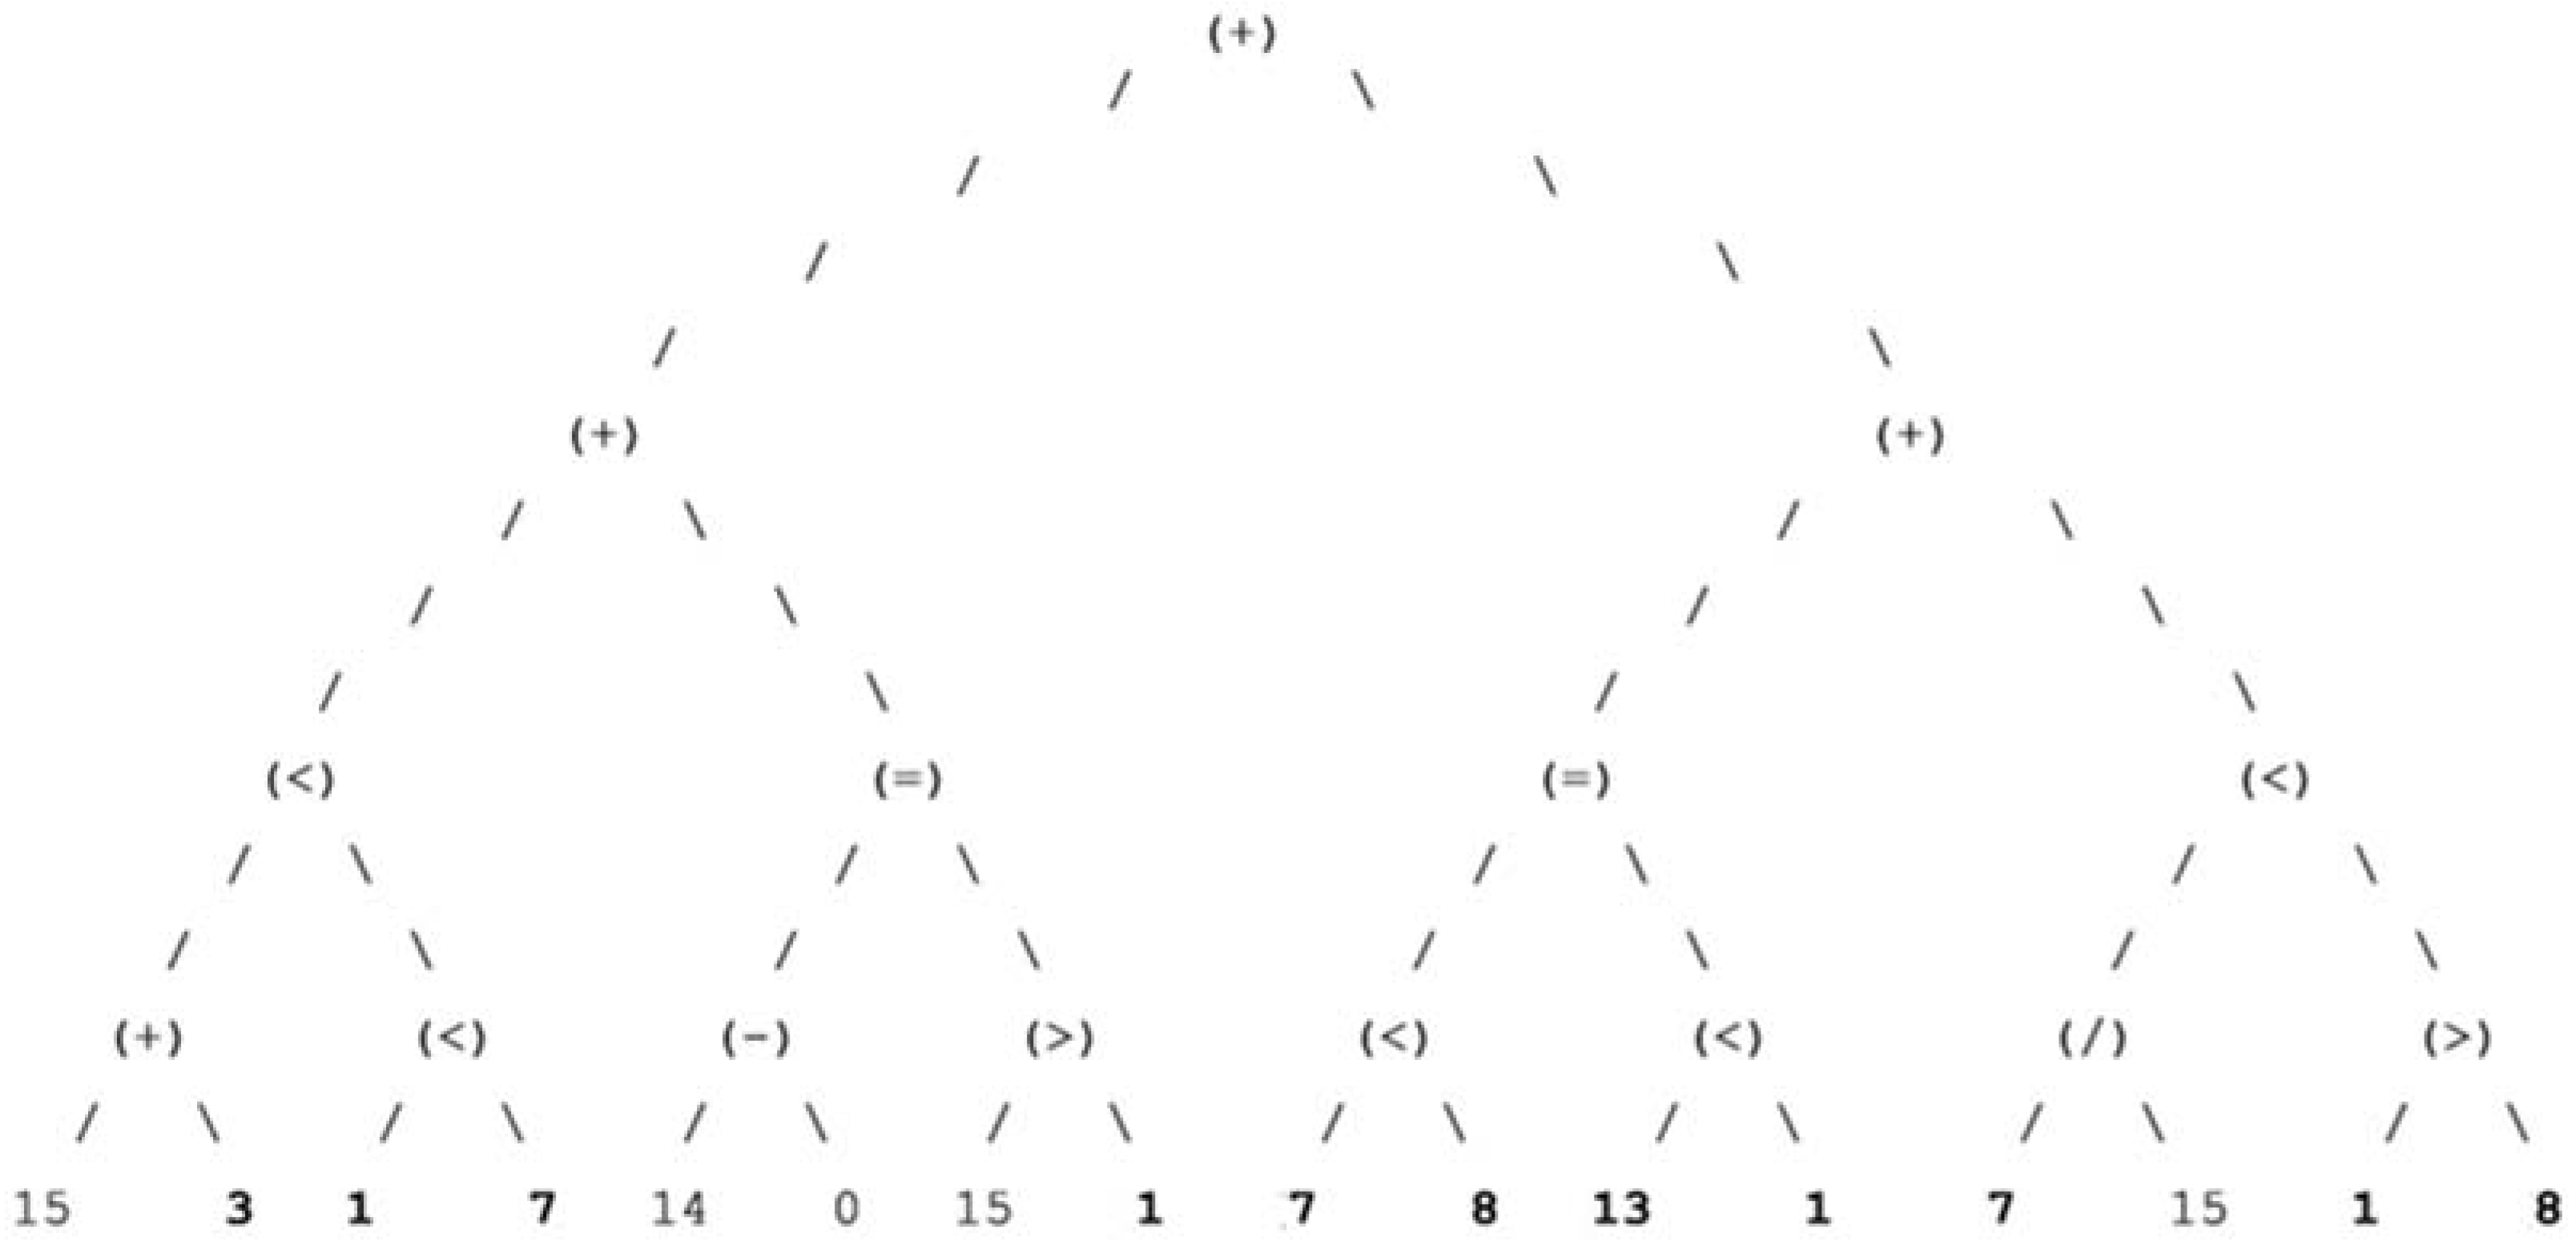
- Gender classification problem solved at the highest rate of Training Fitness = 95.00%, Validation Fitness = 95.30%, Testing Fitness = 92.50% (Table 2);
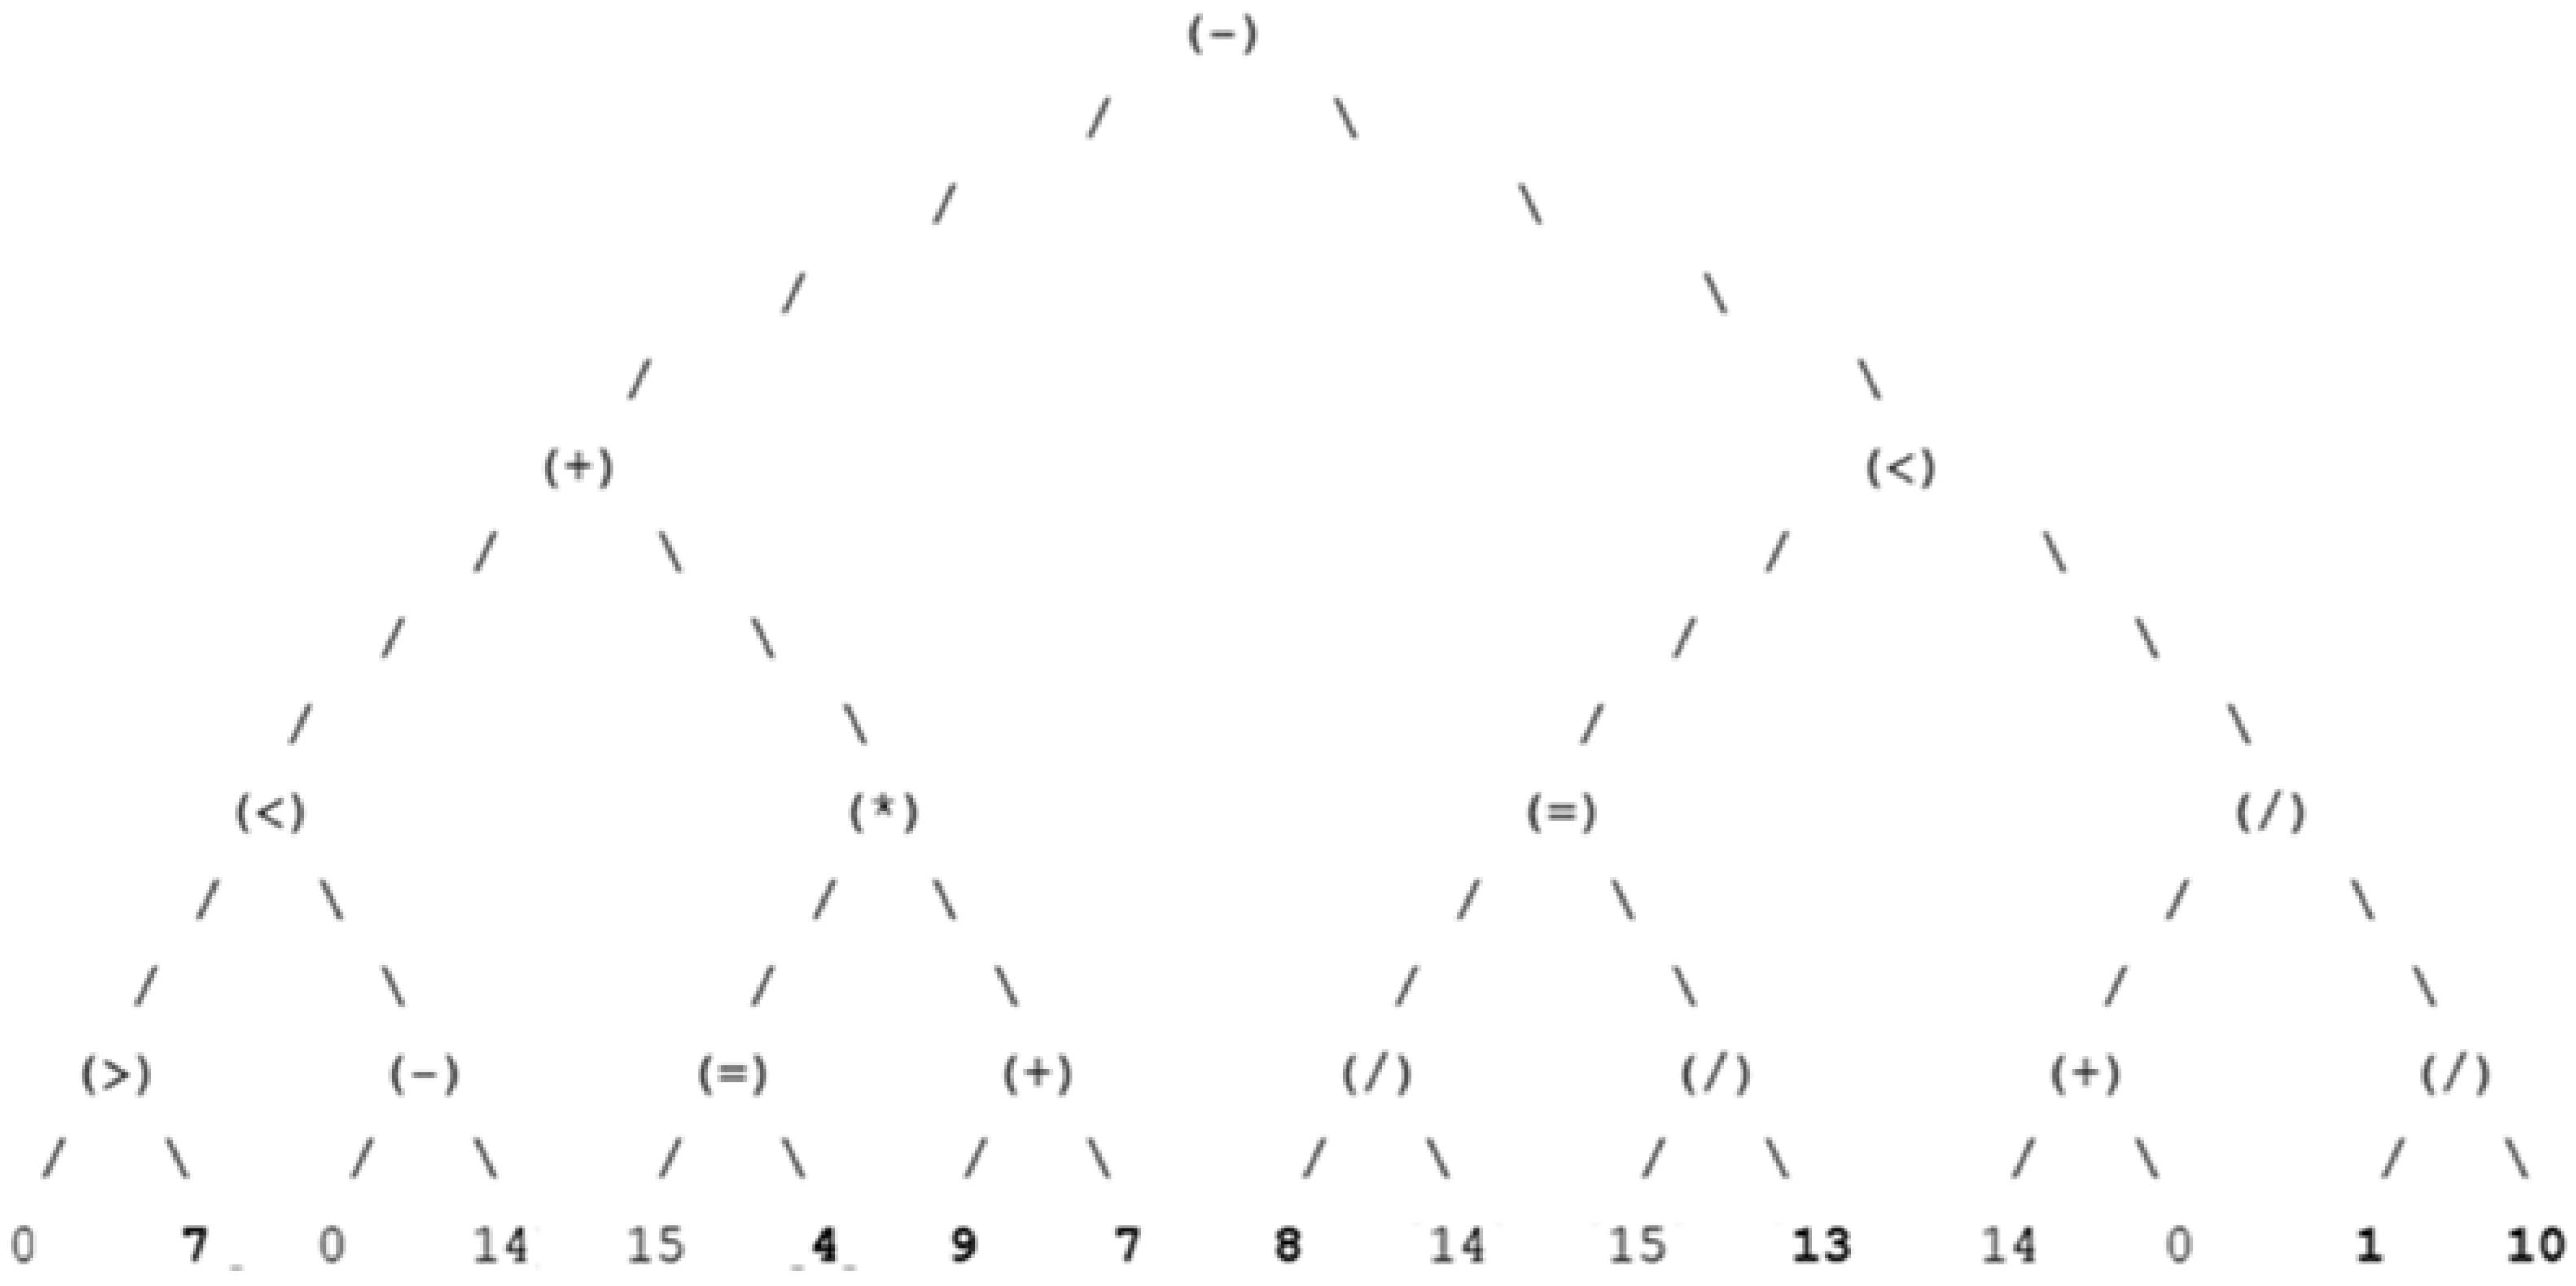
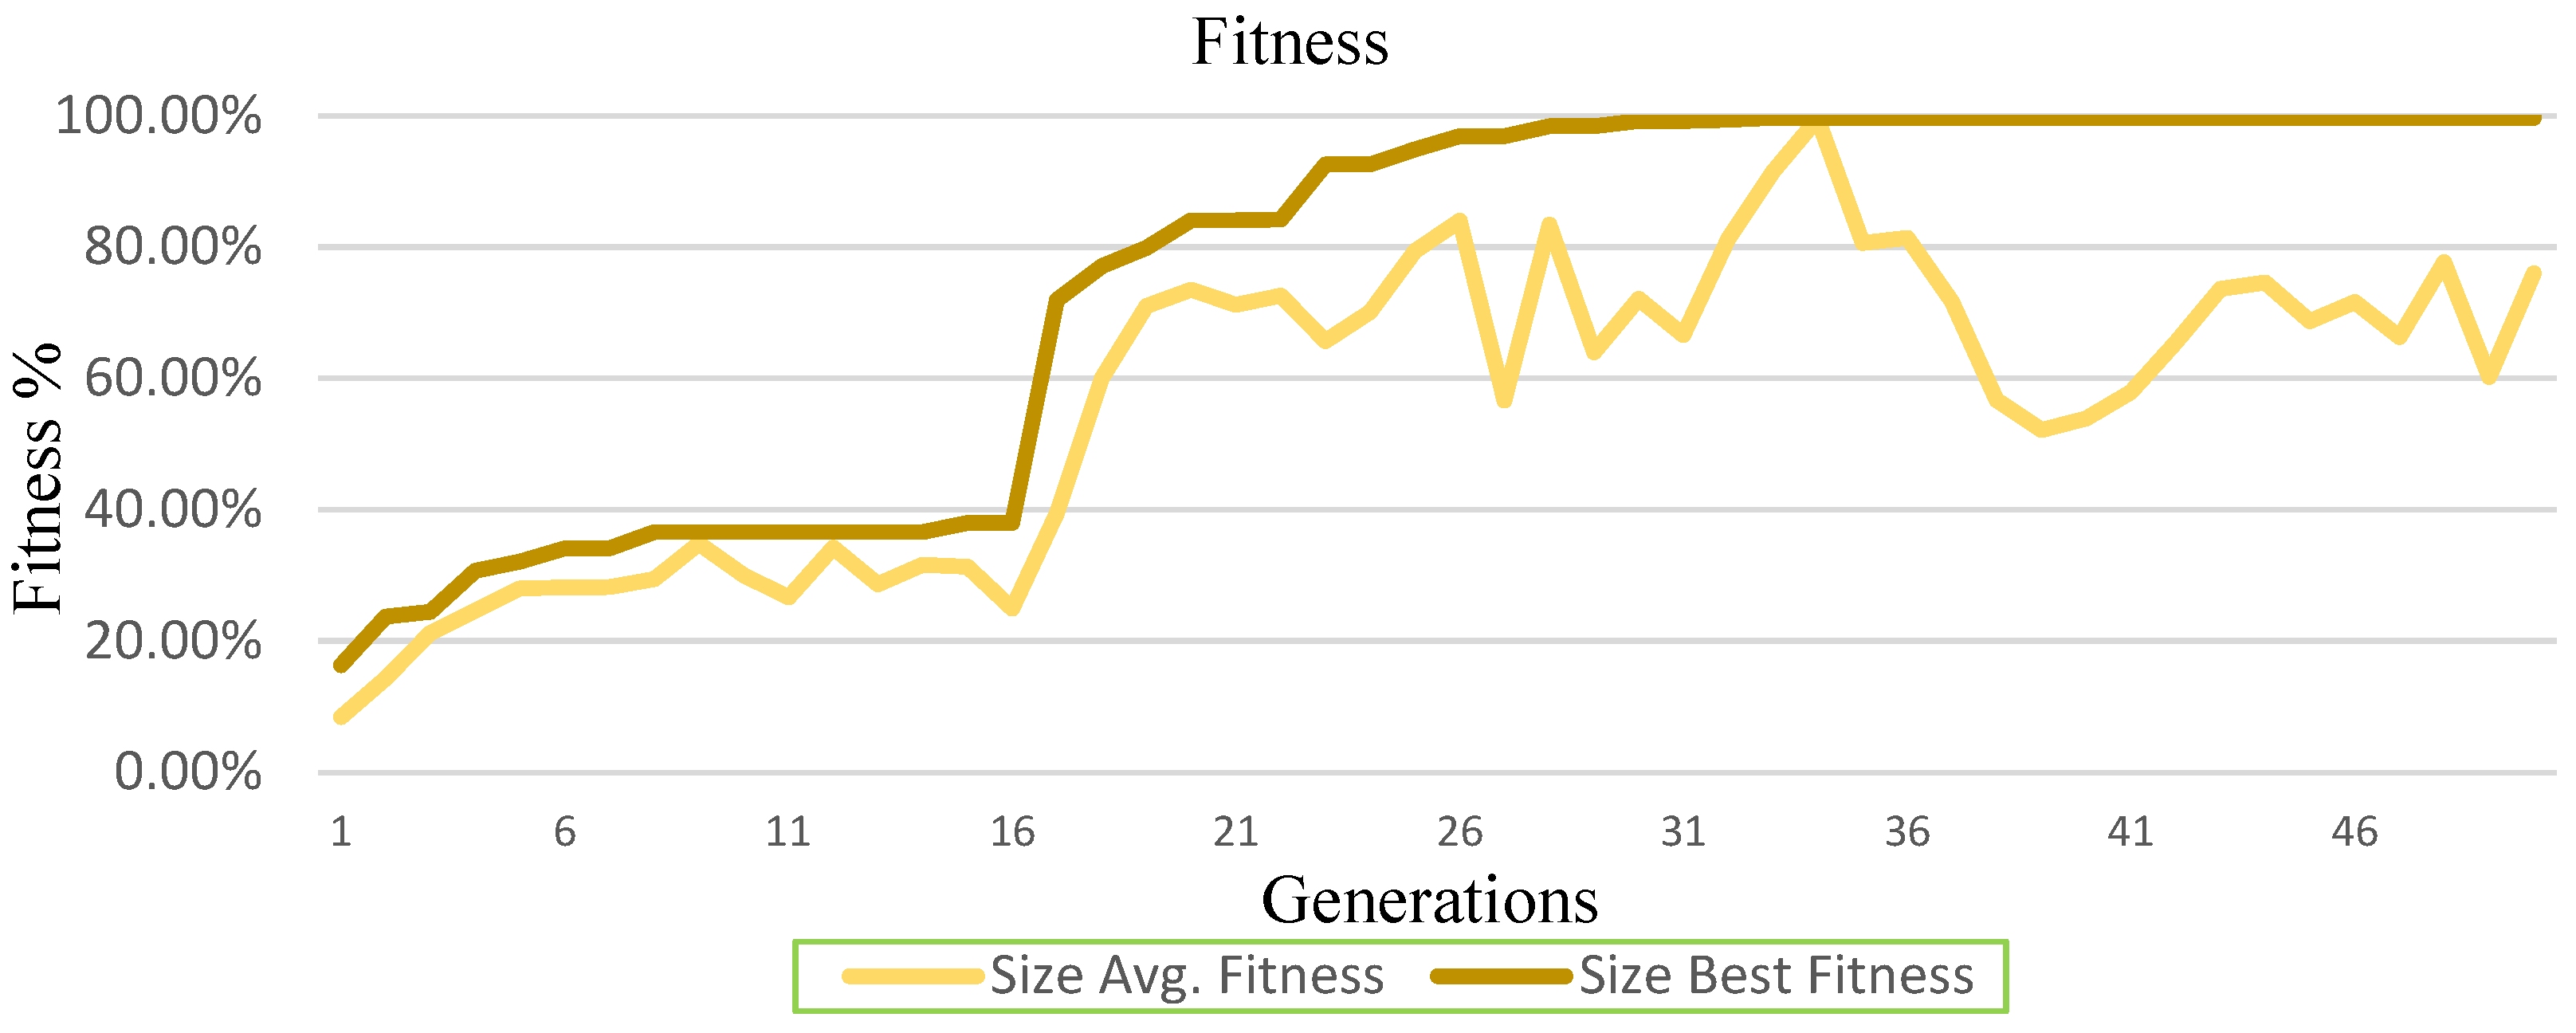
- Household size classification problem solved at the highest rate of Training Fitness = 99.70%, Validation Fitness = 99.70%, Testing Fitness = 99.80% (Table 3);
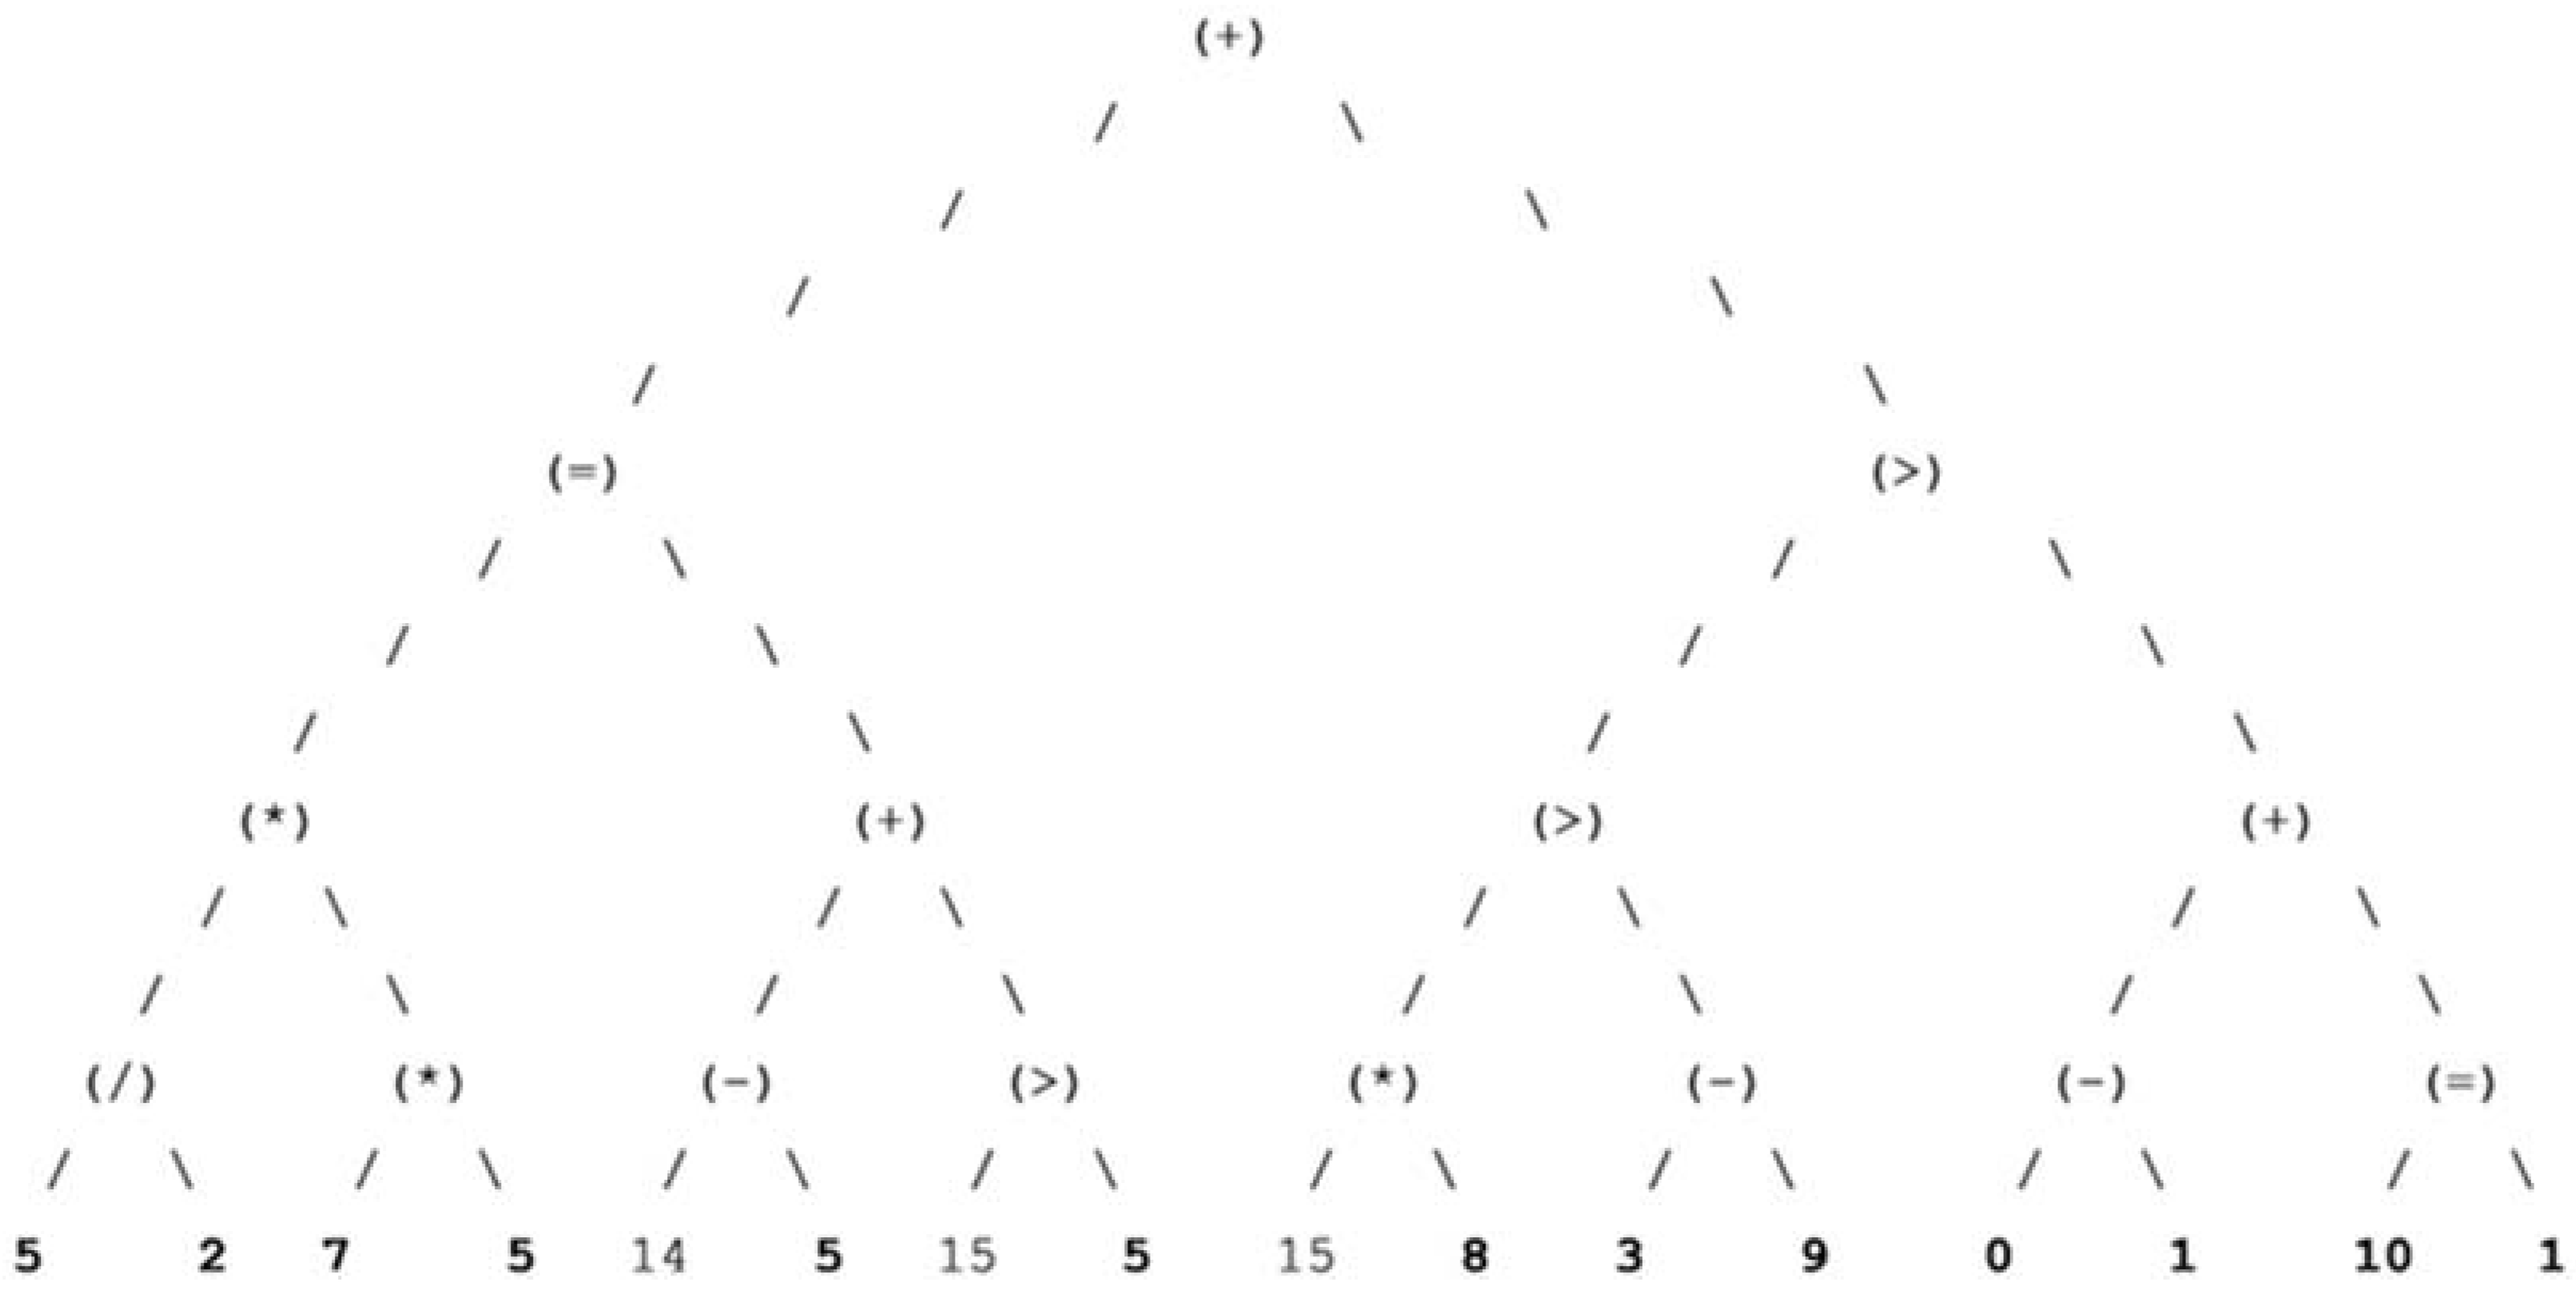
- Household Monthly Income classification problem solved at the highest rate of Training Fitness = 85.00%, Validation Fitness = 85.80%, Testing Fitness = 86.50% (Table 4).
4.1.2. Optimal Decision Trees
4.1.3. Dominant Decision Trees Representation
4.1.4. Best Chromosome Sequence & Decision Tree Representation
- Gender elitist chromosome: (15) (3) (1) (7) (14) (0) (15) (1) (7) (8) (13) (1) (7) (15) (1) (8)—92.5% Fitness;
- Household Size elitist chromosome: (0) (7) (0) (14) (15) (4) (9) (7) (8) (14) (15) (13) (14) (0) (1) (10)—99.8% Fitness;
- Household Monthly Income elitist chromosome: (5) (2) (7) (5) (14) (5) (15) (5) (15) (8) (3) (9) (0) (1) (10) (1)—86.5% Fitness.
4.1.5. Classification Fitness Graphical Representation
4.1.6. Average Genes Frequency
5. Discussion
5.1. Genetic Algorithm Wrapper Model Design
5.2. Genetic Algorithm Wrapper Model Application on Consumers Data
5.2.1. Generations’ Fitness
5.2.2. Best Fitness
5.2.3. Optimal Decision Trees and Graphical Representation
5.2.4. Best Chromosomes
5.2.5. Best Chromosomes’ Genes Frequency
- v5 (First) occurring four times (36.36%—When you find Greek products in the supermarkets do you prefer them over the imported products from abroad?);
- v7 (Third) occurring one time (9.09%—Do you want the companies from which you choose to make some of your purchases to inform you in detail about the measures they have taken regarding coronavirus protection?);
- v13 (Seventh) occurring three times (27.27%—The health crisis has affected the way we purchase.);
- v14 (Eighth) occurring two times (18.18%—During the health crisis the quantities we buy from the Super Markets have increased.);
- v22 (Thirteenth) occurring one time (9.09%—Approximately how much money do you spend every time you shop at the supermarkets now that we have a coronavirus problem (today)?);
- v5 (First) occurring one time (12.50%—When you find Greek products in the supermarkets do you prefer them over the imported products from abroad?);
- v8 (Fourth) occurring one time (12.50%—After the health crisis, things will return to normal relatively quickly.);
- v13 (Seventh) occurring two times (25.00%—The health crisis has affected the way we purchase.);
- v14 (Eighth) occurring one time (12.50%—During the health crisis the quantities we buy from the supermarkets have increased.);
- v15 (Ninth) occurring one time (12.50%—The health crisis has boosted online shopping.);
- v17 (Tenth) occurring one time (12.50%—We buy more from brands that have offers during this period.);
- v22 (Thirteenth) occurring one time (12.50%—Approximately how much money do you spend every time you shop at the supermarkets now that we have a coronavirus problem (today)?).
- v5 (First) occurring two times (14.29%—When you find Greek products in the supermarkets do you prefer them over the imported products from abroad?);
- v6 (Second) occurring one time (7.14%—During the health crisis (today) do you prefer Greek products more than before?);
- v7 (Third) occurring one time (7.14%—Do you want the companies from which you choose to make some of your purchases to inform you in detail about the measures they have taken regarding coronavirus protection?);
- v9 (Fifth) occurring four times (28.57%—After the health crisis, social life will be the same as before.);
- v13 (Seventh) occurring one time (7.14%—The health crisis has affected the way we purchase.);
- v14 (Eighth) occurring one time (7.14%—During the health crisis the quantities we buy from the Super Markets have increased.);
- v15 (Ninth) occurring one time (7.14%—The health crisis has boosted online shopping.);
- v17 (Tenth) occurring one time (7.14%—We buy more from brands that have offers during this period.);
5.2.6. Average Chromosomes’ Genes Frequency
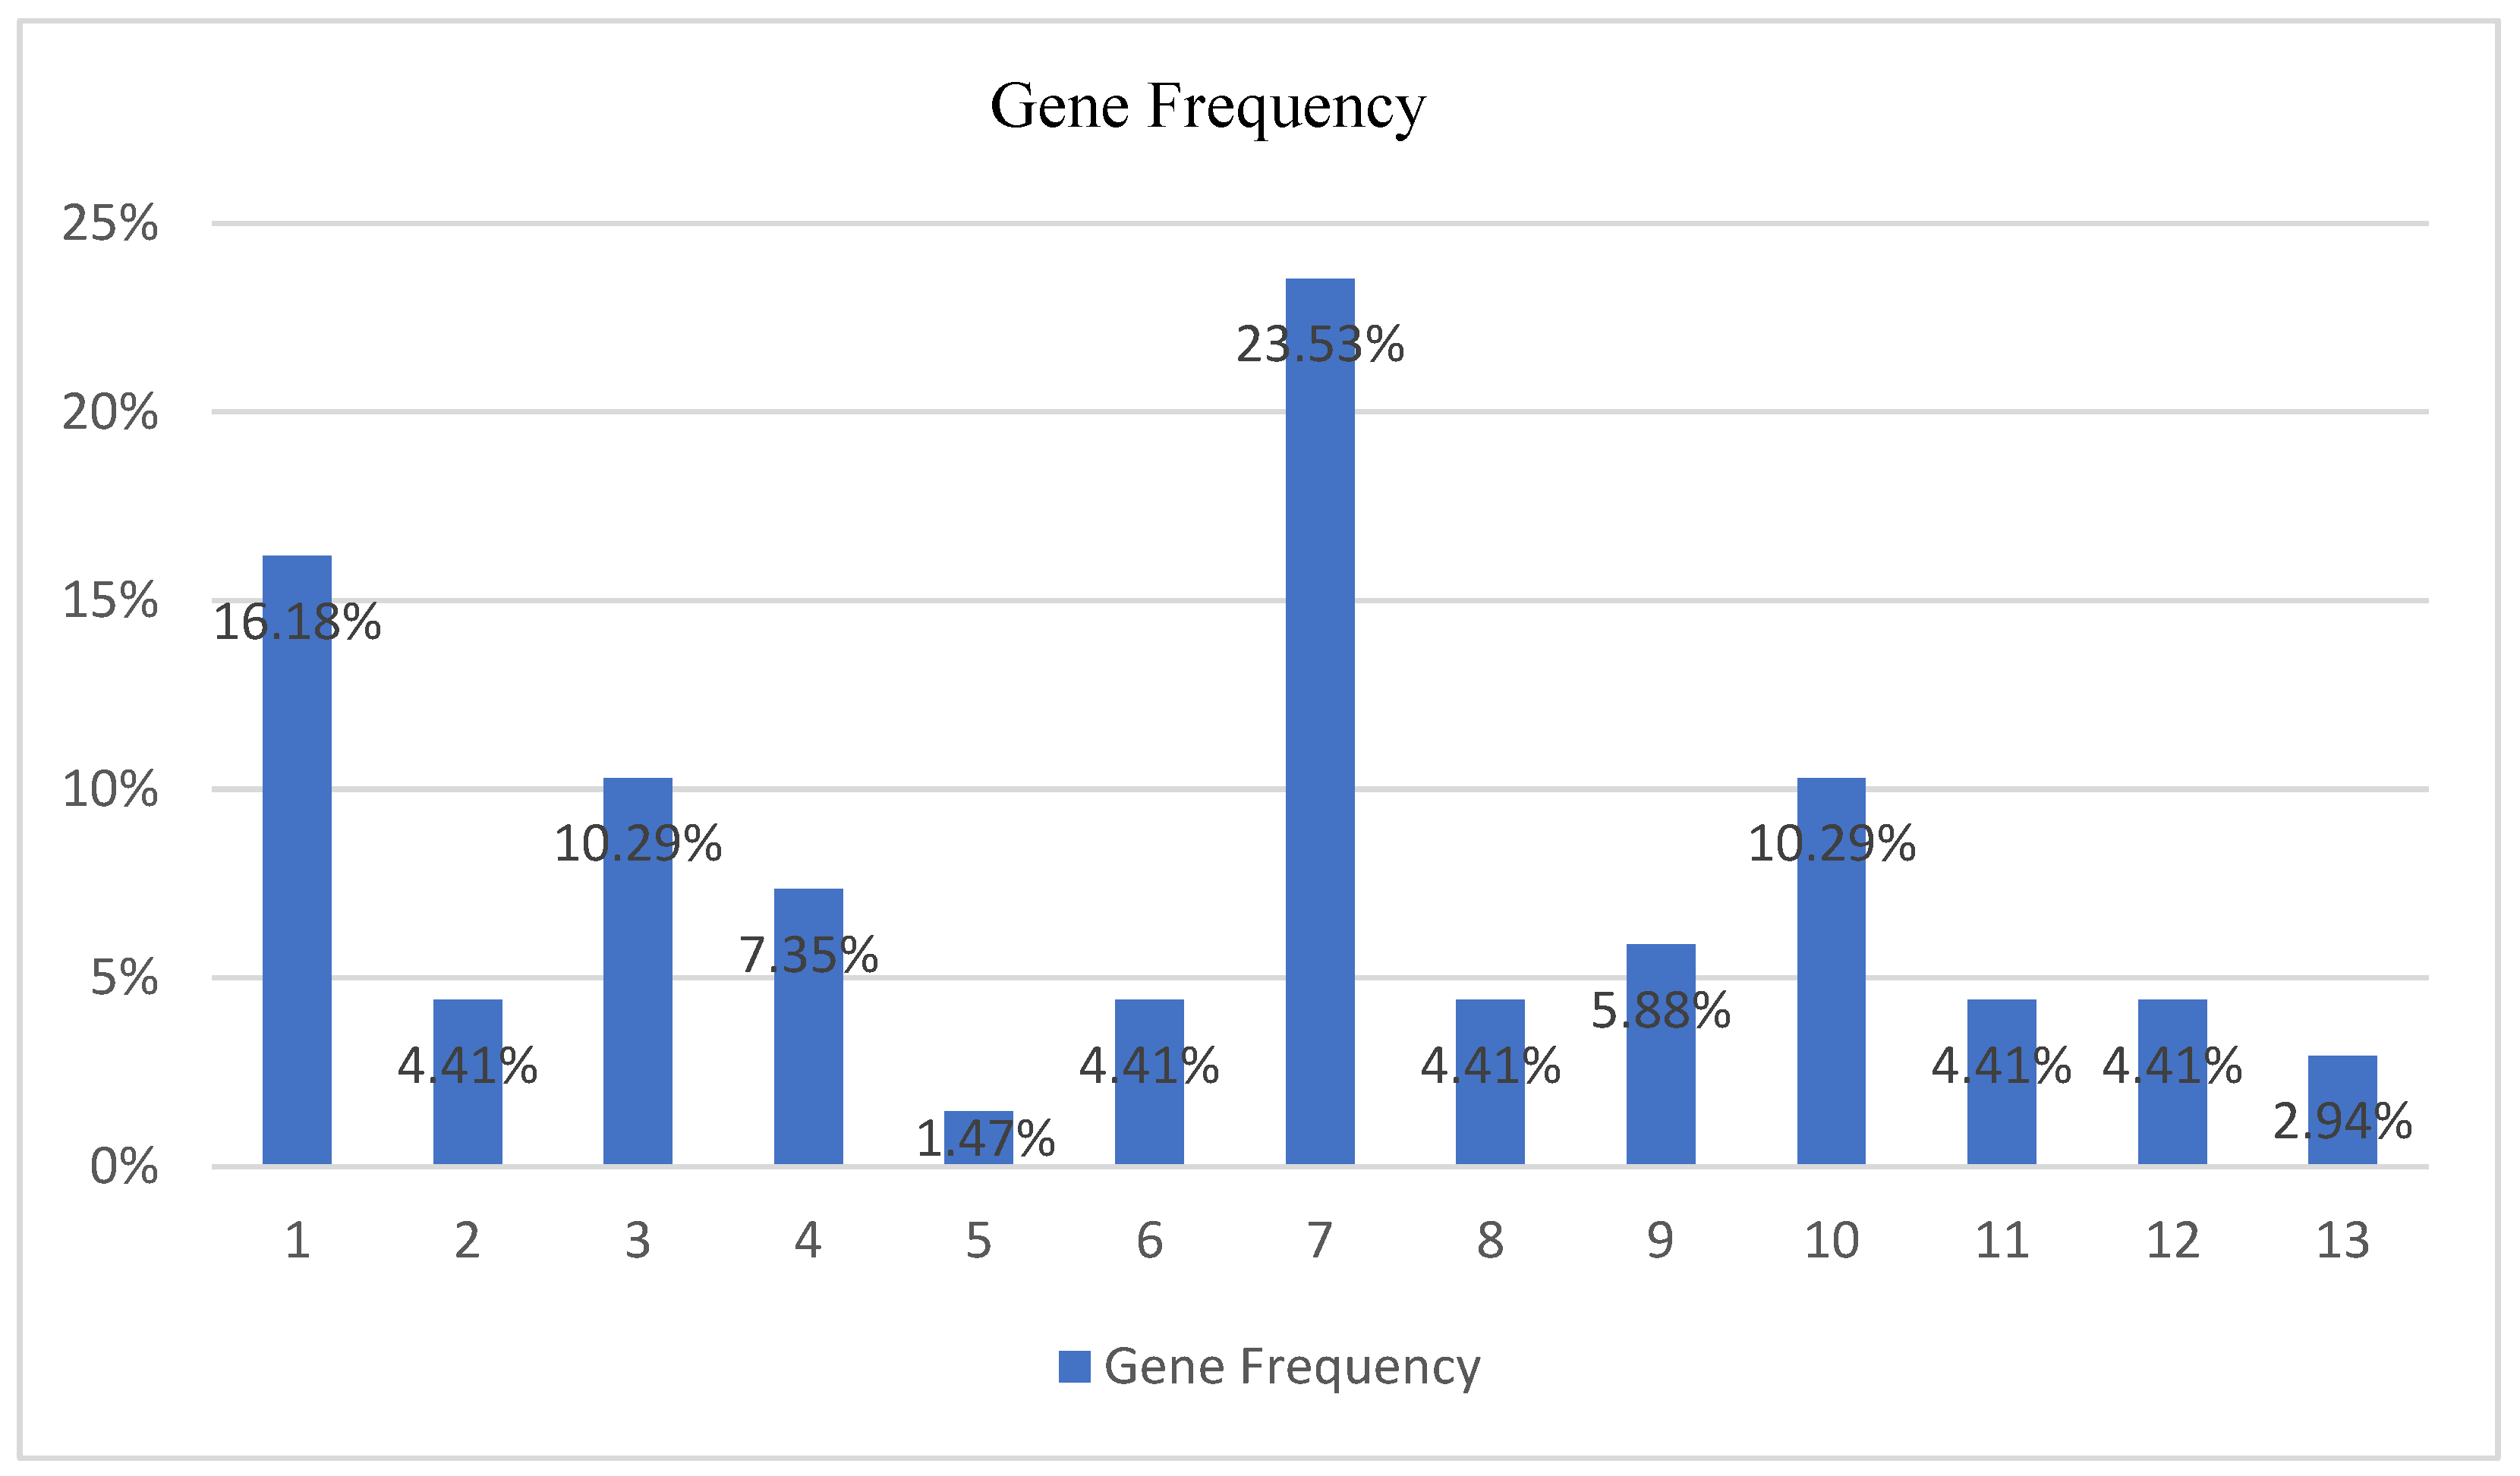
- First gene (v5—16.18%—When you find Greek products in the supermarkets do you prefer them over the imported products from abroad?);
- Third gene (v7—10.29%—Do you want the companies from which you choose to make some of your purchases to inform you in detail about the measures they have taken regarding coronavirus protection?);
- Seventh gene (v13—23.53%—The health crisis has affected the way we purchase.);
- Tenth gene (v17—10.29%—We buy more from brands that have offers during this period.);
- First gene (v5—18.92%—When you When you find Greek products in the supermarkets do you prefer them over the imported products from abroad?);
- Second gene (v6—8.11%—During the health crisis (today) do you prefer Greek products more than before?);
- Third gene (v7—8.11%—Do you want the companies from which you choose to make some of your purchases to inform you in detail about the measures they have taken regarding coronavirus protection?);
- Fifth gene (v9—10.81%—After the health crisis, social life will be the same as before.);
- Eighth gene (v14—8.11%—During the health crisis the quantities we buy from the Super Markets have increased).
- First gene (v5—15.62%—When you When you find Greek products in the supermarkets do you prefer them over the imported products from abroad?);
- Third gene (v7—17.18%—Do you want the companies from which you choose to make some of your purchases to inform you in detail about the measures they have taken regarding coronavirus protection?);
- Fourth gene (v8—7.81%—After the health crisis, things will return to normal relatively quickly.);
- Seventh gene (v13—10.93%—The health crisis has affected the way we purchase.);
- Ninth gene (v15—10.93%—The health crisis has boosted online shopping.);
- Thirteenth gene (v22—7.81%—Approximately how much money do you spend every time you shop at the supermarkets now that we have a coronavirus problem (today)?).
5.2.7. Rules Extraction
- The GA wrapper performs exceptionally well in small numeric datasets reaching classification accuracies above 90%;
- The current GA wrapper configuration, including the probability operators’ values, the number chromosomes, and the number of generations provide valid results;
- Referring to the Gender class and based on the average gene frequency of occurrence, a subset of four specific genes, including the first gene (v5—16.18%), the third gene (v7—10.29%), the seventh gene (v13—23.53%), and the tenth gene (v17—10.29%), can have a significant impact on defining the purchasing preferences based on gender differences;
- Referring to the Household Size class and based on the average gene frequency of occurrence, a subset of five specific genes, including the first gene (v5—18.92%), the second gene (v6—8.11%), the third gene (v7—8.11%), the fifth gene (v9—10.81%), and the eighth gene (v14—8.11%), can have a significant impact on defining the purchasing preferences based on the household size differences;
- Referring to the Household Monthly Income class and based on the average gene frequency of occurrence, a subset of six specific genes, including the first gene (v5—15.62%), the third gene (v7—17.18%), the fourth gene (v8—7.81%), the seventh gene (v13—10.93%), the ninth gene (v15—10.93%), and the thirteenth gene (v22—7.81%), can have a significant impact on defining the purchasing preferences based on the household monthly income impacts.
5.3. Research Contribution
- Combining the computer science theory and marketing science for better decision-making
- Providing examples of artificial intelligence applications on marketing data
- Conducting machine learning classification and optimisation methods performance evaluation
- Developing a machine learning method using classification and optimisation algorithms.
- Introducing a new way of generating subsets of features; instead of generating and classifying the optimal subsets of features as in previous research, this study calculates the features’ occurrence and their overall sequence of occurrence during the classification process. Thus, it provides a range of weighted features. Certain weights distinguish the best features, and decision-makers can determine the best final subsets.
- Keeping a track of the optimisation process by demonstrating the average and best fitness per generation
- Encapsulating the role of feature selection methods from past research works
- Introducing a variety of feature selection methods for optimal subset creation by calculating the features that mostly participated in the classification process and assigning certain weights of occurrence
- Producing subsets of features that affect consumers’ decisions
- Predicting consumer behaviour using marketing data insights
- Predicting consumer behaviour based on factors such as gender, household size, and household monthly income
- Providing a roadmap for conceiving, designing, developing, applying, and evaluating data optimisation through a data classification method [8]
5.4. Future Work
6. Conclusions
Author Contributions
Funding
Institutional Review Board Statement
Informed Consent Statement
Data Availability Statement
Acknowledgments
Conflicts of Interest
References
- Beligiannis, G.; Skarlas, L.; Likothanassis, S. A Generic Applied Evolutionary Hybrid Technique. IEEE Signal Process. Mag. 2004, 21, 28–38. [Google Scholar] [CrossRef]
- Sung, K.; Cho, S. GA SVM Wrapper Ensemble for Keystroke Dynamics Authentication. Adv. Biom. 2005, 3832, 654–660. [Google Scholar]
- Yu, E.; Cho, S. Ensemble Based on GA Wrapper Feature Selection. Comput. Ind. Eng. 2006, 51, 111–116. [Google Scholar] [CrossRef]
- Huang, J.; Cai, Y.; Xu, X. A Hybrid Genetic Algorithm for Feature Selection Wrapper Based on Mutual Information. Pattern Recognit. Lett. 2007, 28, 1825–1844. [Google Scholar] [CrossRef]
- Rokach, L. Genetic Algorithm-based Feature Set Partitioning for Classification Problems. Pattern Recognit. 2008, 41, 1676–1700. [Google Scholar] [CrossRef] [Green Version]
- Wang, D.; Zhang, Z.; Bai, R.; Mao, Y. A Hybrid System with Filter Approach and Multiple Population Genetic Algorithm for Feature Selection in Credit scoring. J. Comput. Appl. Math. 2018, 329, 307–321. [Google Scholar] [CrossRef]
- Soufan, O.; Kleftogiannis, D.; Kalnis, P.; Bajic, V. DWFS: A Wrapper Feature Selection Tool Based on a Parallel Genetic Algorithm. PLoS ONE 2015, 10, e0117988. [Google Scholar] [CrossRef] [PubMed]
- Rahmadani, S.; Dongoran, A.; Zarlis, M.; Zakarias. Comparison of Naive Bayes and Decision Tree on Feature Selection Using Genetic Algorithm for Classification Problem. J. Phys. Conf. Ser. 2018, 978, 012087. [Google Scholar] [CrossRef]
- Hammami, M.; Bechikh, S.; Hung, C.; Ben Said, L. A Multi-objective Hybrid Filter-Wrapper Evolutionary Approach for Feature Selection. Memetic Comput. 2018, 11, 193–208. [Google Scholar] [CrossRef]
- Dogadina, E.P.; Smirnov, M.V.; Osipov, A.V.; Suvorov, S.V. Evaluation of the Forms of Education of High School Students Using a Hybrid Model Based on Various Optimization Methods and a Neural Network. Informatics 2021, 8, 46. [Google Scholar] [CrossRef]
- Chowdhury, A.; Rosenthal, J.; Waring, J.; Umeton, R. Applying Self-Supervised Learning to Medicine: Review of the State of the Art and Medical Implementations. Informatics 2021, 8, 59. [Google Scholar] [CrossRef]
- Kohavi, R. Wrappers for Performance Enhancement and Oblivious Decision Graphs. Ph.D. Thesis, Stanford University, Stanford, CA, USA, 1996. [Google Scholar]
- Mitchell, T.M. Machine Learning; McGraw-Hill: New York, NY, USA, 1997. [Google Scholar]
- Russel, S.; Norvig, P. Artificial Intelligence: A Modern Approach, 3rd ed.; Prentice Hall: Hoboken, NJ, USA, 2003. [Google Scholar]
- Witten, I.; Frank, E.; Hall, M. Data Mining; Morgan Kaufmann Publishers: Burlington, MA, USA, 2011. [Google Scholar]
- Quinlan, J. Induction of Decision Trees. Mach. Learn. 1986, 1, 81–106. [Google Scholar] [CrossRef] [Green Version]
- Quinlan, J. Simplifying Decision Trees. Int. J. Man-Mach. Stud. 1987, 27, 221–234. [Google Scholar] [CrossRef] [Green Version]
- Blockeel, H.; De Raedt, L. Top-down Induction of First-order Logical Decision Trees. Artif. Intell. 1998, 101, 285–297. [Google Scholar] [CrossRef] [Green Version]
- Mitchell, M. An Introduction to Genetic Algorithms; The MIT Press: Cambridge, MA, USA, 1996. [Google Scholar]
- Whitley, D.A. Genetic Algorithm Tutorial. Stat. Comput. 1994, 4, 65–85. [Google Scholar] [CrossRef]
- Hsu, W.H. Genetic Wrappers for Feature Selection in Decision Tree Induction and Variable Ordering in Bayesian Network Structure learning. Inf. Sci. 2004, 163, 103–122. [Google Scholar] [CrossRef]
- Davis, L. Handbook of Genetic Algorithms; Van Nostrand Reinhold: New York, NY, USA, 1991; p. 115. [Google Scholar]
- Theodoridis, P.K.; Kavoura, A. The Impact of COVID-19 on Consumer Behaviour: The Case of Greece. In Strategic Innovative Marketing and Tourism in the COVID-19 Era, Springer Proceedings in Business and Economics; Kavoura, A., Havlovic, S.J., Totskaya, N., Eds.; Springer: Ionian Islands, Greece, 2021; pp. 11–18. [Google Scholar] [CrossRef]
- Data Ethics. Available online: https://dataethics.eu/danish-companies-behind-seal-for-digital-responsibility (accessed on 15 August 2020).










| Position | Genes | Description | Value | Label |
|---|---|---|---|---|
| 0 (Class) | v1 | Gender | Male | 1 |
| Female | 2 | |||
| 0 (Class) | v2 | Household’s Size | 1 | 1 |
| 2 | 2 | |||
| 3 | 3 | |||
| 4 | 4 | |||
| >=5 | 5 | |||
| 0 (Class) | v4 | Household’s Monthly Income | <500.00 € | 1 |
| 501.00–1000.00 € | 2 | |||
| 1001.00–1500.00 € | 3 | |||
| 1501.00–2000.00 € | 4 | |||
| >2001.00 € | 5 | |||
| 1 | v5 | When you find Greek products in the supermarkets do you prefer them over the imported products from abroad? | Yes | 1 |
| No | 2 | |||
| 2 | v6 | During the health crisis (today) do you prefer Greek products more than before? | Yes | 1 |
| No | 2 | |||
| Same As Before | 3 | |||
| 3 | v7 | Do you want the companies from which you choose to make some of your purchases to inform you in detail about the measures they have taken regarding coronavirus protection? | Yes | 1 |
| No | 2 | |||
| 4 | v8 | After the health crisis, things will return to normal relatively quickly | Abs Disagree | 1 |
| Disagree | 2 | |||
| Neutral | 3 | |||
| Agree | 4 | |||
| Abs Agree | 5 | |||
| 5 | v9 | After the health crisis, social life will be the same as before | Abs Disagree | 1 |
| Disagree | 2 | |||
| Neutral | 3 | |||
| Agree | 4 | |||
| Abs Agree | 5 | |||
| 6 | v11 | During the health crisis my family makes savings efforts | Abs Disagree | 1 |
| Disagree | 2 | |||
| Neutral | 3 | |||
| Agree | 4 | |||
| Abs Agree | 5 | |||
| 7 | v13 | The health crisis has affected the way we purchase | Abs Disagree | 1 |
| Disagree | 2 | |||
| Neutral | 3 | |||
| Agree | 4 | |||
| Abs Agree | 5 | |||
| 8 | v14 | During the health crisis the quantities we buy from the Super Markets have increased | Abs Disagree | 1 |
| Disagree | 2 | |||
| Neutral | 3 | |||
| Agree | 4 | |||
| Abs Agree | 5 | |||
| 9 | v15 | The health crisis has boosted online shopping | Abs Disagree | 1 |
| Disagree | 2 | |||
| Neutral | 3 | |||
| Agree | 4 | |||
| Abs Agree | 5 | |||
| 10 | v17 | We buy more from brands that have offers during this period | Abs Disagree | 1 |
| Disagree | 2 | |||
| Neutral | 3 | |||
| Agree | 4 | |||
| Abs Agree | 5 | |||
| 11 | v18 | During the health crisis we have started trying new brands | Abs Disagree | 1 |
| Disagree | 2 | |||
| Neutral | 3 | |||
| Agree | 4 | |||
| Abs Agree | 5 | |||
| 12 | v20 | Do you buy more sparsely or more often compared to the pre-coronavirus era? | Less Frequently | 1 |
| The Same | 2 | |||
| More Frequently | 3 | |||
| 13 | v22 | Approximately how much money do you spend every time you shop at the supermarkets now that we have a coronavirus problem (today)? | <50 € | 1 |
| ≈50 € | 2 | |||
| >50 € | 3 | |||
| >100 € | 4 |
| Gender Generation Fitness | |||||
|---|---|---|---|---|---|
| Generation | Avg. Fitness | Best Fitness | Generation | Avg. Fitness | Best Fitness |
| Generation 0 | 0.323 | 0.400 | Generation 25 | 0.639 | 0.940 |
| Generation 1 | 0.379 | 0.399 | Generation 26 | 0.532 | 0.940 |
| Generation 2 | 0.389 | 0.400 | Generation 27 | 0.653 | 0.940 |
| Generation 3 | 0.399 | 0.400 | Generation 28 | 0.621 | 0.940 |
| Generation 4 | 0.392 | 0.400 | Generation 29 | 0.621 | 0.940 |
| Generation 5 | 0.397 | 0.420 | Generation 30 | 0.811 | 0.940 |
| Generation 6 | 0.393 | 0.420 | Generation 31 | 0.652 | 0.940 |
| Generation 7 | 0.395 | 0.420 | Generation 32 | 0.803 | 0.940 |
| Generation 8 | 0.406 | 0.455 | Generation 33 | 0.666 | 0.940 |
| Generation 9 | 0.418 | 0.455 | Generation 34 | 0.731 | 0.948 |
| Generation 10 | 0.417 | 0.455 | Generation 35 | 0.761 | 0.950 |
| Generation 11 | 0.428 | 0.483 | Generation 36 | 0.777 | 0.950 |
| Generation 12 | 0.414 | 0.514 | Generation 37 | 0.703 | 0.950 |
| Generation 13 | 0.443 | 0.558 | Generation 38 | 0.577 | 0.950 |
| Generation 14 | 0.474 | 0.558 | Generation 39 | 0.596 | 0.950 |
| Generation 15 | 0.509 | 0.558 | Generation 40 | 0.554 | 0.950 |
| Generation 16 | 0.522 | 0.919 | Generation 41 | 0.638 | 0.950 |
| Generation 17 | 0.594 | 0.940 | Generation 42 | 0.689 | 0.950 |
| Generation 18 | 0.609 | 0.940 | Generation 43 | 0.729 | 0.950 |
| Generation 19 | 0.661 | 0.940 | Generation 44 | 0.577 | 0.950 |
| Generation 20 | 0.884 | 0.940 | Generation 45 | 0.761 | 0.950 |
| Generation 21 | 0.651 | 0.940 | Generation 46 | 0.729 | 0.950 |
| Generation 22 | 0.519 | 0.940 | Generation 47 | 0.695 | 0.950 |
| Generation 23 | 0.631 | 0.940 | Generation 48 | 0.650 | 0.950 |
| Generation 24 | 0.620 | 0.940 | Generation 49 | 0.678 | 0.950 |
| Household Size Generation Fitness | |||||
|---|---|---|---|---|---|
| Generation | Avg. Fitness | Best Fitness | Generation | Avg. Fitness | Best Fitness |
| Generation 0 | 0.084 | 0.163 | Generation 25 | 0.840 | 0.969 |
| Generation 1 | 0.143 | 0.237 | Generation 26 | 0.566 | 0.969 |
| Generation 2 | 0.212 | 0.244 | Generation 27 | 0.834 | 0.984 |
| Generation 3 | 0.246 | 0.307 | Generation 28 | 0.640 | 0.984 |
| Generation 4 | 0.280 | 0.321 | Generation 29 | 0.721 | 0.992 |
| Generation 5 | 0.281 | 0.341 | Generation 30 | 0.666 | 0.992 |
| Generation 6 | 0.282 | 0.341 | Generation 31 | 0.813 | 0.994 |
| Generation 7 | 0.294 | 0.366 | Generation 32 | 0.915 | 0.997 |
| Generation 8 | 0.348 | 0.366 | Generation 33 | 0.996 | 0.997 |
| Generation 9 | 0.300 | 0.366 | Generation 34 | 0.806 | 0.997 |
| Generation 10 | 0.266 | 0.366 | Generation 35 | 0.814 | 0.997 |
| Generation 11 | 0.342 | 0.366 | Generation 36 | 0.717 | 0.997 |
| Generation 12 | 0.286 | 0.366 | Generation 37 | 0.567 | 0.997 |
| Generation 13 | 0.316 | 0.366 | Generation 38 | 0.521 | 0.997 |
| Generation 14 | 0.313 | 0.380 | Generation 39 | 0.539 | 0.997 |
| Generation 15 | 0.249 | 0.380 | Generation 40 | 0.579 | 0.997 |
| Generation 16 | 0.394 | 0.719 | Generation 41 | 0.655 | 0.997 |
| Generation 17 | 0.600 | 0.771 | Generation 42 | 0.736 | 0.997 |
| Generation 18 | 0.710 | 0.799 | Generation 43 | 0.746 | 0.997 |
| Generation 19 | 0.735 | 0.841 | Generation 44 | 0.687 | 0.997 |
| Generation 20 | 0.712 | 0.841 | Generation 45 | 0.716 | 0.997 |
| Generation 21 | 0.726 | 0.842 | Generation 46 | 0.663 | 0.997 |
| Generation 22 | 0.657 | 0.926 | Generation 47 | 0.777 | 0.997 |
| Generation 23 | 0.701 | 0.926 | Generation 48 | 0.602 | 0.997 |
| Generation 24 | 0.794 | 0.949 | Generation 49 | 0.760 | 0.997 |
| Household Monthly Income Generation Fitness | |||||
|---|---|---|---|---|---|
| Generation | Avg. Fitness | Best Fitness | Generation | Avg. Fitness | Best Fitness |
| Generation0 | 0.128 | 0.226 | Generation 25 | 0.757 | 0.836 |
| Generation 1 | 0.200 | 0.231 | Generation 26 | 0.785 | 0.836 |
| Generation 2 | 0.223 | 0.288 | Generation 27 | 0.611 | 0.836 |
| Generation 3 | 0.242 | 0.387 | Generation 28 | 0.642 | 0.836 |
| Generation 4 | 0.316 | 0.387 | Generation 29 | 0.760 | 0.836 |
| Generation 5 | 0.336 | 0.387 | Generation 30 | 0.611 | 0.836 |
| Generation 6 | 0.512 | 0.742 | Generation 31 | 0.476 | 0.836 |
| Generation 7 | 0.538 | 0.742 | Generation 32 | 0.644 | 0.836 |
| Generation 8 | 0.562 | 0.816 | Generation 33 | 0.690 | 0.836 |
| Generation 9 | 0.657 | 0.816 | Generation 34 | 0.727 | 0.836 |
| Generation 10 | 0.570 | 0.816 | Generation 35 | 0.703 | 0.836 |
| Generation 11 | 0.680 | 0.820 | Generation 36 | 0.679 | 0.836 |
| Generation 12 | 0.666 | 0.827 | Generation 37 | 0.747 | 0.836 |
| Generation 13 | 0.648 | 0.827 | Generation 38 | 0.635 | 0.842 |
| Generation 14 | 0.713 | 0.827 | Generation 39 | 0.646 | 0.842 |
| Generation 15 | 0.713 | 0.827 | Generation 40 | 0.646 | 0.842 |
| Generation 16 | 0.669 | 0.827 | Generation 41 | 0.615 | 0.842 |
| Generation 17 | 0.633 | 0.827 | Generation 42 | 0.793 | 0.842 |
| Generation 18 | 0.793 | 0.827 | Generation 43 | 0.677 | 0.842 |
| Generation 19 | 0.678 | 0.827 | Generation 44 | 0.674 | 0.850 |
| Generation 20 | 0.594 | 0.827 | Generation 45 | 0.603 | 0.850 |
| Generation 21 | 0.743 | 0.828 | Generation 46 | 0.831 | 0.850 |
| Generation 22 | 0.607 | 0.828 | Generation 47 | 0.815 | 0.850 |
| Generation 23 | 0.766 | 0.835 | Generation 48 | 0.684 | 0.850 |
| Generation 24 | 0.551 | 0.836 | Generation 49 | 0.732 | 0.850 |
| Training Votes | Validation Votes | Testing Votes |
|---|---|---|
| Tree (0) = 933 | Tree (0) = 0 | Tree (0) = 0 |
| Tree (1) = 263,126 | Tree (1) = 236 | Tree (1) = 16 |
| Tree (2) = 58,444 | Tree (2) = 0 | Tree (2) = 0 |
| Tree (3) = 70,777 | Tree (3) = 44 | Tree (3) = 0 |
| Tree (4) = 3,023,415 | Tree (4) = 2656 MAX | Tree (4) = 263 MAX |
| Tree (5) = 2580 | Tree (5) = 0 | Tree (5) = 0 |
| Tree (6) = 28,321 | Tree (6) = 0 | Tree (6) = 0 |
| Tree (7) = 422,696 | Tree (7) = 12 | Tree (7) = 0 |
| Tree (8) = 882,731 | Tree (8) = 1288 | Tree (8) = 0 |
| Tree (9) = 4,503,777 MAX | Tree (9) = 2484 | Tree (9) = 202 |
| Training Votes | Validation Votes | Testing Votes |
|---|---|---|
| Tree (0) = 6,000,732 MAX | Tree (0) = 4827 MAX | Tree (0) = 454 MAX |
| Tree (1) = 452,433 | Tree (1) = 185 | Tree (1) = 6 |
| Tree (2) = 66,823 | Tree (2) = 252 | Tree (2) = 0 |
| Tree (3) = 14,962 | Tree (3) = 0 | Tree (3) = 0 |
| Tree (4) = 1,437,664 | Tree (4) = 418 | Tree (4) = 0 |
| Tree (5) = 124,103 | Tree (5) = 14 | Tree (5) = 0 |
| Tree (6) = 169,510 | Tree (6) = 164 | Tree (6) = 0 |
| Tree (7) = 102,219 | Tree (7) = 168 | Tree (7) = 0 |
| Tree (8) = 145,125 | Tree (8) = 72 | Tree (8) = 0 |
| Tree (9) = 720,087 | Tree (9) = 578 | Tree (9) = 21 |
| Training Votes | Validation Votes | Testing Votes |
|---|---|---|
| Tree (0) = 6,582,160 MAX | Tree (0) = 5444 MAX | Tree (0) = 429 MAX |
| Tree (1) = 80,157 | Tree (1) = 0 | Tree (1) = 0 |
| Tree (2) = 8805 | Tree (2) = 8 | Tree (2) = 0 |
| Tree (3) = 11,732 | Tree (3) = 42 | Tree (3) = 0 |
| Tree (4) = 61,907 | Tree (4) = 2 | Tree (4) = 3 |
| Tree (5) = 502,862 | Tree (5) = 18 | Tree (5) = 3 |
| Tree (6) = 1662 | Tree (6) = 0 | Tree (6) = 0 |
| Tree (7) = 208,654 | Tree (7) = 56 | Tree (7) = 0 |
| Tree (8) = 457,921 | Tree (8) = 371 | Tree (8) = 3 |
| Tree (9) = 1,317,798 | Tree (9) = 695 | Tree (9) = 45 |
| Gene Position | Gene Tag (Attribute) | Occurence |
|---|---|---|
| 0 | v1 Class {1,2} | 1 |
| 1 | v5 | 4 |
| 3 | v7 | 1 |
| 7 | v13 | 3 |
| 8 | v14 | 2 |
| 13 | v22 | 1 |
| Gene Position | Gene Tag (Attribute) | Occurence |
|---|---|---|
| 0 | v1 Class {1,2,3,4,5} | 3 |
| 1 | v5 | 1 |
| 4 | v8 | 1 |
| 7 | v13 | 2 |
| 8 | v14 | 1 |
| 9 | v15 | 1 |
| 10 | v17 | 1 |
| 13 | v22 | 1 |
| Gene Position | Gene Tag (Attribute) | Occurence |
|---|---|---|
| 0 | v1 Class {1,2,3,4,5} | 1 |
| 1 | v5 | 2 |
| 2 | v6 | 1 |
| 3 | v7 | 1 |
| 5 | v9 | 4 |
| 7 | v13 | 1 |
| 8 | v14 | 1 |
| 9 | v15 | 1 |
| 10 | v17 | 1 |
| Runs No | Genes Average Frequency of Occurrence | ||||||||
|---|---|---|---|---|---|---|---|---|---|
| Gene | 1 | 2 | 3 | 4 | 5 | 6 | 7 | Avg Occurrence | Avg Occurrence% |
| 1 | 4 | 2 | 0 | 0 | 1 | 3 | 1 | 1.571429 | 16.18% |
| 2 | 0 | 2 | 1 | 0 | 0 | 0 | 0 | 0.428571 | 4.41% |
| 3 | 1 | 1 | 0 | 4 | 0 | 1 | 0 | 1 | 10.29% |
| 4 | 0 | 1 | 0 | 0 | 0 | 2 | 2 | 0.714286 | 7.35% |
| 5 | 0 | 0 | 1 | 0 | 0 | 0 | 0 | 0.142857 | 1.47% |
| 6 | 0 | 0 | 0 | 0 | 1 | 0 | 2 | 0.428571 | 4.41% |
| 7 | 3 | 0 | 3 | 6 | 1 | 2 | 1 | 2.285714 | 23.53% |
| 8 | 2 | 0 | 1 | 0 | 0 | 0 | 0 | 0.428571 | 4.41% |
| 9 | 0 | 0 | 1 | 0 | 1 | 1 | 1 | 0.571429 | 5.90% |
| 10 | 0 | 2 | 1 | 0 | 4 | 0 | 0 | 1 | 10.29% |
| 11 | 0 | 0 | 0 | 1 | 1 | 0 | 1 | 0.428571 | 4.41% |
| 12 | 0 | 2 | 0 | 1 | 0 | 0 | 0 | 0.428571 | 4.41% |
| 13 | 1 | 0 | 0 | 0 | 0 | 0 | 1 | 0.285714 | 2.94% |
| Runs No | Genes Average Frequency of Occurrence | ||||||||
|---|---|---|---|---|---|---|---|---|---|
| Gene | 1 | 2 | 3 | 4 | 5 | 6 | 7 | Avg Occurrence | Avg Occurrence % |
| 1 | 1 | 2 | 1 | 1 | 1 | 1 | 3 | 1.428571 | 15.625% |
| 2 | 0 | 1 | 0 | 0 | 0 | 1 | 0 | 0.285714 | 3.125% |
| 3 | 0 | 2 | 0 | 1 | 2 | 3 | 3 | 1.571429 | 17.1875% |
| 4 | 1 | 0 | 0 | 3 | 0 | 0 | 1 | 0.714286 | 7.8125% |
| 5 | 0 | 2 | 1 | 0 | 0 | 0 | 1 | 0.571429 | 6.25% |
| 6 | 0 | 0 | 0 | 1 | 0 | 0 | 1 | 0.285714 | 3.125% |
| 7 | 2 | 1 | 1 | 0 | 2 | 1 | 0 | 1 | 10.9375% |
| 8 | 1 | 0 | 0 | 0 | 0 | 0 | 0 | 0.142857 | 1.5625% |
| 9 | 1 | 1 | 3 | 1 | 1 | 0 | 0 | 1 | 10.9375% |
| 10 | 1 | 0 | 0 | 2 | 0 | 1 | 0 | 0.571429 | 6.25% |
| 11 | 0 | 0 | 0 | 1 | 0 | 0 | 2 | 0.428571 | 4.6875% |
| 12 | 0 | 2 | 0 | 0 | 0 | 0 | 1 | 0.428571 | 4.6875% |
| 13 | 1 | 1 | 2 | 0 | 0 | 1 | 0 | 0.714286 | 7.8125% |
| Runs No | Genes Average Frequency of Occurrence | ||||||||
|---|---|---|---|---|---|---|---|---|---|
| Gene | 1 | 2 | 3 | 4 | 5 | 6 | 7 | Avg Occurrence | Avg Occurrence % |
| 1 | 2 | 1 | 1 | 4 | 1 | 2 | 3 | 2 | 18.92% |
| 2 | 1 | 1 | 0 | 0 | 0 | 0 | 4 | 0.857143 | 8.11% |
| 3 | 1 | 1 | 3 | 1 | 0 | 0 | 0 | 0.857143 | 8.11% |
| 4 | 0 | 1 | 1 | 0 | 2 | 1 | 0 | 0.714286 | 6.76% |
| 5 | 4 | 0 | 0 | 2 | 1 | 1 | 0 | 1.142857 | 10.81% |
| 6 | 0 | 1 | 1 | 0 | 1 | 1 | 0 | 0.571429 | 5.41% |
| 7 | 1 | 0 | 0 | 3 | 0 | 0 | 1 | 0.714286 | 6.76% |
| 8 | 1 | 0 | 0 | 1 | 2 | 1 | 1 | 0.857143 | 8.11% |
| 9 | 1 | 1 | 0 | 0 | 2 | 1 | 0 | 0.714286 | 6.76% |
| 10 | 1 | 2 | 0 | 0 | 0 | 1 | 0 | 0.571429 | 5.41% |
| 11 | 0 | 0 | 1 | 0 | 1 | 0 | 1 | 0.428571 | 4.04% |
| 12 | 0 | 0 | 0 | 1 | 1 | 1 | 0 | 0.428571 | 4.04% |
| 13 | 0 | 1 | 2 | 1 | 0 | 0 | 1 | 0.714286 | 6.76% |
Publisher’s Note: MDPI stays neutral with regard to jurisdictional claims in published maps and institutional affiliations. |
© 2022 by the authors. Licensee MDPI, Basel, Switzerland. This article is an open access article distributed under the terms and conditions of the Creative Commons Attribution (CC BY) license (https://creativecommons.org/licenses/by/4.0/).
Share and Cite
Gkikas, D.C.; Theodoridis, P.K.; Beligiannis, G.N. Enhanced Marketing Decision Making for Consumer Behaviour Classification Using Binary Decision Trees and a Genetic Algorithm Wrapper. Informatics 2022, 9, 45. https://doi.org/10.3390/informatics9020045
Gkikas DC, Theodoridis PK, Beligiannis GN. Enhanced Marketing Decision Making for Consumer Behaviour Classification Using Binary Decision Trees and a Genetic Algorithm Wrapper. Informatics. 2022; 9(2):45. https://doi.org/10.3390/informatics9020045
Chicago/Turabian StyleGkikas, Dimitris C., Prokopis K. Theodoridis, and Grigorios N. Beligiannis. 2022. "Enhanced Marketing Decision Making for Consumer Behaviour Classification Using Binary Decision Trees and a Genetic Algorithm Wrapper" Informatics 9, no. 2: 45. https://doi.org/10.3390/informatics9020045
APA StyleGkikas, D. C., Theodoridis, P. K., & Beligiannis, G. N. (2022). Enhanced Marketing Decision Making for Consumer Behaviour Classification Using Binary Decision Trees and a Genetic Algorithm Wrapper. Informatics, 9(2), 45. https://doi.org/10.3390/informatics9020045


