Abstract
The current business environment demands the enablement of organization-wide use of analytics to support a fact-based decision making. Such movement within the organization require employees to take advantage of the self-service business analytics tools to independently fulfil their needs. However, assuming independence in data analytics requires employees to make sense of several elements which collectively contribute to the generation of required insights. Building on sense-making, self-service business analytics, and institutions literature, this paper explores the relationship between sense-making and self-service business analytics and how institutions influence and shape such relationship. By adopting a qualitative perspective and using 22 interviews, we have empirically investigated a model developed through our literature review and provided more understanding of the sense-making concept in a self-service business analytics context.
1. Introduction
Business Analytics (BA) denotes the use of data in conjunction with several analytical tools and techniques to support employees and organizations in their decision making. BA involves a wide-ranging use of data, statistical and quantitative analysis, explanatory and predictive models, and operations based on facts that support in making decisions and taking actions [1]. Currently, practitioners and academics prioritize value creation from business analytics [2,3].
Undoubtedly, business analytics has the capacity to help organizations expand their market share, improve the efficiency of daily operations, and explore more opportunities through the data they can collect and business-specific analytics they can perform [4]. For example, research indicates that top-performing organizations—compared to lower performing organizations—use the results of data analysis to develop future strategies and optimize daily operations [5].
On the one hand, due to the constant demand on analytics for better organizational decision-making need and employee’s inability to carry-on data analytics to serve their own needs, experienced technical employees (often part of an IT/BI department) face a tremendous overload of continuous reports requests [6,7,8,9]. On the other hand, technical employees with limited business knowledge often face business problems that they cannot address alone. The problems faced by technical employees act as a source of institutional influences for some organizations to decentralize analytics by creating a self-service environment. This environment allows employees to engage more in data analytics by seeking minimum support from technical employees. The environment is referred to as a self-service business analytics (SSBA) environment, which points at an approach to BA for providing non-technical employees or business users access to selection, analysis, and reporting tools with minimum or no participation from the technical experts [10].
A standard SSBA environment aims to lower the operational complexity of processing data into information where the technical department provides data, tools, and technologies to business users. This service from the technical department makes the business users more autonomous in meeting their information needs so that technical department can focus on more strategic tasks. [11]. Therefore, the business users as organizational actors get the opportunity to first make sense of the provided data using the provided tools to make an interpretation which can function as a context for organizational action. Sensemaking is the process through which people work to understand issues or events that are novel, ambiguous, confusing, or in some other way violate expectations [12]. Sensemaking assumes that the users may impose their own meaning based on experience and use the ascribed meaning as a basis for subsequent understanding and action [13]. In other words, the users in an organization create their own subjective reality rather than try to discover some existing reality. Based on this transformation of the SSBA environment, in this paper we posit that both institutions and sensemaking shape the SSBA environment in an organization. Therefore, it is important to investigate sense-making and institutions effect on SSBA environment and ground such understanding in empirical data. Following that, this paper aims at addressing the following research question, “How can we describe the interplay between sense-making and institutions influence in the context of SSBA”?
Understanding such influences is important since more knowledge about how institutional influences shape SSBA would be highly valuable for managers and IT professionals confronted by the complexity of enabling such an autonomous environment of insight generation.
The practical implication of this research is valuable for organizations aiming to become more data driven, especially at an operational level, where the priority to support by the technical department varies. As such, the contribution of this paper is threefold. First, this research adds to the knowledge on SSBA by identifying the institutional influences that shape the SSBA environment. Second, organizations that have adopted self-service analytics can better understand how their employees answer a question or solve a problem hence can improve the environment and optimize it for maximum value. Third, it investigates the role of sense-making in an analytical environment characterized by business user independence and contributes to a rather important and growing literature.
2. Self-Service Business Analytics (SSBA)
There are different user groups of business analytics (BA) based on their interaction with BA and decision-making [11,14,15]. User groups are, for example, information consumers, analysts, or BA specialists. Alpar and Schulz [11] and Sulaiman et al. [15] label analysts and BA specialists as power users. Power users have the ability and technical skills to set up and run BA efficiently, involving the access and use of data, visualizing data for decision-making, and analyzing its content. Information consumers consist of operational employees, managers, and executives who are defined as casual users as opposed to power users, since they do not have similar technical BA skills. Instead, casual users often use pre-defined reports or dashboards when making decisions [11,15]. The aim of implementing SSBA is to achieve a BA system that offers the ability for casual users to use BA without support from power users. Casual users should be able to access and use data, use pre-defined reports, or create new reports by themselves, and analyze their content when making decisions more freely compared to traditional BA. Therefore, SSBA users will be more self-reliant and less dependent on power users. SSBA is defined as: “The facilities within the BA environment that enable BA users to become more self-reliant and less dependent on the IT organization. These facilities focus on four main objectives: easier access to source data for reporting and analysis, easier and improved support for data analysis features, faster deployment options such as appliances and cloud computing, and simpler, customizable, and collaborative end-user interfaces” [16]. Even though SSBA offers many benefits compared to traditional BA, implementing and utilizing it is not as easy as expected [9,11,17,18,19,20].
There is relatively limited research literature available concerning SSBA. The latest research on SSBA presents findings on challenges associated with implementation and usage of SSBA [16,17,19]. Accessing and using data is frequently mentioned as a challenge to manage in order to make SSBA efficient. Eckerson [17] argues that implementing SSBA is more complex than it looks. Research by Weiler et al. [21] has shown that user uncertainty also has a negative impact on the introduction of SSBA. The reasons for uncertainty can be due to ‘hard factors’ (e.g., a lack of technical skills and capabilities) and by ‘soft factors’ (social dynamics, fear of AI and non-transparency). Further research has identified challenges that can be summarized in the groups ‘Access and use of data’ and ‘Self-reliant users’ [22]. Access to the data depends on the data governance policies of a company. Clarke et al. [23] described a framework with which companies can assess the maturity of their SSBA environment and how strict their data governance guidelines are in relation to it. With this focus, the authors underline the importance of the right degree of freedom for an SSBA environment. Imhoff and White [16] also describe in their study how important the right balance of freedom and control of data analysis is for successful SSBA.
3. An Institutional Perspective
To study SSBA, we draw on institutional theory. Institutional theory is concerned with the influences that shape social and organizational structures, schemas, rules, norms, routines and ultimately the behavior of social actors [24,25]. Robey and Boudreau [26] point out institutional theory as a suitable theoretical perspective to inquire into organizational change that are enabled by IT. Scott [27] indicates that an institution comprises of cognitive, normative, and regulative structures and activities that offer solidity and value to social behavior. Cultures, structures, and routines are three driving forces of institutions, and they function at numerous levels of jurisdiction.
Regulative elements emphasize activities such as setting rules, monitoring, and sanctioning. Normative elements present a didactic, appraising, and mandatory dimension into social life. Cultural-cognitive elements underline the shared understanding that represents the attributes of social reality and the structure through which meaning is made [28]. Studies on the relationship between institutions and organizations show that the institutional environment and organizational fields determine and affect business strategies and related objectives, beside organizational structures and processes [24,27,29,30,31,32,33]. This is especially true of the institutional environment and organizational field of the IT sector, which is characterized by numerous, complex, equivocal global regulations, and a multifarious web of normative and cultural-cognitive influences on environmental sustainability.
In connection to SSBA, the three pillars of institutions impact the success of SSBA, since it is considered an individual effort for an organization wide solution. That is, each individual invests in being independent and data driven to become a micro analytical unit within the wider spectrum. However, each individual is governed by the institutions mentioned earlier.
This study explores how SSBA—an approach to business analytics—can support the regular non-expert IT users in responding to situations to make informed decisions, with a special focus on sense-making as a central concept. The institutional environment and organizational field provide information to organizations in the form of regulative signals, normative signals, or cultural-cognitive signals. The theoretical proposition underpinning this study is, therefore, if SSBA is employed by organizations to address problems of compliance with regulative, normative, and cultural-cognitive obligations and social responsibilities, caused by complex and equivocal information from the institutional environment, then such technological approach will need to support sense-making. These interpretations are then enacted, i.e., shaped by the beliefs of organizational actors (which are in turn a product of organizational culture, identity, and strategy), and then applied for sense-making [13]. Such sense-making activities therefore (i) provide a context for organizational decision making by identifying problems and opportunities; (ii) help to identify knowledge gaps in terms of the organization’s strategy, processes, and products, triggering the creation of new knowledge and capabilities; and (iii) facilitate organizations to learn from the outcomes of action taken [13,34]. SSBA represents a personal effort of the user to be independent, and therefore it builds up on the idea that the user would assume responsibility and will use personal capabilities, personal time, and personal resources. Since SSBA is very subjective, sense-making is elevated because the user is no more dependent on the experts from the IT department in performing a task. With this independence, personal sense-making for the user becomes higher, and the dependability on the experts becomes lower. The user is accountable for all sorts of outcomes since they are the one who applies all their knowledge and performs the action independently. Due to the relationship between low dependency and high sense-making, it becomes important to better investigate how sense-making occurs within a self-service business analytics environment so that we develop a better understanding of the process.
Moreover, since SSBA is an approach to analytics, it may enable dynamic capabilities such as sensing, seizing, and transforming [35]. Sensing capability allows the users to identify and assess the analytics opportunities, whereas seizing refers to the organization of analytics resources responding to the opportunities. The transforming capability enables the users to manage analytics knowledge that may result in renewing the organization and its business model.
This paper posits that, given the complexity and equivocality of the environment, sense-making needs to be enabled by an information system(s)—in this scenario, an SSBA—if the organizational outcome of data-driven sense-making is to be achieved. Figure 1 presents our conceptual framework regarding the relationship between sense-making and SSBA using institutional theory.
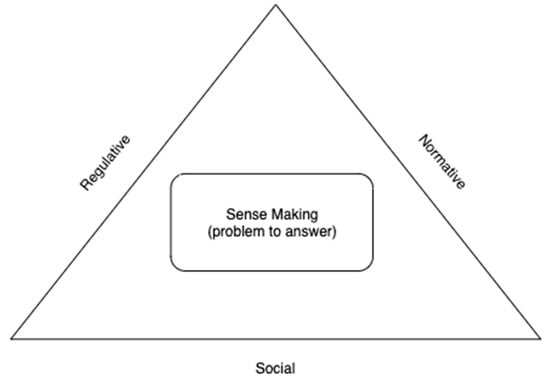
Figure 1.
Conceptual framework for understanding sense-making and SSBA using institutional theory.
4. Method
This study aims to unfold how data is transformed into insights in an SSBA environment where users need to deal with technology and analytical tools. We adopted a qualitative interpretive perspective, as the approach is applicable in exploring socio-technological phenomena and acquiring a deep understanding from the perspective of the participants in their real environment [36]. The qualitative approach is also useful in investigating a particular context in which participants act [37]. To address the aim of this research, it was important to investigate an organization who has adopted SSBA as an approach to data analytics, has a rather established ideology for data and analytics use in decision making, and has a business model dependent on the use of data in day-to-day activities.
4.1. Case Organization
As our case organization, we selected Finn.no, a top digital marketplace in Norway. The organization met our selection criteria. Finno.no’s digital platform and services are used by buyers, sellers, and market intermediaries to perform business transactions. Both private and public agencies use Finno.no as a central data repository, as agencies continuously send requests that contains several statistical analysis and statistical reports. Moreover, prominent sellers often request reports from the marketing and sales department about their advertisement reach and investment value. As the ad-hoc requests from external customer increased, the management of Finn.no decided to create a more data-driven organizational environment in 2010 so that employees could become more independent by easily accessing and analyzing business data to perform their daily tasks. To develop the environment, the SSBA approach was adopted to maximize the employees’ capabilities. The SSBA approach enabled the employees to handle external customers’ request on time, as well as fulfill the employees’ personal needs for timely information.
The IT department is responsible for the maintenance of SSBA tools, applications, and the platform in general. The IT staff creates data models, modifies data models, and manages user access throughout the platform. Often, the IT staff interacts with other employees in case of assistance, training, or any needed modifications in the data models. Finn.no aims to empower employees to create reports and dashboards through accessing the data warehouse, combining several data sources data (creating mashups), and exporting previous reports to other formats (such as Microsoft Power Point and Microsoft Excel) (Microsoft Co., Ltd.: Washington, DC, USA).
4.2. Data Collection
Data collection at Finn.no took place between 2016 and 2019, in Oslo, Norway (this needs to reflect the continuous involvement through different channels such as phone, Skype and others, which enabled us to keep a close eye on the changes occurring in the organization).
We used three methods to collect our data: interviews, participant observation, and document analysis. First, 22 (17 unique) interviews were conducted with employees working in different departments such as sales, marketing, insight, and product development. All our interviewees were selected based on their involvement with data in their daily activities. For example, in the product development department, the main activity of its staff is centered around developing the service platform the organization offers to its customers. Their tasks are highly based on using data and drawing insight and knowledge originating from the customer use of the service platform, and using that knowledge to optimize, develop, and fine-tune the service offered.
Second, participant observation was an important source of information, as we observed our participants in their real setting and how they used differed tools in conjunction to produce knowledge and draw insights. We observed 7 employees interacting with the self-service environment to solve a problem, answer a question, or accomplish a task. This enabled us to document the process they go through and what factors affecting this process.
Lastly, we asked the subjects involved in this study to provide us with documents involving real cases of problem identification and solving processes followed, as well as other documents related to the organization itself. This included a significantly important number of documents not limited to but including internal meeting memos, presentations, and internal survey results.
4.3. Data Analysis
Text data is the major and dominant source of evidence for this study. Therefore, a data analysis technique was used that can go beyond classifying and categorizing text based on language intensity and similar meaning [38]. We followed the Miles et al. [39] qualitative data analysis framework for this research. We chose their framework due to their conceptualization of qualitative data analysis. The framework describes three simultaneous activities to gain knowledge from empirical material (see Figure 2). These simultaneous activities are in line with the idea of concurrency between the activities until findings are produced.

Figure 2.
Data analysis process.
First, data condensation refers to “the process of selecting, focusing, simplifying, abstracting, and/or transforming the data that appear in the full corpus (body) of written-up field notes, interview transcripts, documents, and other empirical materials.” [39]. This step helps us in developing a general idea of the main concepts and points raised during the interviews and grouping them into more specific categories such as institutions, sense-making, and data analytics. Coding was performed in this step where both researchers used concepts and codes previously agreed on, and were encouraged to introduce new ones if required.
Second, data display is defined as “an organized, compressed assembly of information that allows conclusion drawing and action” (Miles, Huberman and Saldana) [39]. In this activity, previously coded text was further analyzed, categorized, and organized in a more abstract view while maintaining the main findings and relevant information. In this step, sharper and more precise understanding was developed, and relationships between concepts were identified, such as the relationship between institutions and sense-making, and the relationship between problematization and question formulation, as will be explained later.
Third, the process of conclusion drawing involves the interpretation of the findings and the implication of the interpretations for the questions at hand. Conclusion drawing refers to revisiting the data as many times as possible to verify the emergent conclusions. This process aims at finding some patterns and trends within the data. In this last process, we used our findings to confirm what has been found in literature while expanding some concepts and adding more depth to our understanding within the context of our study.
5. Findings
5.1. Institutions in Enabling Analytics
Before engaging in analytics through data questioning, employees are affected by several factors that might enable or prevent initiating the process, such as the way in which we think, our motives, our willingness to serve ourselves, and being data-driven in our decision-making. Institutions are such factors that have a power and influence on making the first step towards solving a problem in a self-service way.
In an organizational context, employees operate surrounded by an internal culture and organizational institutions that dictate how things should be conducted and what processes need to be followed. It also dictates what is acceptable and what is not, including the way in which decisions are taken. To that extent, data driven ideology within the organization boundaries can have a significant effect on how decision are backed up by analytics and numbers.
This is not the only institution that has this effect. Personal institutions also play an important role in the willingness to approach data questioning and analysis. Employees who are not ideologically driven by facts—based on data and exploration of alternatives—usually rely on past experiences and gut feelings, as highlighted by one interviewee: “You need to kind of have the numeric mind set and not everybody has that kind of approach and mind set so it varies a lot.” (BDx), “you are kind of curious about understanding and it kind of depends maybe I can kind of solve or extract and analyze data myself” (BD), “Way of thinking; I think it’s very important” (BDy).
Personal relationships or social presence proved to be an important element describing the way in which employees socially interact during the process of problem solving. These personal relations are built up by the ability to socialize with others who share similar institution, leading to a social network of social institution: “try really to be data driven and challenge others being data driven at my unit and also we work a lot cross-rational so trying to get them to be fact-based and data driven” (BDz), “think it’s much on a cultural side so people do not take decisions by kind of a gut feel and if they are used to kind of doing that and it’s often when they do work with product development” (BDz).
Even when asked about the importance of organizational institutions, such as having a data driven ideology and the employee’s alignment with the organization vision to be data driven in most of the decisions made, a recruitment specialist answered “Yeah, but I think there’s always socially active is important, but data driven is always more important”(HR), “being data driven or how you work and how you prefer to work is always more important than if you’re going to attend the beer on Friday’s or if you want to have an extra cup of coffee after lunch; it’s always the work itself and how driven you are; it’s always more important” (HR).
5.2. Analytical Sense-Making
The process of converting raw data into insight is nontrivial. It includes a series of recursive activities characterized by continuous refinement until a desired outcome is reached. It all starts with the identification of a problem (problematization) or opportunity originating from the exploration, exploitation, and observation of the data available: “we can see if we can drop in leads last week. Then it’s I kind of question to kind of find out okay why has that turned off marketing and did we have any problems at the site? Have we done anything that should kind of give that result and that’s the example” (BDy) “I’m interested in an explanation of why is that? So, we look at the numbers and try to find a qualitative explanation based on the facts” (BDy).
After formulating a concise understanding of the task, a statement in form of a question is developed to serve as basis for further data analysis. The answer to this question constitutes the final goal and the solution to the task at hand: “I think it’s asking questions, getting them to dig deeper in understanding the problem”; “we noticed that there is a drop or there is something wrong there and then after that what we did is you tried to investigate why is this happening through a list of hypothesis or questions that we will need to address” (BDz).
The employee then starts an initial analysis of the task where business knowledge and analytical capabilities play an important role in highlighting the needed data sources that act as base for evidence and further data analysis. “Looking at the data to understand how it kinds of develops in relation to the question.”, “and then it’s like what kind of data do we have to use… and maybe we have sufficient data”.
To analyze the data, an employee uses different tools in conjunction to structure the required data in a valuable way laying the ground for the analytics phase: “we also use tool X and tool Y to slice and dice data from related to an ad. However, on the demand side it’s much more on web statistics. It’s kind of understanding the traffic flow of the website” (BDq). Interestingly, not all data are quantitative and represented in numbers. Qualitative data in form of surveys and interviews are sometimes used and mixed with quantitative data to bring a different perspective on the problem at hand: “used tool X and tool Y data to understand what kind problem we have? And combined that with more qualitative data based on surveys” (BDq).
Once all data is collected, including quantitative and qualitative, an employee initiates an analytical process in which several analytical activities, including but not limited to a comparison between data and what a problem states, developing potential answers, sorting answers based on appropriate solutions then sharing them with colleagues either from business or IT departments: “I sit and play with data and looking for some answers to solve questions and when I think have sort of found something, I usually share it with one of the guys sitting next to me” (BDr); “then what I have done is I have sorted the potential solutions and compared them to what the dealers say themselves” (BDr).
After several iterations (if required), an initial answer to the question is formulated and an evaluation is conducted. The evaluation includes mapping an answer to the question and seeking support (business or technical in case needed) to decide whether the solution is optimal and accepted or if it needs further analysis: “we want to test out and get more feedback and see if we are going to do some changes or adjustments in the design and the content of the functionality.” (BDs). The evaluation process is also complex. The employee at this phase has developed an initial answer to the question and transition to the evaluation step, which is developed through revisiting the problem itself, the data used to develop the answer, and the analysis performed. “We have to evaluate if the problem that we defined is actually a problem based on the questions we are asked and the analysis we have done and also that if we don’t find a good explanation or some causes for this kind of situation or problem we can try to consider if this actually is a problem.” (BDs). In some cases, another iteration is required for different reasons, such as what was measured is incorrect and the answer is not precise or well-articulated. “We actually concluded is that we should measure something that we don’t measure” (BDx).
5.3. Analytical Support
While answering a question initiates a process with several iterations of problematization, data access, analysis, and evaluation, the complexity of a question demands further support. There are two types of direct support involved: business support, and technical support. Technical support compensates the technical capabilities gap employees face during problem solving. This gap might be present when exploring available data or choosing the suitable data source to perform analysis. “One would be just getting help extracting or manipulating the data or just getting the tie to do it. Let’s say I have this problem, I think the solution is like this and they kind of develop or prove the content and we can work together on that.”(BDs), “this Friday actually I sat down with one of the guys at Insight and we discovered that the data we have is unusable” (BDt).
It is also present when employees are actually engaged in the analytical phase, where connections between different data sources are set up and the choice of the right analytical tool/technique has to be chosen to fit the used data. “if I do more complex analysis; I try to go back and ask them what’s wrong with what I have done so that they could pinpoint or try to look at my stuff and see if I have done anything that doesn’t make sense” (BDt); “In the cases where don’t know how to try to find answers we usually involve the Insight department because they have competence in doing market analysis, doing service, doing web analysis” (BDu).
Business support is just as important as technical support. The process starts with problematization, which in certain cases is not trivial. Business support should be available in complex situations due to the variability of the employee’s business experience and knowledge. Problem formulation and question development require a deep and valid understanding of the information gathered regarding the business. “I think it’s also to get the understanding of it’s more than just insights; what’s happening on the business side, what’s happening on the competitive side like getting more the holistic perspective of the marketplace?” (BDs), “Are there any products that we sell to our current people and the pricing manager in my department and there I really challenge him to kind of understand what’s going on there and use that data” (DBs), “we try to work together as a team and solve these tasks together and we also have other departments that we can involve. We have…” (BDw).
While exploring the data available and mapping it to the question at hand, the employee may face some difficulties during evaluation: “get some inspiration and maybe some recommendations on how we can… what kind of approaches we can use in order to try to understand the problem” (BDw).
6. Discussion
In this paper, we set out to identify the institutional influences in an SSBA environment and explain how such influence shape the environment and support data analytics.
6.1. Theoretical Implications
As presented in our findings, we have explored sense-making and described its inner working in relation to data analytics. The process starts with the identification of the problem or opportunity. As a means of illustrating, an employee scans the current data available looking for an irregularity, such as a drop in a graph or an unexpected increase in a specific Key Performance Indicators (KPI). This event triggers the employee in trying to understand the reasons of this event, eventually leading to a question formulation (e.g., why there is a drop in traffic, or how to maintain a certain KPI level increase). The next step is exploration in more details. The variety of the data sources available might be challenging for the employee, because the most suitable data sources should be first identified [40] and later connected to in order to obtain a full and comprehensive view of the situation. In certain cases, and depending on the complexity of the question, technical support is crucial.
In the analytics phase, the employee starts formulating incrementally an answer to the specific question using the available data. This step is coupled with mental efforts, analytical and technical capabilities [41]. The outcome of this phase is a relatively satisfactory answer to the question. The term “relatively” denotes the need of this specific answer to undergo an evaluation phase, which often requires business support to decide either the answer addresses the question, or it needs another iteration.
Lastly, the answer is assessed during the evaluation phase. It includes the formulation of a needed course of action and whether a complete clarity of the solution is available by consulting business colleagues within or across departments. In case the answer is not satisfactory, the employee reinitiates the problematization phases and revaluates the question. In all three phases, sense-making plays an important role, and acts as the encapsulating medium through which the employee initiates a phase, transitions to the next, and concludes the process. Sense-making also manages the effect of institutions on the analytics process. It basically provides information on what are the norms, rules, regulations, and the socially constructed ideologies within the organization that influence the data analytics process. For example, if the employee identifies a problem or an opportunity, what are the dominating norms and actions needed? Should it be discussed in group, or it can be an individual effort? Moreover, if the employee needs either business or technical support, should it be through the formal channels or it can be through a socially constructed routine (See Figure 3)?
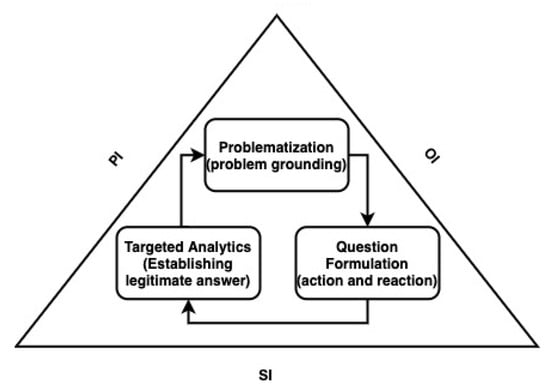
Figure 3.
Analytical sense-making and organizational institutions.
Institutions are one of the most important factors governing the process of data questioning in a self-service environment. As has been highlighted in many studies, institutions are humanly devised rules, beliefs, and norms that control our actions [42]. They are considered “the rule of the game” [43] that generate our actions and make them acceptable to others. In this study, we define Personal Institutions (PI) as our willingness to engage in a self-service task, our preference to be fact driven, and to what extent we are willing to go to be more informed in our decisions. In the same vein, we define Organizational Institutions (OI) as those institutions that are present within the boundaries of the organization. They define how to do things: how we reach out for support, and what is acceptable and not. The interplay between these two institutions is complex, and together governs the way we process data to answer a question. For instance, personal institution may prevent the employee of initiating the phase of data questions by affecting our perception on the value of being self-served and data driven. Moreover, organizational institutions have the potential limit our use of data, especially in organizations (as well as specific departments) where gut feeling, and past experience are generally acceptable. Finally, Social Institutions (SI) are also an important governing factor whenever support is needed, hence affecting the overall phase of data questioning. SI are those norms and beliefs related to our social presence and behaviors within an organization that we share with other employees. For example, do we ask for support through the formal channels, or do we initial our request over a cup of coffee (informally)? Is it acceptable for us and by others to show that we failed in answering a question in a meeting, even though the organizational institutions accept such things? PI, OI, and SI are highly related, and collectively govern the process of data questioning; however, it is not our intention to explore how those institutions interact on a detailed level.
6.2. Practical Implications
The fundamental idea of having a self-service environment is to promote user’s independence [7] and democratize analytics; however, we cannot disregard the need for support. The independence in a self-service environment is highly dependent on employees’ capabilities and of questions complexity. Our research has identified two types of support: technical support, and business support. When a user starts problematizing and formulating a question, a concrete understanding of the business problem is a must. In certain cases, the employee needs consultation or business support on the actual problem to understand its origin or validity. The problem may be presented due to other actions or new deployed services. Business support is also needed sometimes when evaluating the proposed answer to the question. When employees define a problem and explore the available data, they start developing an answer in the analytics step. The outcome is a reasonable and logical answer to the question; however, sometimes doubts are also present, making business support important to evaluate whether more work is needed.
7. Conclusions
In this paper, we have investigated SSBA environment from a sense-making perspective by addressing the following research question “How can we describe the interplay between sense-making and institutions influence in the context of SSBA?” Through our empirical findings, we have highlighted three main phases, namely problematization, question formulation, and analytics. The three phases are encapsulated and managed by sense-making, as it acts as a medium between institutions and the inner process itself. It is also important to understand that that institutional logic needs to provide the necessary grounds for employee empowerment, while sense-making is the manifestation of this empowerment at the individual level aiming for greater value for the organization. The institutional logic is manifested in the organizational level, while sense-making is at an individual level, which is in line with our argument that SSBA is subjective to the individual.
As such, this paper contributes to sense-making theory by investigating a growing trend in business analytics and highlighting the sense-making role in connecting institutions with SSBA analytical process.
Future studies may investigate the sense-making mechanisms responsible for controlling and enabling the relationship between institutions and each phase within SSBA. Moreover, there is a need to test if our model can be applied to different industries including the processing industry and transport and manufacturing.
Author Contributions
Conceptualization, I.B.-H. and S.C.; methodology, I.B.-H.; software, I.B.-H.; validation, I.B.-H., S.C. and A.K.; formal analysis, I.B.-H. and S.C.; investigation, I.B.-H.; resources, I.B.-H.; data curation, I.B.-H.; writing—original draft preparation, I.B.-H. and S.C.; writing—review and editing, I.B.-H., S.C. and A.K. All authors have read and agreed to the published version of the manuscript.
Funding
This research received no external funding.
Institutional Review Board Statement
Not applicable.
Informed Consent Statement
Informed consent was obtained from all subjects involved in the study.
Conflicts of Interest
The authors declare no conflict of interest.
References
- Davenport, T.H.; Harris, J.G. Competing on Analytics: The New Science of Winning; Harvard Business Press: Brighton, MA, USA, 2007. [Google Scholar]
- Gillon, K.; Brynjolfsson, E.; Mithas, S.; Griffin, J.; Gupta, M. Business analytics: Radical shift or incremental change? Commun. Assoc. Inf. Syst. 2012, 34, 24–32. [Google Scholar] [CrossRef]
- Mithas, S.; Lee, M.R.; Earley, S.; Murugesan, S.; Djavanshir, R. Leveraging big data and business analytics [Guest editors’ introduction]. IT Prof. 2013, 15, 18–20. [Google Scholar] [CrossRef]
- Chen, H.; Chiang, R.H.; Storey, V.C. Business intelligence and analytics: From big data to big impact. MIS Q. 2012, 36, 1165–1188. [Google Scholar] [CrossRef]
- LaValle, S.; Lesser, E.; Shockley, R.; Hopkins, M.S.; Kruschwitz, N. Big data, analytics and the path from insights to value. MIT Sloan Manag. Rev. 2011, 52, 21. [Google Scholar]
- Bani Hani, I.; Deniz, S.; Carlsson, S. Enabling organizational agility through self-service business intelligence: The case of a digital marketplace. In Proceedings of the The Pacific Asia Conference on Information Systems (PACIS) 2017, Langkawi, Malaysia, 16–20 July 2017. [Google Scholar]
- Bani-Hani, I.; Tona, O.; Carlsson, S. From an information consumer to an information author: A new approach to business intelligence. J. Organ. Comput. Electron. Commer. 2018, 28, 157–171. [Google Scholar] [CrossRef]
- Barc. Self-Service Business Intelligence Users Are Now in the Majority. Available online: http://barc-research.com/self-service-business-intelligence-users-now-majority/ (accessed on 25 September 2021).
- Weber, M. Keys to sustainable self-service business intelligence. Bus. Intell. J. 2013, 18, 18. [Google Scholar]
- Schuff, D.; Corral, K.; Louis, R.D.S.; Schymik, G. Enabling self-service BI: A methodology and a case study for a model management warehouse. Inf. Syst. Front. 2016, 20, 275–288. [Google Scholar] [CrossRef]
- Alpar, P.; Schultz, M. Self-service business intelligence. Bus. Inf. Syst. Eng. 2016, 58, 151–155. [Google Scholar] [CrossRef]
- Maitlis, S.; Christianson, M. Sensemaking in organizations: Taking stock and moving forward. Acad. Manag. Ann. 2014, 8, 57–125. [Google Scholar] [CrossRef]
- Choo, C.W. The knowing organization: How organizations use information to construct meaning, create knowledge and make decisions. Int. J. Inf. Manag. 1996, 16, 329–340. [Google Scholar] [CrossRef]
- Hostmann, B. BI competency centres: Bringing intelligence to the business. Bus. Perform. Manag. 2007, 5, 4–10. [Google Scholar]
- Sulaiman, S.; Gómez, J.M.; Kurzhöfer, J. Business Intelligence Systems Optimization to Enable Better Self-Service Business Users. Available online: https://www.researchgate.net/publication/290737739_Business_intelligence_systems_optimization_to_enable_better_self-service_business_users (accessed on 26 October 2021).
- Imhoff, C.; White, C. Self-service Business Intelligence: Empowering Users to Generate Insights; TWDI: Renton, WA, USA, 2011. [Google Scholar]
- Eckerson, W. Business-driven BI: Using new technologies to foster self-service access to insights. Tableau Softw. 2012, 65, 55–72. [Google Scholar]
- Kabakchieva, D.; Stefanova, K.; Yordanova, S. Latest Trends in Business Intelligence System Development. In Proceedings of the International Conference on Application of Information and Communication Technology and Statistics in Economy and Education (ICAICTSEE), Sofia, Bulgaria, 6–7 December 2013; p. 212. [Google Scholar]
- Logi Analytics. 2015 State of Self Service BI Report. In Logi Analytics’ Second Executive Review of Self-Service Business Intelligence Trends; Logi Analytics: McLean, VA, USA, 2015. [Google Scholar]
- Stodder, D. Visual Analytics for Making Smarter Decisions Faster–Applying Self-Service Business Intelligence Technologies to Data-Driven Objectives; TWDI: Renton, WA, USA, 2015. [Google Scholar]
- Weiler, S.; Matt, C.; Hess, T. Understanding user uncertainty during the implementation of self-service business intelligence: A thematic analysis. In Proceedings of the 52nd Hawaii International Conference on System Sciences (HICSS), Maui, HI, USA, 8–11 January 2019. [Google Scholar]
- Lennerholt, C.; van Laere, J.; Söderström, E. Implementation challenges of self service business intelligence: A literature review. In Proceedings of the 51st Hawaii International Conference on System Sciences, Waikoloa Village, HI, USA, 3–6 January 2018; pp. 5055–5063. [Google Scholar]
- Clarke, P.; Tyrrell, G.; Nagle, T. Governing self service analytics. J. Decis. Syst. 2016, 25, 145–159. [Google Scholar] [CrossRef] [Green Version]
- Scott, W.R. Institutional theory: Contributing to a theoretical research program. In Great Minds in Management: The Process of Theory Development; Oxford University Press: Oxford, UK, 2005; pp. 460–484. [Google Scholar]
- Butler, T. Compliance with institutional imperatives on environmental sustainability: Building theory on the role of Green IS. J. Strateg. Inf. Syst. 2011, 20, 6–26. [Google Scholar] [CrossRef]
- Robey, D.; Boudreau, M.-C. Accounting for the contradictory organizational consequences of information technology: Theoretical directions and methodological implications. Inf. Syst. Res. 1999, 10, 167–185. [Google Scholar] [CrossRef] [Green Version]
- Scott, W.R. Institutions and Organizations; Sage Publishing: Thousand Oaks, CA, USA, 1995. [Google Scholar]
- Scott, W.R. Approaching adulthood: The maturing of institutional theory. Theory Soc. 2008, 37, 427–442. [Google Scholar] [CrossRef]
- Oliver, C. Strategic responses to institutional processes. Acad. Manag. Rev. 1991, 16, 145–179. [Google Scholar] [CrossRef]
- Oliver, C. The influence of institutional and task environment relationships on organizational performance: The Canadian construction industry. J. Manag. Stud. 1997, 34, 99–124. [Google Scholar] [CrossRef]
- Oliver, C. Sustainable competitive advantage: Combining institutional and resource-based views. Strateg. Manag. J. 1997, 18, 697–713. [Google Scholar] [CrossRef] [Green Version]
- Frankenberger, S.; Müller-Stewens, P.G. Management of Regulatory Influences on Corporate Strategy and Structure; Springer: New York, NY, USA, 2006. [Google Scholar]
- Reid, E.M.; Toffel, M.W. Responding to public and private politics: Corporate disclosure of climate change strategies. Strateg. Manag. J. 2009, 30, 1157–1178. [Google Scholar] [CrossRef] [Green Version]
- Weick, K.E. Sensemaking in Organizations; Sage Publishing: Thousand Oaks, CA, USA, 1995. [Google Scholar]
- Conboy, K.; Mikalef, P.; Dennehy, D.; Krogstie, J. Using business analytics to enhance dynamic capabilities in operations research: A case analysis and research agenda. Eur. J. Oper. Res. 2020, 281, 656–672. [Google Scholar] [CrossRef]
- Kaplan, B.; Maxwell, J.A. Qualitative research methods for evaluating computer information systems. In Evaluating the Organizational Impact of Healthcare Information Systems; Springer: New York, NY, USA, 2005; pp. 30–55. [Google Scholar]
- Maxwell, J.A. Designing a qualitative study. In The SAGE Handbook of Applied Social Research Methods; SAGE Publications, Inc.: Thousand Oaks, CA, USA, 2008; pp. 214–253. [Google Scholar]
- Weber, R.P. Basic Content Analysis; Sage: Thousand Oaks, CA, USA, 1990. [Google Scholar]
- Miles, M.B.; Huberman, A.M.; Saldana, J. Qualitative Data Analysis: A Methods Sourcebook, 3rd ed.; SAGE Publications Ltd.: Thousand Oaks, CA, USA, 2014. [Google Scholar]
- Daradkeh, M.; Moh’d Al-Dwairi, R. Self-Service Business Intelligence Adoption in Business Enterprises: The Effects of Information Quality, System Quality, and Analysis Quality. In Operations and Service Management: Concepts, Methodologies, Tools, and Applications; IGI Global: Hershey, PA, USA, 2018; pp. 1096–1118. [Google Scholar]
- Bani-Hani, I.; Tona, O.; Carlsson, S. Patterns of Resource Integration in the Self-Service Approach to Business Analytics. In Proceedings of the 53rd Hawaii International Conference on System Sciences, Maui, HI, USA, 7–10 January 2020. [Google Scholar]
- Richard, S.W. Institutions and Organizations, 2nd ed.; Sage Publishing: Thousand Oaks, CA, USA, 2001; p. 52. [Google Scholar]
- North, D.C. Institutions, Institutional Change And Economic Performance; Cambridge University Press: Cambridge, UK, 1990. [Google Scholar]
Publisher’s Note: MDPI stays neutral with regard to jurisdictional claims in published maps and institutional affiliations. |
© 2021 by the authors. Licensee MDPI, Basel, Switzerland. This article is an open access article distributed under the terms and conditions of the Creative Commons Attribution (CC BY) license (https://creativecommons.org/licenses/by/4.0/).