Article

Measurement of the Effective Refractive Index of Suspensions Containing 5 µm Diameter Spherical Polystyrene Microparticles by Surface Plasmon Resonance and Scattering

by
Osvaldo Rodríguez-Quiroz
1,*,
Donato Luna-Moreno
1,*,
Araceli Sánchez-Álvarez
2,
Gabriela Elizabeth Quintanilla-Villanueva
1,
Oscar Javier Silva-Hernández
1,
Melissa Marlene Rodríguez-Delgado
3,4 and
Juan Francisco Villarreal-Chiu
3,4
1
Centro de Investigaciones en Óptica A.C., Loma del Bosque 115, Colonia Lomas del Campestre, León 37150, Guanajuato, Mexico
2
Electromecánica Industrial, Universidad Tecnológica de León, Blvd. Universidad Tecnológica 225, Col. San Carlos, León 37670, Guanajuato, Mexico
3
Facultad de Ciencias Químicas, Universidad Autónoma de Nuevo León, Av. Universidad S/N Ciudad Universitaria, San Nicolás de los Garza 66455, Nuevo León, Mexico
4
Centro de Investigación en Biotecnología y Nanotecnología (CIByN), Facultad de Ciencias Químicas, Universidad Autónoma de Nuevo León, Parque de Investigación e Innovación Tecnológica, Km. 10 Autopista al Aeropuerto Internacional Mariano Escobedo, Apodaca 66629, Nuevo León, Mexico
*
Authors to whom correspondence should be addressed.
Chemosensors 2025, 13(7), 257; https://doi.org/10.3390/chemosensors13070257
Submission received: 5 June 2025 / Revised: 11 July 2025 / Accepted: 12 July 2025 / Published: 15 July 2025
(This article belongs to the Special Issue Spectroscopic Techniques for Chemical Analysis)

Abstract

Microplastics (MP) have been found not only in the environment but also in living beings, including humans. As an initial step in MP detection, a method is proposed to measure the effective refractive index of a solution containing 5 µm diameter spherical polystyrene particles (SPSP) in distilled water, based on the surface plasmon resonance (SPR) technique and Mie scattering theory. The reflectances of the samples are obtained with their resonance angles and depths that must be normalized and adjusted according to the reference of the air and the distilled water, to subsequently find their effective refraction index corresponding to the Mie scattering theory. The system has an optical sensor with a Kretschmann–Raether configuration, consisting of a semicircular prism, a thin gold film, and a glass cell for solution samples with different concentrations (0.00, 0.20, 0.05, 0.50, and 1.00%). The experimental result provided a good linear fit with an R2 = 0.9856 and a sensitivity of 7.2863 × 10 5 RIU/% (refractive index unit per percentage of fill fraction). The limits of detection (LOD) and limit of quantification (LOQ) were determined to be 0.001% and 0.0035%, respectively. The developed optomechatronic system and its applications based on the SPR and Scattering enabled the effective measurement of the refractive index and concentration of solutions containing 5 µm diameter SPSP in distilled water.

1. Introduction

Plastics are used in the manufacture of various products such as clothing, tires, cosmetics, paints, bags, rope, and netting. Plastics, made from a specific type of polymer, are lightweight, flexible, corrosion resistant, dielectric, and thermally insulating. Plastics are insoluble in water and most are not biodegradable; they have the potential to absorb, release, and transport chemicals, and plastics gradually decompose by erosion or fragmentation through biological, chemical, and physical processes until they become solid microplastic (MP) particles with a size of 1 μm to 5 mm [1], or nanoplastics with a size of 1 nm to 1 μ [2].
In analyzing plastic particles, it is desirable to know the shape, size, concentration, refractive index (RI), and effective refractive index of the sample (colloid or suspension). Tuoriniemi J. et al. [3] determined the mean diameters ( d p a r t : 100, 300, and 460 nm) and number concentrations ( ρ ) of polystyrene (PS) particles by fitting the coherent scattering theory (CST) to the effective refractive index ( n e f f ) measured by SPR for a series of dilutions. R. Márquez-Islas et al. [4] obtained the refractive index, size (radii of ~25 nm), and concentration of non-absorbing spherical nanoparticles in a colloid, using a mathematical method and measurements with the Abbe refractometer and with dynamic light scattering (DLS).
Thompson et al. [5] collected and quantified microplastic debris on beaches and estuarine and subtidal sediments, where nine polymers were identified: acrylic, alkyd, poly (ethylene: propylene), polyamide (nylon), polyester, polyethylene, polymethacrylate, polypropylene, and polyvinyl alcohol; they demonstrated that in small aquariums, species would ingest microplastics within a few days. Microplastic debris is found throughout the natural environment, as it is transported through air and water, and has been detected in food, beverages, terrestrial animals, birds, and fish, with emerging evidence of negative effects [6]. A study of water distribution networks across Britain, from the treatment plant to the customer’s tap, detected mainly polyamide (PA), polyethylene terephthalate (PET), polypropylene (PP), and polystyrene (PS) among 19 types of polymer particles, for sizes greater than 25 µm diameter [7].
Other research provides the presence, distribution, and potential ecological risks of MPs in terrestrial ecosystems [8], in water and aquatic systems [9], and ecotoxicological effects on aquatic organisms [10]. But MPs have not only been found in the environment; they have also been found in the human body, including blood. MPs are absorbed by the human body and transported through the bloodstream. In a study of 20 healthy volunteers, blood concentrations ranged from 1.84–4.65 μg/mL, with an average length of 7–3000 μm and an average width of 5–800 μm, and with 24 polymer types, with an abundance of polyethylene (32%), ethylene propylene diene (14%), and ethylene-vinyl-acetate/alcohol (12%), whose presence poses the risk of potential detrimental effects, such as vascular inflammation, accumulation in major organs, and alterations in immune response, hemostasis, and thrombosis [11]. The MPs have been found in food products like table salt, shellfish, and fish, and processed foods like honey, milk, sugar, sardines, sprats, dried fish, and tea bags [12]. Different studies have been carried out to assess the effects of the ingestion of MPs: Sapkale et al. evaluated the oxidative damage caused by microplastics with size ranging from 8–100 µm in the ram’s horn snail Indoplanorbis exustus, and found that the lethal concentration 50 (LC50) was calculated to be 872 mg L−1 (or 0.087% w/v) after 96 h of exposure [13]. In another study, Berber evaluated the genotoxicity of polystyrene microplastic in the aquatic species Daphnia magna, calculating an LC50 of 808.97 μg mL−1 (or 0.08% w/v) [14]. Therefore, it is important to establish regulations for industries that produce plastic, implement corrective measures for pollution, investigate the effects on living beings, and develop methods to detect and analyze nanoplastic and microplastic particles.
The common techniques used to determine one or more characteristics for nanoparticle detection are electron microscopy (EM) [3], spectroscopy, dynamic light scattering (DLS) [3,4], and to detect microspectroscopy techniques like Fourier Transform Infrared (FTIR) [5,7,15] Raman [16], and other methods like thermal analysis [17]. For instance, Sierra et al. used polarized light optical microscopy to detect MPs in effluent samples in a size range from 70 to 600 μm, and found MPs in concentrations of 5.3–8.2 × 10³ MP items/m3 [18]. In another study, Miserli et al. employed scanning electron microscopy in conjunction with energy dispersive X-ray spectroscopy. Microplastic abundance was 16 ± 1.7 items/individual in mussels and 22 ± 2.1 items/individual in sea bass, and 40 ± 3.9 items/individual [19]. On the other hand, Ompala et al. used Raman spectroscopy and analyzed samples of MPs with concentrations of 0.3 g L−1 and 0.03 g L−1 [20]. In another work, Gouda et al. used micro-FTIR for the quantification of MPs, with a % of recovery of 95% for MPs from 600 μm to 4.75 mm, and 83% for MPs from 38 μm to 45 μm. In another study, Lee et al. analyzed MP samples with FTIR and found 520 to 1820 particles/L in influent samples and 0.56 to 2.34 particles/L in effluent samples [21]. Also, gas chromatography coupled to mass spectrometry (GC–MS) has been used for the quantification of MPs. For instance, Santos et al. used pyrolysis for the pre-treatment of samples and GC–MS, with a LOD of 0.1 µg for polyurethane and 9.1 µg for polyethylene [22]. Also, Lee et al. used extraction–desorption coupled to GC–MS to analyze samples of wastewater and found concentrations of 160 μg L−1 and 0.04–1.07 μg L−1 [21].
In this investigation, it is important to estimate the thickness of the thin gold film adhered to the prism surface by means of the theoretical experimental adjustment of the SPR curves [23]. The surface plasmon resonance technique [24,25,26,27,28,29,30,31,32,33,34] is employed to obtain the reflectance and resonance angle when the suspensions are placed in a glass cell of an optical sensor with the Kretschmann–Raether configuration (semicircular prism—metal thin film—glass cell). To determine the effective refractive index and the percentage fill fraction f (number concentration of the particles [ 1 / m 3 ] divided by the volume of a spherical particle [ m 3 ], expressed as a fraction or percentage, which we will henceforth call concentration) that corresponds to each reflectance, the scattering theory [35] and the Mie scattering theory [36] are applied. To simulate reflectance and calculate the effective refractive index of colloids (nanoparticles in distilled water) and suspensions (microparticles in distilled water), the formulas of coherent scattering theory [37,38] and the van der Hulst model [39] are used, respectively. In the experiments, we used a portable optomechatronic system and applications developed in LabVIEW and MATLAB [40], where the optical sensor (semicircular prism, thin gold film, and a glass cell for samples) was placed in a Kretschmann–Raether configuration. Suspensions of 5 µm diameter SPSP in distilled water are prepared with different concentrations (0.00, 0.02, 0.05, 0.50, and 1.00%). Each suspension is then scanned by the system to obtain its reflectance, which is normalized and adjusted to the reference point of the distilled water sample. Finally, its effective refractive index and corresponding concentration are determined using reflectance (resonance angle, depth) and the van de Hulst formula (real part and imaginary part of the effective refractive index).

2. Theory

In physics, chemistry, and biology, surface plasmon resonance (SPR), and coherent scattering theory (CST) have gained significant importance in the research of diverse topics, including the study of colloids and suspensions (fluids containing nanoparticles and microparticles, respectively), as they allow us to understand the iterations of light with samples [3,4,23,35,36]. Figure 1 shows a sensor with a coherent light source, a polarizer ( P ), a photodiode, a semicircular prism, a metallic thin film (TF), and particles in a dielectric medium to illustrate the phenomena of SPR and coherent scattering. The refractive indices of the prism ( n p r i s m ), thin film ( N T F ), the medium ( n m ), and the particles ( n p ) are indicated. The angle of incidence of the laser beam on the semicircular prism is θ i . The angle in the medium is θ m and is calculated by Snell’s law with the resonance angle ( θ S P R ) at the interfaces (semicircular prism—thin gold film—glass cell with distilled water), which is π / 2 + α . The specular direction is θ s c a = π 2 θ m and θ s c a = 0 is the forward direction.
A film is considered thin when all interference effects in reflected or transmitted coherent light can be detected. Interference effects depend on the illumination source and the thickness and refractive index (RI) of each layer, where each layer is represented by a 2 × 2 matrix. In normal coatings, the films (metals and dielectrics) will be thin, while the substrates will be thick. The reflectance, admittance, and characteristic matrix of an assembly of thin films for oblique incidence in absorbing media are expressed respectively as the following [41]:
R = r 2 = η 0 Y η 0 + Y η 0 Y η 0 + Y
Y = H a E a = C B
E a / E b H a / E b = B C = j = 1 q cos δ j i sin δ j / η j i sin δ j η j cos δ j 1 η q + 1
where r is the reflection coefficient, η 0 is the tilted admittance on the incident medium, η q + 1 is the tilted admittance of the substrate or emergent medium, Y is the optical admittance of the multilayer system, [B C]′ is known as the characteristic matrix of the assembly (the normalized electric and magnetic fields), and H a , b and E a , b represent the tangential components of the magnetic ( H ) and electric ( H ) fields, respectively, at the boundaries a (initial) and b (final). The phase thickness is δ j = 2 π / λ 0 d j N j cos θ j , λ 0 is the wavelength, d is the physical thickness, N = ( n + i k ) is the complex refractive index, θ is the angle of incidence, j is the layer number from 1 to q , N j cos θ j = N j 2 n 0 sin θ 0 2 1 / 2 , for s-polarization η j ( s ) = y N j 2 n 0 sin θ 0 2 1 / 2 , for p-polarization η j ( p ) = y N j 2 / N j 2 n 0 sin θ 0 2 1 / 2 , and y is the optical admittance in free space equal to 2.6544 × 10 3   S i e m e n s .
SPR was developed over time by several researchers [24,25,26,27,28,29,30,31,32,33,34]. In SPR, surface plasmon excitation occurs at the interface of a metallic thin film and a dielectric medium when a coherent light source undergoes total internal reflection. The coherent light beam then excites the surface electrons of the metallic film, causing them to interact with the dielectric medium containing the sample (biomolecules, analytes, or particles). The SPR technique allows the detection of very small changes in the refractive index of a metallic surface (which has surface plasmons, or collective electron oscillations) when the molecules or particles in the sample bind to the metal surface while scattering (plasmonic scattering) detects the light scattered by these molecules/particles at the surface.
From CST researchers, two formulas are presented here to calculate the effective refractive index. Equation (4) is used for a dilute monodisperse system of randomly located spherical particles and was developed by García-Valenzuela et al. [37,38], and Equation (5) is used for a monodisperse system (isotropic and independent of polarization) of spherical particles and was developed by H.C. van de Hulst [39]:
n ~ e f f = n m 1 + 2 i 2 π ρ k m 3 S 0 2 π ρ k m 3 2 S 0 2 S j 2 c o s 2 θ m 1 / 2
n ~ e f f = n m 1 + i 2 π ρ k m 3 S 0
where n m is the refractive index of the medium surrounding the particles, i is the imaginary unit ( 1 ), ρ is the number concentration of the particles, and k m = 2 π / λ is the wave number of the incident wave in the medium. The function S j = S j ( N , x , u = cos θ s c a ) can be S 0 , S 1 or S 2 , S 0   ( θ s c a = 0 ) represents the forward-scattering amplitude, S 1 is used for s-polarization (TE: transverse electric) and S 2 is used for p-polarization (TM: transverse magnetic); these are the components of the amplitude scattering matrix, calculated by Mie scattering theory [36]. The variable θ m , which has the form π / 2 + α i [3], is the angle of incidence in the dielectric medium for the evanescent field, and θ s c a = π 2 θ m [37,38] is the scattering angle. The value of θ m can be calculated from the resonance angle θ s p r by sequentially applying Snell’s law at the interfaces (semicircular prism—thin film of gold—glass cell: dielectric medium, matrix material, colloid, or suspension) [3,37,38]. Also, N = n p / n m is the relative refractive index, x = k m a is the size parameter, λ o is the wavelength in vacuum, λ = λ o / n m is the wavelength of the incident light in the surrounding medium, n p is the refractive index of a spherical particle, a is the radius of the spherical particle, f = ρ V is the particle fill fraction, and V = ( 4 / 3 ) π a 3 is the volume of a spherical particle.
In CST [35], the study of incident coherent light and coherent light scattered in a certain direction, passing through spherical particles of any size and material immersed in a surrounding medium (transparent, homogeneous, and isotropic), is described with formulas that are exact solutions to Maxwell’s equations, which were developed by Gustav Mie [36]. Light scattering is the phenomenon where light is redirected by an object. The scattered wave is composed of several partial waves, whose amplitudes depend on a m (mth electric partial wave), b m (mth magnetic partial wave), π m , and τ m :
S 1 = m = 1 2 m + 1 m ( m + 1 ) a m π m u + b m τ m u
S 2 = m = 1 2 m + 1 m ( m + 1 ) b m π m u + a m τ m u
a m ( N , x , z ) = N ψ m z ψ m x ψ m x ψ m z N ψ m z ξ m x ξ m x ψ m z
b m ( N , x , z ) = ψ m z ψ m x N ψ m x ψ m z ψ m z ξ m x N ξ m x ψ m z
  ψ m σ = π σ / 2     J m + 1 / 2 σ
  φ m σ = π σ / 2     J m 1 / 2 σ · 1 m
ξ m σ = ψ m σ + i φ m σ
π m u = P m u u ;       π m u = 2 P m u u 2
τ m u = u   π m u 1 u 2 π m u
where a m and b m are the amplitude functions, π m u and τ m u are the angular functions, m = 1 , , m m a x is the number of terms in the summation, m m a x = r o u n d ( 4 x 3 + x + 2 ) is the maximum number rounded to the nearest integer, ψ m σ and ξ m σ are the partial derivatives of ψ m σ and ξ m σ , respectively. The argument σ takes on the values x or z = N x . J m + 1 / 2 u and J m 1 / 2 u are the Bessel functions of positive and negative half-order, respectively. The angular functions π m and τ m contain the scattering angle θ s c a . P m is the Legendre polynomial of degree m , and u = cos θ s c a .
In this work, with an optomechatronic system and applications that we have developed, the processing of the signals for SPR and CST is carried out in real time and with post-processing for the analysis of the signals, from the measurement of the thin film deposited on the prism to the detection of spherical polystyrene particles in a solution and the calculation of the effective refractive index.

3. System and Methodology

The Optomechatronic System [40] is formed from a laser diode with a wavelength of λ 0 = 639   n m (Mod. LPM690-30C, Newport Corporation, Irvine, CA, USA), a linear polarizer P (Mod. 5511 General Purpose Sheet Polarizer, 450–750 nm, Newport Corporation, Irvine, CA, USA), a semicircular prism (FK5, n = 1.4858 [42]) with gold metallic thin film (Purity of 99.99%, Kurt J. Lesker Co., Clairton, PA, USA), a glass cell containing colloids or suspension samples (5 μm diameter SPSP, Number 02705-AB, SPI Supplies, West Chester, PA, USA), a silicon photodiode (Mod. S1226-8BK, Hamamatsu Photonics K.K., Hamamatsu City, Japan), two motorized rotation stages (Mod. 8MR180-2, Standa Ltd., VNO, Lithuania), a cabinet with power and control electronics, control program (LabVIEW, Version 2020, National Instruments, Ciudad Juárez, México), simulation and post-processing programs (MATLAB, Version 2024, MathWorks, Inc., Natick, MA, USA), and a personal computer (Windows 10, Intel Core i7, 2.6 GHz, 12 GB RAM, 1 TB SSD).
According to the concentration and volume formula for dilutions ( C i V i = C f V f ), for an initial concentration of 1% of SPSP in distilled water and a final volume of 3000 μL, by adding an initial volume of 0, 60, 150, 1500, and 3000 μL, a final concentration percentage of 0.00, 0.20, 0.05, 0.50, and 1.00% of PS in distilled water can be obtained.
Once the samples are obtained, the system is adjusted with the laser and prism at 0 and 90 degrees. Each sample of the PS solution is placed in a glass cell, and an angular scan of 30 to 80 degrees is performed to obtain the reflectance signal with SPR scattering.
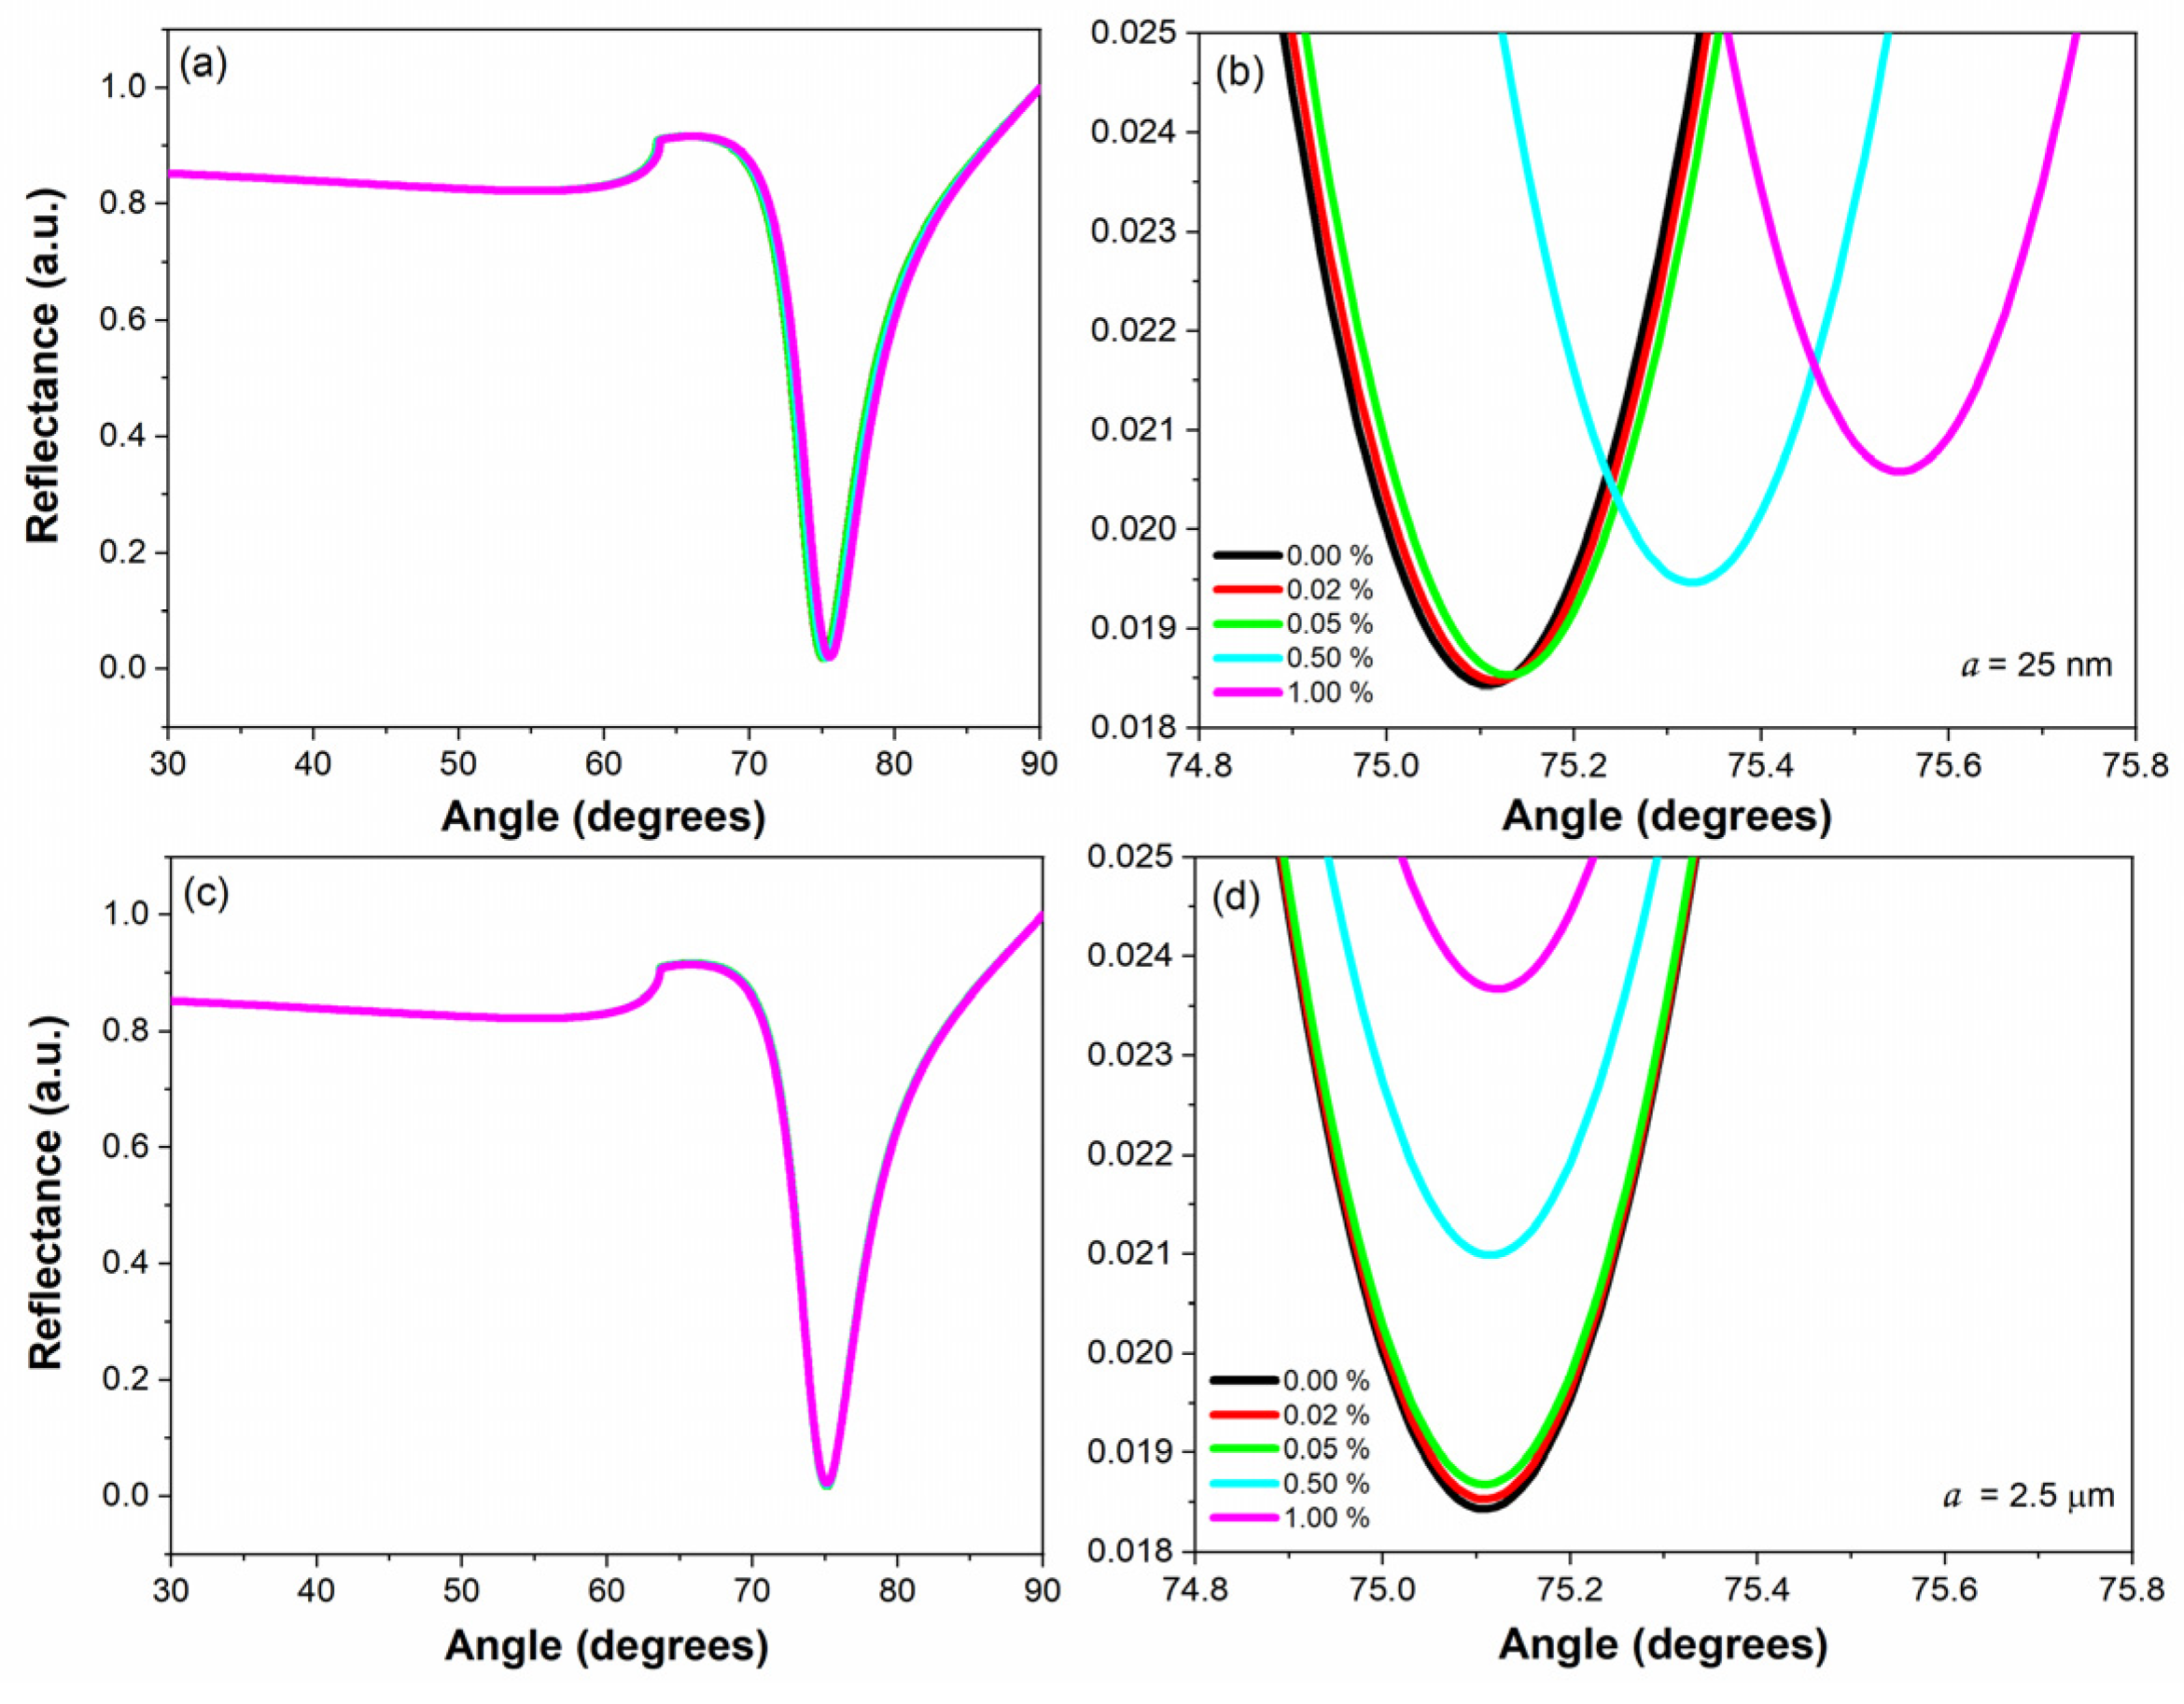
The reflectance (Equations (1)–(3)) of the sensor (Figure 1) with SPR scattering can be simulated (Figure 2a,b, signal in black) when the coherent light ( λ 0 = 639   nm ) is p-polarized, the gold thin film ( N A u = 0.1736 + 3.4930 i [43], a thickness of 51 nm) in the prism ( n p r i s m : F K 5 = 1.4858 ) adjoins a dielectric medium (for example, distilled water with n m = 1.3314 [44]), and there is a total internal reflection ( n p r i s m > n m ). From the reflectance, the resonance angle θ s p r = 75.11 ° is obtained, which is used to obtain the angle of incidence in the medium θ m = π / 2 + 0.393673 i using Snell’s law, and the scattering angle θ s c a = π 2 θ m .
Then, to calculate the effective refractive index (Equations (4) and (6)–(14)) for spherical (radius a = 25   nm ) polystyrene ( n p = 1.5870 [45]) particles in distilled water with a concentration of f = 0.02 % , it is necessary to calculate S 0 (1.2125 × 10 5 4.36 13 × 10 3 i ), S 1 (1.2126 × 10 5 4.3934 × 10 3 i ) and S 2 (1.6082 × 10 5 5.8211 × 10 3 i ) for the corresponding relative refractive index N = n p / n m = 1.1920 , the wavenumber of the incident wave in the medium k m = 1.30914443 × 10 7 m 1 , the size parameter x = 0 . 3273, z = N x = 0.3901 ; number of terms in the summation m m a x = 5 , θ m = π / 2 + 0.3937 i , and θ s c a = 0.7873 i , where ψ 1 w = s i n ( w ) / w c o s ( w ) ;   φ 1 w = c o s ( w ) / w s i n ( w ) ; π 1 w = 1 , and τ 1 w = w for w = c o s ( θ s c a ) , a 1 = 8.0816 × 10 6 2.8428 × 10 3 i and b 1 = 1.2067 × 10 9 3.4738 × 10 5 i . The result of the calculation using Equation (4) is n ~ e f f = 1.331450 + 1.381626 × 10 7 i , which is simulated as a medium in reflectance (Equation (1)), and is graphed in Figure 2a,b (red signal). The same procedure is performed for concentrations of 0.05, 0.50, and 1.00% (Figure 2a,b, signals in green, cyan, and magenta, respectively).
For particles with radii greater than 850 nm, Equation (4) takes values greater than n p and then values that grow exponentially, so Equation (5) or Equation (15) can be used to calculate the n ~ e f f of 5 µm diameter or 2.5 µm radius SPSP in distilled water with different concentrations. Table 1 shows the effective refractive indices calculated for SPSP of 25 nm and 2.5 µm radius, using Equations (4) and (5) or Equation (15), respectively.
n ~ e f f = n m 1 + i 3 16 λ o π   n m 3 f a 3 S 0 ( n p / n m , 2 π n m a / λ o , u = 1 )
As can be seen in Figure 2a,b and Table 1 (columns 2 and 3), for nanoparticles using Equation (4), the resonance angle shifts to the right as particle concentration increases, and their refractive index can be differentiated from the fifth digit. Whereas in Figure 2c,d and Table 1 (columns 4 and 5), for microparticles using Equation (5) or Equation (15), the reflectance has almost the same resonance angle and the depth tends to be smaller as particle concentration increases, and the refractive index can be differentiated from the sixth digit. This means that it is easier to detect nanoparticles with these formulas, but it does not prevent us from deciphering the effective refractive index, mainly the extinction coefficient (imaginary part that is more directly related to the amplitude of the reflectance) of the solution, by theoretical adjustment of signals. When Equation (5) or Equation (15) is used, as the concentration of the microparticles in the solution increases, the real part of the effective refractive index decreases for diameters greater than ~ 1.771 μm, so S 0 = a i b must be taken for there to be a logical increase.
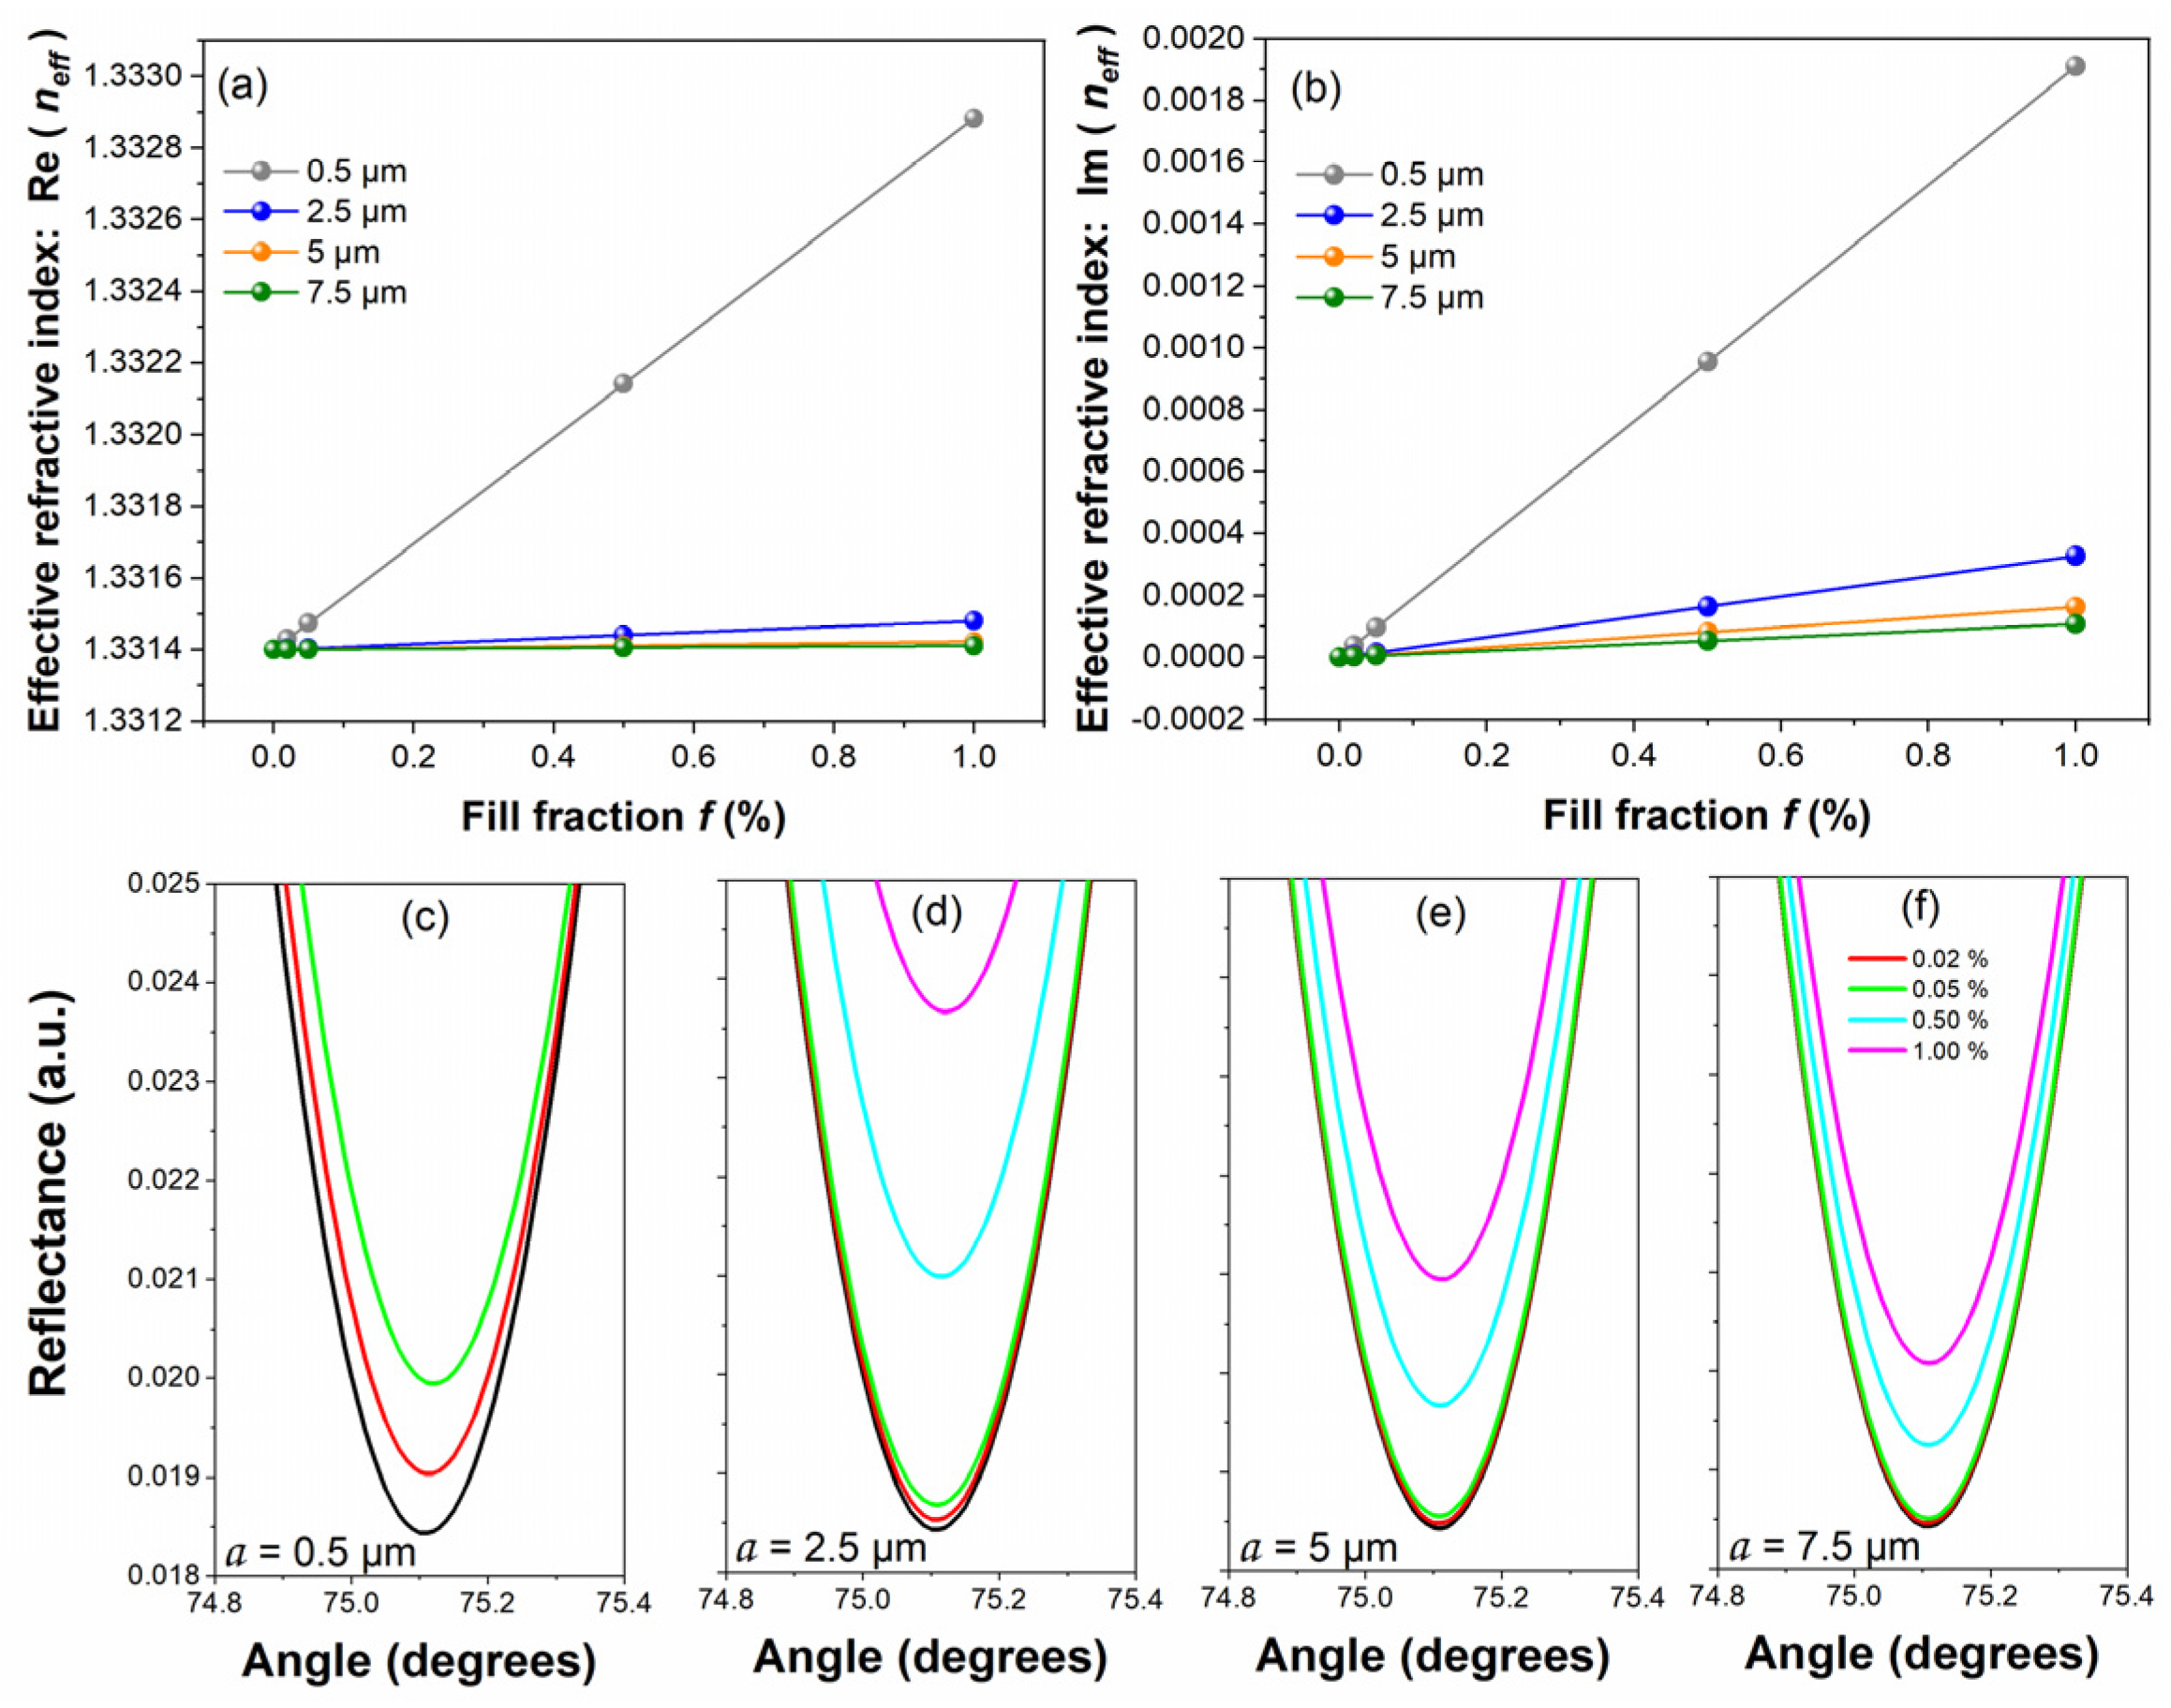
Figure 3a,b shows the real and imaginary parts of the effective refractive index for different solutions with spherical particles of 0.5 µm, 2.5 µm, 5 µm, and 7.5 µm radius in distilled water, with concentrations of 0–1%. Figure 3c–f show the respective reflectances, where the reflectance depth values for spherical particles with a radius of 7.5 µm (Figure 3f) are within the reflectance of the 5 µm ones (Figure 3e), the 5 µm reflectance depth values are within the reflectance of the 2.5 µm ones (Figure 3d), and the 2.5 µm values are within the reflectance of 0.5 µm (Figure 3c). Therefore, with the angular scanning technique in SPR, the size of the particles can only be differentiated from 1% of the fill fraction if the diameter or radius of the particle is not known a priori.
From Equation (15), the real and imaginary parts of the effective refractive index will be given by the following:
n ~ = n m + n m C 1 f a 3 I m S ( n p / n m , 2 π n m a / λ o , u = 1 )
k ~ = n m C 1 f a 3 R e S ( n p / n m , 2 π n m a / λ o , u = 1 )
where C 1 is equal to ( 3 / 16 ) λ o / π n m 3 = 6.6854 × 10 22 if n m = 1.3314 and λ o = 639   n m .
Knowing the refractive index of the prism ( n p r i s m ), the metallic film ( N A u ) and its thickness (51 nm), and the water ( n m ) as the base sample, we have an initial reference point ( 75.11 ° , 0.0184 ) for f = 0 % : n ~ = n m and k ~ = 0 . Thus, the real part will be affected by changes in the resonance angle, and the imaginary part by the depth of the reflectance. As mentioned above, different mathematical methods have already been demonstrated to determine the three main parameters ( a , f , n p ), so in this situation we are only going to measure the concentration knowing a priori the refractive index ( n p = 1.5870 ) and the radius ( a = 2.5   μ m ) of the spherical particle. For the deeper points of the signals (Figure 2d and Figure 3d), the effective refractive index (sample in the dielectric medium) can be calculated by giving values to f in Equations (16) and (17) until they coincide with the minimum value of its reflectance.
In this way, the methodology consists of obtaining the theoretical value of the effective refractive index ( n ~ e f f ) for each concentration of the colloid or solution sample, substituting it in the reflectance formula as the dielectric medium, and graphing the expected theoretical SPR-scattering signal. The experimental air reflectance is then fitted to the theoretical signal (simulated) to determine the thickness of the gold film deposited on the flat face of the semicircular prism. Finally, the experimental reflectance of the distilled water is adjusted to the simulated one, to know the displacements (degrees), amplitudes (reflectance), and losses or gains, which must be applied to all the experimental signals to find their respective effective refractive index and concentration using Equations (16) and (17).

4. Results and Discussion

Suspensions must be shaken before use, they must not be frozen or shaken vigorously, at least ten particles must be measured in image visualization, they must be stored at room temperature with the bottle tightly covered, and in case of spillage, rinsed with plenty of water and disposed of as normal laboratory waste. To ensure particle dispersion in the suspension of samples with 5 µm diameter or 2.5 radius SPSP (manufactured by SPI Supplies), the bottle was gently inverted several times until no sediment or clumps were observed. It was then immersed in an ultrasonic water bath (C008 40 KHz, AcmeSonic Ltd., Shenzhen, China) for one minute at low power. The desired sample was immediately withdrawn from the bottle using a pipette (Ecopipette 20–200 & 100–1000 µL, CAPP AHN Biotechnologie GmbH, Nordhausen, Germany). The concentration of SPSP was 0.00, 0.02, 0.05, 0.50, and 1.00% in distilled water.
Figure 4a shows the adjustment of the experimental air sample with the theoretical signal to determine the thickness of the thin gold film deposited on the flat face of the prism, resulting in a 51 nm thin gold film. Figure 4b shows the adjustment of the reflectance of the distilled water sample to the theoretical signal with a reference point at 75.11° and a 0.0184 depth. The displacement, amplitude, and gain/loss parameters used in the adjustment are subsequently applied to all samples, resulting in Figure 4c.
To calculate n ~ e f f and f from the magenta signal shown in Figure 4c with its resonance angle and depth of 75.09 ° and 0.0234 , respectively, with relative refractive index ( N = n p / n m = 1.1920), particle size ( x = 2 π n m a / λ o = 32.7286), and forward scattering S 0 = 577.0855 141.0735   i , the value of f is introduced in Equations (16) and (17), from 0.00 with increments of 0.01, until the value of n ~ + k ~ introduced in the external medium of thin films gives us the value of the depth and approximately the angle of resonance of the reflectance. So, in this case (magenta signal of Figure 4c), the effective refractive index is n ~ e f f = 1.331476 + 3.1231 × 10 4 i for a concentration of 0.95%. The effective refractive indices and their concentrations obtained for the reflectances in Figure 4c are shown in Table 2, where the smallest concentration error was 0.02% and the largest was 0.12%, and the refractive index error was 2 × 10 6 RIU and 10 × 10 6 RIU, respectively.
The optoelectronic system has a resolution of 0.01 degrees and a precision of 0.0071 RIU (refractive index unit). For very small concentrations (0.00, 0.02, 0.05, 0.50, and 1.00%) of 2.5 μm radius SPSP in distilled water, the experiment provides a good linear fitting of R 2 = 0.9856, a sensitivity of 7.2863 × 10 5 RIU/% (Figure 4d), LOD = 0.001%, and LOQ = 0.0035%. It is very important to correctly determine the thickness of the thin gold film (51 nm), since it determines the measurement range in the reflectance amplitude (0.0184 to 0.0237), where the concentrations and the extinction coefficient are mainly measured, since n is approximately equal to 1.3314 for all solutions. To avoid potential errors when the laser power varies, a beam splitter and a photodiode were added to the portable optoelectronic system to provide reference power. Even if conventional techniques can detect low concentrations of MPs, they have some disadvantages: optical and electron microscopy provide morphological details but lack specificity and are time intensive. FTIR and Raman spectroscopies offer molecular specificity, but face challenges with smaller particle sizes and complex matrices. Pyrolysis with GC–MS provides compositional data, but these techniques are destructive and limited in morphological analysis [17]. On the other hand, SPR provides high sensitivity and specificity through nanostructure-enhanced detection [17], and a real-time analysis can be carried out [46]. In this work, the achieved LOD of 0.001% (equivalent to 10 mgL−1) and LOQ = 0.0035% (equivalent to 35 mgL−1), respectively, were lower than other reported techniques, like the methodology of Ompala et al., who analyzed samples with concentrations as high as 0.3 g L−1 and 0.03 g L−1 [20] and can be compared with techniques like micro-FTIR for medical use; for example, Leonard et al. analyzed human blood and found concentrations of MPs from 1.84 μg mL−1 to 4.65 μg mL−1 [11]. In another work, Malyuskin analyzed samples of MPs by resonance microwave spectroscopy, and found the best achievable theoretical resolution of microplastic with a concentration of 100 ppm (equivalent to 100 mg L−1), which is a higher concentration than the samples from our study, 100 ppm [47]. This demonstrates that the methodology developed in this work has a sensitivity comparable to or even better than other instrumental techniques.
After each test, it is recommended to recover the sample by subtracting the solution with the corresponding or labeled syringe for each sample, then clean the glass cell with methanol by introducing it into its corresponding syringe and leaving it for 1 min, finally rinsing about five times with distilled water.
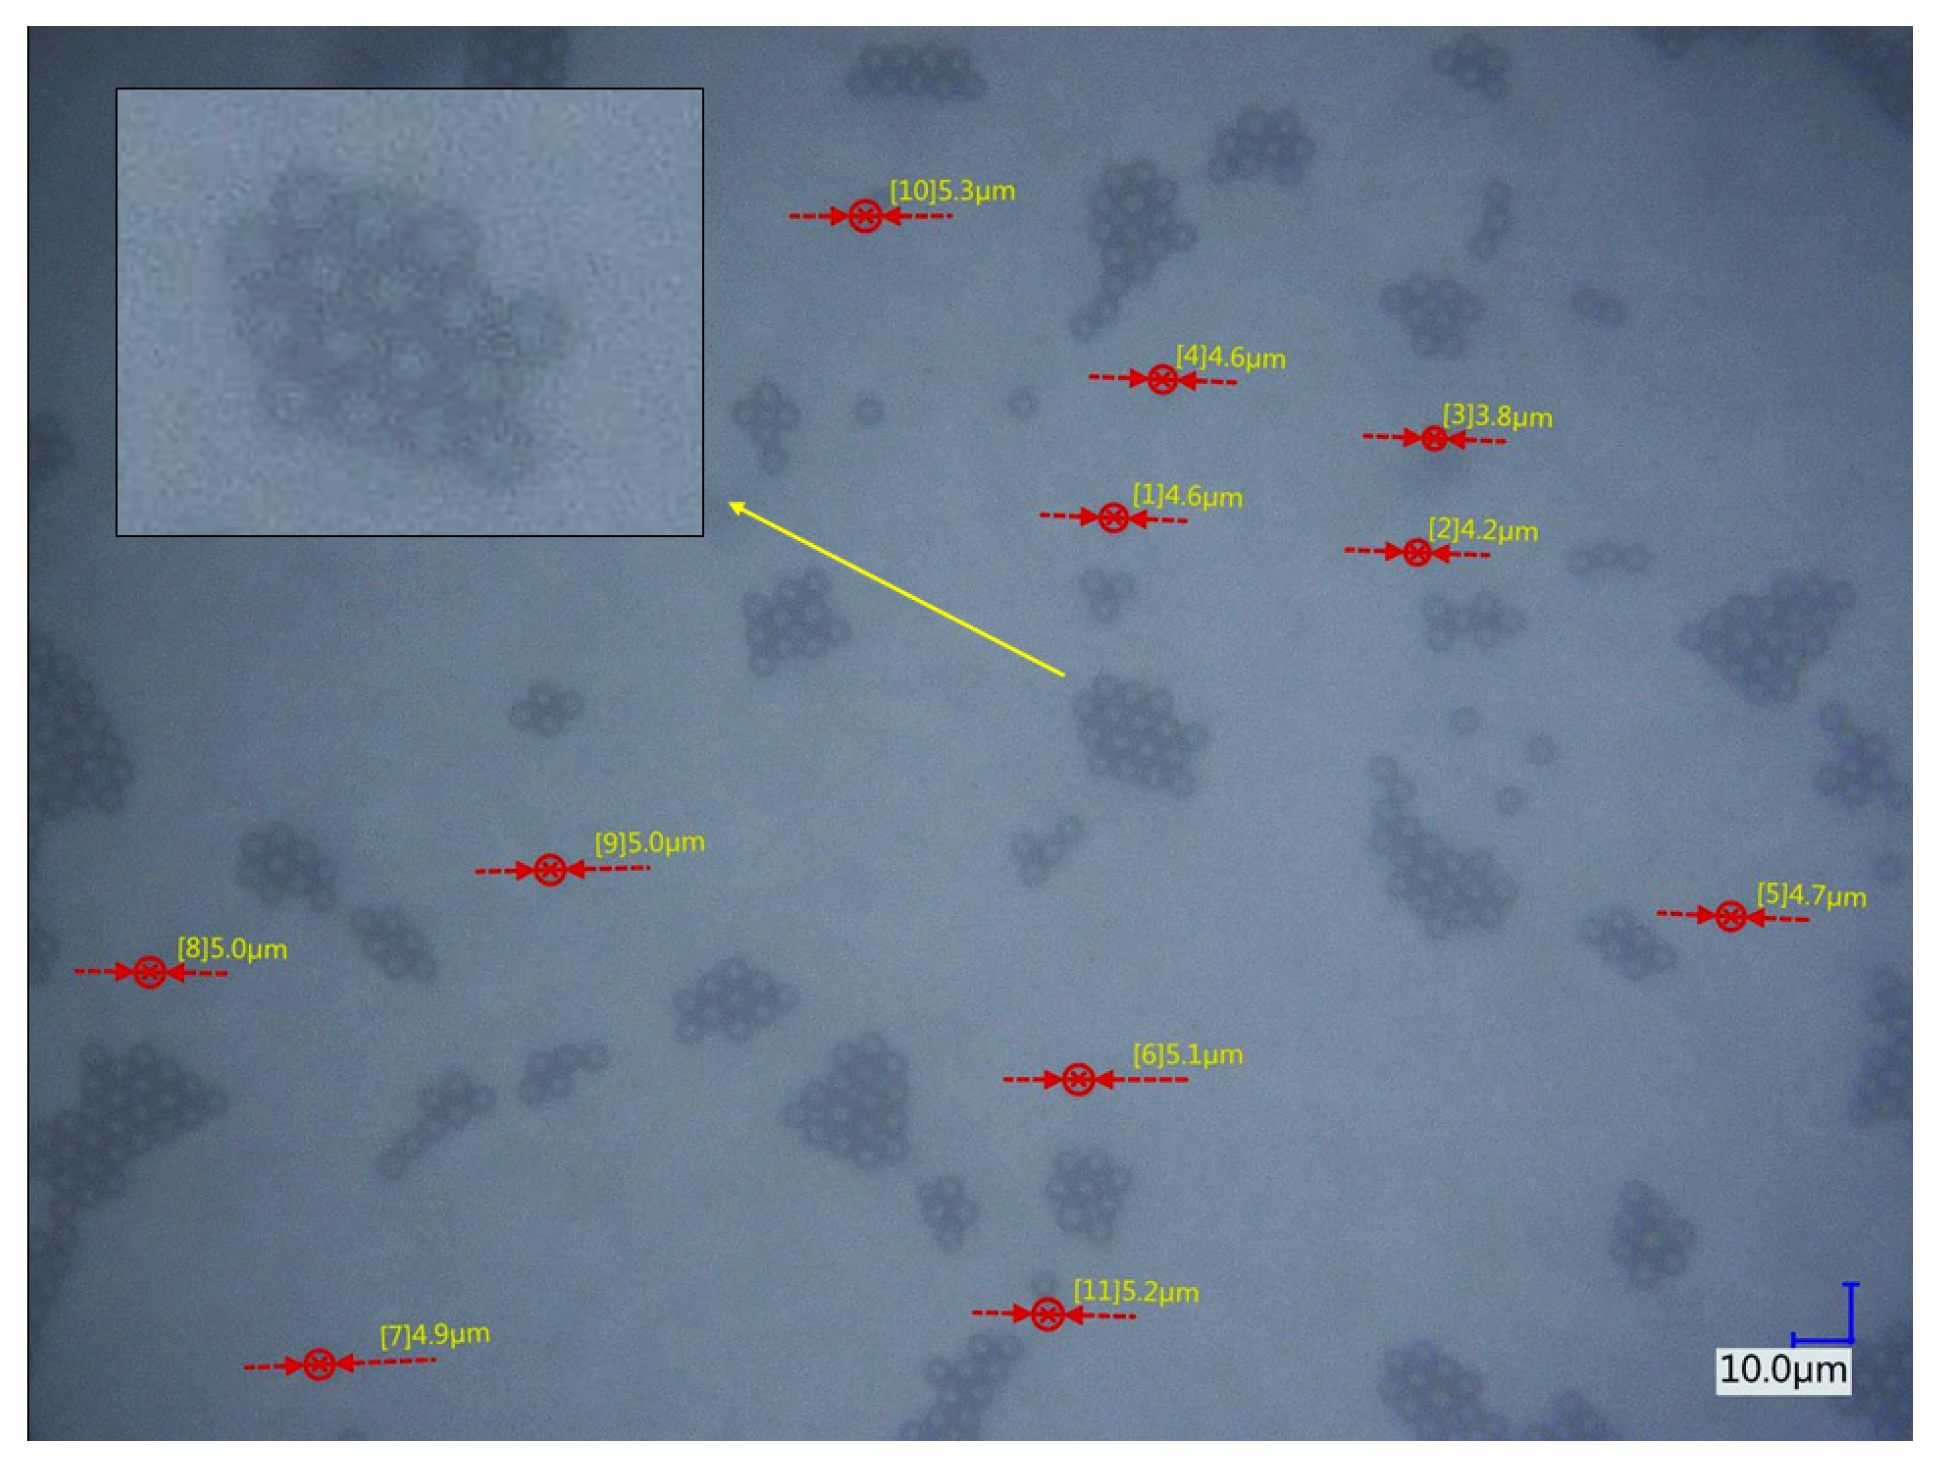
A sample of 5 µm diameter or 2.5 radius SPSP suspension was taken from the manufacturer’s bottle and allowed to dry on a slide for microscopic observation (Figure 5). The diameter measurements (4.6; 4.2; 3.8; 4.6; 4.7; 5.1; 4.9; 5.5; 5.3; and 5.2) yielded an average of 4.76 μm and a standard deviation of 0.45 μm.
Figure 6 shows two main functions of the application developed in MATLAB for our portable optomechatronic system. The reflectance function with SPR (Figure 6a) is used to simulate a semicircular prism with 1–6 thin films and a dielectric medium at a given wavelength and to fit an experimental signal to a simulated theoretical signal. The reflectance function with Mie scattering (Figure 6b) is used to simulate a semicircular prism with 1–2 thin films and a dielectric medium at a given wavelength and to calculate the effective refractive index (Equation (4) or Equation (5)) using the Mie scattering theory.
For the simulation of SPR curves based on the Fresnel formalism, there is the free software WinSpall 3.01 [48]. There are also tables [49,50,51], MATLAB functions [52], a calculator [53], and software [54] that can help us verify, obtain, or display the Mie theory’s scattering functions for spherical particles.

5. Conclusions

In this work, we present a methodology for measuring the effective refractive index and concentration for a solution containing 5 μm diameter or 2.5 μm radius spherical polystyrene particles. We analyze the reflectance signals, their resonance angles, and depths, which are affected by SPR and scattering. This paper presents the mathematical tools used for SPR and scattering, the functionality of the portable optomechatronic system, and the control and simulation applications developed. The methodology includes measuring the thickness of the thin gold film (51 nm), which is very important because it determines the depth measurement range of the reflectance amplitude (0.0184 to 0.0237) for the concentrations used (0.00, 0.02, 0.05, 0.50, and 1.00%). The measurement error of the concentrations was 0.02% to 0.12% ( 2 × 10 6 RIU to 10 × 10 6 RIU). Possible sources of error in colloid and solution measurement are the degree of resolution of the system and the stability of the laser.

Author Contributions

Conceptualization, D.L.-M. and O.R.-Q.; methodology, D.L.-M., O.R.-Q., A.S.-Á., G.E.Q.-V. and O.J.S.-H.; software, O.R.-Q., A.S.-Á. and O.J.S.-H.; validation, D.L.-M. and O.R.-Q.; formal analysis, D.L.-M., O.R.-Q., A.S.-Á., O.J.S.-H. and G.E.Q.-V.; Investigation, D.L.-M., O.R.-Q., A.S.-Á., G.E.Q.-V., M.M.R.-D., J.F.V.-C. and O.J.S.-H.; resources, D.L.-M., O.R.-Q. and G.E.Q.-V.; data curation, O.R.-Q., G.E.Q.-V. and O.J.S.-H.; writing—original draft preparation, D.L.-M., O.R.-Q., A.S.-Á. and G.E.Q.-V.; writing—review and editing, D.L.-M., O.R.-Q., A.S.-Á., G.E.Q.-V., M.M.R.-D., J.F.V.-C. and O.J.S.-H.; visualization, D.L.-M., O.R.-Q., A.S.-Á., G.E.Q.-V. and O.J.S.-H.; supervision, D.L.-M. and O.R.-Q.; project administration, D.L.-M. and O.R.-Q.; funding acquisition, G.E.Q.-V. and O.R.-Q. All authors have read and agreed to the published version of the manuscript.

Funding

The authors want to thank the Secretaría de Ciencia, Humanidades, Tecnología e Innovación (SECIHTI) for funding through the program Estancias Postdoctorales por México, CVU 740156 and CVU 101368.

Institutional Review Board Statement

Not applicable.

Informed Consent Statement

Not applicable.

Data Availability Statement

The data generated and analyzed during the current study are available from the corresponding author.

Conflicts of Interest

The authors declare no conflicts of interest.

References

  1. Frias, J.P.G.L.; Nash, R. Microplastics: Finding a consensus on the definition. Mar. Pollut. Bull. 2019, 138, 145–147. [Google Scholar] [CrossRef] [PubMed]
  2. Gigault, J.; Ter Halle, A.; Baudrimont, M.; Pascal, P.Y.; Gauffre, F.; Phi, T.L.; El Hadri, H.; Grassl, B.; Reynaud, S. Current opinion: What is a nanoplastic? Environ. Pollut. 2018, 235, 1030–1034. [Google Scholar] [CrossRef] [PubMed]
  3. Tuoriniemi, J.; Moreira, B.; Safina, G. Determining number concentrations and diameters of polystyrene particles by measuring the effective refractive index of colloids using surface plasmon resonance. Langmuir 2016, 32, 10632–10640. [Google Scholar] [CrossRef] [PubMed]
  4. Márquez-Islas, R.; Sánchez-Pérez, C.; García-Valenzuela, A. Determination of refractive index, size, and concentration of nonabsorbing colloidal nanoparticles from measurements of the complex effective refractive index. Opt. Lett. 2014, 39, 559–562. [Google Scholar] [CrossRef] [PubMed]
  5. Thompson, R.C.; Olsen, Y.; Mitchell, R.P.; Davis, A.; Rowland, S.J.; John, A.W.G.; McGonigle, D.; Russell, A.E. Lost at sea: Where is all the plastic? Science 2004, 304, 838. [Google Scholar] [CrossRef] [PubMed]
  6. Thompson, R.C.; Courtene-Jones, W.; Boucher, J.; Pahl, S.; Raubenheimer, K.; Koelmans, A.A. Twenty years of microplastic pollution research—What have we learned? Science 2024, 386, eadl2746. [Google Scholar] [CrossRef] [PubMed]
  7. Adediran, G.A.; Cox, R.; Jürgens, M.D.; Morel, E.; Cross, R.; Carter, H.; Pereira, M.G.; Read, D.S.; Johnson, A.C. Fate and behaviour of Microplastics (>25µm) within the water distribution network, from water treatment works to service reservoirs and customer taps. Water Res. 2024, 255, 121508. [Google Scholar] [CrossRef] [PubMed]
  8. Ya, H.; Jiang, B.; Xing, Y.; Zhang, T.; Lv, M.; Wang, X. Recent advances on ecological effects of microplastics on soil environment. Sci. Total Environ. 2021, 798, 149338. [Google Scholar] [CrossRef] [PubMed]
  9. Issac, M.N.; Kandasubramanian, B. Effect of microplastics in water and aquatic systems. Environ. Sci. Pollut. Res. 2021, 28, 19544–19562. [Google Scholar] [CrossRef] [PubMed]
  10. Vo, H.C.; Pham, M.H. Ecotoxicological effects of microplastics on aquatic organisms: A review. Environ. Sci. Pollut. Res. 2021, 28, 44716–44725. [Google Scholar] [CrossRef] [PubMed]
  11. Leonard, S.V.L.; Liddle, C.R.; Atherall, C.A.; Chapman, E.; Watkins, M.; Calaminus, S.D.J.; Rotchell, J.M. Microplastics in human blood: Polymer types, concentrations and characterisation using μFTIR. Environ. Int. 2024, 188, 108751. [Google Scholar] [CrossRef] [PubMed]
  12. Kwon, J.H.; Kim, J.W.; Pham, T.D.; Tarafdar, A.; Hong, S.; Chun, S.H.; Lee, S.H.; Kang, D.Y.; Kim, J.Y.; Kim, S.B.; et al. Microplastics in food: A review on analytical methods and challenges. Int. J. Environ. Res. Public Health 2020, 17, 6710. [Google Scholar] [CrossRef] [PubMed]
  13. Sapkale, D.; Kurkute, P.; Mistry, A.; Pandit, S.V. Polyethylene Microplastics Affected Survival Rate, Food Intake and Altered Oxidative Stress Parameters in Freshwater Snail Indoplanorbis exustus. Bull. Environ. Contam. Toxicol. 2023, 111, 67. [Google Scholar] [CrossRef] [PubMed]
  14. Berber, A.A. Genotoxic evaluation of polystyrene microplastic. Sak. Univ. J. Sci. 2019, 23, 358–367. [Google Scholar] [CrossRef]
  15. Primpke, S.; Wirth, M.; Lorenz, C.; Gerdts, G. Reference database design for the automated analysis of microplastic samples based on Fourier transform infrared (FTIR) spectroscopy. Anal. Bioanal. Chem. 2018, 410, 5131–5141. [Google Scholar] [CrossRef] [PubMed]
  16. Ragusa, A.; Notarstefano, V.; Svelato, A.; Belloni, A.; Gioacchini, G.; Blondeel, C.; Zucchelli, E.; De Luca, C.; D’avino, S.; Gulotta, A.; et al. Raman microspectroscopy detection and characterisation of microplastics in human breastmilk. Polymers 2022, 14, 2700. [Google Scholar] [CrossRef] [PubMed]
  17. Rivera-Rivera, D.M.; Quintanilla-Villanueva, G.E.; Luna-Moreno, D.; Sánchez-Álvarez, A.; Rodríguez-Delgado, J.M.; Cedillo-González, E.I.; Kaushik, G.; Villarreal-Chiu, J.F.; Rodríguez-Delgado, M.M. Exploring Innovative Approaches for the Analysis of Micro- and Nanoplastics: Breakthroughs in (Bio)Sensing Techniques. Biosensors 2025, 15, 44. [Google Scholar] [CrossRef] [PubMed]
  18. Sierra, I.; Chialanza, M.R.; Faccio, R.; Carrizo, D.; Fornaro, L.; Pérez-Parada, A. Identification of microplastics in wastewater samples by means of polarized light optical microscopy. Environ. Sci. Pollut. Res. 2020, 27, 7409–7419. [Google Scholar] [CrossRef] [PubMed]
  19. Miserli, K.; Lykos, C.; Kalampounias, A.G.; Konstantinou, I. Screening of microplastics in aquaculture systems (fish, mussel, and water samples) by FTIR, scanning electron microscopy–energy dispersive spectroscopy and micro-raman spectroscopies. Appl. Sci. 2023, 13, 9705. [Google Scholar] [CrossRef]
  20. Ompala, C.; Renault, J.P.; Taché, O.; Cournède, É.; Devineau, S.; Chivas-Joly, C. Stability and dispersibility of microplastics in experimental exposure medium and their dimensional characterization by SMLS, SAXS, Raman microscopy, and SEM. J. Hazard. Mater. 2024, 469, 134083. [Google Scholar] [CrossRef] [PubMed]
  21. Lee, J.H.; Kim, M.J.; Kim, C.S.; Cheon, S.J.; Choi, K.I.; Kim, J.; Jung, J.; Yoon, J.K.; Lee, S.H.; Jeong, D.H. Detection of microplastic traces in four different types of municipal wastewater treatment plants through FT-IR and TED-GC-MS. Environ. Pollut. 2023, 333, 122017. [Google Scholar] [CrossRef] [PubMed]
  22. Santos, L.H.M.L.M.; Insa, S.; Arxé, M.; Buttiglieri, G.; Rodríguez-Mozaz, S.; Barceló, D. Analysis of microplastics in the environment: Identification and quantification of trace levels of common types of plastic polymers using pyrolysis-GC/MS. MethodsX 2023, 10, 102143. [Google Scholar] [CrossRef] [PubMed]
  23. Luna-Moreno, D.; Sánchez-Espinosa, Y.M.; Ponce de León, Y.R.; Arias, E.N.; Garnica-Campos, G. Virtual instrumentation in LabVIEW for multiple optical characterizations on the same opto-mechanical system. Opt.-Int. J. Light Electron Opt. 2015, 126, 1923–1929. [Google Scholar] [CrossRef]
  24. Pines, D.; Bohm, D. A collective description of electron interactions: II. Collective vs individual particle aspects of the interactions. Phys. Rev. 1952, 85, 338. [Google Scholar] [CrossRef]
  25. Otto, A. Excitation of nonradiative surface plasma waves in silver by the method of frustrated total reflection. Z. Für Phys. A Hadron. Nucl. 1968, 216, 398–410. [Google Scholar] [CrossRef]
  26. Kretschmann, E. Die bestimmung optischer konstanten von metallen durch anregung von oberflächenplasmaschwingungen. Z. Fur Phys. 1971, 241, 313–324. [Google Scholar] [CrossRef]
  27. Liedberg, B.; Nylander, C.; Lunström, I. Surface plasmon resonance for gas detection and biosensing. Sens. Actuators 1983, 4, 299–304. [Google Scholar] [CrossRef]
  28. Huang, Y.H.; Ho, H.P.; Kong, S.K.; Kabashin, A.V. Phase-sensitive surface plasmon resonance biosensors: Methodology, instrumentation and applications. Ann. Phys. 2012, 524, 637–662. [Google Scholar] [CrossRef]
  29. Salamon, Z.; Macleod, H.A.; Tollin, G. Coupled plasmon-waveguide resonators: A new spectroscopic tool for probing proteolipid film structure and properties. Biophys. J. 1997, 73, 2791–2797. [Google Scholar] [CrossRef] [PubMed]
  30. Homola, J.; Vaisocherová, H.; Dostálek, J.; Piliarik, M. Multi-analyte surface plasmon resonance biosensing. Methods 2005, 37, 26–36. [Google Scholar] [CrossRef] [PubMed]
  31. Karabchevsky, A.; Krasnykov, O.; Abdulhalim, I.; Hadad, B.; Goldner, A.; Auslender, M.; Hava, S. Metal grating on a substrate nanostructure for sensor applications. Photonics Nanostruct. 2009, 7, 170–175. [Google Scholar] [CrossRef]
  32. Shalabney, A.; Khare, C.; Rauschenbach, B.; Abdulhalim, I. Sensitivity of surface plasmon resonance sensors based on metallic columnar thin films in the spectral and angular interrogations. Sens. Actuators B Chem. 2011, 159, 201–212. [Google Scholar] [CrossRef]
  33. Szunerits, S.; Shalabney, A.; Boukherroub, R.; Abdulhalim, I. Dielectric coated plasmonic interfaces: Their interest for sensitive sensing of analyte-ligand interactions. Rev. Anal. Chem. 2012, 31, 15–28. [Google Scholar] [CrossRef]
  34. Yang, D.; Liu, X.; Ma, J.; Cui, B.; Wang, Y.; Xu, J.; Zhang, Y.; Ding, H.; Wang, D.; Liu, Q.; et al. Probing Single-Cell Adhesion Kinetics and Nanomechanical Force with Surface Plasmon Resonance Imaging. ACS Nano 2025, 19, 2651–2664. [Google Scholar] [CrossRef] [PubMed]
  35. Bohren, C.F.; Huffman, D.R. Absorption and Scattering of Light by Small Particles; John Wiley & Sons: Hoboken, NJ, USA, 2008. [Google Scholar]
  36. Gustav, M. Beitraege zur Optik trueber Medien. Ann. Physik 1908, 25, 377. [Google Scholar]
  37. Barrera, R.G.; Garcıa-Valenzuela, A. Coherent reflectance in a system of random Mie scatterers and its relation to the effective-medium approach. J. Opt. Soc. Am. A 2003, 20, 296–311. [Google Scholar] [CrossRef] [PubMed]
  38. García-Valenzuela, A.; Barrera, R.G.; Sánchez-Pérez, C.; Reyes-Coronado, A.; Méndez, E.R. Coherent reflection of light from a turbid suspension of particles in an internal-reflection configuration: Theory versus experiment. Opt. Express 2005, 13, 6723–6737. [Google Scholar] [CrossRef] [PubMed]
  39. Van de Hulst, H.C. Light scattering by small particles. Q. J. R. Meteorol. Soc. 1958, 84, 198–199. [Google Scholar] [CrossRef]
  40. Sánchez-Alvarez, A.; Rodríguez-Quiroz, O.; Quintanilla-Villanueva, G.E.; Rodríguez-Delgado, M.M.; Villarreal-Chiu, J.F.; Silva-Hernández, O.J.; Luna-Moreno, D. Development of a Portable Optomechatronic System to Obtain the Characterization of Transparent Materials and Dielectric Thin Films. Optics 2024, 5, 595–610. [Google Scholar] [CrossRef]
  41. Macleod, H.A. Thin-film optical filters. In Thin-Film Optical Filters, 4th ed.; CRC Press: Boca Raton, FL, USA, 2010; pp. 1–782. [Google Scholar]
  42. SCHOTT. 2025. Available online: https://www.schott.com/pt-br/special-selection-tools/interactive-abbe-diagram (accessed on 27 May 2025).
  43. Refractive Index of Au (Gold)—Johnson n.d. Available online: https://refractiveindex.info/?shelf=main&book=Au&page=Johnson (accessed on 27 May 2025).
  44. Refractive Index of H2O, D2O (Water, Heavy Water, Ice)—Hale n.d. Available online: https://refractiveindex.info/?shelf=main&book=H2O&page=Hale (accessed on 30 June 2025).
  45. Refractive Index of PLASTICS—PS n.d. Available online: https://refractiveindex.info/?shelf=3d&book=plastics&page=ps (accessed on 30 June 2025).
  46. Quintanilla-Villanueva, G.E.; Rodríguez-Quiroz, O.; Sánchez-Álvarez, A.; Rodríguez-Delgado, J.M.; Villarreal-Chiu, J.F.; Luna-Moreno, D.; Rodríguez-Delgado, M.M. An Innovative Enzymatic Surface Plasmon Resonance-Based Biosensor Designed for Precise Detection of Glycine Amino Acid. Biosensors 2025, 15, 81. [Google Scholar] [CrossRef] [PubMed]
  47. Malyuskin, O. Microplastic detection in soil and water using resonance microwave spectroscopy: A feasibility study. IEEE Sens. J. 2020, 20, 14817–14826. [Google Scholar] [CrossRef]
  48. Res-Tec-DE. 2025. Available online: http://www.res-tec.de/downloads.html (accessed on 27 May 2025).
  49. Lowan, A. Tables of Scattering Functions for Spherical Particles; Applied Math Series 4; National Bureau of Standards: Washington, DC, USA, 1948.
  50. Gumprecht, R.O.; Sliepcevich, C.M. Tables of Light-Scattering Functions for Spherical Particles; Engineering Research Institute, University of Michigan: Ann Arbor, MI, USA, 1951. [Google Scholar]
  51. Goldberg, B. New Computation of the Mie Scattering Functions for Spherical Particles. J. Opt. Soc. Am. 1953, 43, 1221. [Google Scholar] [CrossRef]
  52. Matzler, C. MATLAB Functions for Mie Scattering and Absorption; Institute of Applied Physics, University of Bern: Bern, Switzerland, 2002. [Google Scholar]
  53. Mie Scattering Calculator. 2025. Available online: https://omlc.org/calc/mie_calc.html (accessed on 27 May 2025).
  54. Ma, D.; Tuersun, P.; Cheng, L.; Zheng, Y.; Abulaiti, R. PyMieLab_V1.0: A software for calculating the light scattering and absorption of spherical particles. Heliyon 2022, 8, e11469. [Google Scholar] [CrossRef] [PubMed]
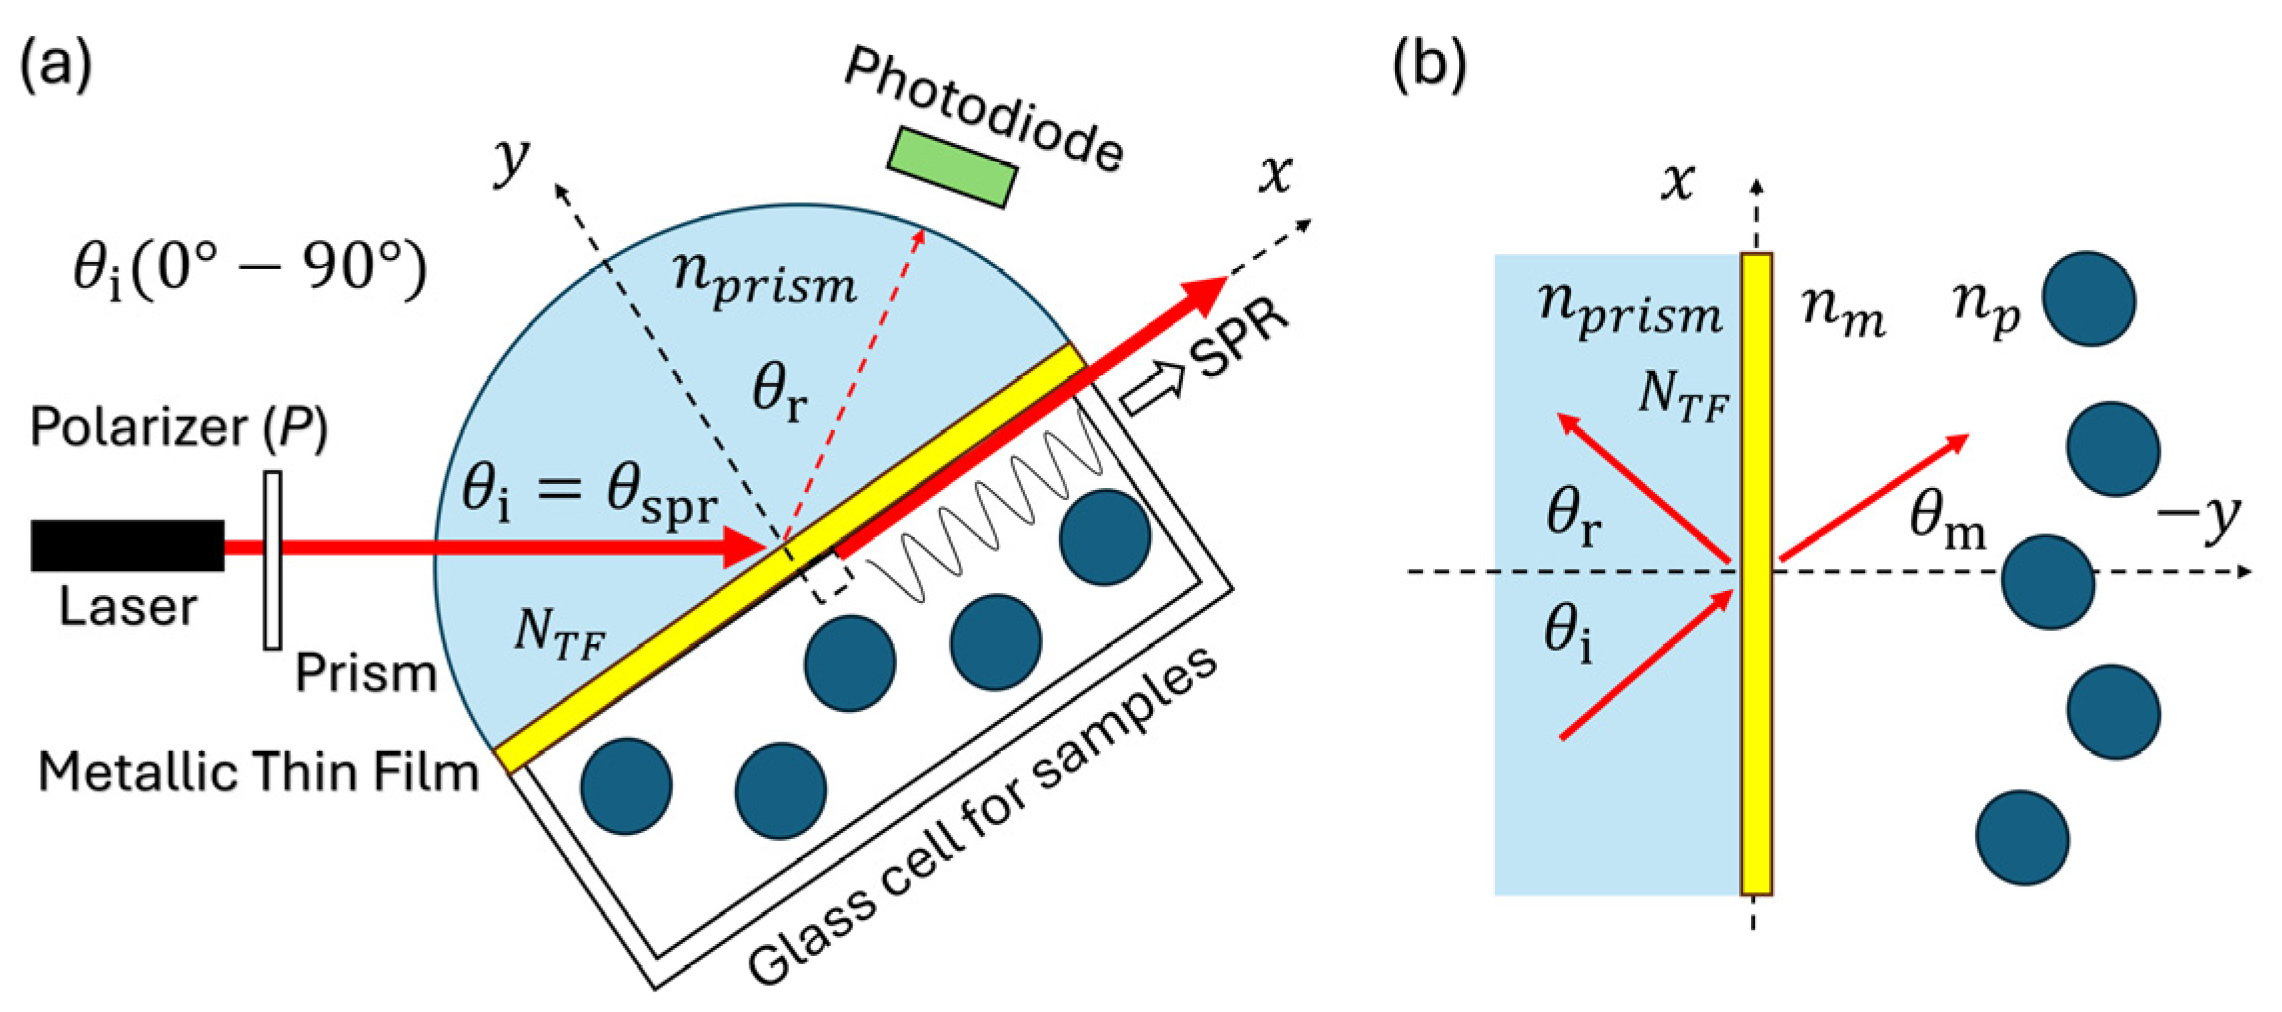
Figure 1. (a) Sensor, with Kretschmann–Raether configuration, for the detection of particles in a colloid or suspension, and (b) reflection and transmission of coherent light from a laser (red arrow) in a dielectric medium with particles.
Chemosensors 13 00257 g001
Figure 2. Simulation of reflectance for a solution containing SPSP of 25 nm (a,b) and 2.5 µm (c,d) radius, with concentrations of 0.00, 0.02, 0.05, 0.50, and 1.00% in distilled water. The prism is an FK5, which has a thin film of gold (51 nm in thickness) and a cell for the sample of colloid or solution.
Chemosensors 13 00257 g002
Figure 3. Simulation of scattering and SPR. (a) refractive index, (b) extinction coefficient, and (cf) respective reflectances for solutions with spherical particles with a 0.5 µm, 2.5 µm, 5 µm, and 7.5 µm radius in distilled water.
Chemosensors 13 00257 g003
Figure 4. (a) Fitting of the experimental reflectance of air to the theoretical signal, (b) fitting of the experimental reflectance of distilled water to the theoretical signal, (c) SPR-scattering reflectance signals for different percentages of PS in distilled water, and (d) theoretical calculation and experimental measurement for different concentrations.
Chemosensors 13 00257 g004
Figure 5. Polystyrene microspheres of 5 μm µm diameter or 2.5 radius SPSP viewed with a digital microscope (VHX-5000, Keyence Corporation, Osaka, Japan).
Chemosensors 13 00257 g005
Figure 6. An application developed in MATLAB to process the theoretical and experimental signals of (a) SPR and (b) scattering.
Chemosensors 13 00257 g006
Table 1. Theoretical effective refractive indices for spherical polystyrene particles with a radius of 25 nm and 2.5 µm with concentrations of 0.00, 0.02, 0.05, 0.50, and 1.00% immersed in distilled water.
n ~ e f f (Equation (4))
a = 25   n m
n ~ e f f (Equation (5) or Equation (15))
a = 2.5   μ m
% PS n k n k
0.001.33140001.3314000
0.021.3314501.3816 × 10−71.3314026.5749 × 10−6
0.051.3315243.4548 × 10−71.3314041.6437 × 10−5
0.501.3326443.4656 × 10−61.3314401.6437 × 10−4
1.001.3338936.9550 × 10−61.3314803.2874 × 10−4
Table 2. Experimental effective refractive indices for SPSP in distilled water. The spherical PS particles have a 5 μm diameter or 2.5 radius, a refractive index of n p = 1.5870 , and different concentrations (%).
n ~ e f f (Equations (16) and (17))
a = 2.5   μ m
%   P S n k
0.001.3314000
0.051.3314031.6437 × 10−5
0.171.3314145.5886 × 10−5
0.521.3314421.7095 × 10−4
0.951.3314763.1231 × 10−4
Disclaimer/Publisher’s Note: The statements, opinions and data contained in all publications are solely those of the individual author(s) and contributor(s) and not of MDPI and/or the editor(s). MDPI and/or the editor(s) disclaim responsibility for any injury to people or property resulting from any ideas, methods, instructions or products referred to in the content.