Article

Developing a Quantitative Profiling Method for Detecting Free Fatty Acids in Crude Lanolin Based on Analytical Quality by Design

1
Pharmaceutical Informatics Institute, College of Pharmaceutical Sciences, Zhejiang University, Hangzhou 310058, China
2
Jinhua Institute, Zhejiang University, Jinhua 321016, China
3
Nowi Biotechnology Co., Ltd., Ji’an 343000, China
4
National Key Laboratory of Chinese Medicine Modernization, Zhejiang University, Hangzhou 310058, China
*
Author to whom correspondence should be addressed.
These authors contributed equally to this work.
Chemosensors 2025, 13(4), 126; https://doi.org/10.3390/chemosensors13040126
Submission received: 6 February 2025 / Revised: 23 March 2025 / Accepted: 26 March 2025 / Published: 3 April 2025
(This article belongs to the Special Issue Spectroscopic Techniques for Chemical Analysis)

Abstract

:
In this study, a quantitative profiling method for detecting free fatty acids in crude lanolin based on the Quality by Design (QbD) concept was developed. High-performance liquid chromatography (HPLC) equipped with a charged aerosol detector (CAD) and a Proshell 120 EC C18 column was employed for the separation of crude lanolin components. Initially, the analytical target profile and critical method attributes were defined. Potential critical method parameters, including column temperature, flow rate, isocratic run time, gradient end organic phase ratio, and gradient time, were identified using fishbone diagrams and single-factor experiments. The definitive screening design (DSD) was then utilized to screen and optimize these parameters. Stepwise regression was applied to establish quantitative models between the critical method attributes and the method parameters. Subsequently, the method operable design region (MODR) was calculated and was successfully verified. The analytical conditions established were configured with 0.1% formic acid in water and 0.1% formic acid in acetonitrile serving as the mobile phases. The flow rate was set at 0.8 mL/min, and the column temperature was maintained at 35 °C with the evaporation tube temperature also set at 35 °C. An injection volume of 10 μL was used for each analysis. The gradient elution conditions were as follows: from 0 to 30 min, 75% of solvent B was used, and from 30 to 60 min, the proportion of solvent B was increased from 75% to 79%. Ten components, including 12-hydroxystearic acid, 2-hexyldecanoic acid, and palmitic acid, were identified by mass spectrometry, and seven common peaks were found in the fingerprints. The contents of palmitic acid, oleic acid, and stearic acid in the crude lanolin were quantitatively determined. Both the fingerprint and quantitative analysis methods were validated. The method was applied to analyze 15 batches of crude lanolin from different sources. The new established quantitative profiling method for free fatty acids can be potentially used for industrial applications to enhance the quality control of crude lanolin.

1. Introduction

Quality by Design (QbD) is a systematic, risk-based approach towards drug development. It commences with predefined objectives and emphasizes understanding and controlling products and processes [1]. In recent years, the QbD approach has been widely applied to the development of analytical methods for traditional Chinese medicines [2,3,4,5,6], chemical drugs [7,8,9,10], and biological drugs [11,12,13] known as Analytical Quality by Design (AQbD) [14]. Currently, the concept of AQbD and related technologies are increasingly used in the development of analytical methods [15,16,17,18]. The AQbD approach is involved in the establishment of the analytical target profile (ATP), the identification of critical method parameters (CMPs) and critical method attributes (CMAs), the investigation of the impact of parameters through experimental design, the determination of the method operable design region (MODR), and the execution of method validation, among other steps [19].
Lanolin, a lipid-soluble secretion derived from the sebaceous glands of sheep’s wool, is characterized by significant compositional variability due to differences in wool origin and seasonal factors. This complexity is attributed to the diverse array of components present in lanolin, with approximately 95% being composed of esters formed by sterols, fatty alcohols, and triterpene alcohols, combined with roughly equivalent amounts of fatty acids. The remaining fraction consists of free fatty acids, alcohols, and hydrocarbons [20,21]. Crude lanolin can be further processed into refined lanolin, cholesterol, lanolin acids, industrial lanolin alcohols, and hundreds of other products.
Generally, untreated crude lanolin is a dark brown, slightly viscous oily paste with a distinctive odor, and contains a significant amount of water and impurities [22]. Through a series of refining processes such as washing, distillation, or purification processes, crude lanolin is transformed into refined lanolin. The refined product is identified as a yellow, semi-transparent, viscous oily paste with a unique odor [23,24], and is recognized for its excellent emulsifying and penetrating properties. Due to its versatility, refined lanolin is included in the Chinese Pharmacopoeia as a pharmaceutical excipient and is also widely used in the cosmetics industry [25,26,27].
Specific evaluation criteria for lanolin are stipulated in the Chinese Pharmacopoeia, including characteristics, melting point, acid value, saponification value, and so on [28]. The types and contents of fatty acids in crude lanolin are known to significantly influence its physicochemical properties and dictate the selection of subsequent processing techniques. However, the absence of direct methods for detecting free fatty acids in lanolin has been identified as a challenge, highlighting the need for the development of robust analytical methods to quantify fatty acids in various types of crude lanolin.
Profiling originates from metabolomics and refers to the qualitative or quantitative analysis of a set of known or specific metabolites, typically targeting compounds with particular chemical properties or biological functions. In chromatographic analysis, profiling involves the separation and detection of specific components (such as fatty acids or phenolic compounds), providing detailed chemical composition information for applications like quality assessment and ingredient traceability studies [29,30]. Fingerprints can be defined as a characteristic instrumental outline reflecting the complex chemical composition of the analyzed sample that can be evaluated through mathematical statistical methods (such as similarity calculation) [31,32]. In this study, crude lanolin was selected as the analytical object, and a quantitative profiling method for fatty acids was established following the AQbD process. The research included the screening and optimization of method parameters through definitive screening design (DSD). Subsequently, the MODR was established and validated to determine the optimal analytical conditions. Specific chromatographic peaks were identified using mass spectrometry and reference standards. Finally, method validation was conducted, and the method was applied to detect different types of crude lanolin.

2. Reagents

Acetonitrile (chromatographic purity) was purchased from Anhui TEDIA High Purity Solvents Co., Ltd. (Anqing, China). Isopropanol (chromatographic purity) was obtained from Merck (Darmstadt, Germany). Formic acid and n-heptane (chromatographic purity) were both purchased from Shanghai Aladdin Biochemical Technologies Co., Ltd. (Shanghai, China). Palmitic acid (HPLC 99%, batch number: C2317556), oleic acid (HPLC 99%, batch number: K2208593), and stearic acid (GC > 99%, batch number: H2316723) were all purchased from Shanghai Aladdin Biochemical Technologies Co., Ltd. (Shanghai, China). Deionized water was prepared using a water purification system (Milli-Q, Millipore, Billerica, MA, USA). Different batches of crude lanolin were provided by Jiangxi Nowi Biotechnology Co., Ltd. (Nanjing, China)

3. Methods

3.1. Chromatographic Analysis Conditions

Samples were analyzed using a high-performance liquid chromatography (HPLC) system equipped with a charged aerosol detector (CAD) (Vanquish, Thermo Fisher Scientific, Waltham, MA, USA). The chromatographic separation was performed on a Proshell 120 EC C18 column (4.6 mm × 100 mm, 2.7 μm, Agilent Technologies, Santa Clara, CA, USA). The mobile phase A was prepared as 0.1% formic acid in water, while mobile phase B consisted of 0.1% formic acid in acetonitrile. A gradient elution was employed with the following conditions: 0–30 min, 75% B; 30–60 min, 75–79% B. After each injection, the column was equilibrated for 10 min with a mixture of 0.1% formic acid in water and 0.1% formic acid in acetonitrile at a ratio of 25:75 (v:v). The flow rate was maintained at 0.80 mL/min, the column temperature was controlled at 35 °C, and the evaporation tube temperature was also set at 35 °C. The injection volume was fixed at 10 μL.

3.2. Solution Preparation

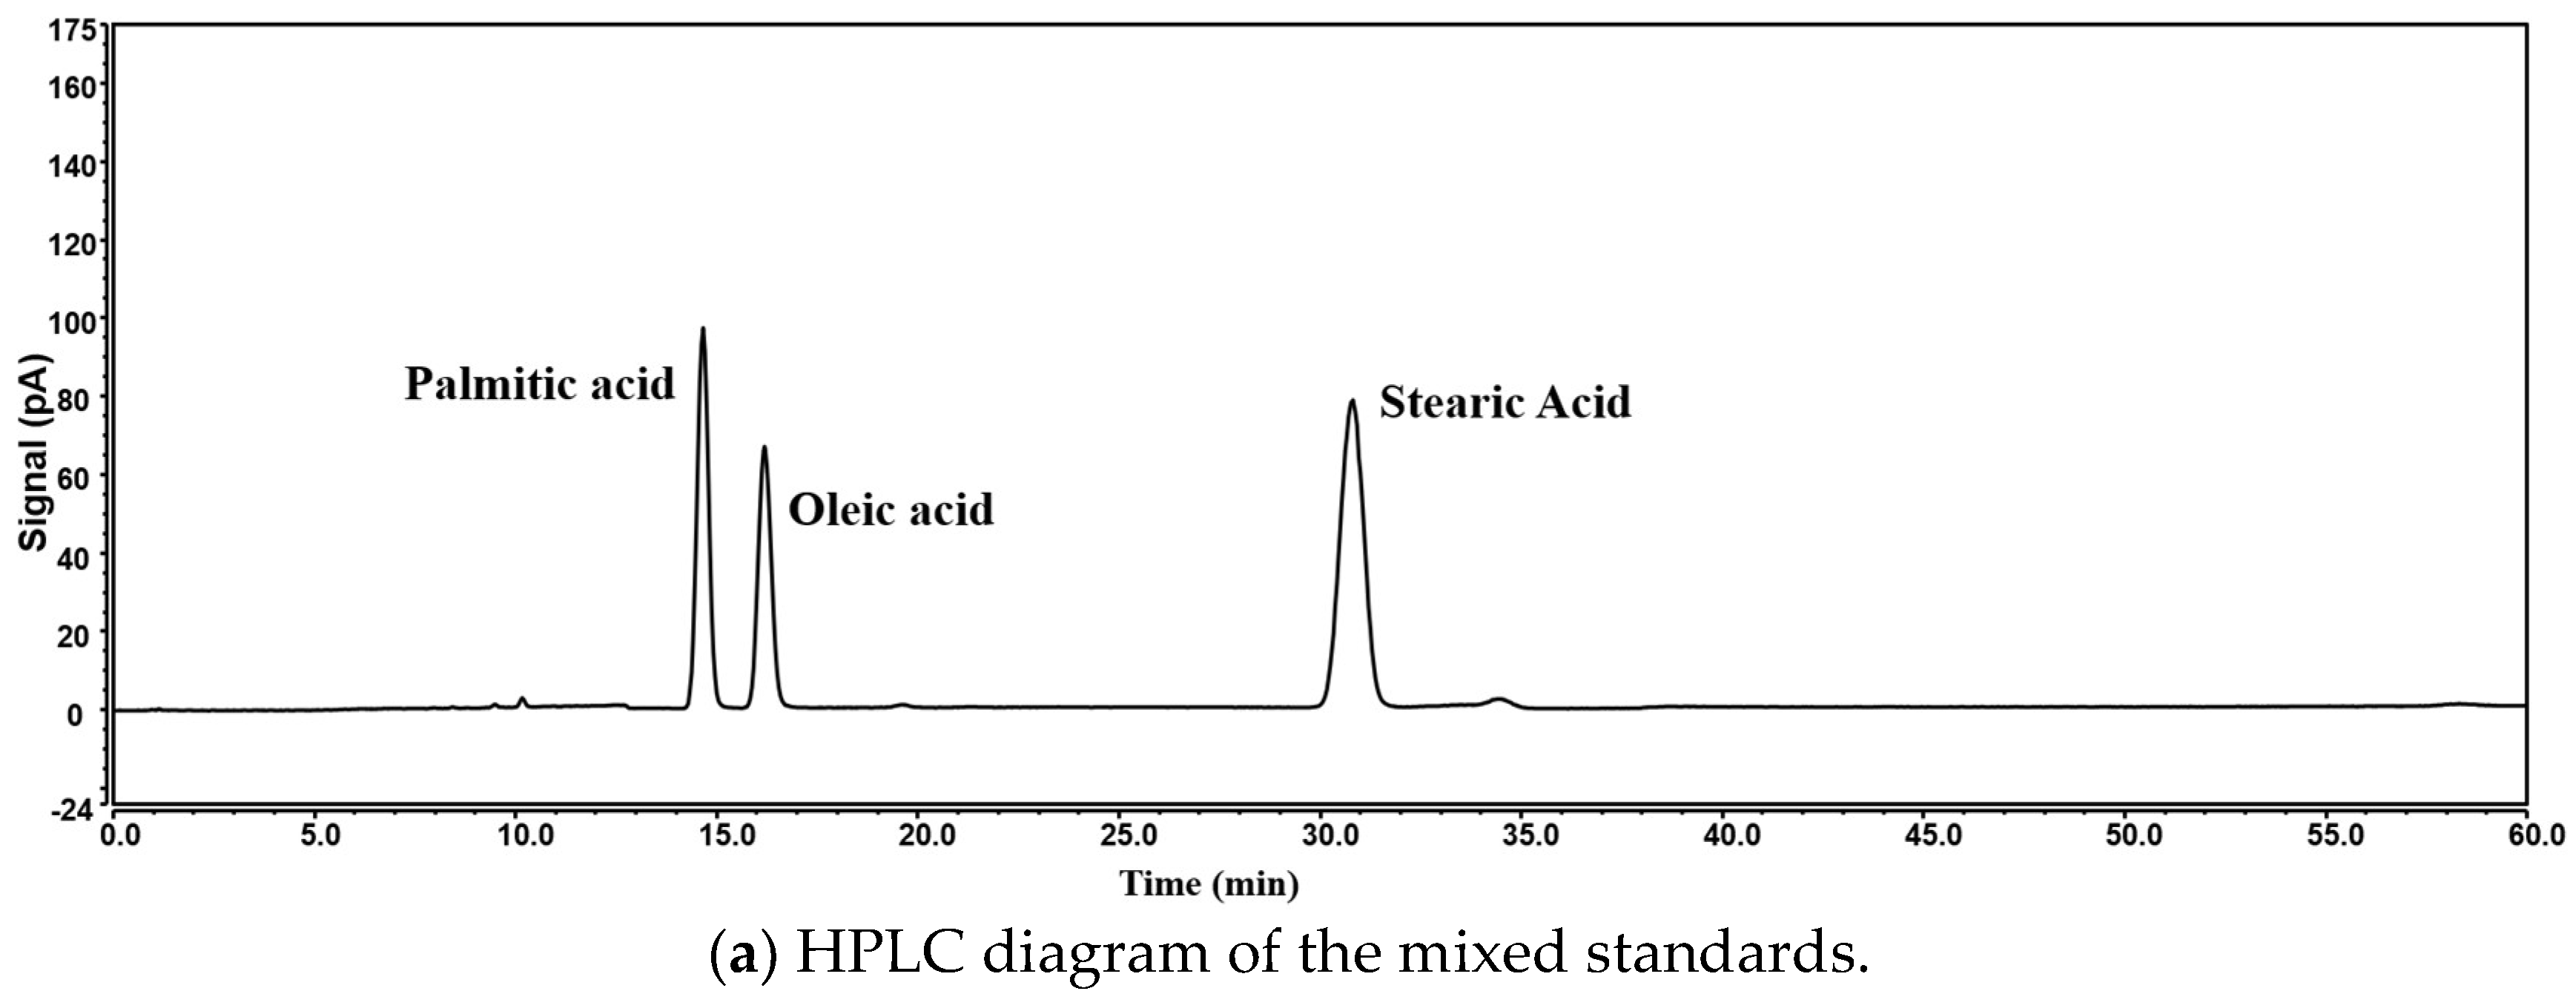
3.2.1. Preparation of the Mixed Standard Solution

The preparation of the standard solution was carried out as follows: Palmitic acid, oleic acid, and stearic acid were accurately weighed as reference standards using a balance (MCA125P-2CCN-U, Sartorius, Göttingen, Germany) and transferred into a volumetric flask. The mixed standard solution containing 49.97 μg/mL of palmitic acid, 33.94 μg/mL of oleic acid, and 45.43 μg/mL of stearic acid was prepared. An aliquot of this standard solution was injected into the high-performance liquid chromatograph, and the resulting chromatogram was recorded, as illustrated in Figure 1a.

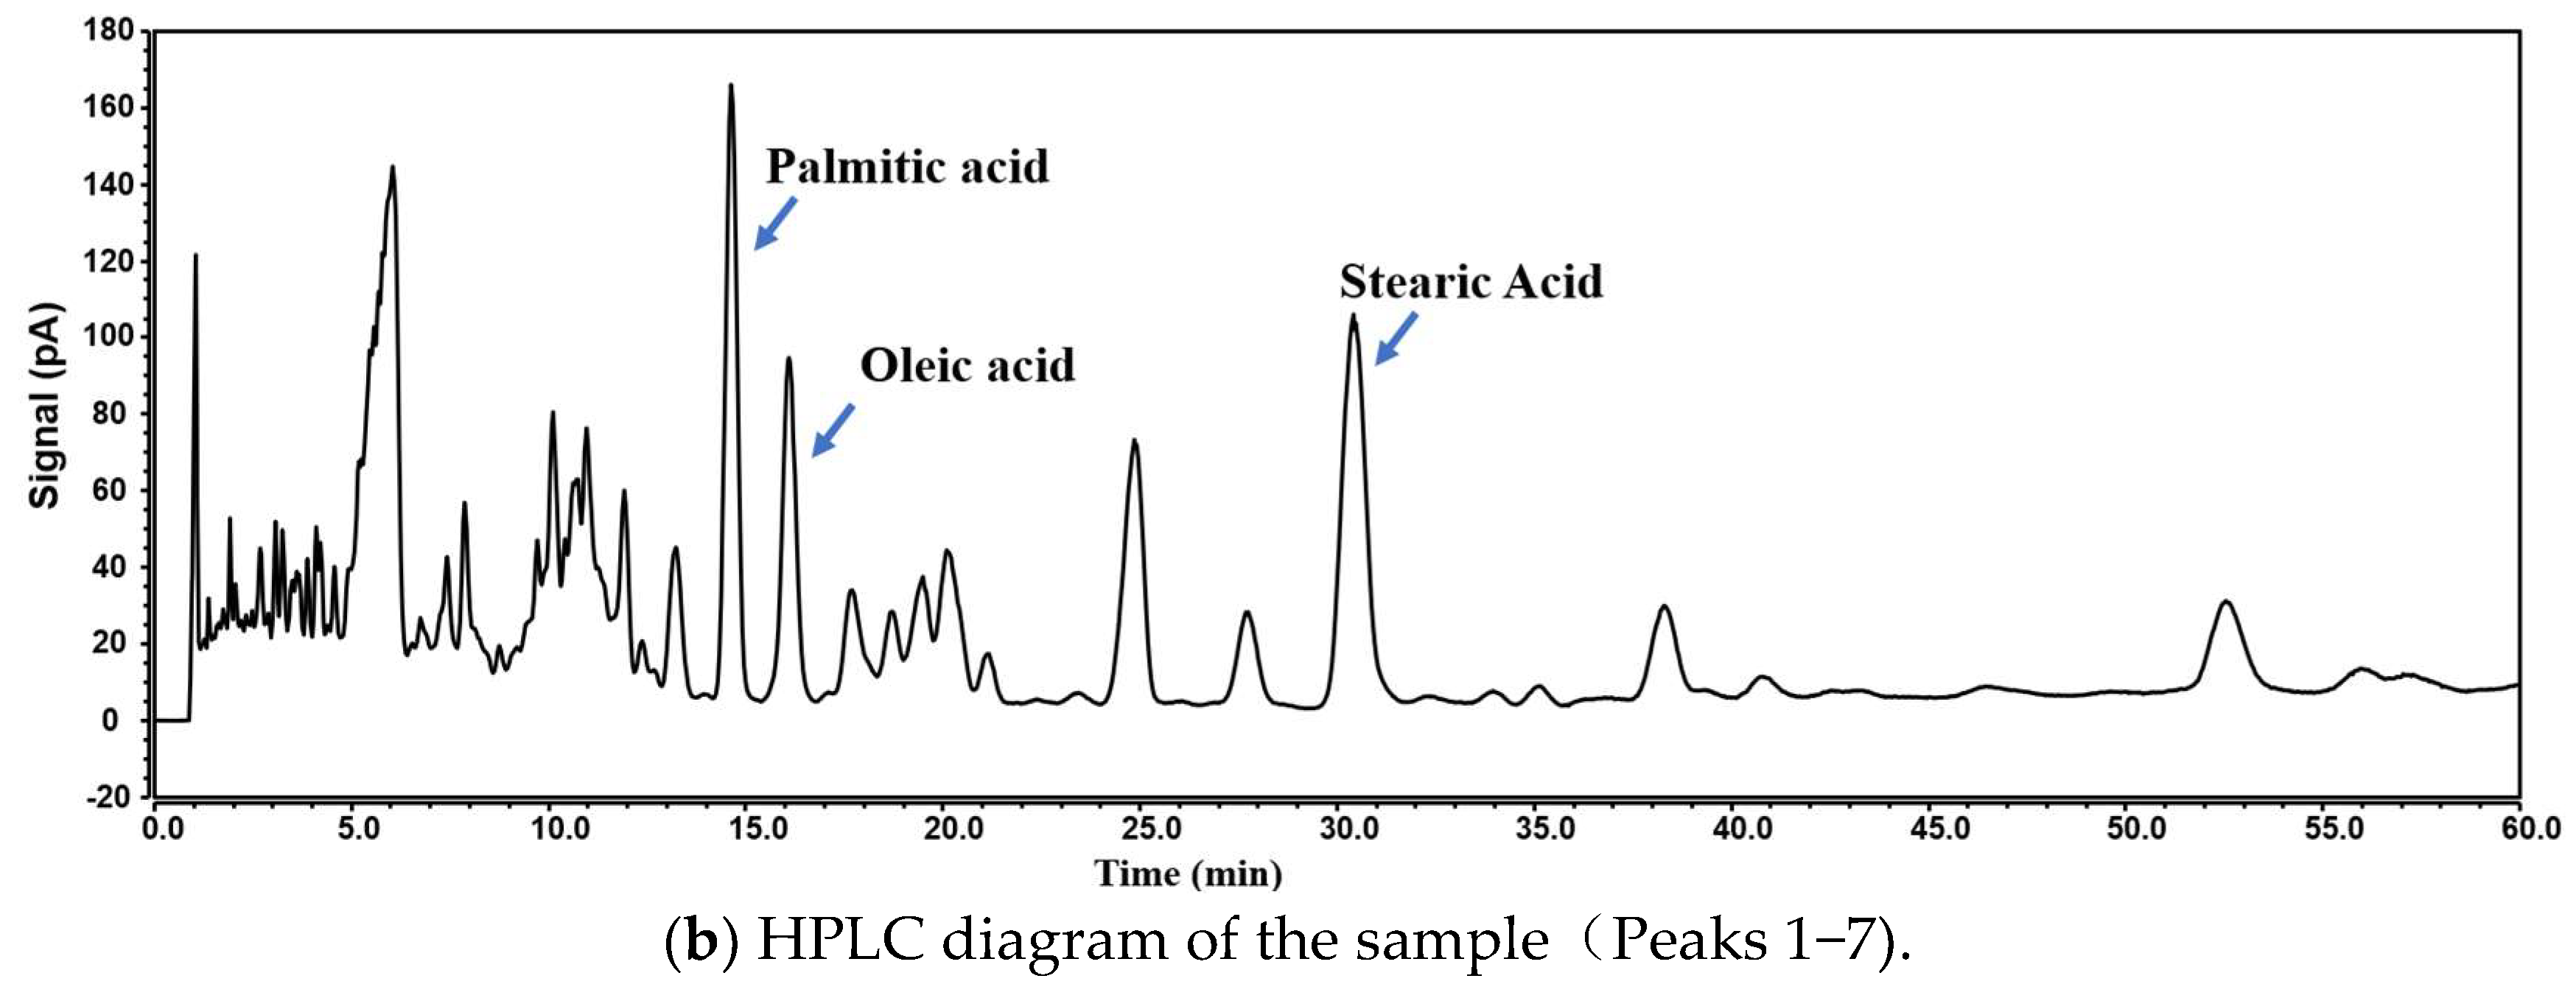
3.2.2. Preparation of the Test Solution

Different types of crude lanolin were melted in a water bath maintained at approximately 55 °C (HH4, Shanghai Licheng Instrument Technology Co., Ltd., Shanghai, China). The melted lanolin was weighed to approximately 500 mg using a balance (MCA125P-2CCN-U, Sartorius, Germany) and transferred into a 10 mL volumetric flask. The flask was then filled to the mark with heptane (chromatographic purity) as the solvent and mixed well to ensure complete dissolution. The resulting solution was filtered through a 0.22 μm filter membrane to remove any particulate matter. An aliquot of the filtered solution was injected into the high-performance liquid chromatograph, and the chromatogram was recorded, as shown in Figure 1b.

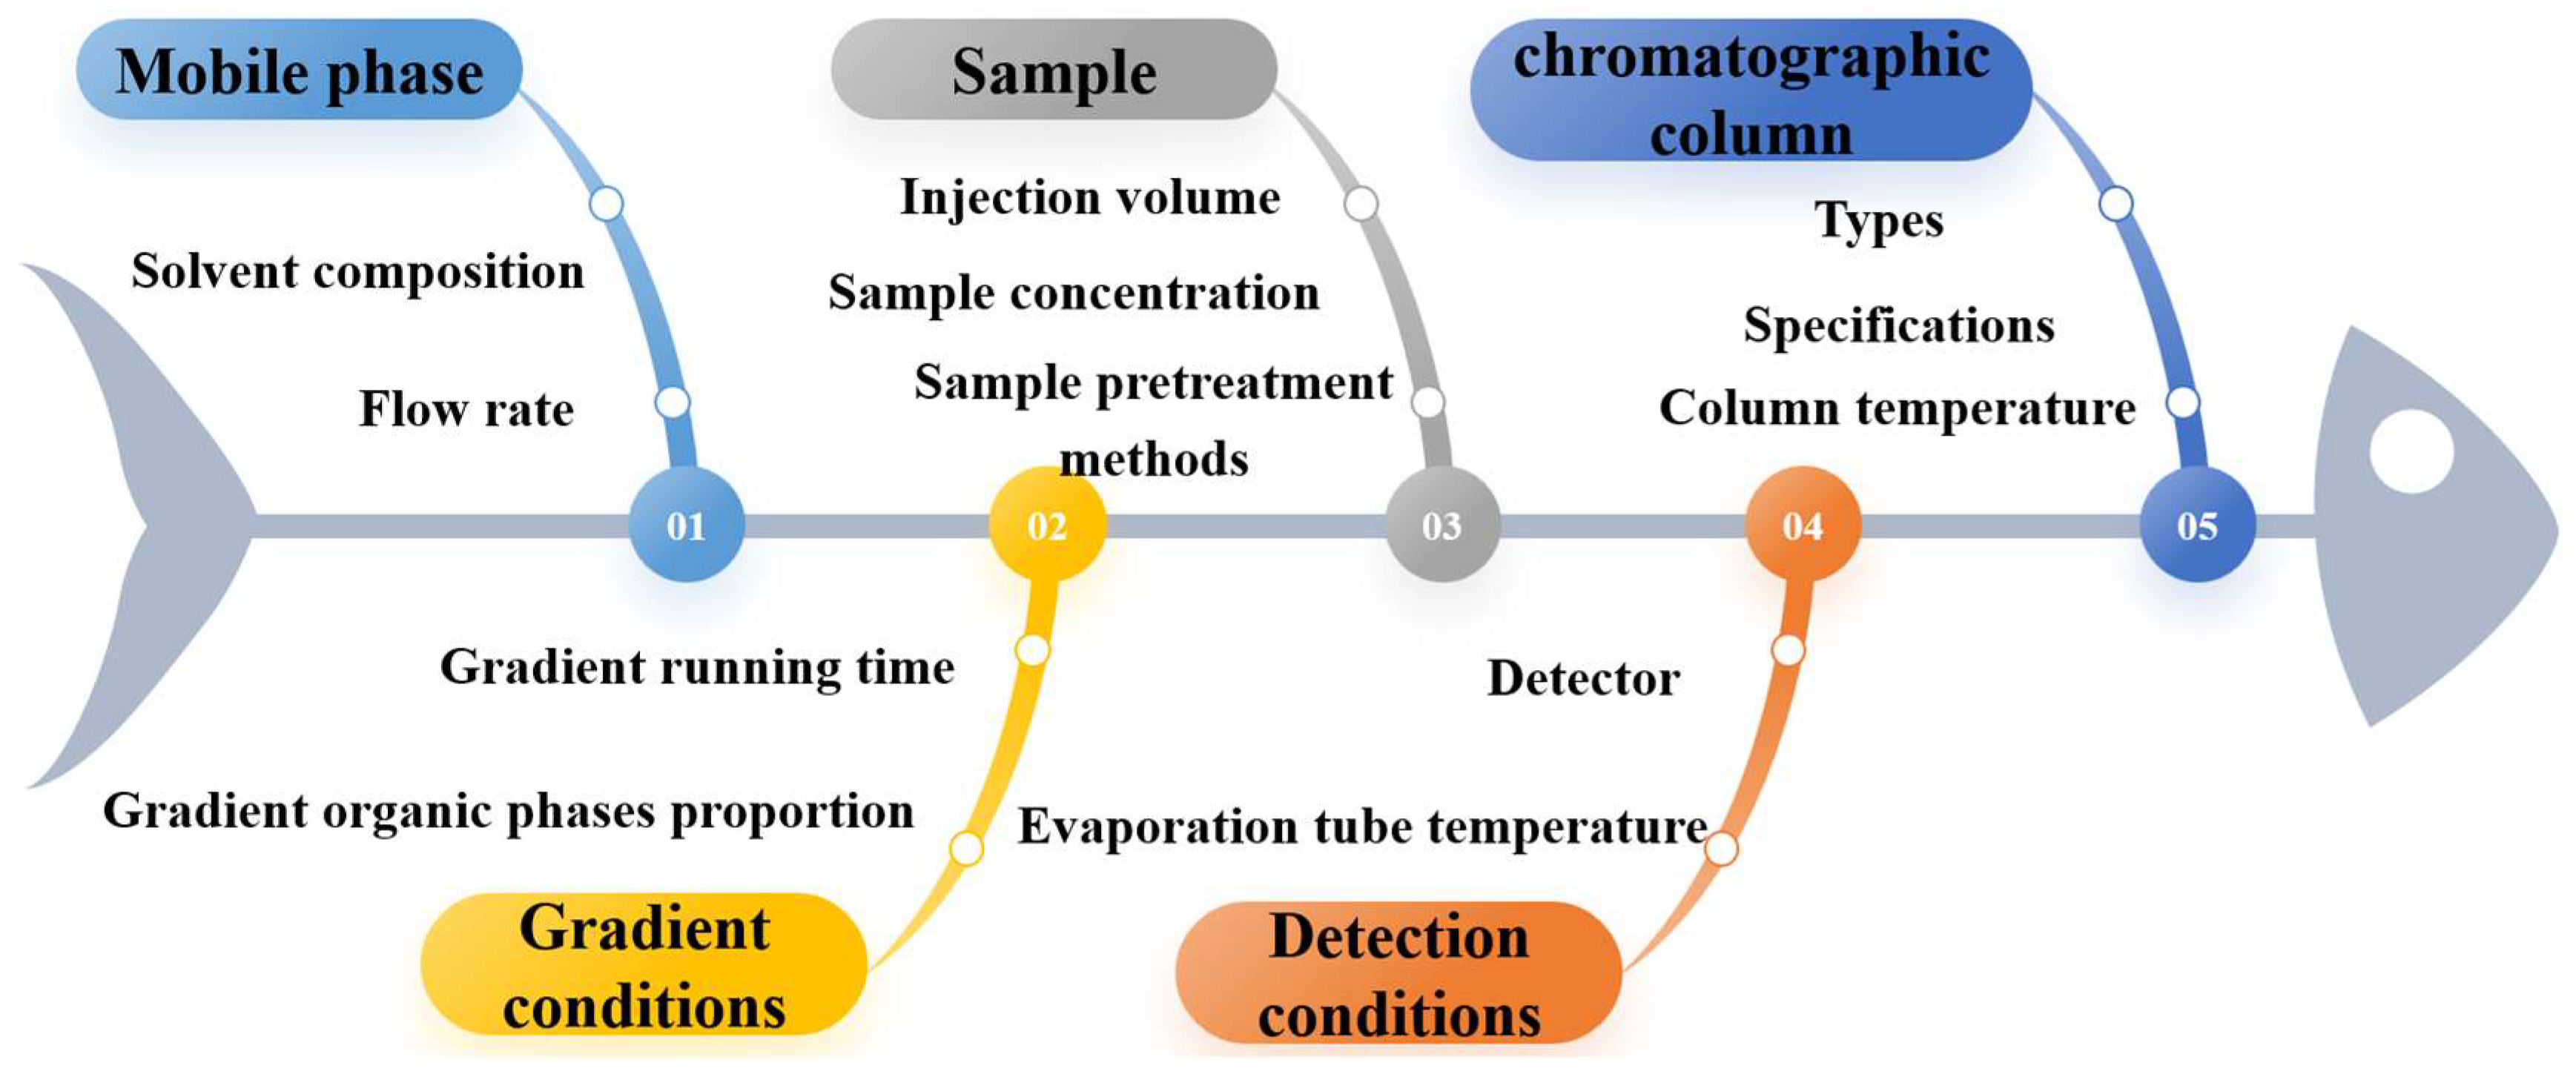
3.3. Preliminary Experiments and Identification of Analytical Method Parameters

This work was carried out using a Thermo Scientific HPLC system equipped with a CAD due to the weak ultraviolet absorption of fatty acids above 220 nm. In this study, the analytical target profile (ATP) was defined as achieving the separation of peaks with larger areas as much as possible while minimizing the analysis time. Critical method attributes were determined based on the results obtained from the preliminary experiments.
At this stage, a fishbone diagram was first employed to identify potential analytical method parameters from multiple perspectives, as illustrated in Figure 2. To optimize the chromatographic column efficiency, a comparative evaluation of multiple commercially available columns was conducted under identical operational parameters, with the column parameters detailed in the Supplementary Material. Some columns exhibited poor separation with severe peak overlap. Ultimately, the Proshell 120 EC C18 (4.6 × 100 mm, 2.7 μm) column was selected for the analysis of the samples. Regarding the selection of the mobile phase, since the analytes are free fatty acids, the use of pure water as the mobile phase was observed to result in severe peak tailing. Therefore, the addition of an acid to adjust the pH of the mobile phase was deemed necessary. In this experiment, a mobile phase consisting of 0.1% formic acid in acetonitrile and 0.1% formic acid in water was chosen for gradient elution. Additionally, the resolution of the chromatographic peaks was significantly influenced by the column temperature and flow rate. Thus, they were identified as critical method parameters influencing the separation efficiency in the system.
The separation degree of adjacent peaks was characterized using the retention time difference and the tailing factor [33]. Peaks 1 and 6 were observed to be adjacent to impurity peaks. And, under certain conditions, they might not be separable, resulting in a resolution of 0. Since Peaks 1 and 6 occasionally exhibited tailing, the tailing factor was introduced as a critical method attribute for these peaks. The retention time of Peak 7 was used as an evaluation indicator for the overall runtime of the chromatographic analysis.
Regarding the critical method attributes, a total of seven critical method attributes were determined. Specifically, Y1 represents △T1 (tpeak2-tpeak1, min), which is the retention time difference between Peak 2 and Peak 1. Y2 is △T2 (tpeak3-tpeak2, min), denoting the retention time difference between Peak 3 and Peak 2. Y3 is △T3 (tpeak5-tpeak4, min), signifying the retention time difference between Peak 5 and Peak 4. Y4 is △T4 (tpeak6-tpeak5, min), representing the retention time difference between Peak 6 and Peak 5. Y5 is Tpeak_7, which is the retention time of Peak 7. Y6 is the asymmetry factor of Peak 1, and Y7 is the tailing factor of Peak 6. As for the critical method parameters, five factors were identified, including column temperature (X1, °C), flow rate (X2, mL/min), isocratic time (X3, min), gradient end organic phase ratio (X4, %), and gradient time (X5, min). The levels of each factor are shown in Table 1.

3.4. Experimental Design

The potential critical method parameters and factor levels, identified from preliminary experiments, are detailed in Table 1. To explore the effects of these parameters on the critical method attributes, a definitive screening design (DSD) was employed. In five-factor, three-level definitive screening design (DSD), 12 experiments must be performed, along with three replicates of the center point experiments being conducted, as outlined in Table S1 (see Supplementary Materials). The factors investigated included column temperature (X1, °C), flow rate (X2, mL/min), isocratic time (X3, min), gradient end organic phase ratio (X4, %), and gradient time (X5, min). For each experimental run, the gradient elution conditions were specified as follows: 0 to X3 min at 75% B, and X3 to X5 min transitioning from 75% B to X4% B. A post-run analysis of the chromatogram was included to assess the retention time differences between Peak 2 and Peak 1 (△T1), Peak 3 and Peak 2(△T2), Peak 5 and Peak 4 (△T3), and Peak 6 and Peak 5 (△T4). Additionally, the retention time of Peak 7 (Tpeak7) and the tailing factor of Peaks 1 (Y6) and 6 (Y7) were evaluated.

3.5. Method Validation

Method validation was carried out to determine the fingerprinting of lanolin primarily alongside the evaluation of injection precision, repeatability, and sample stability [3]. The specific experimental procedures are described in the Supplementary Materials. An evaluation of the linearity, precision, stability, repeatability, and accuracy of the analytes in the content determination was included in the methodological validation.

3.6. Data Processing and Analysis

A quantitative model between the evaluation indicators and method parameters was established using Equation (1). Design Expert 12.0.0 was utilized to simplify the model through stepwise regression, reducing the model by the backward elimination method with a significance level of α = 0.1.
Y = a 0 + i = 1 5 a i X i + i = 1 5 a i i X i 2 + i = 1 4 j = i + 1 5 a i j X i X j
In the equation, a 0 is the constant; a i , a i i and a i j are the regression coefficients for the primary, quadratic, and interaction terms, respectively; X i and X j refer to the respective parameters; and Y represents the evaluation indicators.

3.7. High-Resolution Mass Spectrometry Analysis

Notably, the chromatographic parameters used for the mass spectrometric analysis were identical to those detailed in Section 3.1.
The mass spectrometry conditions were as follows. Positive and negative ion scanning modes were utilized. The scanning range was set from m/z 50 to 1000. Nebulizer gas 1 was set at 55 psi, nebulizer gas 2 was set at 55 psi, and curtain gas was set at 35 psi. The ion source temperature was 600 °C for positive ions and 550 °C for negative ions. The ion source voltage was −4500 V for negative ions and 5500 V for positive ions. During the first level of scanning, the declustering potential was set at ±80 V and the focusing potential at ±10 V. For the second level of scanning, mass spectral data were collected using the TOF MS-TOF MSMS-IDA mode with a declustering potential of ±80 V, and the focusing potential is −50 to −20 V in negative ion mode and 20 to 50 V in positive ion mode. Prior to sample injection, a CDS pump was utilized to calibrate the mass axis to ensure the mass axis error was less than 2 ppm.

4. Results and Discussions

4.1. Data Analysis of DSD Experiments

Detailed experimental results are presented in Table S2. The data fitting and modeling processes were performed using the stepwise regression method described in Section 3.6, yielding the regression coefficients between the critical method parameters and critical method attributes, along with the corresponding ANOVA results, shown in Table S3. The R2 values for the seven models were 0.9705, 0.9567, 0.9786, 0.9658, 0.9270, 0.9795, and 0.9822, respectively, indicating a good fit of all the models. All models exhibited low p-values (<0.0001), indicating that the models are statistically significant. The R2 values derived from the experimental data were greater than 0.9, demonstrating that the models can explain the majority of the variability in the data.
To visually represent the impact of the critical method parameters on the critical method attributes within the method, a two-dimensional contour plot was utilized to illustrate the relationship between the independent and dependent variables, as shown in Figure 3.

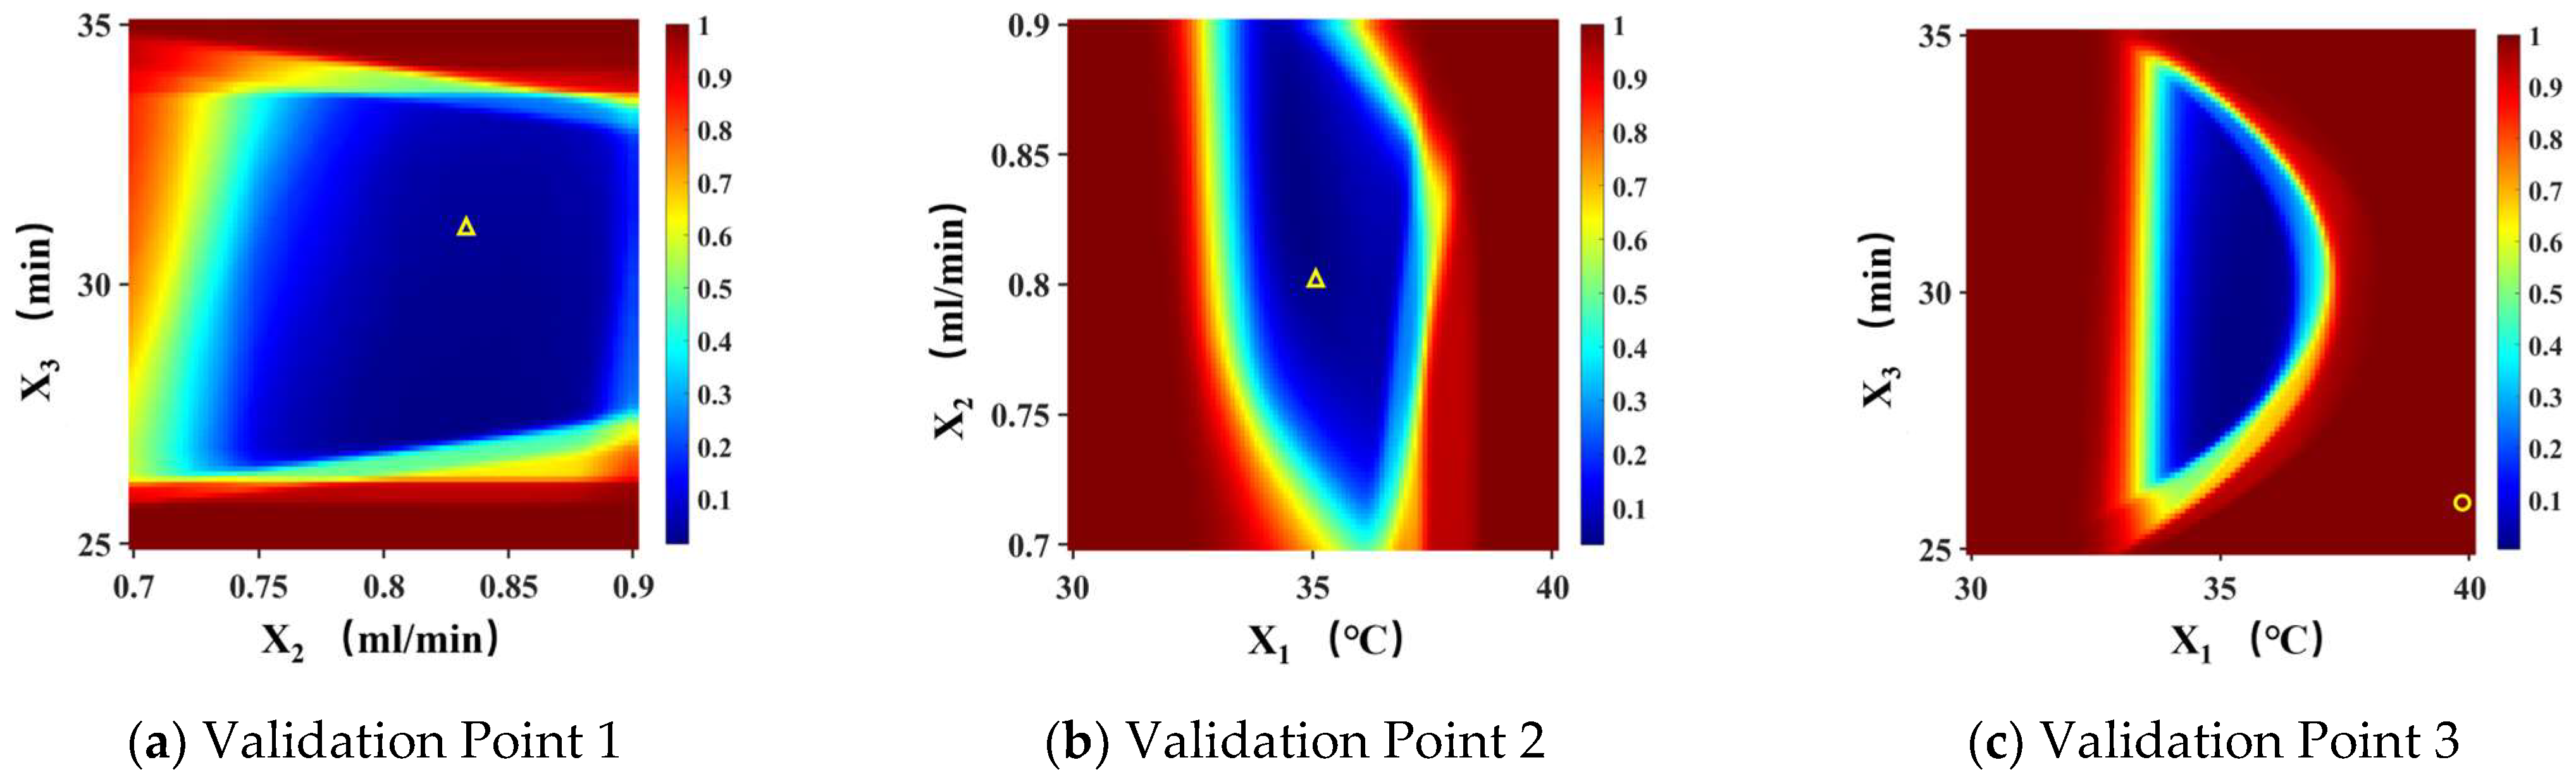
4.2. Establishment and Verification of the Design Space

The MODR was calculated using an exhaustive Monte Carlo method based on risk level [3,34]. Based on the chromatographic data, the minimum acceptable range for Y1 (retention time difference between Peak 2 and Peak 1) was set at 1.100 min, at 1.200 min for Y2 (retention time difference between Peak 3 and Peak 2), at 2.500 min for Y3 (retention time difference between Peak 5 and Peak 4), and at 2.500 min for Y4 (retention time difference between Peak 6 and Peak 5). The maximum acceptable range for Y5 (retention time of Peak 7) was set at 60.000 min. Additionally, the minimum acceptable range for Y6 (asymmetry factor of Peak 1) and Y7 (asymmetry factor of Peak 6) was set at 0.9, with a maximum acceptable range of 1.1. These criteria were established as the optimization targets for this study. The response indicator constraints and the requirements for the probability of meeting the standards are shown in Table 2.
The Monte Carlo random simulation was performed 2000 times, and the risk was quantified as the probability of the non-conformance of the constraints in Table 2. The threshold of the acceptable risk for MODR was set at 0.1. If the risk of a calculated parameter combination was less than 10%, this parameter combination was considered to be within the MODR. All calculations were conducted using MATLAB software (The MathWorks, Inc., Natick, MA, USA, R2020a 9.8 version). To intuitively display the calculated MODR, keeping the calculation step size and simulation times unchanged, two critical parameters were fixed at the middle level, while the other three independent variables were varied to generate the MODR plot. The MODR plot is shown in Figure 4.
Two parameter combinations were selected within the MODR for validation, and one parameter combination was chosen outside the MODR for validation. The experimental conditions and results are presented in Table 3. Running the parameter combinations within the MODR led to the results meeting the experimental requirements. However, when running the parameter combination outside the MODR, Y1 was observed to be less than 1.1 min, and Y7 exceeded 1.1, indicating that the optimization targets were not achieved. The validation results were consistent with the risk levels marked for the parameter combinations in Figure 5.

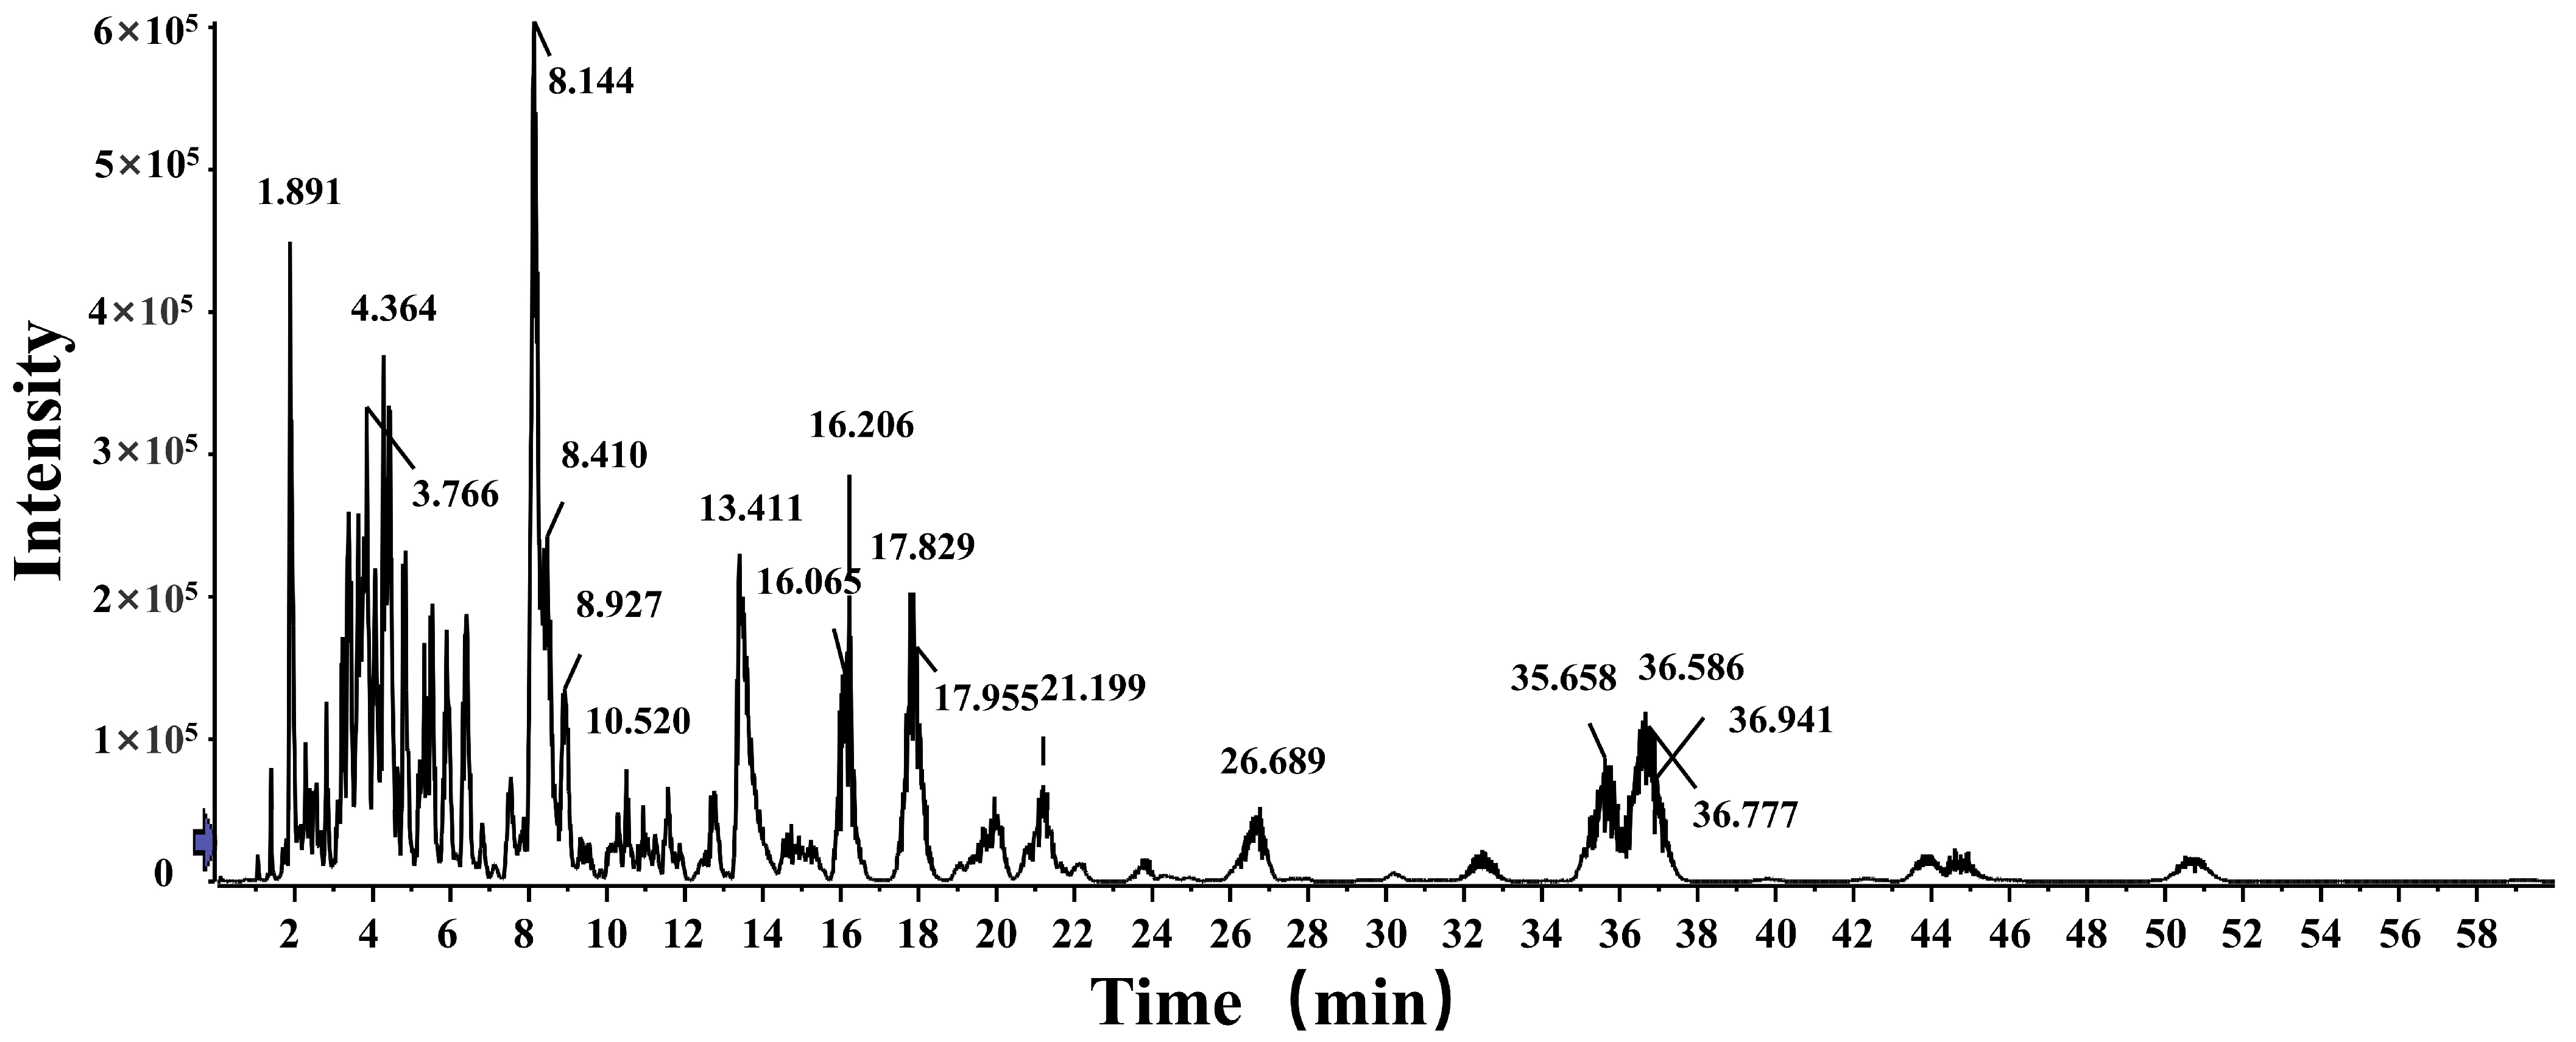
4.3. High-Resolution Mass Spectrometry Analysis

After the analytical method was established, the samples were analyzed using a liquid chromatography–high resolution mass spectrometry system (X500B, AB Sciex, Framingham, MA, USA). The acquired data were processed using PeakView (version 1.2). Based on the accurate relative molecular weights obtained from high-resolution mass spectrometry and the fragmentation information derived from secondary mass spectrometry, the chemical compositions of 10 chromatographic peaks were preliminarily inferred. The results are presented in Figure 6 and Table S4.

4.4. Fingerprinting Method Validation

The original data for the 15 batches of crude lanolin chromatograms were imported into the “Similarity Evaluation System for Chromatographic Fingerprint of Traditional Chinese Medicine (2012 Edition)”. The chromatogram for Sample S14 was selected as the reference spectrum. The median method was employed with a time window width of 0.1 min. Following multi-point correction and full-spectrum peak matching, the superimposed and reference spectra were established. The 15 batches of crude lanolin were analyzed, and seven common peaks were identified under these conditions. The results are presented in Figure 7. Since palmitic acid (Peak 2) exhibited a relatively large peak area and good separation from adjacent chromatographic peaks, it was designated as the reference peak. The average values and RSD values of the relative retention times of each chromatographic peak under the conditions of injection precision, repeatability, and sample stability experiments were calculated. The RSD values of the relative peak areas of each chromatographic peak were all less than 5%, and the RSD values of the relative retention times were all less than 1%, meeting the requirements of the fingerprint chromatogram. The experimental results are provided in the Supplementary Materials.

4.5. Method Validation of Content Determination

Palmitic acid (Peak 2), oleic acid (Peak 3), and stearic acid (Peak 6) were selected as the components for content determination.
Linearity investigation: A series of mixed reference standard solutions with different concentrations were prepared and analyzed by injecting 10 μL of each solution. The peak area of each component was plotted against its concentration to construct a standard curve, from which the linear regression equations and the analytical ranges were obtained. Since CAD is a mass-type detector, it exhibits a linear relationship within a certain range. However, due to the significant differences in sample concentrations, the overall relationship was found to be non-linear. A power function value (PFV) was employed to optimize the detection signal, mathematically compensating for the non-linear relationship between the concentration of the analyte and the CAD response signal [35]. Palmitic acid was analyzed using a PFV of 1.1, while oleic acid and stearic acid were analyzed using a PFV of 1.2. The results are presented in Tables S5 and S6.
The RSD values for the content of each chromatographic peak in the injection precision, repeatability, sample stability, and recovery experiments were calculated, and the results are presented in Table S7. In the injection precision experiment, the RSD values of the peak areas for all chromatographic peaks were found to be less than 2%, indicating a good injection precision. In the repeatability experiment, the RSD values of the peak areas for all chromatographic peaks were observed to be less than 2%, indicating good method repeatability. In the sample stability experiment, the RSD values of the peak areas for all chromatographic peaks were determined to be less than 3%, indicating good sample stability. The recovery rates for the three components were all found to be between 96% and 103%, with RSD values less than 2%, demonstrating that the method is accurate and reliable, and can be used for the content determination of oleic acid, palmitic acid, and stearic acid in various types of crude lanolin.

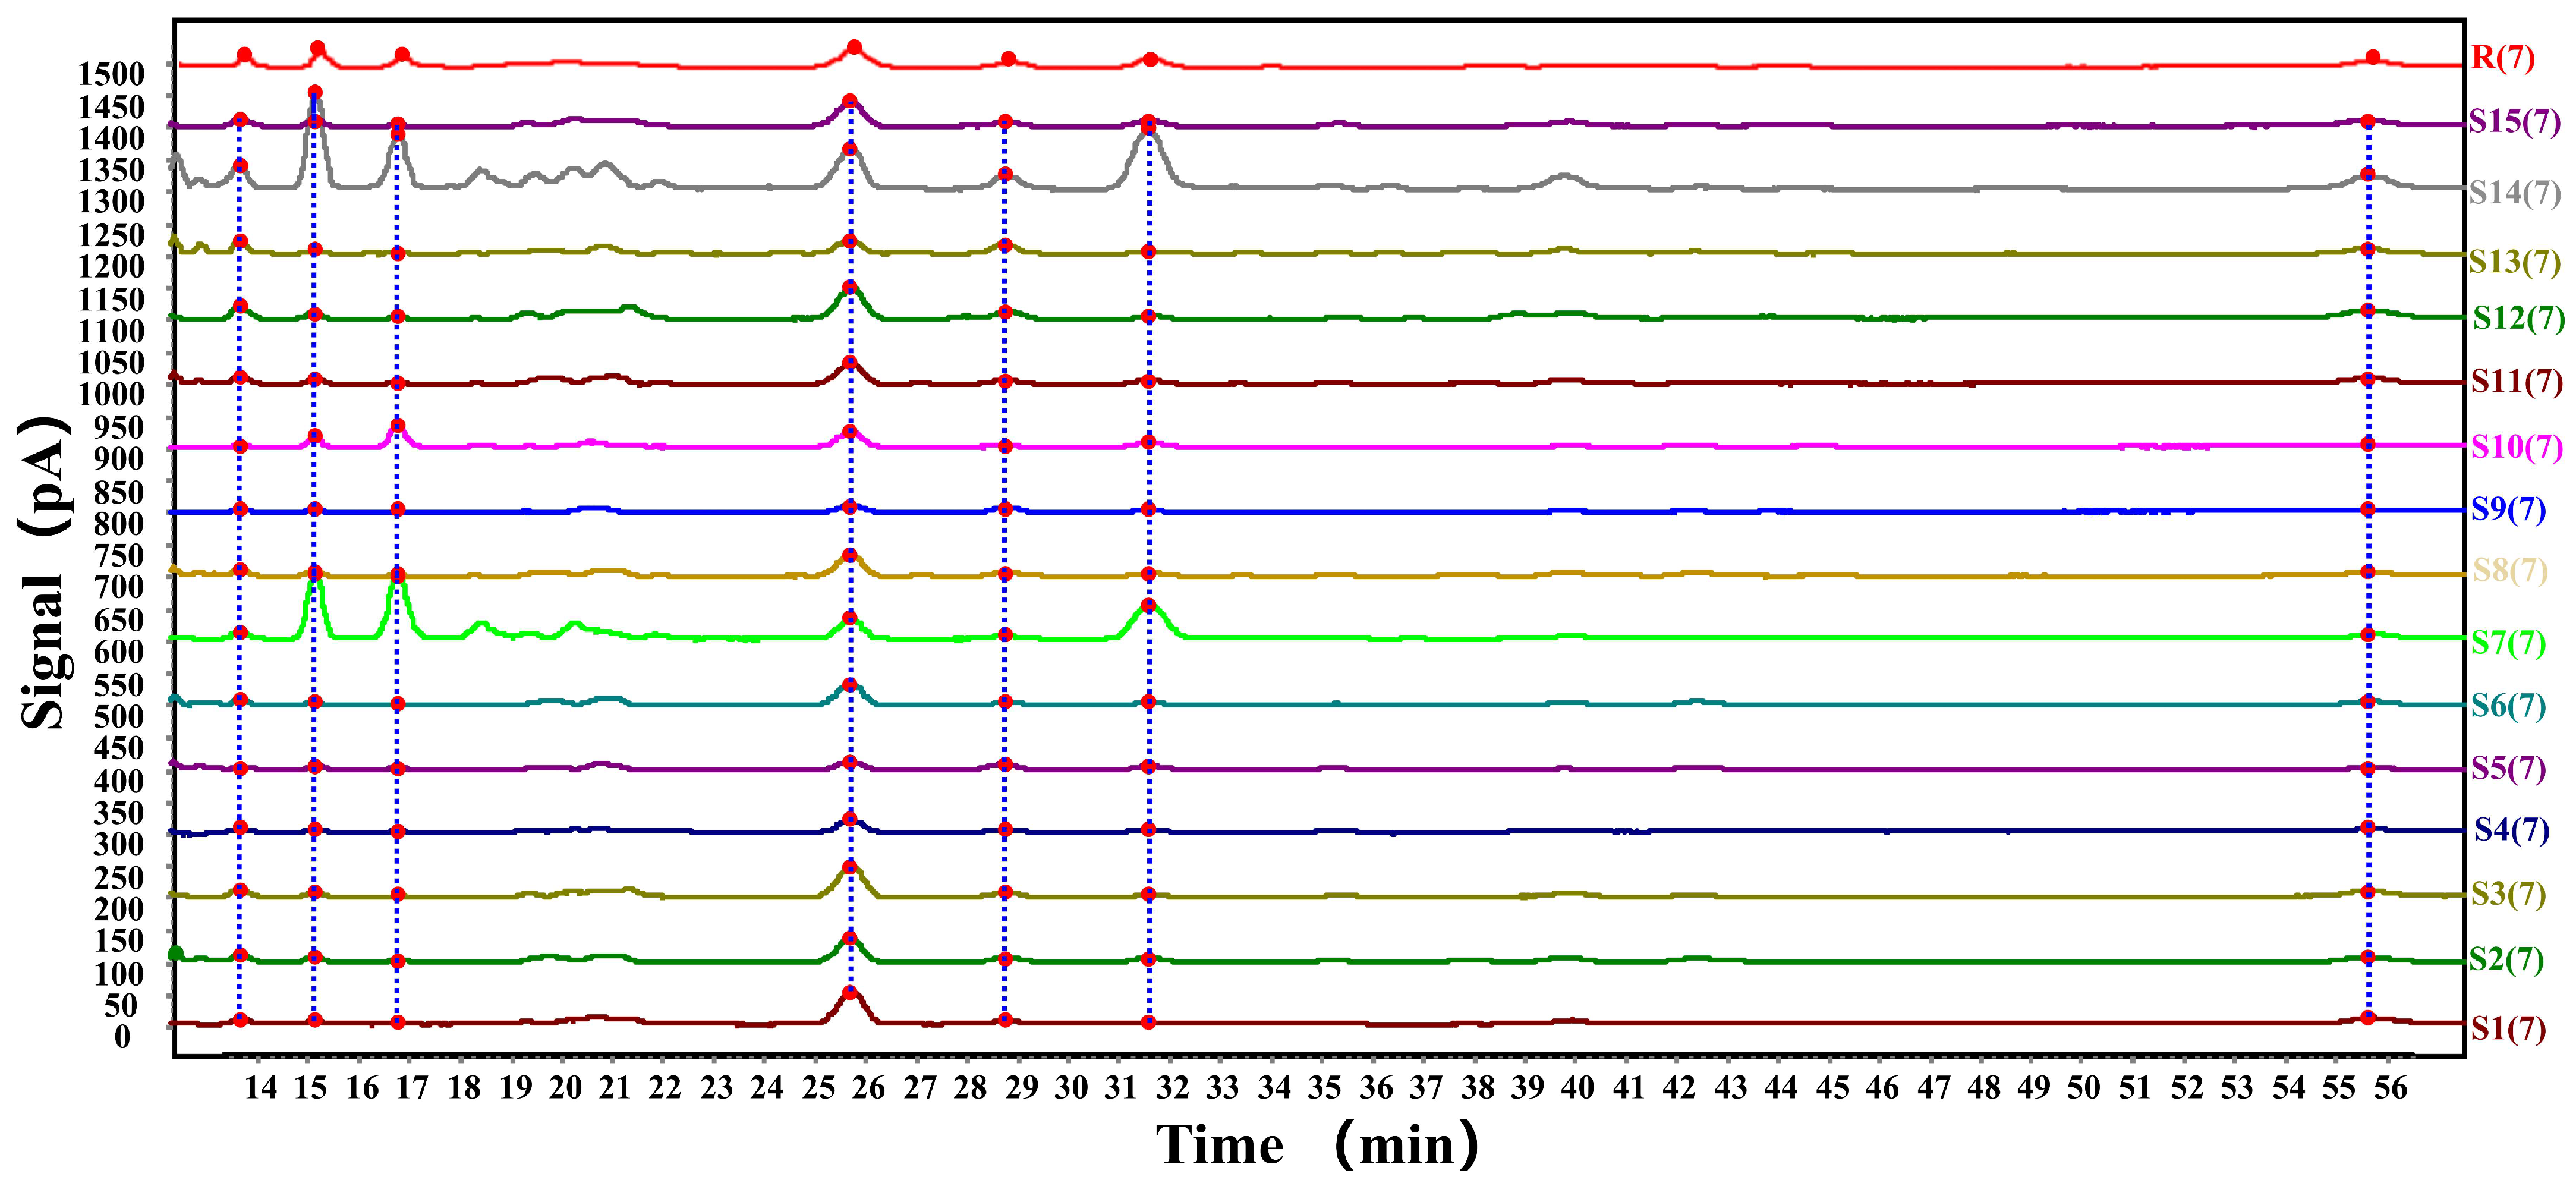
4.6. Fingerprint Analysis and Content Determination Results of Free Fatty Acids in Crude Lanolin

The original chromatographic fingerprint data of the 15 batches of test solutions were imported into the software for a similarity evaluation of the chromatographic fingerprints of traditional Chinese medicine. Each test solution was compared with the reference fingerprint, and the similarity results are shown in Table S8. Except for batch S7, similarity values greater than 0.85 were obtained for all other batches. The content determination results of the quantitative components in the 15 different batches of test solutions are presented in Table 4. A significant variation in the content of free fatty acids in crude lanolin was observed across different batches. The content of palmitic acid was found to range from 0.352 to 14.61 mg/g lanolin, oleic acid from 0.053 to 8.428 mg/g lanolin, and stearic acid from 0.195 to 9.189 mg/g lanolin. Notably higher contents of palmitic acid, oleic acid, and stearic acid were observed in batches S7 and S14.

5. Conclusions

In this study, a quantitative profiling method for detecting free fatty acids in crude lanolin, grounded in the Analytical Quality by Design (AQbD) concept was established. Initially, a fishbone diagram was utilized to identify potential critical method parameters. Preliminary screening was conducted through single-factor experiments, followed by optimization using a definitive screening design. This approach allowed for the adjustment of parameters such as column temperature, flow rate, isocratic run time, gradient end organic phase ratio, and gradient time. The experimental results were utilized to establish quantitative models of the relationship between evaluation indicators and method parameters. These models were refined using stepwise regression, all yielding R2 values exceeding 0.9. The MODR was calculated and was successfully validated. From the MODR, an optimal parameter combination was selected for the analytical method. High-resolution mass spectrometry was then used to identify components. Palmitic acid, oleic acid, and stearic acid as the components for content determination. For the quantitative profiling, the HPLC analysis conditions were determined as follows. A Proshell 120 EC C18 column with dimensions of 100 mm × 4.6 mm (i.d.) and a particle size of 2.7 μm was employed. Mobile phase A was prepared as 0.1% formic acid in water, and mobile phase B was prepared as 0.1% formic acid in acetonitrile. Gradient elution was performed, using 75% of phase B from 0 to 30 min, and adjusting from 75% to 79% from 30 to 60 min. Post-injection, the column was equilibrated for 10 min with a mixture of 0.1% formic acid in water and 0.1% formic acid in acetonitrile at a volume ratio of 25:75. The flow rate was set at 0.80 mL/min, with both the column and evaporation tube temperatures maintained at 35 °C. An injection volume of 10 μL was used.
This analytical method was applied to determine the quantitative profiles of free fatty acids across different batches of crude lanolin, with validation achieved through methodological examination. The developed quantitative profiling analysis method for free fatty acids enhances the understanding of crude lanolin properties and advances the processing level of lanolin products.

Supplementary Materials

The following supporting information can be downloaded at: https://www.mdpi.com/article/10.3390/chemosensors13040126/s1, Table S1: Experimental design table; Table S2: Results of the experimental design; Table S3: Quadratic regression model and ANOVA results; Table S4: High-resolution mass spectrometry results of compounds in crude lanolin; Table S5: Equations and coefficients of determination for each component with different power functions; Table S6: Regression equation, determinant coefficient and linear analysis range of each component; Table S7: RSD values of test solution injection precision, method repeatability and sample stability; Table S8: Fingerprint similarity results; Table S9: Precision experiment results of relative retention time; Table S10: Precision experiment results of relative peak areas; Table S11: Repeatability experiment results of relative retention time; Table S12: Repeatability experiment results of relative peak areas; Table S13: Stability experiment results of relative retention time; Table S14: Stability experiment results of relative peak areas.

Author Contributions

Conceptualization, S.L. and X.G.; methodology, S.L.; software, S.L. and S.W.; validation, S.L.; formal analysis, S.L. and S.W.; investigation, S.L.; resources, H.Z. and X.G.; data curation, S.L. and S.W.; writing—original draft preparation, S.L. and S.W.; writing—review and editing, S.L., S.W., H.Z. and X.G.; visualization, S.L.; supervision, H.Z. and X.G.; project administration, X.G.; funding acquisition, X.G. All authors have read and agreed to the published version of the manuscript.

Funding

This research was funded by Ji’an 2024 Science and Technology Plan Baibo 100 Enterprises Special Project (2024H-100170), and Jinhua Science and Technology Plan Project (2023-4-188).

Institutional Review Board Statement

Not applicable.

Informed Consent Statement

Not applicable.

Data Availability Statement

The data that support the findings of this study are available from the corresponding author upon reasonable request.

Acknowledgments

The authors are grateful for the support of Ding Feng, Wang Qinglin, and Kaidierya Abudureheman.

Conflicts of Interest

Author Hao Zhang was employed by the company Nowi Biotechnology Co., Ltd.

References

  1. Basso, J.; Mendes, M.; Cova, T.F.; Sousa, J.J.; Pais, A.A.; Vitorino, C. Analytical Quality by Design (AQbD) as a multiaddressable platform for co-encapsulating drug assays. Anal. Methods 2018, 10, 5659–5671. [Google Scholar]
  2. Ding, F.; Liu, S.; Wu, G.; Qu, H.; Gong, P.; Xie, Y.; Zhou, P.; Gong, X. A novel process for developing a quantitative chromatographic fingerprint analysis method based on analytical quality by design: A case study of Xiaochaihu capsules. Microchem. J. 2023, 194, 109253. [Google Scholar]
  3. Tai, Y.; Ren, D.; Zhao, W.; Qu, H.; Xiong, H.; Gong, X. Analytical quality by design oriented development of the UPLC method for analysing multiple pharmaceutical process intermediates: A case study of Compound Danshen Dripping Pills. Microchem. J. 2023, 187, 108438. [Google Scholar]
  4. Zhang, S.; Wu, L.; Wang, X.; Gong, X.; Qu, H. Development of an HPLC-MS method for the determination of four terpene trilactones in Ginkgo biloba leaf extract via quality by design. Biomed. Chromatogr. BMC 2021, 35, e5170. [Google Scholar]
  5. Lan, J.; Wu, G.; Wu, L.; Qu, H.; Gong, P.; Xie, Y.; Zhou, P.; Gong, X. Development of a Quantitative Chromatographic Fingerprint Analysis Method for Sugar Components of Xiaochaihu Capsules Based on Quality by Design Concept. Separations 2023, 10, 13. [Google Scholar]
  6. Zhao, M.; Tai, Y.; Wu, G.; Ding, F.; Qu, H.; Gong, X. Integrated Application of Risk Management Techniques in Developing an Analysis Method for Traditional Chinese Medicine: A Case Study of a Percolation Solution for Xiaochaihu Capsules. Chemosensors 2024, 12, 161. [Google Scholar] [CrossRef]
  7. Tambare, R.S.; Shahi, S.R.; Gurumukhi, V.C.; Kakade, S.M.; Tapadiya, G.G. Quality by design (QbD) based development and validation of RP-HPLC method for buserelin acetate in polymeric nanoparticles: Release study. Heliyon 2024, 10, e39172. [Google Scholar] [PubMed]
  8. Mohyeldin, S.M.; Daabees, H.G.; Talaat, W.; Kamal, M.F. Efficient integration of analytical quality-by-design and tri-hued HPLC-DAD approach for synchronized assessment of gemigliptin and rosuvastatin in their fixed-dose pills: Application to stability study. Sustain. Chem. Pharm. 2024, 42, 101777. [Google Scholar]
  9. Babaker, M.A.; Algohary, A.M.; Ibrahim, A.M. Robust analytical method for the enantiomeric separation of lurasidone hydrochloride: Integrating analytical quality by design and green chemistry principles. Sustain. Chem. Pharm. 2024, 42, 101788. [Google Scholar]
  10. Basso, J.; Ramos, M.L.; Pais, A.; Vitorino, R.; Fortuna, A.; Vitorino, C. Expediting Disulfiram Assays through a Systematic Analytical Quality by Design Approach. Chemosensors 2021, 9, 172. [Google Scholar] [CrossRef]
  11. Nompari, L.; Orlandini, S.; Pasquini, B.; Fontana, L.; Rovini, M.; Masi, F.; Gotti, R.; Furlanetto, S. Optimization of hydrolysis conditions of amino acid analysis for UHPLC-UV antigens content determination: Bexsero vaccine a case study. J. Pharm. Biomed. 2024, 241, 115997. [Google Scholar]
  12. Kochling, J.; Wu, W.; Hua, Y.; Guan, Q.; Castaneda-Merced, J. A platform analytical quality by design (AQbD) approach for multiple UHPLC-UV and UHPLC–MS methods development for protein analysis. J. Pharm. Biomed. Anal. 2016, 125, 130–139. [Google Scholar] [PubMed]
  13. Simeoni, P.; Deissler, M.; Bienert, R.; Gritsch, M.; Nerkamp, J.; Kirsch, S.; Roesli, C.; Pohl, T.; Anderka, O.; Gellermann, G. Using enhanced development tools offered by analytical Quality by Design to support switching of a quality control method. Biotechnol. Bioeng. 2023, 120, 3299–3310. [Google Scholar]
  14. Parr, M.K.; Schmidt, A.H. Life cycle management of analytical methods. J. Pharm. Biomed. Anal. 2018, 147, 506–517. [Google Scholar]
  15. International Conference on Harmonization (ICH). Continuous Manufacturing of Drug Substances and Drug Products Q13. Available online: https://www.cde.org.cn/ichWeb/guideIch/toGuideIch/1/0 (accessed on 23 March 2025).
  16. International Conference on Harmonization (ICH). Analytical Procedure Development Q14. Available online: https://www.cde.org.cn/ichWeb/guideIch/toGuideIch/1/0 (accessed on 23 March 2025).
  17. International Conference on Harmonization (ICH). Quality Risk Management Q9. Available online: https://www.cde.org.cn/ichWeb/guideIch/toGuideIch/1/0 (accessed on 23 March 2025).
  18. Hassan, M.H.; Abou-Elkhair, R.A.; Hassan, A.E.; Mousa, H.S. Analytical quality by design-compliant development of quantitative 1H- and 19F-nuclear magnetic resonance methods for the analytical evaluation of the anti-cancer drug, sorafenib. Microchem. J. 2024, 208, 112544. [Google Scholar]
  19. Xuan, D.T.; Nguyen, H.M.T.; Hoang, V.D. Recent applications of analytical quality-by-design methodology for chromatographic analysis: A review. Chemom. Intell. Lab. Syst. 2024, 254, 105243. [Google Scholar]
  20. Rüttler, F.; Hammerschick, T.; Schlag, S.; Vetter, W. Isolation of lanosterol and dihydrolanosterol from the unsaponifiable matter of lanolin by urea complexation and countercurrent chromatography in heart-cut recycling mode. J. Chromatogr. B 2022, 1210, 123470. [Google Scholar]
  21. Moldovan, Z.; Jover, E.; Bayona, J.M. Gas chromatographic and mass spectrometric methods for the characterisation of long-chain fatty acids: Application to wool wax extracts. Anal. Chim. Acta 2002, 465, 359–378. [Google Scholar]
  22. Wang, B.; Chen, J.; Yv, Y.; Hu, Z.; Bi, Y. Physicochemical indexes and main components of lanolin. J. China Oils Fats 2022, 47, 22–27. [Google Scholar]
  23. Wu, J. Study on the refining method of lanolin. Chem. Manag. 2018, 9, 64–65. [Google Scholar]
  24. Danielle, D.; McCabe, M.; Bourdillon, K. The impact of refinement on the sensory properties of lanolin. J. Sens. Stud. 2023, 38, e12822. [Google Scholar] [CrossRef]
  25. Kunyk, O.; Leal Filho, W.; Pasichnyi, V. Study of the equivalence of substituting lanolin with a plant-based alternative in cosmetic products. Sustain. Chem. Pharm. 2024, 39, 101555. [Google Scholar] [CrossRef]
  26. Bourdillon, K.; McCausland, T.; McCabe, M. Multi-residue analysis of certain lanolin nipple care products for trace contaminants. BMC Chem. 2023, 17, 8. [Google Scholar] [CrossRef] [PubMed]
  27. Infante, V.H.P.; Lohan, S.B.; Schanzer, S.; Campos, P.M.B.G.M.; Lademann, J.; Meinke, M.C. Eco-friendly sunscreen formulation based on starches and PEG-75 lanolin increases the antioxidant capacity and the light scattering activity in the visible light. J. Photochem. Photobiol. B 2021, 222, 112264. [Google Scholar] [CrossRef]
  28. National Pharmacopoeia Commission. Pharmacopoeia of the People’s Republic of China; China Medical Science Press: Beijing, China, 2020. [Google Scholar]
  29. Cuadros-Rodríguez, L.; Ruiz-Samblás, C.; Valverde-Som, L.; Pérez-Castaño, E.; González-Casado, A. Chromatographic fingerprinting: An innovative approach for food ‘identitation’ and food authentication—A tutorial. Anal. Chim. Acta 2016, 909, 9–23. [Google Scholar] [CrossRef]
  30. Wolfender, J.L.; Marti, G.; Thomas, A.; Bertrand, S. Current approaches and challenges for the metabolite profiling of complex natural extracts. J. Chromatogr. A 2015, 1382, 136–164. [Google Scholar]
  31. Liang, Y.-Z.; Xie, P.; Chan, K. Quality control of herbal medicines. J. Chromatogr. B 2004, 812, 53–70. [Google Scholar]
  32. Shao, J.Y.; Guo, J.L.; Guo, S.X.; Shu, Z.H.; Qu, H.B.; Gong, X.C. Quantitative chromatographic fingerprint analysis of Sanye Tangzhiqing Decoction based on quality by design concept. China J. Chin. Mater. Med. 2019, 44, 4844–4851. [Google Scholar]
  33. Chen, Z.; Li, Q.; Sun, J.; Cao, F.; Li, C. A New Calculation Method for Peak Width and Resolution of Trailing Peaks in Chromatograms and Its Application. Chin. J. Pharm. 2023, 54, 1374–1381. [Google Scholar]
  34. Gong, X.; Li, Y.; Chen, H.; Qu, H. Design space development for the extraction process of Danhong injection using a Monte Carlo simulation method. PLoS ONE 2015, 10, e0128236. [Google Scholar]
  35. Shalliker, R.; Stevenson, P.; Shock, D.; Mnatsakanyan, M.; Dasgupta, P.; Guiochon, G. Application of power functions to chromatographic data for the enhancement of signal to noise ratios and separation resolution. J. Chromatogr. A 2010, 1217, 5693–5699. [Google Scholar] [PubMed]
Figure 1. HPLC diagram of the mixed standards and sample.
Chemosensors 13 00126 g001aChemosensors 13 00126 g001b
Figure 2. Fishbone diagram of potential critical method parameters.
Chemosensors 13 00126 g002
Figure 3. Response surface plot of critical method parameters and critical method attributes. Here, (a,b) show the influence of critical method parameters on Y1, (c) depicts the influence of critical method parameters on Y2, (d,e) represent the influence of critical method parameters on Y3, (f,g) illustrate the influence of critical method parameters on Y4, (h) shows the influence of critical method parameters on Y6, and (i,j) demonstrate the influence of critical method parameters on Y7.
Chemosensors 13 00126 g003aChemosensors 13 00126 g003b
Figure 4. Risk-based MODR plot obtained from the calculations.
Chemosensors 13 00126 g004
Figure 5. Location of validation points. The specific locations of the validation points are represented by symbols △ and ○; the color bars represent the risk probability.
Chemosensors 13 00126 g005
Figure 6. High-resolution mass spectrometry-based peak ion chromatogram in negative ion mode.
Chemosensors 13 00126 g006
Figure 7. Fingerprint of free fatty acids in different batches of crude lanolin.
Chemosensors 13 00126 g007
Table 1. Factors and their levels.
Factor NameSymbolUnitLevel
LowMiddleHigh
Column TemperatureX1°C303540
Flow RateX2mL/min0.70.80.9
Isocratic TimeX3min253035
Gradient End Organic Phase RatioX4%788082
Gradient TimeX5min303540
Table 2. Response indicator constraints.
Evaluation IndicatorsLow LimitHigh Limit
Y1: Retention time difference between Peak 2 and Peak 1 (min)1.100
Y2: Retention time difference between Peak 3 and Peak 2 (min)1.200
Y3: Retention time difference between Peak 5 and Peak 4 (min)2.500
Y4: Retention time difference between Peak 6 and Peak 5 (min)2.500
Y5: Retention time of Peak 7 (min)60.000
Y6: Tailing factor of Peak 10.91.1
Y7: Tailing factor of Peak 60.91.1
Table 3. Experimental conditions and results for validation points.
Validation PointsWithin the MODROutside the MODR
123
Experimental ConditionsX1 (°C)353540
X2 (mL/min)0.850.80.85
X3 (min)323026
X4 (%)798179
X5 (min)303030
Experimental ResultsY11.341.451.068
Y21.3551.4751.252
Y32.782.9822.276
Y42.5282.7962.065
Y551.96553.00544.978
Y611.040.9
Y71.070.981.25
Table 4. Content determination results of quantitative components in 15 batches of test solutions.
Batches NumberPalmitic Acid (mg/g Lanolin)Oleic Acid (mg/g Lanolin)Stearic Acid (mg/g Lanolin)
S10.584 0.171 0.261
S20.563 0.151 0.301
S30.608 0.123 0.246
S40.571 0.071 0.260
S50.352 0.135 0.324
S60.378 0.059 0.227
S711.46 12.64 5.997
S80.390 0.053 0.195
S90.653 0.223 0.349
S101.563 3.296 0.750
S110.540 0.077 0.263
S120.814 0.257 0.257
S130.558 0.075 0.440
S1414.61 8.428 9.189
S150.661 0.099 0.492
Disclaimer/Publisher’s Note: The statements, opinions and data contained in all publications are solely those of the individual author(s) and contributor(s) and not of MDPI and/or the editor(s). MDPI and/or the editor(s) disclaim responsibility for any injury to people or property resulting from any ideas, methods, instructions or products referred to in the content.

