Article

Hydrothermally Synthesized TiO2 Nanostructures for Electrochemical Detection of H2O2 in Barley (Hordeum vulgare) Under Salt Stress and Remediation with Fe3O4 Nanoparticles

1
G. Liberts’ Innovative Microscopy Centre, Department of Technology, Institute of Life Sciences and Technology, Daugavpils University, 1a Parades Str., LV-5401 Daugavpils, Latvia
2
Laboratory of Genomic and Biotechnology, Department of Technology, Institute of Life Sciences and Technology, Daugavpils University, 1a Parades Str., LV-5401 Daugavpils, Latvia
*
Author to whom correspondence should be addressed.
Chemosensors 2025, 13(7), 256; https://doi.org/10.3390/chemosensors13070256
Submission received: 23 May 2025 / Revised: 13 June 2025 / Accepted: 12 July 2025 / Published: 14 July 2025
(This article belongs to the Special Issue Electrochemical Sensors and Biosensors for Environmental Detection)

Abstract

This study presents the development of a TiO2 nanowire-based electrochemical sensor for the selective and sensitive detection of hydrogen peroxide (H2O2) under neutral pH conditions, with a particular focus on its application in analyzing plant stress. The sensor exhibited a linear detection range of 0–0.5 mM, a sensitivity of 0.0393 mA · mM−1, and a detection limit of 2.8 μM in phosphate-buffered saline solution (PBS, pH 7.4). This work’s main novelty lies in the systematic investigation of the relationship between TiO2 nanostructure morphology, which is controlled by hydrothermal synthesis parameters, and the resulting sensor performance. Interference studies confirmed excellent selectivity in the presence of common electroactive species found in plant samples, such as NaCl, KNO3, glucose, citric acid, and ascorbic acid. Real sample analysis using barley plant extracts grown under salt stress and treated with Fe3O4 nanoparticles confirmed the sensor’s applicability in complex biological matrices, enabling accurate quantification of endogenously produced H2O2. Endogenous H2O2 concentrations were found to range from near-zero levels in control and Fe3O4-only treated plants, to elevated levels of up to 0.36 mM in salt-stressed samples. These levels decreased to 0.25 and 0.15 mM upon Fe3O4 nanoparticle treatment, indicating a dose-dependent mitigation of stress. This finding was supported by genome template stability (GTS) analysis, which revealed improved DNA integrity in Fe3O4-treated plants. This study takes an integrated approach, combining the development of a nanostructured sensor with physiological and molecular stress assessment. The urgent need for tools to detect stress at an early stage and manage oxidative stress in sustainable agriculture underscores its relevance.

1. Introduction

Reactive oxygen species (ROS), including H2O2, are pivotal markers of oxidative stress in biological systems [1,2,3]. ROS are generated as byproducts of cellular metabolism, primarily through mitochondrial respiration and enzymatic activities, and play dual roles in cells as both signaling molecules and mediators of damage [4]. Under physiological conditions, ROS levels are tightly regulated by antioxidant defenses, such as superoxide dismutase and catalase, to maintain redox homeostasis [5]. However, under stress conditions, such as exposure to toxins, UV radiation, or inflammatory stimuli, ROS production can exceed the capacity of antioxidant systems, leading to oxidative stress [6,7]. Among ROS, H2O2 is particularly significant, as it is relatively stable and can diffuse across membranes. Elevated levels of H2O2 can result in the oxidation of proteins, lipids, and nucleic acids, contributing to cellular dysfunction and pathology [8,9,10,11].
Salt stress is a significant abiotic factor that can induce genotoxic effects in plants [12,13,14,15]. High salinity disrupts ionic and osmotic balance within cells, leading to enhanced production of ROS [16,17,18]. These reactive molecules can damage cellular macromolecules, including DNA, by causing single- and double-strand breaks, base modifications, and cross-linking. Additionally, salt stress can impair DNA repair mechanisms by altering the expression or activity of repair-associated enzymes, further exacerbating genomic instability. Chromosomal aberrations, micronuclei formation, and mutations are commonly observed under salt stress, which can interfere with cell division and overall plant growth. The genotoxic effects of salt stress are highly dependent on plant species, genotype, and the duration and severity of the stress [19,20,21].
Plants reduce oxidative stress through a complex network of enzymatic and non-enzymatic antioxidant mechanisms that neutralize ROS and maintain cellular redox homeostasis [5,19]. Enzymatic antioxidants such as superoxide dismutase (SOD), catalase (CAT), and various peroxidases play a crucial role in detoxifying ROS by converting superoxide radicals into hydrogen peroxide and subsequently breaking it down into water and oxygen [22,23,24,25]. Non-enzymatic antioxidants, including ascorbic acid, glutathione, carotenoids, and flavonoids, further complement these defenses by directly scavenging ROS and protecting cellular components like lipids, proteins, and DNA from oxidative damage [26,27]. Additionally, plants employ stress-responsive signaling pathways [28,29,30,31], such as those mediated by phytohormones (e.g., salicylic acid and jasmonic acid), to regulate antioxidant gene expression and enhance adaptive responses under stress conditions.
Nanoparticles, including Fe3O4, reduce oxidative stress in plants by modulating redox homeostasis, enhancing antioxidant activity, and directly scavenging ROS [32,33,34]. Fe3O4 nanoparticles exhibit intrinsic catalytic properties that mimic natural antioxidant enzymes, such as peroxidase and catalase, allowing them to neutralize ROS through electron transfer reactions through a process called Fenton-like reaction [35,36,37], where Fe2+ and Fe3+ in the nanoparticles facilitate the conversion of hydrogen peroxide into less harmful molecules, such as water and oxygen. These nanoparticles can also influence the plant’s biochemical pathways by upregulating the activity of endogenous antioxidant enzymes, thereby amplifying the plant’s natural defense system. Moreover, Fe3O4 nanoparticles contribute to reducing oxidative stress by improving the bioavailability of iron, a critical micronutrient involved in the synthesis and functioning of antioxidant proteins. Additionally, they modulate signaling pathways, including those mediated by reactive nitrogen species (RNS) and secondary messengers like hydrogen peroxide, which help in activating stress-responsive genes [38,39,40].
Various methods are used to detect H2O2 in biological and environmental systems [41], including spectrophotometry [42], fluorescence [43], chemiluminescence [44], and electrochemical [45,46] techniques. Among these, electrochemical methods are considered superior due to their high sensitivity, rapid response, cost-effectiveness, and capability for real-time detection. Electrochemical sensors typically use electrodes such as platinum [47], gold [48], glassy carbon [49], and carbon-based materials [50], which provide efficient electron transfer for H2O2 oxidation or reduction. The integration of nanostructured materials such as metal nanoparticles [48,51], carbon nanotubes [52], graphene [53], and metal-organic frameworks [54] significantly enhances sensing performance by increasing the electrode surface area, improving electrical conductivity, and providing catalytic activity. These nanostructures facilitate faster electron transfer and lower the overpotential required for H2O2 detection, thereby improving sensitivity and selectivity. Furthermore, nanostructured electrodes [55] enable the development of miniaturized, portable sensors for on-site and point-of-care applications, making electrochemical methods highly advantageous for diverse fields, including agriculture [56], healthcare [57], and environmental monitoring [58,59]. The sensing performance of H2O2 detection is often enhanced at high pH due to the increased availability of hydroxide ions (OH), which facilitate the electrochemical oxidation of H2O2 on the electrode surface [60,61,62]. In alkaline conditions, the reaction kinetics are faster, and the overpotential required for H2O2 detection is typically reduced, leading to improved sensitivity and lower detection limits. However, in practical applications, many biological and environmental systems operate at neutral pH, where the concentration of OH is significantly lower, resulting in slower electron transfer kinetics and diminished sensor performance. Consequently, the development of sensors that exhibit high sensitivity and selectivity at neutral pH is critically important for real-world applications, such as monitoring oxidative stress in biological samples or assessing environmental pollutants. Such sensors require advanced electrode materials, such as nanostructures with high catalytic activity and optimized surface properties, to overcome the challenges associated with neutral pH conditions and maintain effective H2O2 detection in these complex environments.
TiO2 nanostructures are highly suitable for neutral pH electrochemical sensors due to their distinctive and advantageous physicochemical properties, including excellent biocompatibility, chemical stability, and high catalytic activity [63,64,65]. In neutral pH environments, where electron transfer kinetics are generally slower compared to acidic or alkaline conditions, TiO2 nanostructures serve as efficient platforms for enhancing charge transfer dynamics at the electrode–electrolyte interface.
The wide bandgap of TiO2, typically around 3.0–3.2 eV, depending on the crystalline phase, contributes to its low background current and excellent signal-to-noise ratio, which is essential for trace-level detection of target analytes. Furthermore, the high surface area of TiO2 nanostructures allows for increased adsorption of H2O2 molecules, leading to amplified current responses and improved detection limits. The versatility of TiO2 in forming a variety of nanostructured morphologies—such as nanoparticles [66], nanotubes [67,68,69,70], nanorods [71,72,73], nanowires, and hierarchical assemblies—enables fine-tuning of electrochemical properties. Each morphology offers specific advantages: for example, nanotubes provide direct electron pathways and high electrolyte accessibility, while nanorods and nanowires facilitate vectorial charge transport along their length, further enhancing electrocatalytic efficiency.
In addition to their structural and electronic benefits, TiO2 nanostructures can be readily synthesized through cost-effective and scalable methods, such as hydrothermal synthesis, sol–gel techniques, and anodization, allowing for precise control over crystallinity, aspect ratio, and surface functionalization. These fabrication advantages support the development of reproducible, stable, and high-performance electrochemical sensors. The synthesis of TiO2 nanostructures using only a Ti substrate and sodium hydroxide (NaOH) offers a straightforward and cost-effective approach, which is particularly advantageous for fabricating directly integrated nanostructures on conductive surfaces [74,75,76,77]. In this method, the Ti substrate acts as both the source of titanium ions and the base for nanostructure growth, while NaOH provides the alkaline environment necessary for the hydrothermal reaction. The process involves the dissolution of the Ti substrate to form titanium hydroxide intermediates, which subsequently crystallize into TiO2 nanostructures under hydrothermal conditions. This method typically produces aligned TiO2 nanotubes or nanowires with excellent adhesion to the substrate, eliminating the need for additional binding layers or post-synthesis transfer.
One significant advantage of this approach is its ability to produce a seamless interface between the TiO2 nanostructures and the metallic substrate, which enhances electron transport in electrochemical applications such as sensors, batteries, and supercapacitors. Compared to other methods, this technique avoids the use of complex precursors or templates, reducing cost and simplifying the process. Additionally, the absence of organic solvents or additives makes this method environmentally friendly. The direct growth on a conductive substrate also allows for scalability and easy integration into devices, making it a preferred choice for practical applications in energy and sensing technologies.
Our study presents a novel electrochemical sensor optimized for neutral pH and based on TiO2 nanowires, which is suitable for plant and biological applications. A key focus of the study was investigating the effect of TiO2 morphology on sensor performance. We systematically optimized the parameters of the hydrothermal synthesis process in order to tailor the TiO2 nanostructures, and we demonstrated that morphological features have a significant influence on the electrochemical response towards H2O2 detection. The resulting high-performance TiO2 architecture enabled the accurate monitoring of endogenous hydrogen peroxide in real plant samples, particularly in barley exposed to salt stress. Furthermore, this study uniquely integrates the use of Fe3O4 nanoparticles as stress-alleviating agents, demonstrating their dose-dependent effect in reducing oxidative stress and preserving genomic stability, as confirmed by electrochemical detection and GTS analysis. This dual evaluation of physiological and molecular responses highlights the potential of the sensor as a diagnostic tool and as a platform for guiding nanomaterial-assisted stress mitigation. This research is directly relevant to current global challenges in sustainable agriculture, where the early detection of stress and the use of nanomaterials to mitigate it are essential for improving crop resilience and productivity in the face of increasingly adverse environmental conditions.

2. Materials and Methods

2.1. Materials

Iron(II) chloride tetrahydrate (FeCl2·4H2O, CAS No. 13478-10-9), iron(III) chloride hexahydrate (FeCl3·6H2O, CAS No. 10025-77-1), ammonium hydroxide solution (NH4OH, 32%, CAS No. 1336-21-6), phosphate-buffered saline (PBS, 0.1M solution, pH = 7.4), potassium nitrate (KNO3, CAS No. 7757-79-1), glucose (C6H12O6, CAS No. 50-99-7), citric acid (HOC(COOH)(CH2COOH)2, CAS No. 77-92-9), ascorbic acid (C6H8O6, CAS No. 50-81-7), and hydrogen peroxide solution (H2O2, 30%, CAS No. 7722-84-1) were all obtained from Merck (Merck KGaA, Darmstadt, Germany), with a minimum purity of 99.8%. High-purity Ti plates (99.9%, 5 cm high and 0.5 cm wide) were purchased from Sigma-Aldrich (St. Louis, MO, USA). Silver/silver chloride (Ag/AgCl) wire was supplied by A-M Systems (Sequim, WA, USA), while carbon rods (5 mm diameter) were sourced from Sigma-Aldrich (St. Louis, MO, USA).
Barley seeds (Hordeum vulgare L. “Marthe”) were obtained from the Institute of Agricultural Resources and Economics, Stende Research Center (Priekuli, Latvia). A universal peat soil for seedling cultivation (Durpeta, LT, Šepeta, Lithuania) was purchased locally. The distilled water used in all experiments was prepared in the laboratory.

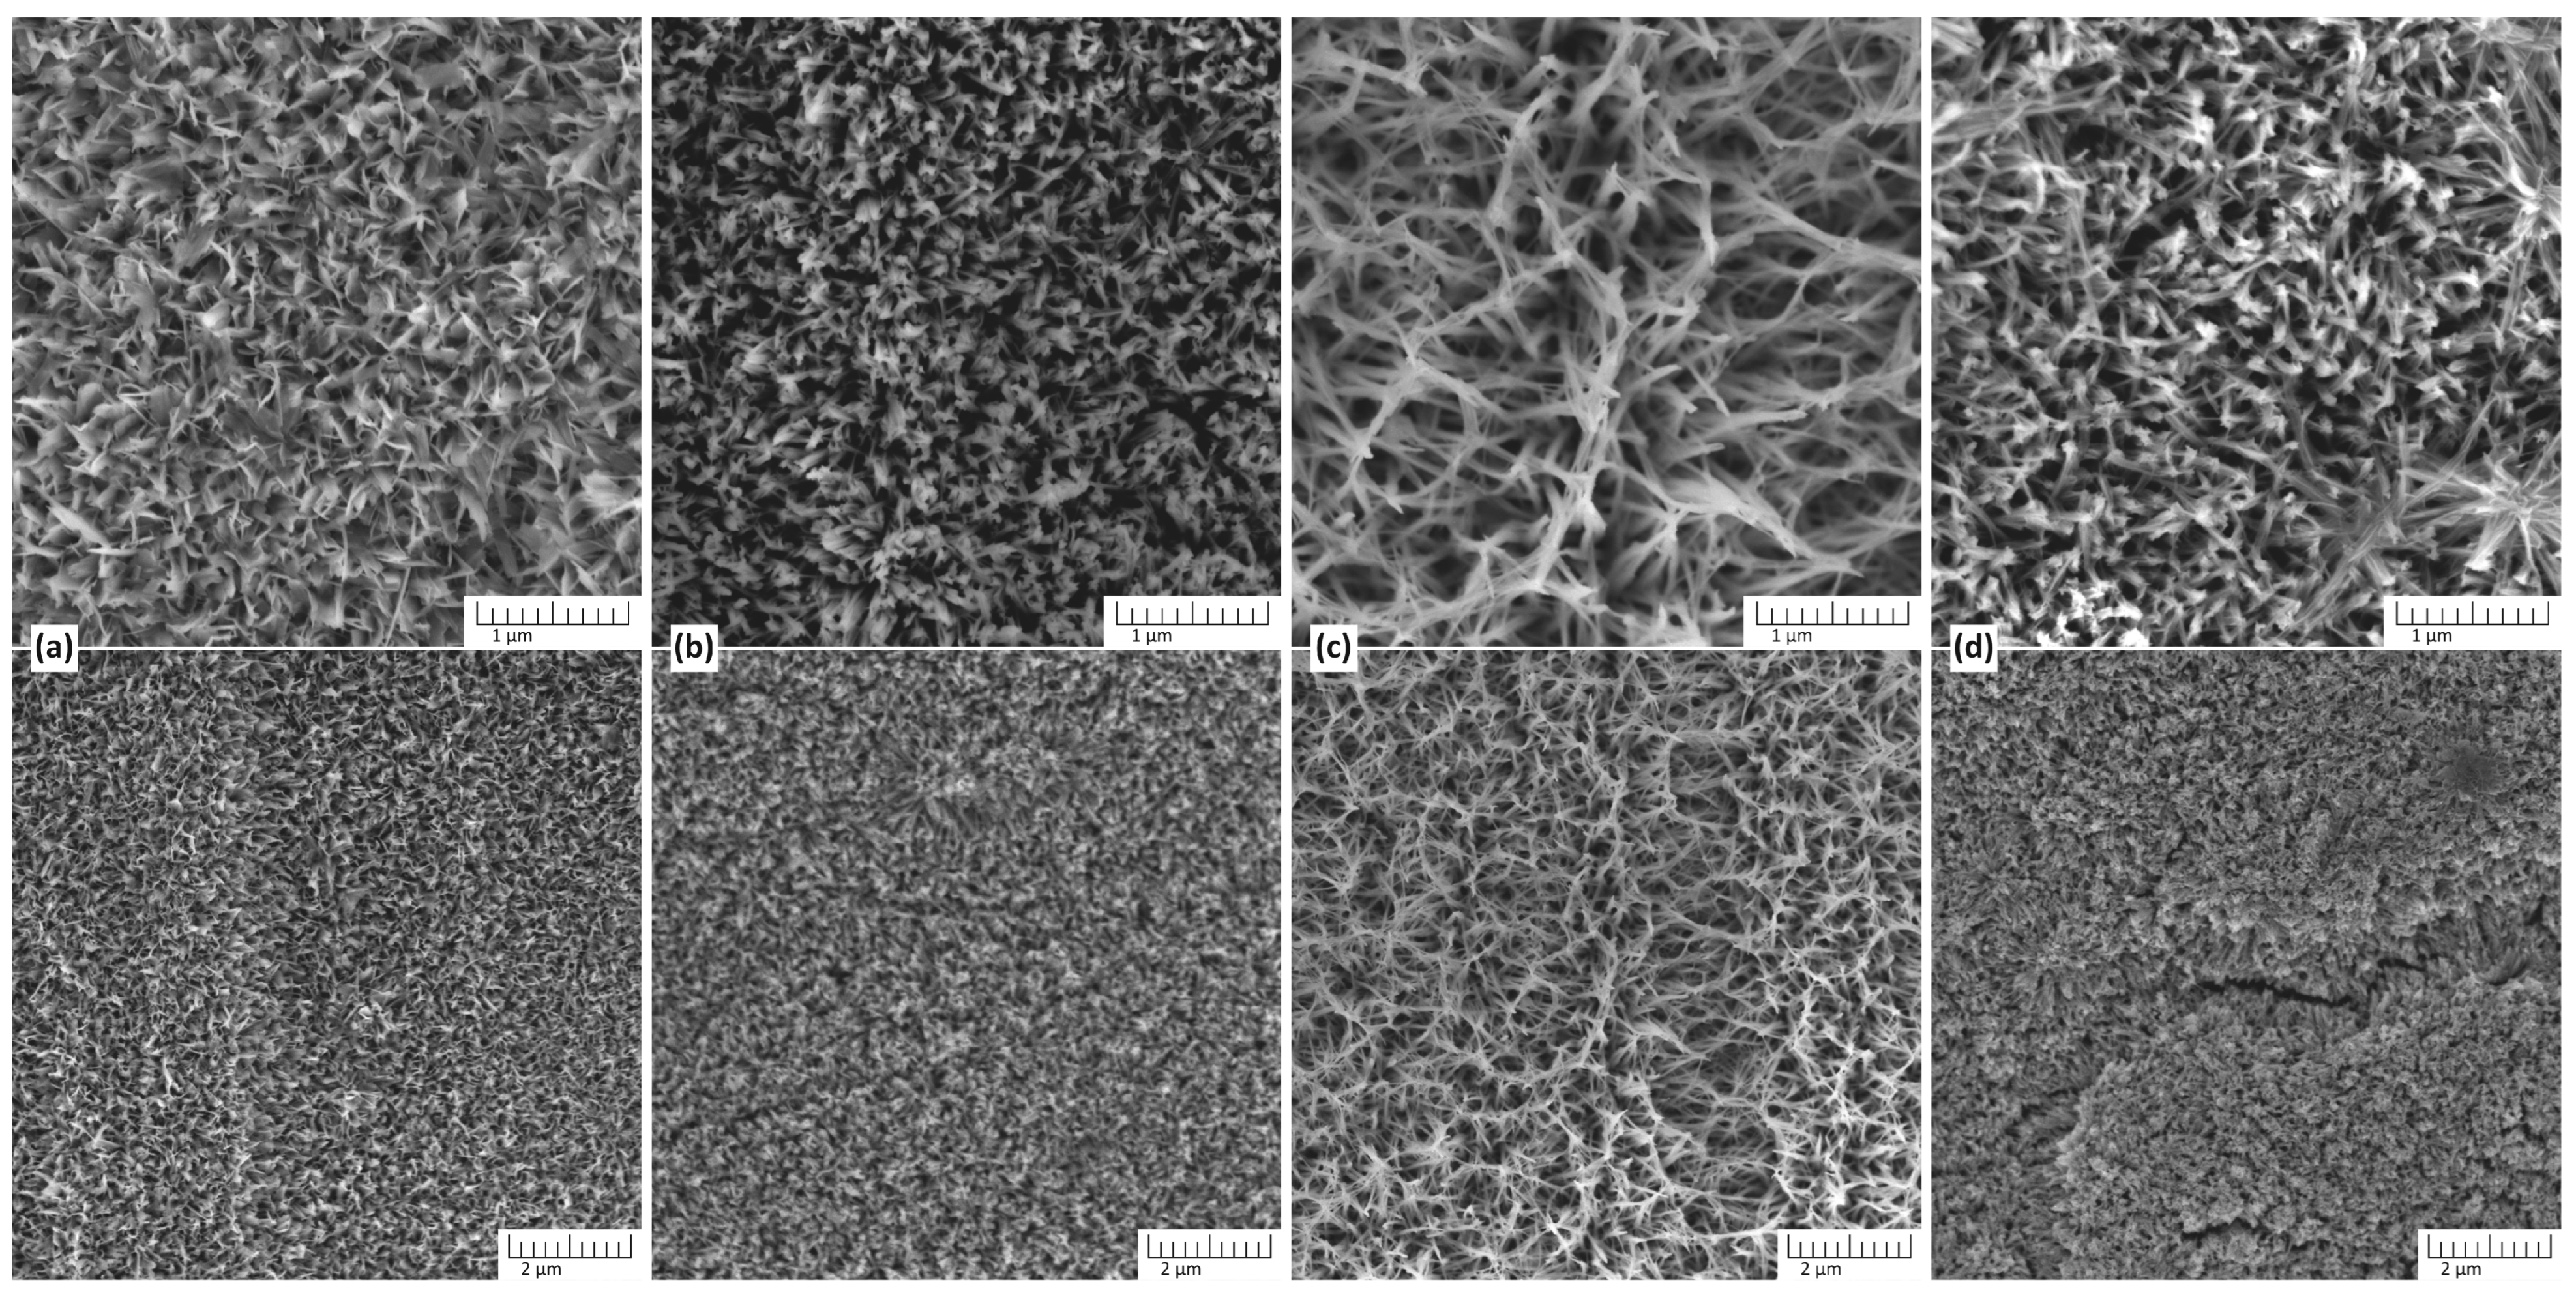
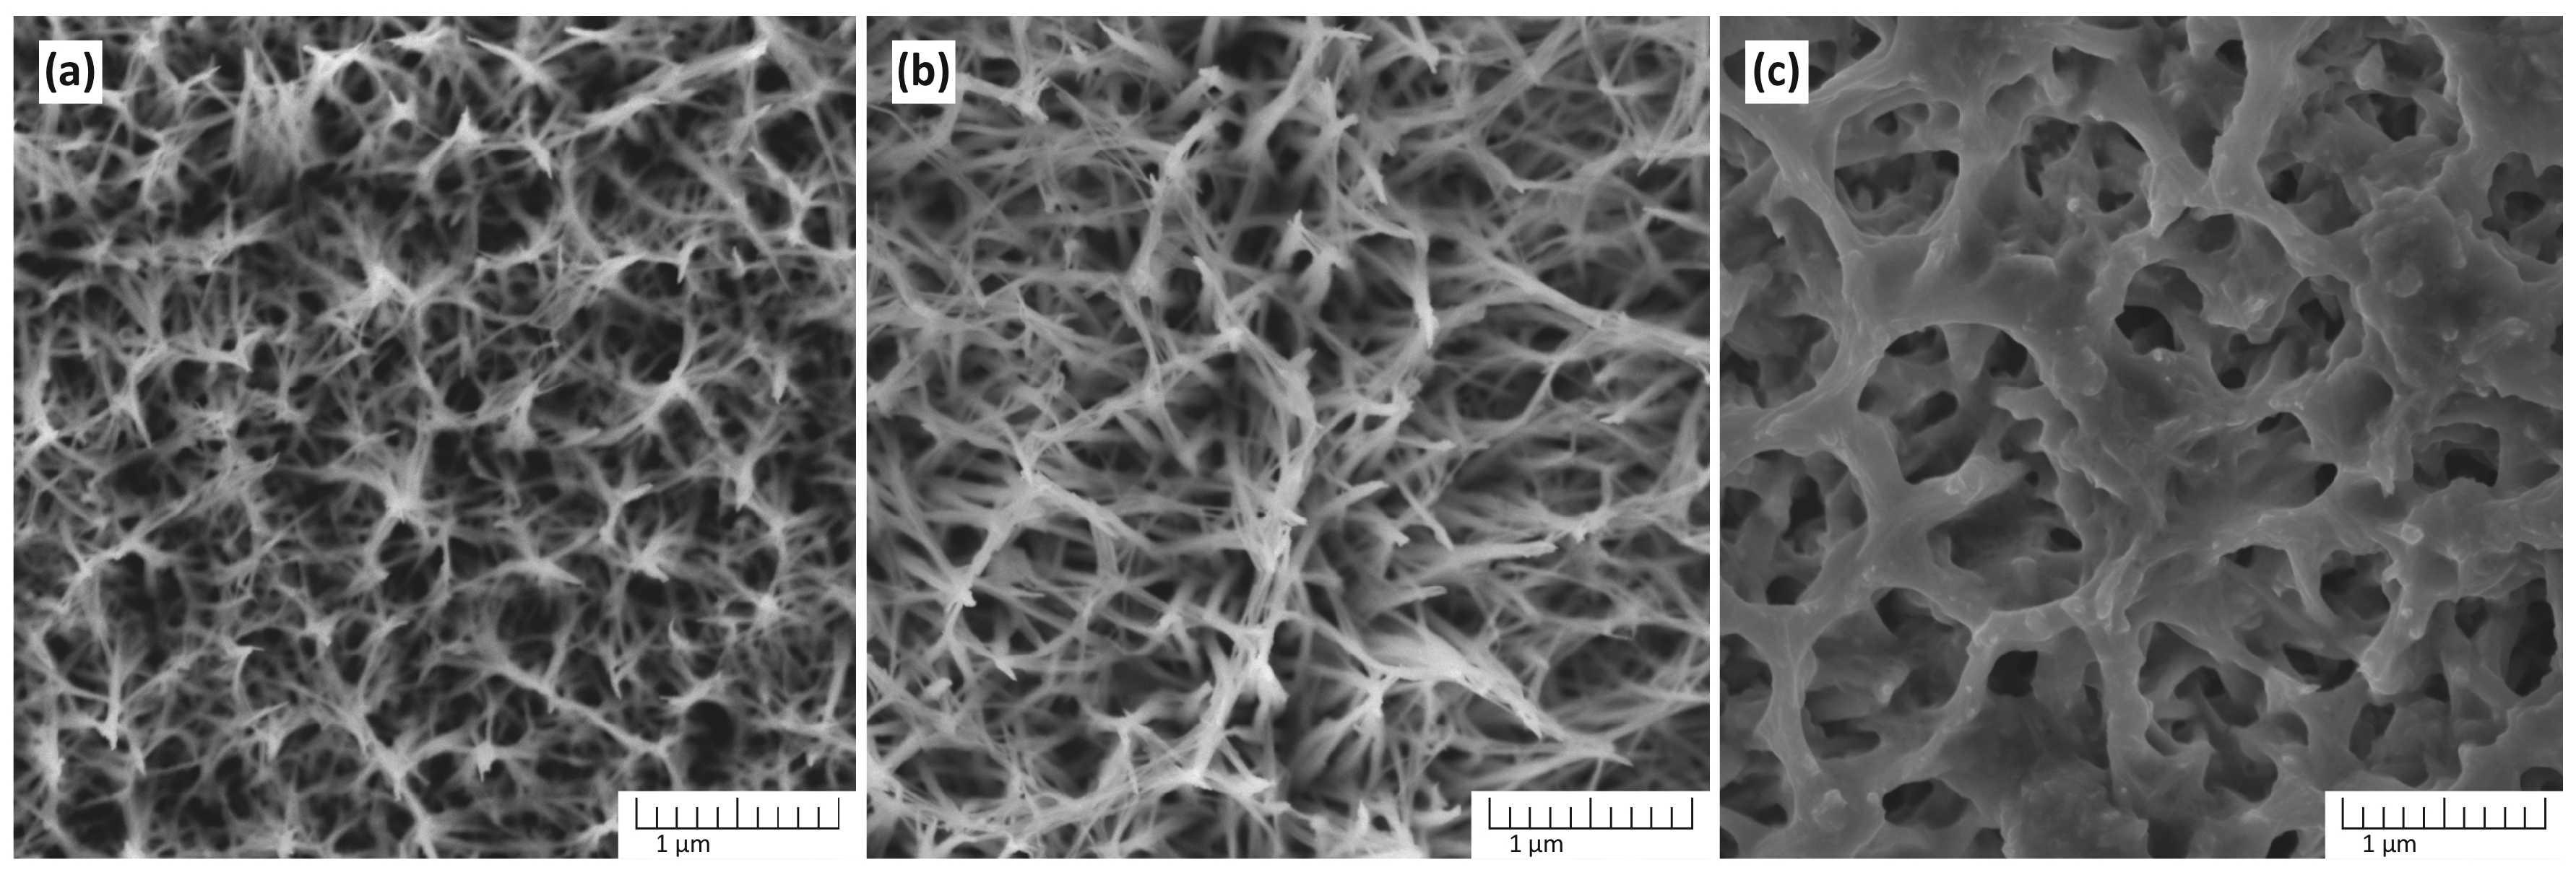
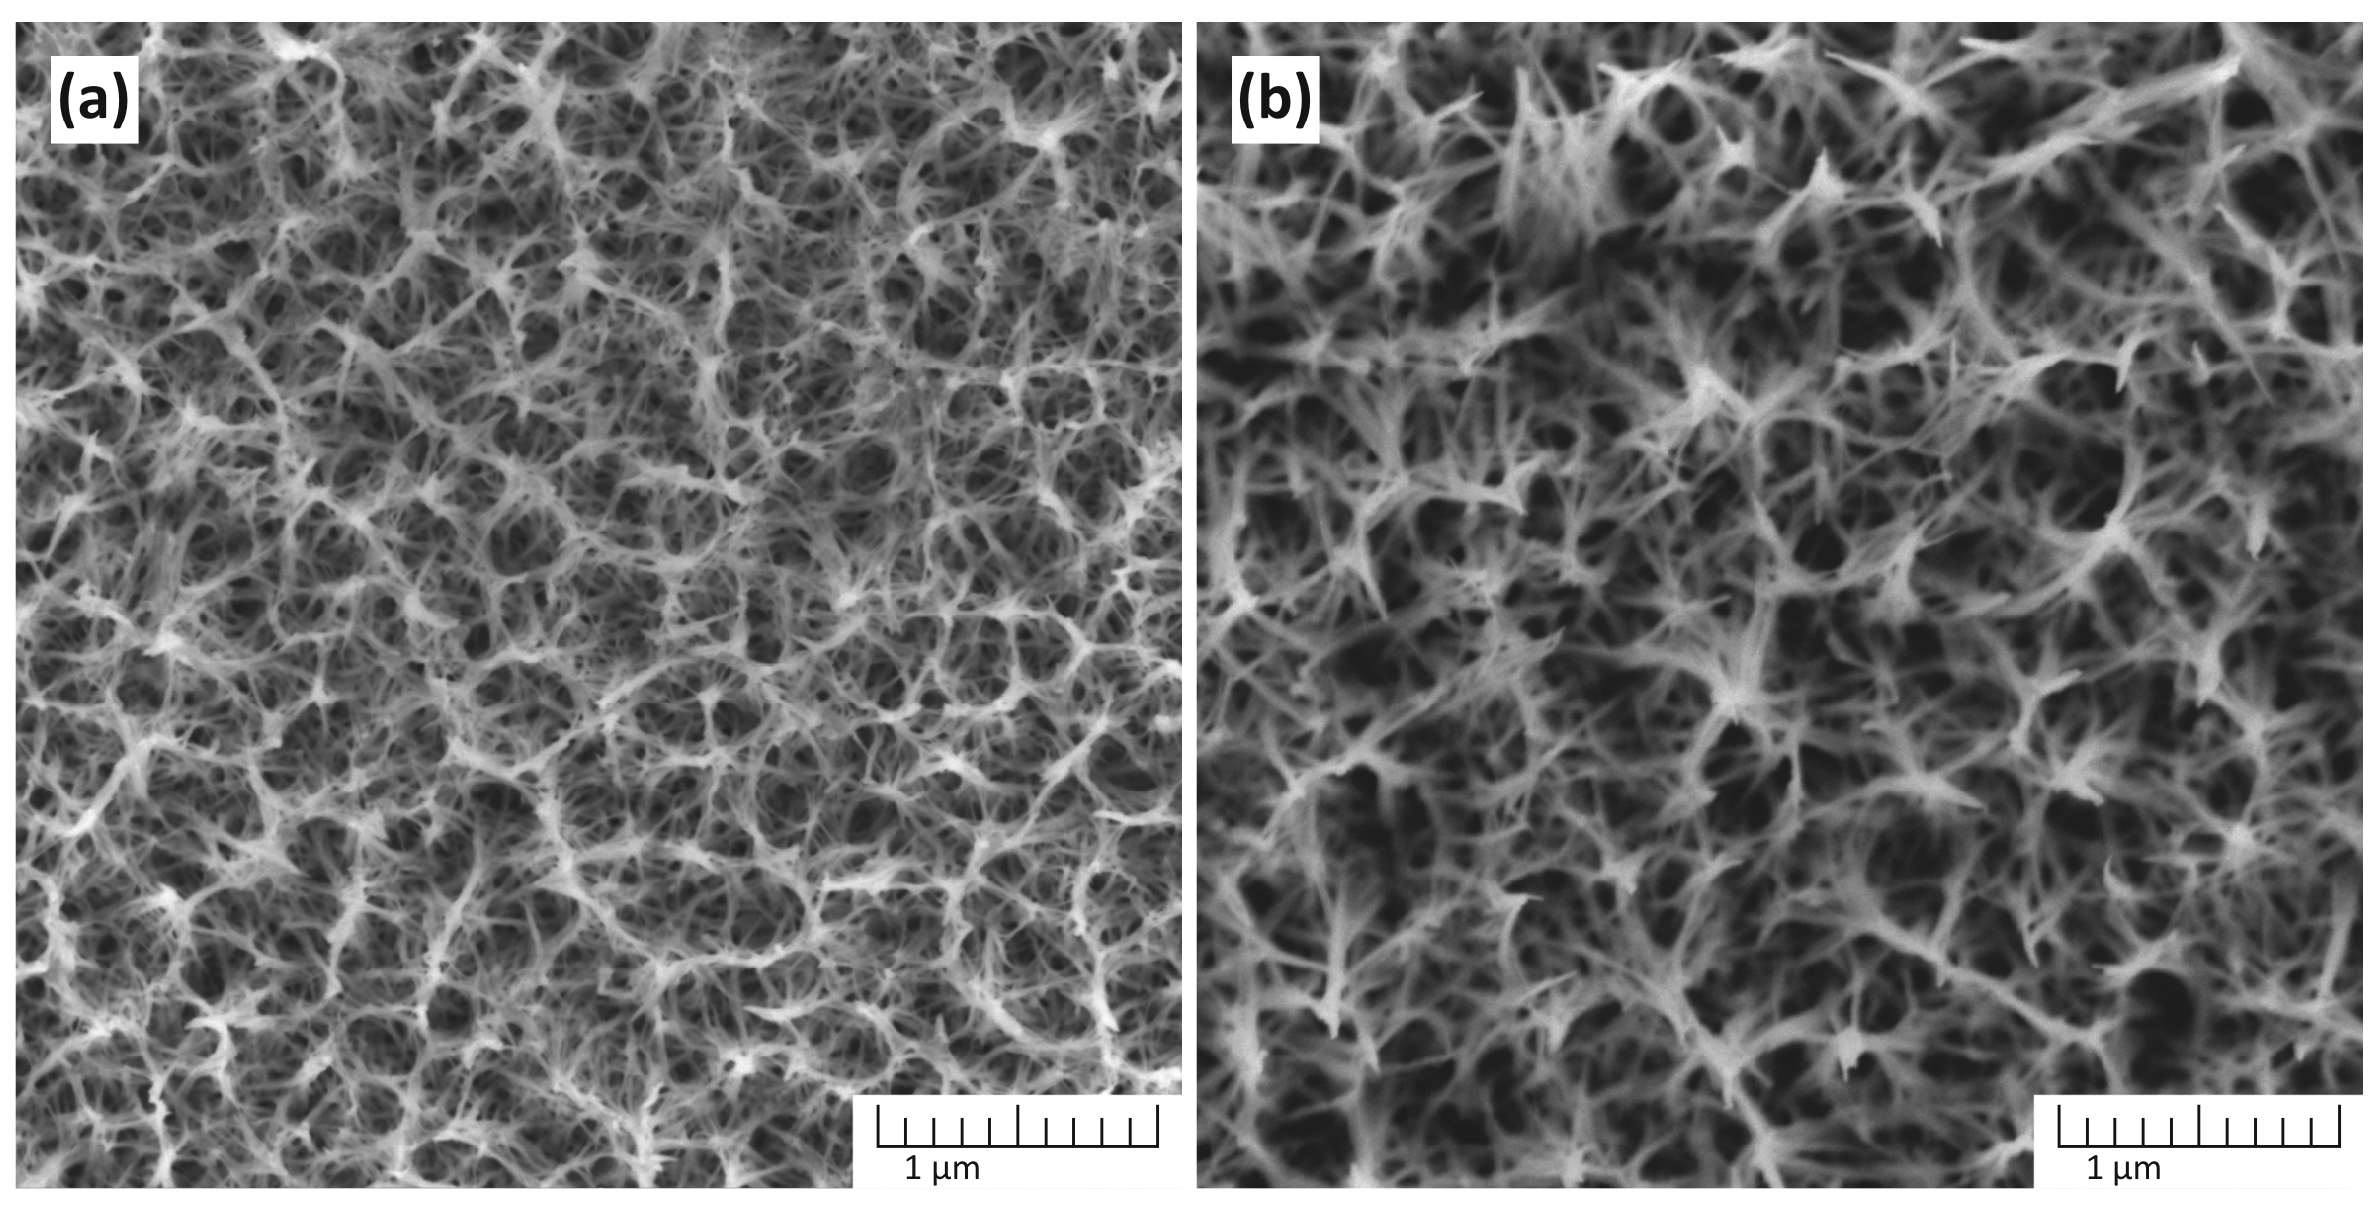
2.2. Hydrothermal Synthesis of TiO2 and Electrode Preparation

The synthesis of nanostructures was conducted within a programmable furnace located within a Teflon-lined autoclave. In order to assess the effect of synthesis parameters on the morphology of the obtained nanostructures, the synthesis was carried out at various parameters. Consequently, the temperature was subjected to variation between 120 and 180 degrees, the concentration of NaOH was adjusted between 1 M and 7 M, and the synthesis time was calibrated from 1 to 3 h. Subsequent to the synthesis, the autoclave was detached from the furnace and permitted to cool naturally. Subsequently, the samples were extracted and subjected to multiple washes with distilled water, with the objective of eradicating any residual reagents. Thereafter, the samples were dried at a temperature of 150 °C for a duration of one hour.
The one-pot autoclave synthesis of titanium dioxide (TiO2) from titanium metal involves a two-step process mediated by hydrothermal and post-treatment techniques. The initial reaction involves the interaction of metallic titanium with NaOH and H2O under hydrothermal conditions, resulting in the formation of sodium titanate (Na2TiO3) and hydrogen gas as byproducts:
Ti + 2NaOH + H2O → Na2TiO3 + 2H2
This reaction proceeds in a highly alkaline environment, with water acting as both a reactant and a medium to facilitate titanium dissolution. The formation of Na2TiO3 occurs due to the strong affinity of titanium for oxygen and the stabilizing effect of sodium ions in the alkaline solution.
At elevated temperatures within the autoclave, sodium titanate can decompose under hydrothermal or mildly reducing conditions, leading to the formation of TiO2 and sodium hydroxide:
Na2TiO3 + H2O → TiO2 + 2NaOH
The final stage of synthesis is the recycling of NaOH. The sodium hydroxide released during the decomposition of Na2TiO3 can participate in further reactions with titanium, creating a self-sustaining reaction environment within the autoclave.
After the growth process was completed, the morphology of the resulting samples was analyzed using FESEM (MAIA 3, Tescan, Brno, Czech Republic), and their crystallinity was assessed using XRD (Rigaku Smart lab, RIGAKU, Tokyo, Japan).
Electrochemical assessments were carried out using a custom-designed electrochemical cell, which incorporated a Ti/TiO2 nanowire-based plate as the working electrode, a carbon rod as a counter electrode, and an Ag/AgCl wire as a reference electrode. The equipment used for the experiment consisted of a glass beaker placed within a water bath, which was equipped with a magnetic stirrer to maintain uniform temperature control at 25 °C and ensure rapid mixing of the introduced H2O2 within the buffer solution. To achieve precise electrode positioning and measurement reproducibility, a custom-built acrylonitrile butadiene styrene (ABS) lid, fabricated via 3D printing, was used to fix the working electrode at a consistent height and featured a central opening to facilitate the introduction of analytes via micropipette, and it also allows additional instruments, such as thermometers or pH meters, to be integrated during measurements. This design ensured uniform exposure of the electrodes to the analyte across all experiments, while also allowing for easy removal and replacement of the electrodes without altering the other experimental conditions. Electrochemical data acquisition and control of experimental parameters were performed using a Zahner Zennium electrochemical workstation (Zahner-Elektrik GmbH & Co., Kronach, Germany).
The electrochemical detection of H2O2 using TiO2 nanostructured electrodes relies on their intrinsic catalytic activity, which facilitates redox reactions through the Ti(IV)/Ti(III) transition. Under reducing conditions, TiO2 acts as an electron acceptor, generating active surface Ti3+ sites via the following reaction:
TiO2 + e → TiO2 (Ti3+)
These Ti3+ species serve as electron donors, reducing H2O2 to water while regenerating Ti4+, as described by:
H2O2 + 2Ti3+ + 2H+ → 2Ti4+ + 2H2O
This reduction process produces a measurable cathodic current proportional to the H2O2 concentration. Conversely, under oxidizing conditions, H2O2 undergoes catalytic oxidation at the TiO2 surface, generating oxygen and protons while donating electrons to the electrode:
H2O2 → O2 + 2H+ + 2e
The continuous regeneration of Ti4+ ensures sustained catalytic activity, enhancing the efficiency and sensitivity of H2O2 detection. This redox cycling mechanism allows TiO2 nanostructured electrodes to function as highly effective platforms for electrochemical biosensing applications, providing high selectivity, stability, and rapid response times for H2O2 quantification in biomedical and environmental analyses.
Cyclic voltammetry (CV) experiments were performed within a potential range of −0.5 V to −2 V versus Ag/AgCl, starting at an initial potential (Estart) of 0 V with a scan rate of 100 mV·s−1. To assess TiO2-based electrode sensitivity, varying concentrations of H2O2 (ranging from 0 mM to 10 mM) were introduced into the 0.1 M PBS (pH = 7.4) supporting electrolyte, and the corresponding CV curves were obtained. During current response analysis (i-t measurement), a fixed potential of −1.1 V, corresponding to the oxidation peak position, was set up in the electrochemical cell, and the value of the resulting current was determined. These chronoamperometric measurements were conducted in PBS at pH = 7.4. After a 120 s stabilization period, sequential injections of H2O2 were performed every 120 s, covering a concentration range from 25 to 5000 μM. Throughout all measurements, stirring was applied and maintained at 1290 rpm using a magnetic stirrer in a water bath set to a constant temperature of 25 °C. To evaluate potential interference from complex plant matrices containing inorganic salts (which simulate ionic conditions typically found in soil and hydroponic systems), sugars (primary plant metabolites), acids (antioxidants involved in cellular respiration), and plant-derived compounds, interference tests were conducted by introducing 50 μM increments of NaCl, glucose, citric acid, and ascorbic acid into the supporting electrolyte. For real sample analysis, a barley extract was prepared using 0.1 M PBS and further diluted with 0.1 M PBS in a 1:6 ratio. As the endogenous H2O2 concentration in the stressed barley samples was unknown, controlled amounts of H2O2 were manually added during measurements, and the corresponding chronoamperometric responses were recorded. The detected H2O2 concentration was determined based on calibration data obtained from the supporting electrolyte, while the amount of H2O2 naturally present in the plant samples was calculated by subtracting the artificially introduced peroxide from the total measured value. Each experiment used 70 mL of analyte, and the final peroxide concentration was derived from the averaged results of multiple sample batches.

2.3. Synthesis and Characterization of Fe3O4 Nanoparticles

The Fe3O4 nanoparticles were synthesized following the co-precipitation method (Massart), as previously described in our earlier work [78]. This approach facilitates the production of small nanoparticles suitable for plant applications. In the synthesis process, 0.2334 g of FeCl3·6H2O and 0.0858 g of FeCl2·4H2O were dissolved in 100 mL of distilled water. A 0.54 mL volume of 25% NH4OH was then gradually introduced into the solution via pipetting, while maintaining constant manual stirring. This reaction resulted in the formation of 72 mg of a black precipitate.
To stabilize the synthesized nanostructures, an aqueous citric acid solution (40 mg·mL−1, 2 mL) was added. The Fe3O4 precipitate was then separated from the solution using a permanent magnet and repeatedly washed with distilled water until the wash solution turned clear, ensuring the removal of any residual reactants. The overall hydrothermal synthesis reaction of Fe3O4 nanoparticles is represented as follows:
Fe2+ + 2Fe3+ + 8OH → Fe3O4↓ + 4H2O
SEM imaging indicated that the Fe3O4 powder consisted of agglomerated nanoparticles, while AFM analysis confirmed that the nanoparticles exhibited a spherical morphology with an average size of approximately 10 nm. These findings have been previously detailed in our prior publication [78].

2.4. Barley Seedling Cultivation and Sample Preparation

A peat-based universal soil was used for barley seed germination and seedling growth. Throughout the first week, all samples were irrigated daily with 20 mL of deionized water to support germination and early seedling development. Beginning in the second week, the seedlings were divided into five experimental groups, each consisting of four containers, to assess the negative impact of salt stress and the potential role of Fe3O4 nanoparticles in developing salt stress tolerance.
The first group of barley seedlings served as the control sample and continued to receive a portion containing 20 mL of deionized water daily. The second group was exposed to salt stress, with daily irrigation consisting of 20 mL of a 0.2 M NaCl aqueous solution per container. The third group was treated with Fe3O4 nanoparticles, receiving 20 mL of an aqueous nanoparticle solution at a concentration of 72 mg·L−1 per container. The fourth group received a 20 mL portion containing a 0.2 M NaCl aqueous solution supplemented with Fe3O4 nanoparticles at an initial concentration of 72 mg·L−1. The fifth group was similarly exposed to a 0.2 M NaCl solution containing Fe3O4 nanoparticles, but at a reduced nanoparticle concentration of 36 mg·L−1. This irrigation regimen was maintained for an additional three weeks. Environmental conditions, including temperature (22 °C), humidity (50%), and illumination, remained consistent across all experimental groups.
After one month of growth, barley samples were harvested for H2O2 measurements. The seedlings were cut into small fragments and ground using a ceramic mortar and pestle to break down plant tissues, enhancing the extraction process. The crushed material was then transferred to a container containing a 0.1 M PBS solution for extraction. The extracted samples were left in a cool, dark environment overnight to optimize extraction. Subsequently, the barley extracts were twice filtered through smooth filter paper to remove solid plant residues, and the resulting filtrates were used for further analysis.

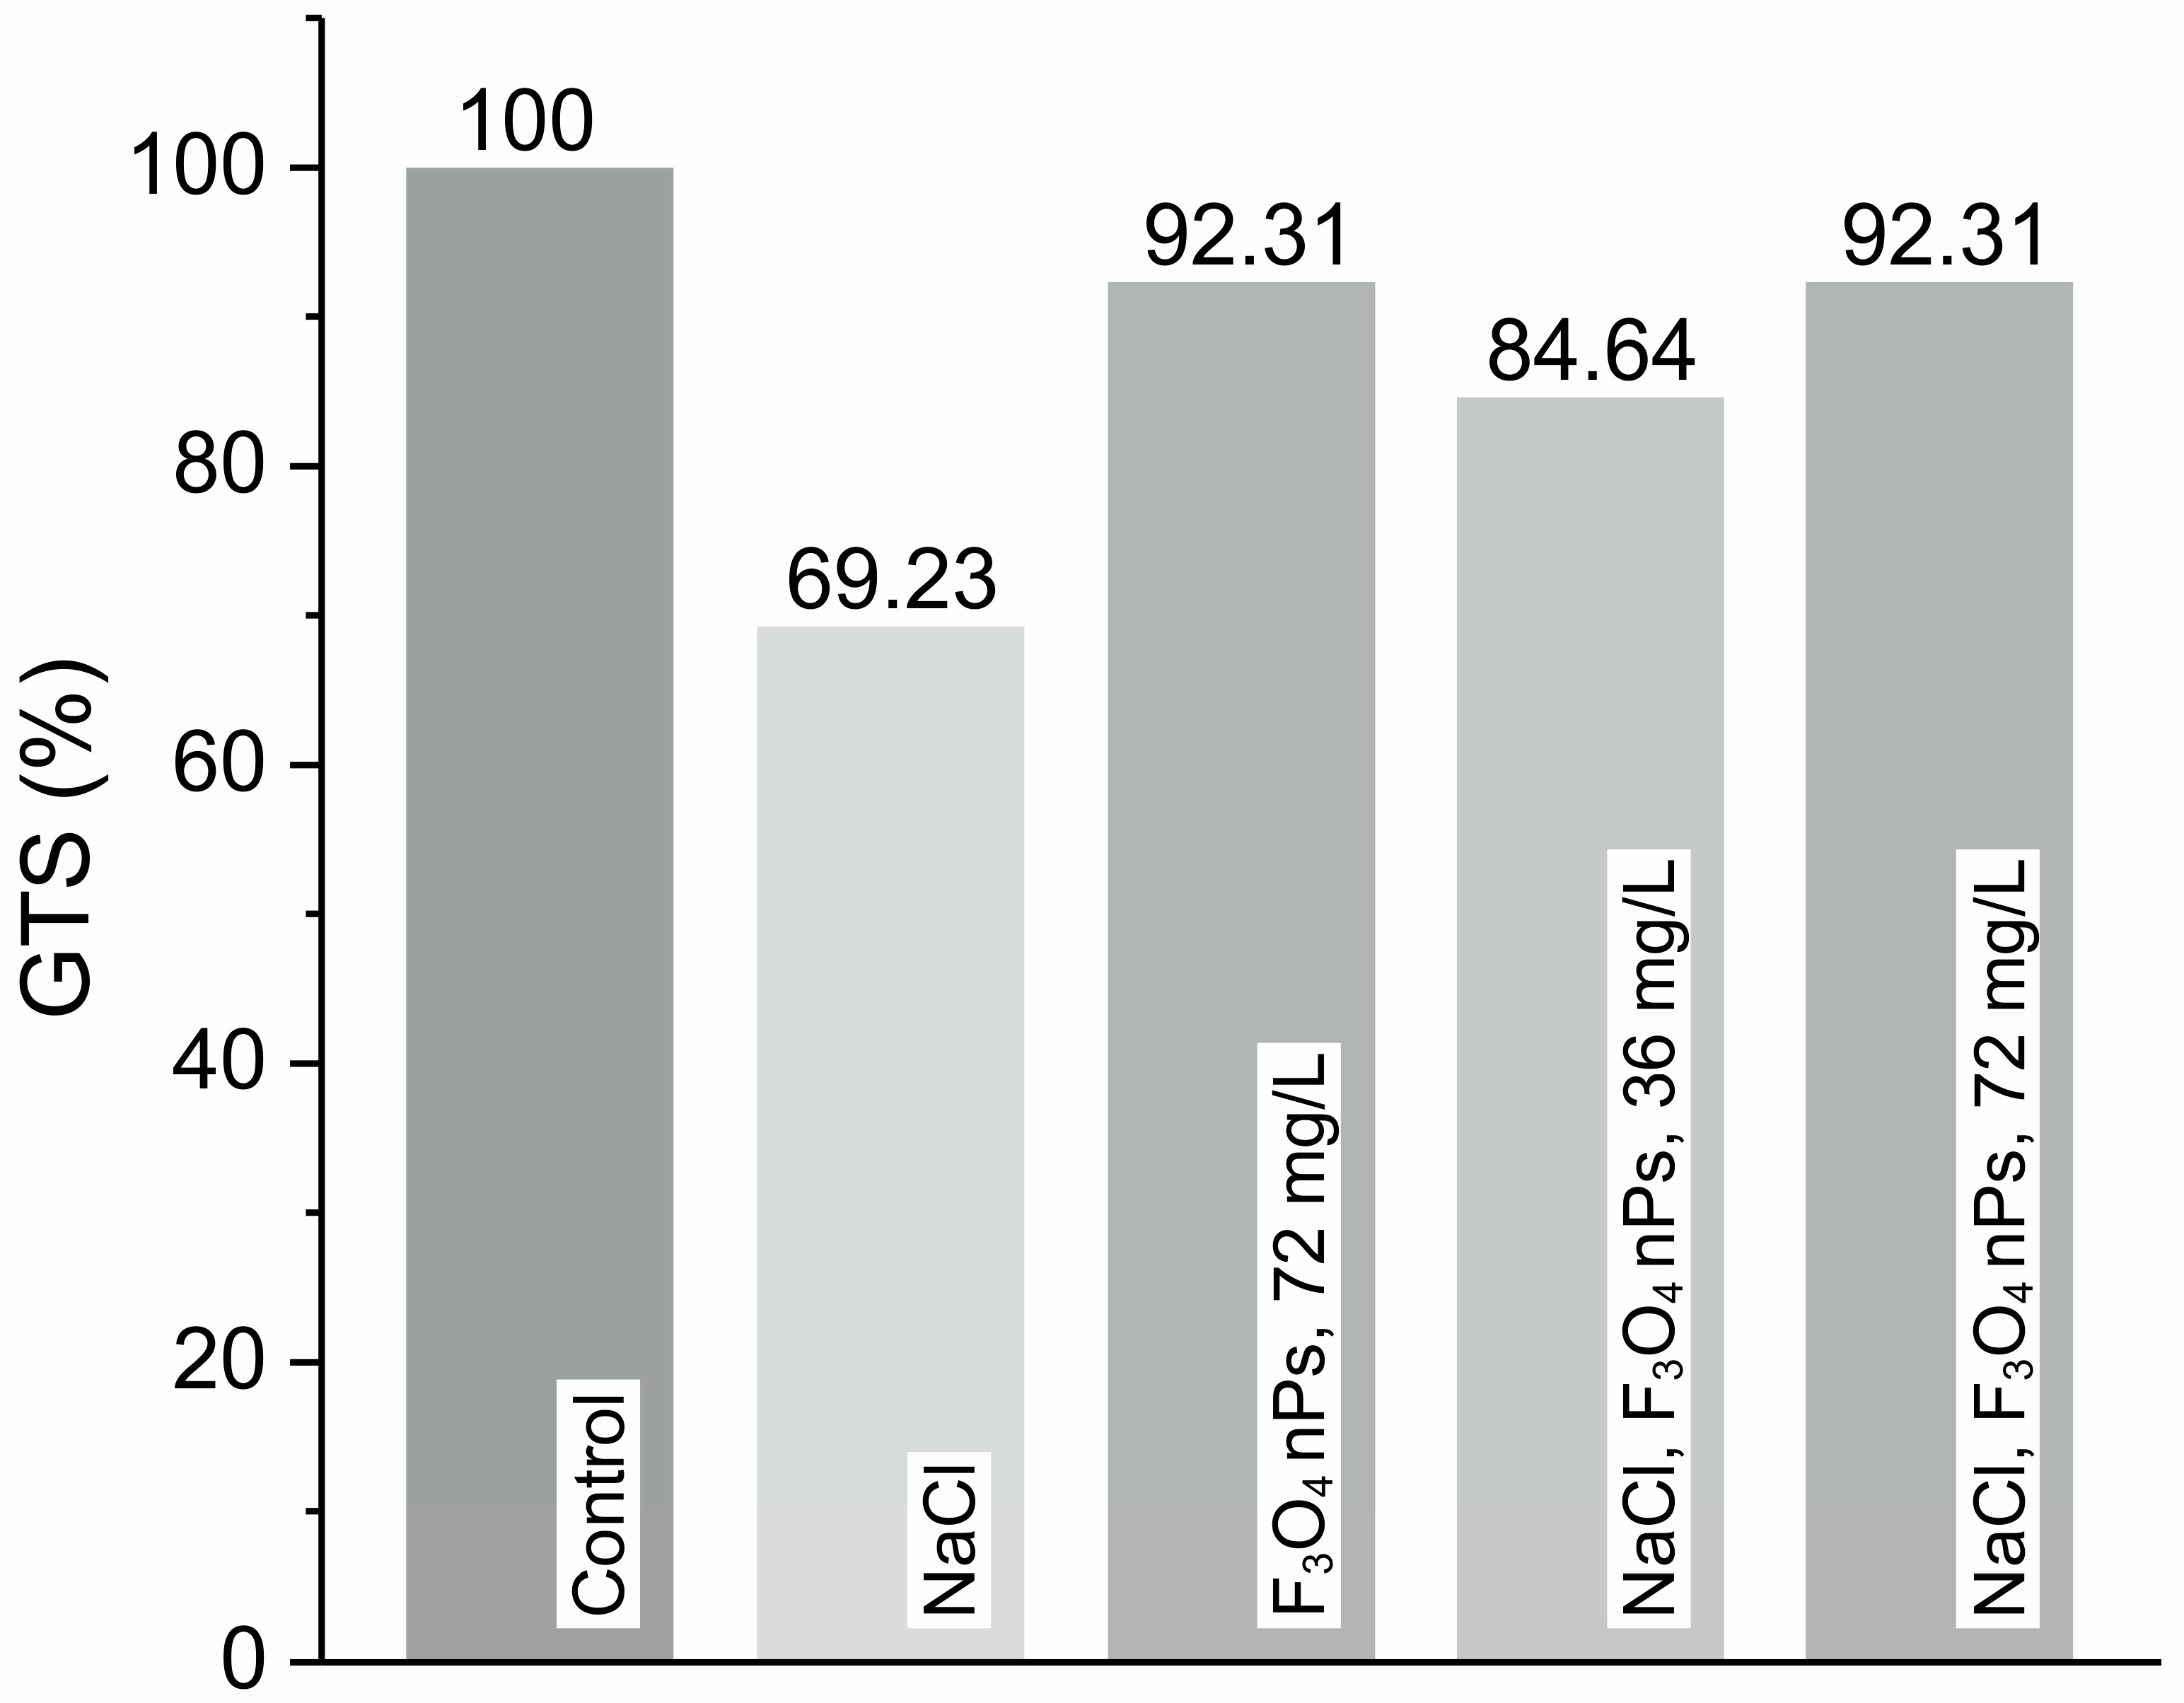
2.5. Genome Template Stability Evaluation

To evaluate the genotoxicity of Fe3O4 NPs alone, salt stress alone, and Fe3O4 NPs in the presence of soil salinity, the RAPD method was employed. This method involves DNA extraction, PCR amplification, and electrophoresis. DNA isolation was conducted using the DNeasy Plant Mini Kit (Qiagen GmbH, Hilden, Germany) following the manufacturer’s protocol. The concentration and absorbance of the extracted DNA samples were measured using a spectrophotometer (NanoDrop 1000, Thermo Scientific, Waltham, MA, USA) with standard parameters.
Three decamer primers (Bioneer, Daejeon, Republic of Korea) with the following sequences were selected for the PCR reaction: OPN 15 (5′-CAGCGACTGT-3′), OPA 07 (5′-GAAACGGGGGTG-3′), and OPD 18 (5′-GAGAGAGCCAAC-3′). The Taq PCR Core Kit (Qiagen GmbH, Hilden, Germany) was used to perform the reaction. The reaction mixture was prepared according to the manufacturer’s protocol. The final reaction volume was 25 μL, including 5 μL of the DNA sample. Deionized water served as a negative control. The amplification process included an initial denaturation step (1 min at 94 °C), followed by a three-step cyclic reaction: denaturation (1 min at 94 °C), annealing (1 min 30 s at 30–35 °C, primer-dependent), and extension (2 min at 72 °C). A final extension step (10 min at 72 °C) was performed to complete the reaction. Each reaction underwent 35 cycles. Each reaction was repeated three times for every sample and primer to ensure reproducibility.
The PCR products were visualized using the agarose gel electrophoresis method. The gel was prepared using LE agarose powder (CSL-AG500, Cleaver Scientific Ltd., Rugby, UK), TAE buffer (A1691, AppliChem, Darmstadt, Germany), and SimplySafe stain (E4600-01, EURx, Gdansk, Poland). Loading dye (ID1654, Nippon Genetics Europe, Düren, Germany) was used to load the PCR samples into the gel wells. A FastGene 100 bp DNA Ladder H3 RTU (MWD 100, range: 100–3000 bp, 12 bands, concentration: 100 µg·mL−1, 1.5% agarose gel, Nippon Genetics Europe, Düren, Germany) was used as a DNA size marker. Pure water served as a negative control. Electrophoresis was performed in a Mini-Sub Cell GT horizontal electrophoresis system (MultiSUB Midi, Cleaver Scientific Ltd., Rugby, UK) for 45 min at 130 V, powered by a power supply EV3150 (300 V, 2000 mA, 300 W, Consort, Turnhout, Belgium). At the conclusion of the process, the gel was imaged using the Fusion Solo 7S system (DarQ9 camera, Vilber, Marne-la-Vallée, France).
To estimate the level of genomic template stability (GTS, %) and genotoxicity, the following formula was used:
GTS (%) = [1 − a/n] × 100
where a is the average number of bands differing from the control and n is the total average number of bands detected in the control [79].
The formula is widely used in the RAPD method to provide a quantitative indicator of DNA stability after exposure to a genotoxicant [80]. It offers a general insight into DNA damage and mutations in samples obtained from bacteria, animals, and plants [81].
The obtained data were statistically analyzed using one-way ANOVA and Tukey’s HSD tests. A p-value of less than 0.05 was considered statistically significant. Each experimental value was compared to the control.

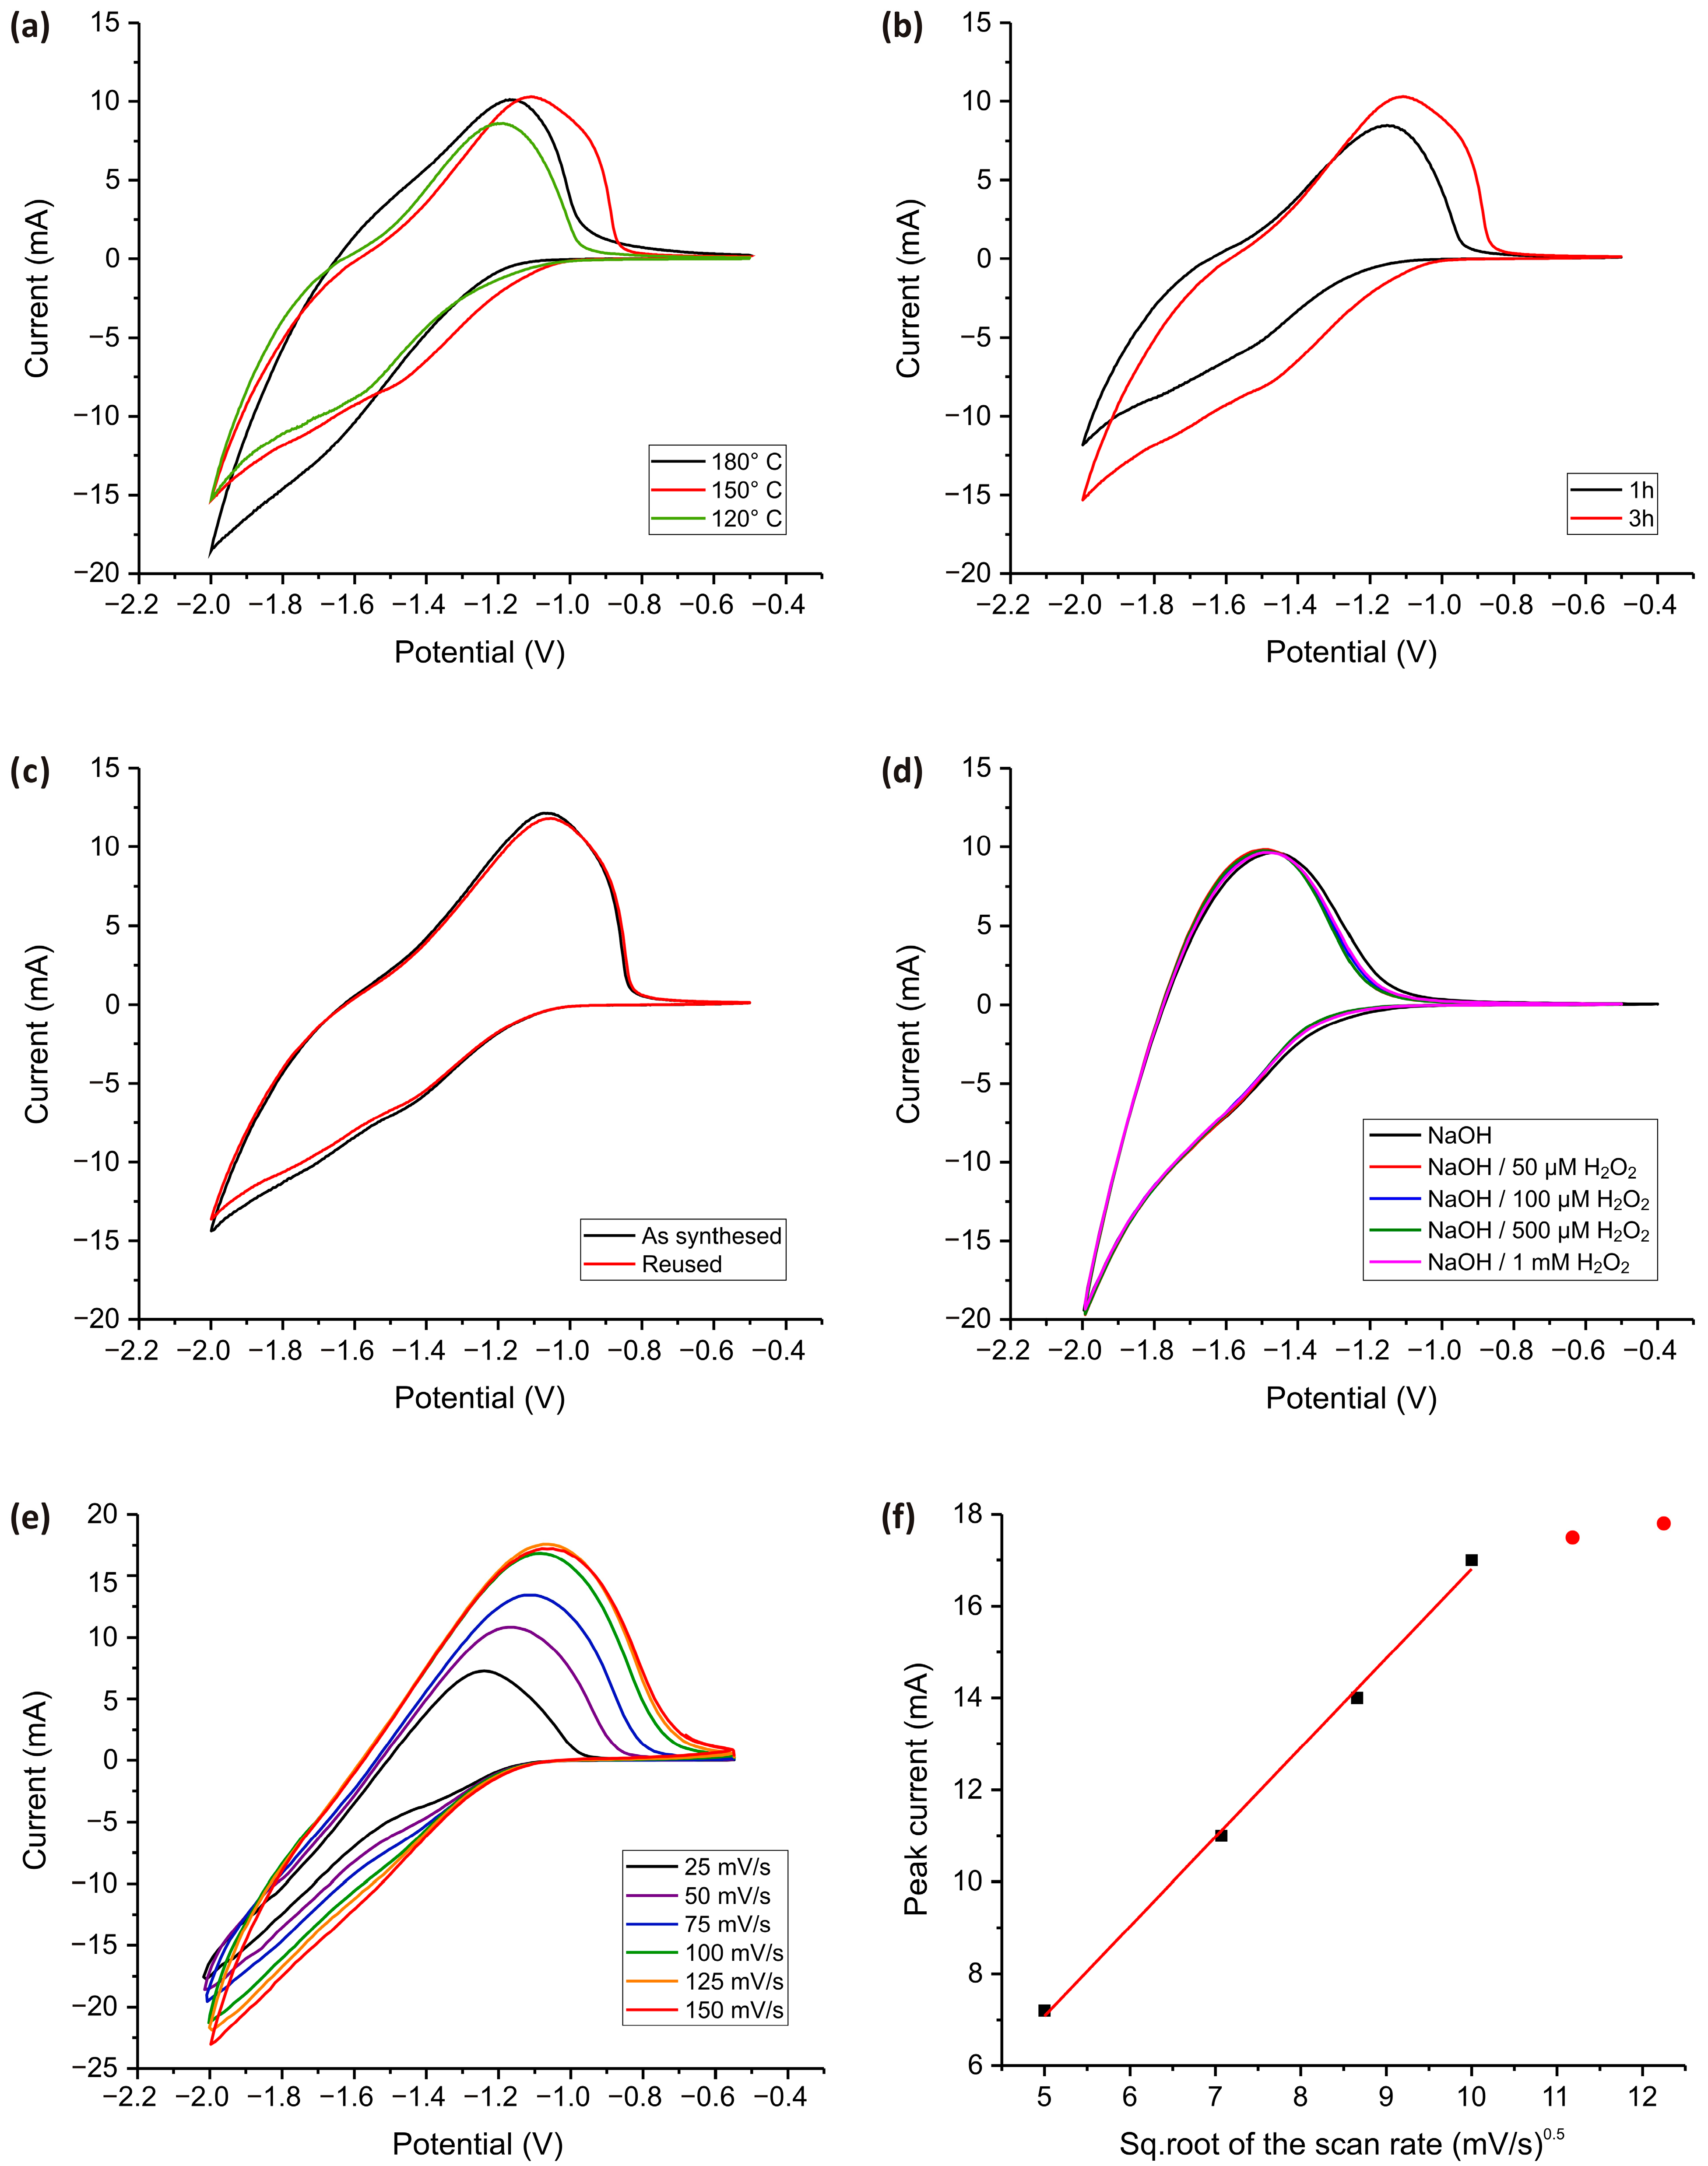
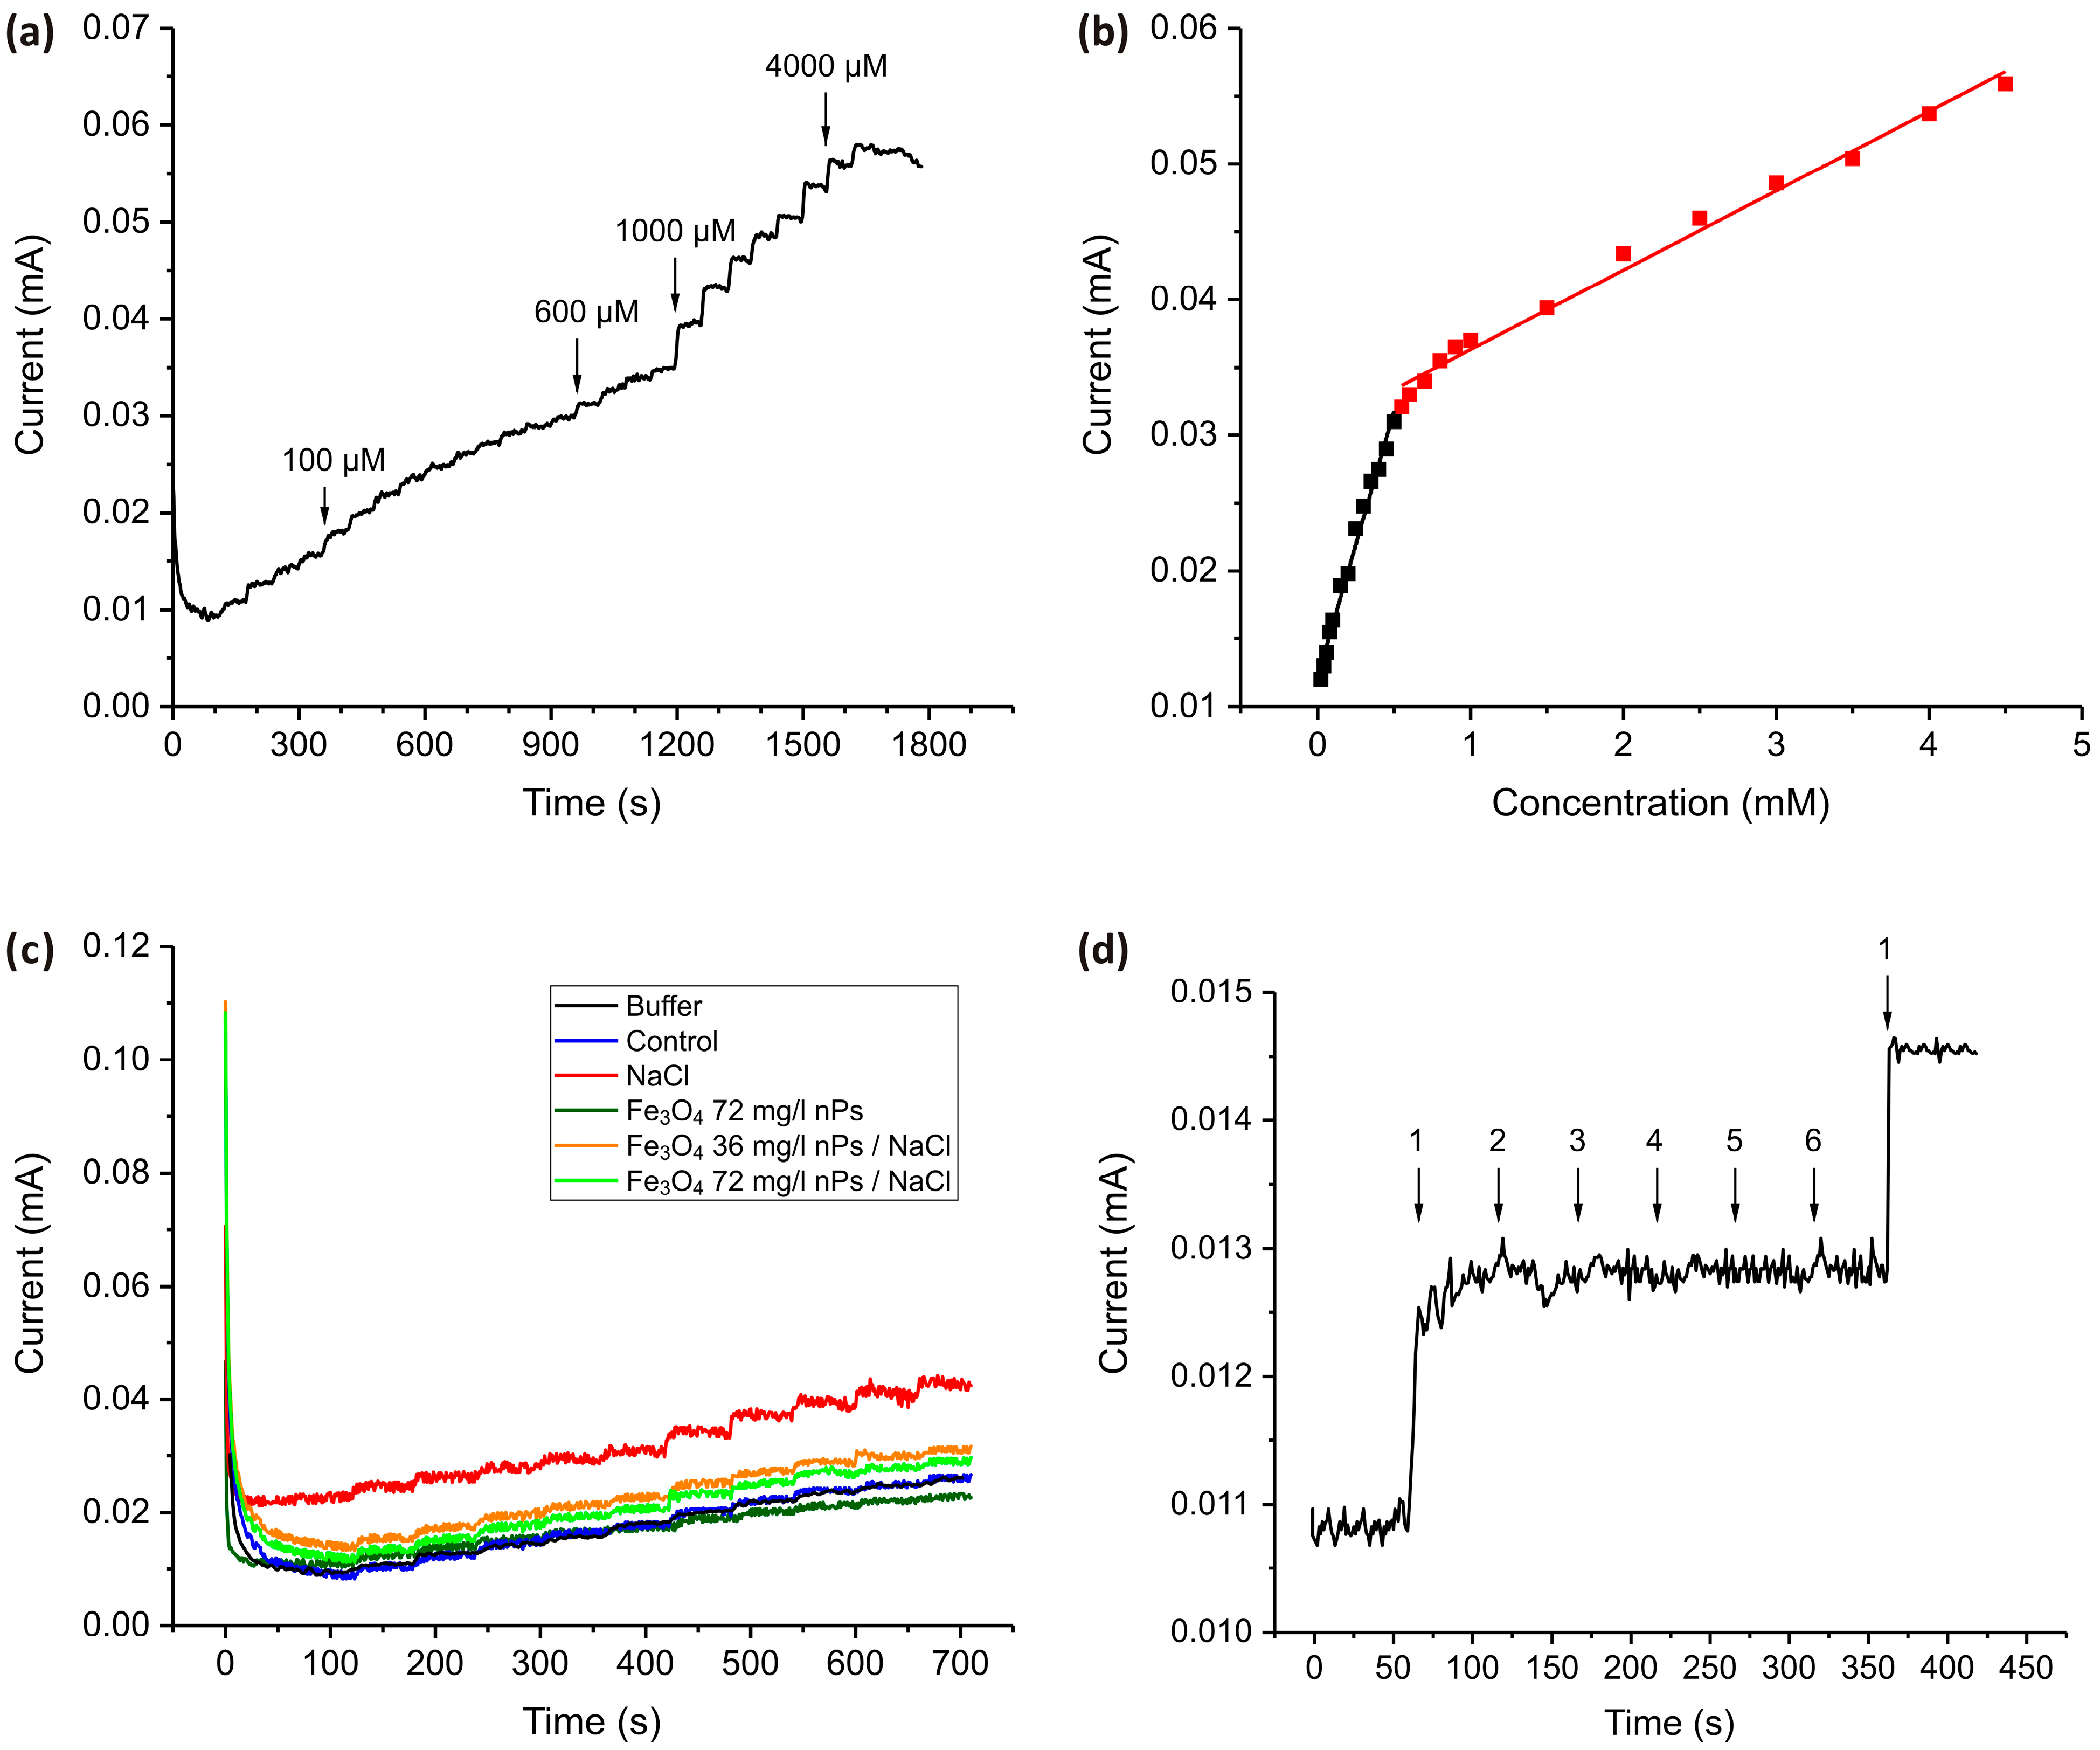
3. Results and Discussions

Figure 1 shows the SEM image of TiO2 nanostructures synthesized on Ti substrate in the presence of different concentrations of NaOH.
At the lowest concentration (1 M), the resulting structures exhibit a dense network of petal-shaped, thin nanostructures, indicative of incomplete dissolution and reprecipitation processes at low-alkali concentrations. The structure is less defined, suggesting limited etching or growth of nanostructures under these conditions. This indicates that the low alkalinity is insufficient to promote significant surface modification or the dissolution–precipitation process involved in TiO2 formation. Compared to the structures formed in 1 M NaOH, the nanostructures obtained at 3 M NaOH exhibit increased porosity and more developed nanoneedles composing an interconnected network, indicating enhanced dissolution and reprecipitation processes. The individual nanostructures appear more distinct and elongated, suggesting that the higher NaOH concentration facilitates the formation of well-defined features. At 5 M NaOH, the morphology of TiO2 exhibits highly developed nanostructures, characterized by an interconnected network of fiber-shaped nanostructures and significantly increased length compared to those obtained at 1 M and 2 M NaOH concentrations. This concentration appears optimal for promoting substantial surface modification and nanostructure growth during the hydrothermal synthesis of TiO2 from titanium plates. At the highest concentration (7 M), the surface morphology becomes irregular and overly etched, with evidence of structure collapse or excessive material dissolution. The interconnected network seen at 5 M is disrupted, possibly due to the aggressive alkaline conditions leading to over-etching and degradation of the formed nanostructures. In Figure 1d, it is evident that the formed coating is not uniform: cracks and peeling areas are observed. Thus, 5 M NaOH appears to be the optimal concentration for achieving highly structured and stable TiO2 materials.
Figure 2 shows the dependence of the morphology of TiO2 nanostructures on the synthesis temperature obtained in a solution containing 5 M NaOH.
The reaction temperatures investigated are 120 °C, 150 °C, and 180 °C. At 120 °C, the morphology shows a network of thin, interconnected structures, with a relatively fine and dense texture. The lower temperature limits the kinetics of dissolution–precipitation reactions, resulting in smaller and less developed nanostructures. The growth of well-defined fiber-shaped nanostructures is incomplete, but a noticeable porous framework begins to form. At 150 °C, the nanostructures become more developed, forming a highly interconnected and fibrous network. The morphology suggests enhanced dissolution of titanium and subsequent precipitation of titanate intermediates, which transform into TiO2. At 180 °C, the morphology changes significantly, showing larger pores and thicker, less interconnected structures. The increased temperature accelerates the reaction rates, potentially leading to excessive dissolution or coarsening of the nanostructures. This can result in the collapse of finer features observed at lower temperatures. Thus, 150 °C appears to be the optimal temperature for achieving well-structured TiO2 in this synthesis process.
Figure 3 shows the dependence of the morphology of TiO2 nanostructures obtained in a solution containing 5 M NaOH on the synthesis time.
At 1 h, the surface morphology exhibits a network of partially formed nanostructures with smaller pores. After 3 h, the nanostructures become more refined and interconnected, forming a denser network with well-defined pores. This suggests that prolonged reaction time facilitates enhanced nucleation and growth of TiO2 nanostructures, promoting the evolution of a more uniform and stable morphology.
However, depending on the goals and objectives, both morphologies can be used for practical applications.
Figure 4 shows the XRD pattern of TiO2 samples obtained at different NaOH concentrations. The characteristic diffraction peaks at approximately 26° (101), 31° (110), 49° (202), and 63° (204) correspond to the anatase phase of TiO2, confirming its successful formation via hydrothermal synthesis.
The presence of intense metallic titanium peaks indicates that the underlying Ti substrate remains largely unreacted due to its considerable thickness. Given that the TiO2 peaks are significantly lower in intensity compared to the Ti peaks, it is evident that the nanostructured oxide layer forms as a relatively thin film. While differences in peak intensity value among different samples are minimal, certain trends can be observed. With increasing NaOH concentration, the TiO2 peaks become more pronounced and well-defined, suggesting enhanced crystallinity and structural ordering of the synthesized nanostructures. However, in the 7 M NaOH sample, peak intensity decreases compared to the 5 M sample, indicating that at ultra-high NaOH concentrations, excessive etching and dissolution of the nanostructures occur, reducing their crystallinity. This finding confirms that 5 M NaOH represents the optimal concentration for the hydrothermal synthesis of highly crystalline and well-formed TiO2 nanostructures.
Figure 5 shows the CV measurements for TiO2 electrodes obtained by adding different concentrations of NaOH during the synthesis process.
Cyclic voltammetry measurements in PBS (0–5 mM H2O2) revealed a well-defined anodic peak of around −1.1 V for all electrodes (Figure 5a–d), which systematically decreased in intensity as H2O2 concentration increased. The decrease in peak intensity, and its near disappearance at high concentrations, can be attributed to electrode surface saturation and mass transport limitations. At lower H2O2 concentrations, oxidation occurs efficiently at active sites on the electrode, leading to a well-defined peak. However, as the concentration increases, the surface becomes saturated with H2O2 molecules, reducing the number of available active sites, slowing down electron transfer, and diminishing the current response. At very high H2O2 concentrations, excessive accumulation at the electrode-electrolyte interface results in mass transport limitations, where diffusion of fresh H2O2 molecules to the electrode surface becomes the rate-determining step. Additionally, side reactions, such as disproportionation of H2O2 into water and oxygen, further contribute to the suppression of the peak current. Unlike other metal oxides such as Co2O3, Fe3O4, and CuO, described in our previous studies [60,61,82,83], which actively catalyze the electrochemical reduction of H2O2 and exhibit stable increase in the peak current with increasing concentration of H2O2, TiO2 exhibits relatively poor electrical conductivity and slower charge transfer kinetics. In contrast to these materials, which possess redox-active sites that facilitate continuous electrochemical conversion of H2O2, TiO2 primarily reduces H2O2 through surface adsorption and electron transfer at defect sites. As the concentration increases, these sites become saturated, leading to charge transfer resistance and limiting further electron transfer. Furthermore, TiO2 strongly adsorbs hydroxyl radicals (·OH) and peroxo species, which can inhibit direct electrochemical oxidation and contribute to passivation effects.
Additionally, a shift in the anodic peak potential was observed with increasing H2O2 concentration, which can be attributed to concentration overpotential, kinetic limitations, and mass transport effects. As H2O2 concentration rises, a greater driving force is required for electron transfer, causing a shift in potential. This phenomenon results from an increased electrochemical demand at higher reactant concentrations, variations in surface adsorption, and changes in the reaction pathway due to intermediate species formation. Additionally, local pH changes near the electrode interface may further contribute to the observed shift, affecting the energy required for redox processes.
The calibration plots derived from CV measurements (Figure 5e) illustrate the relationship between current response and H2O2 concentration for TiO2 nanostructured electrodes synthesized in 1 M, 3 M, 5 M, and 7 M NaOH. All dependencies exhibit a linear trend, confirming the reliable and predictable electrochemical behavior of the electrodes. The electrode prepared in 5 M NaOH exhibited the highest sensitivity, as indicated by its steepest slope (2.9 mA·mM−1), confirming its superior electrocatalytic activity. The 7 M-derived electrode showed comparable performance at lower concentrations (2.2 mA·mM−1) but deviated at higher H2O2 levels, suggesting structural degradation impacting electron transfer. The 3 M electrode demonstrated moderate sensitivity (2.4 mA·mM−1), while the 1 M-derived electrode exhibited the lowest response (1.8 mA·mM−1), confirming that insufficient NaOH concentration during synthesis limits the formation of active sites. The linear response range extended up to 5 mM for all samples, with the 5 M electrode maintaining the most stable and reproducible signals. These results indicate that controlled NaOH concentration is critical in optimizing TiO2 nanostructures for efficient H2O2 detection, with 5 M NaOH yielding the best performance.
Figure 6 presents the CV responses of TiO2 nanostructured electrodes, highlighting the influence of synthesis temperature (Figure 6a) and synthesis time (Figure 6b) on their electrochemical behavior. In both cases, the five consecutive CV cycles almost entirely overlap, indicating excellent electrode stability and minimal degradation over repeated potential sweeps.
In Figure 6a, the CV curves illustrate the impact of synthesis temperature on the electrochemical activity of the TiO2 electrodes. The electrode synthesized at 150 °C exhibits the highest current response, suggesting an optimal balance between crystallinity and defect-mediated charge transfer. At 120 °C, the lower current values likely stem from insufficient crystallization, which may hinder electron transport. Conversely, at 180 °C, a slight decrease in current may result from excessive sintering, which could reduce the number of electrochemically active sites.
Figure 6b illustrates the effect of synthesis time, comparing electrodes prepared for 1 h and 3 h. The electrode synthesized for 3 h exhibits a higher current response, suggesting that prolonged synthesis enhances surface activation, increasing the density of electrochemically active sites. However, both electrodes demonstrate stable performance across multiple CV cycles, reinforcing the reproducibility and durability of the TiO2 nanostructures. Figure 6c presents the CV response of the TiO2 nanostructured electrode in its as-synthesized state and after reuse. The nearly identical CV profiles for both conditions indicate that the electrode maintains its electrochemical activity even after multiple uses. This suggests that the TiO2 electrode exhibits excellent durability, with no significant loss in peak current or shift in redox potential, which is crucial for long-term applications.
Figure 6d presents the cyclic voltammograms of the TiO2-modified electrode in 0.1 M NaOH (pH = 13) with successive additions of H2O2 ranging from 50 µM to 1 mM. In contrast to measurements performed in phosphate-buffered saline at pH = 7.4 (Figure 5a–d), where the anodic current increases clearly with higher H2O2 concentrations, the response in alkaline medium shows almost no change across the tested range. This observation indicates a dramatic decrease in the electrode’s sensitivity toward H2O2 in alkaline conditions.
The reduced sensitivity can be attributed to several interconnected factors. In strongly alkaline media, the TiO2 surface undergoes significant deprotonation, resulting in a negatively charged surface that repels negatively charged species such as hydroperoxide anions (HO2), the predominant form of H2O2 under these conditions. This electrostatic repulsion limits the interaction of H2O2 with the electrode surface and hinders efficient electron transfer. Additionally, the shift in TiO2′s conduction band edge in high-pH environments may render the catalytic oxidation of H2O2 thermodynamically and kinetically less favorable. The surface of TiO2 in alkaline conditions may also become passivated by adsorbed hydroxide species, further suppressing redox activity. These factors collectively result in minimal variation in current response despite increasing H2O2 concentration, suggesting that alkaline conditions significantly impair the electrocatalytic performance of TiO2. In contrast, the measurements in PBS demonstrate a pronounced and concentration-dependent signal, confirming that neutral conditions are more suitable for the electrochemical detection of H2O2 using TiO2 -based electrodes, making them highly suitable for use with biological samples without pre-treatment.
Figure 6e shows the CV curves recorded at various scan rates (25 to 150 mV·s−1) for the TiO2 -modified electrode in the presence of 100 µM H2O2. As the scan rate increases from 25 to 150 mV·s−1, a clear enhancement in anodic peak currents is observed, indicating a scan rate-dependent electrochemical response. The anodic peak current increases linearly with the square root of the scan rate (Figure 6f, black square), suggesting that the H2O2 electro-oxidation process on the TiO2 -modified electrode is primarily diffusion-controlled. However, at scan rates above 100 mV/s, the current response begins to level off and the voltammograms for 125 mV·s−1 and 150 mV·s−1 nearly coincide (Figure 6f, red dot). This plateauing behavior suggests a kinetic limitation. At higher scan rates, the timescale of the potential sweep becomes shorter than the timescale required for diffusion of H2O2 from the bulk solution to the electrode surface. As a result, the electrochemical process transitions from being diffusion-controlled to being limited by charge transfer kinetics or by surface reaction rates. Additionally, the overlap of voltammograms at higher scan speeds may indicate that the surface-active sites of the TiO2 are saturated or that the redox process is confined to a thin diffusion layer near the electrode. These findings suggest that for optimal sensitivity and resolution in H2O2 detection using TiO2-based electrodes, a moderate scan rate (around 75–100 mV·s−1) is preferable, as it provides a balance between diffusion efficiency and signal amplification.
Figure 7 shows the i-t response of nanostructured TiO2 samples to the sequential introduction of portions of H2O2 into PBS and real sample analysis.
The chronoamperometric (i–t) response of the TiO2 nanostructured electrode is recorded at a fixed potential (−1.1 V) upon successive additions of H2O2 (Figure 7a). The resulting current increases stepwise with increasing H2O2 concentration, demonstrating the electrode’s catalytic activity toward H2O2 oxidation. The calibration curve (Figure 7b) further confirms a concentration-dependent current response with two distinct linear regions. At low H2O2 concentrations (<0.5 mM, black square), the current response shows a strong linear relationship with concentration, indicating a process where sufficient active sites are available for H2O2 oxidation. The high sensitivity of the sensor in this concentration range is indicated by a higher slope compared to the slope for the higher concentration range (0.0393 mA·mM−1). The limit of detection (LOD) for this concentration range is calculated as 2.8 µM, assuming a signal-to-noise ratio of 3.
In the 0.5–5 mM concentration range (red square), the current continues to increase linearly with H2O2 concentration, but this range is characterized by a significant decrease in the slope value and therefore in the sensitivity of the sensor (0.00598 mA·mM−1, which is at least 10 times less than for the low concentration range). The LOD for this concentration range is calculated as 24 µM, assuming a signal-to-noise ratio of 3. This suggests a gradual saturation of the active sites, leading to reduced charge transfer efficiency.
Figure 7c presents chronoamperometric responses recorded during the sequential addition of H2O2 to media collected from barley grown under salt stress conditions and Fe3O4 nanoparticles. These include exposure to Fe3O4 nPs, NaCl (as a model of salinity stress), and combinations of these. The measurement provides a comparative evaluation of oxidative stress markers in growth media, reflecting the physiological state of plants under each condition. It is significant that the curve obtained for the control sample completely coincides with the graph obtained in a pure buffer with the addition of identical portions of H2O2, which indicates the accurate operation of the sensor in the conditions of an environment with a matrix of complex chemical structure. The medium from barley grown under NaCl stress alone exhibits the highest baseline current and the strongest increase upon each H2O2 addition, suggesting a significant accumulation of redox-active species and enhanced electrolyte conductivity in response to salt-induced oxidative stress. Barley grown with Fe3O4 nanoparticles alone shows a response comparable to that of the control, indicating that Fe3O4 does not affect oxidative metabolism. Notably, the presence of both Fe3O4 nanoparticles and NaCl results in lower current responses than NaCl stress alone. This suggests that Fe3O4 nanoparticles effectively mitigate the oxidative stress induced by salinity. The reduced H2O2 signal in samples from plants treated with both Fe3O4 and NaCl, as compared to NaCl alone, indicates that Fe3O4 nanoparticles may play a protective or modulating role in the plant’s stress response. This could occur through enhanced antioxidant enzyme activity (such as peroxidase or catalase), chelation of reactive oxygen species, or influencing signaling pathways that reduce excess ROS accumulation.
An interference study (Figure 7d) was carried out to assess the selectivity of the TiO2 nanostructured electrode for H2O2 detection in the presence of common interfering substances that are typically found in real plant samples. The chronoamperogram, recorded in PBS, shows a clear and pronounced increase in current following the addition of 50 µM H2O2 (denoted as 1), confirming the electrode’s sensitivity to the analyte. In contrast, the subsequent introduction of potential interferents—NaCl (2), KNO3 (3), glucose (4), citric acid (5), and ascorbic acid (6)—does not induce any significant changes in the current response, indicating negligible interference. These findings demonstrate that the TiO2 nanostructured electrode possesses high selectivity for H2O2 and is capable of maintaining accurate performance even in the presence of electroactive species, reinforcing its potential applicability in complex biological or environmental matrices.
As illustrated in Table 1, the quantification of H2O2 in real barley extract samples was performed. In the control sample, the measured H2O2 concentrations closely match the added amounts, resulting in zero or negligible excess values. Conversely, the NaCl-treated samples exhibit a substantial augmentation in the detected H2O2 levels, with excess values averaging 0.36 mM. This finding suggests that salt stress significantly increases endogenous H2O2 production due to induced oxidative stress. The addition of Fe3O4 nPs alone at a concentration of 72 mg·L−1 typically results in negative or near-zero excess values, implying a possible scavenging effect. However, when Fe3O4 nPs are combined with NaCl, a marked increase in H2O2 levels is observed, with excess values consistently exceeding the added concentrations. It is thus determined that the mean value of H2O2 detected in samples subjected to nanoparticle treatment at a concentration of 36 mg·L−1 is 0.25 mM. It is interesting to note that increasing the concentration of Fe3O4 nPs to 72 mg·L−1 in the presence of NaCl results in slightly lower average excess H2O2 values: 0.15 mM, suggesting a potential dose-dependent mitigation of oxidative stress. It is noteworthy that at higher concentrations, the addition of H2O2 during the spiking process can result in an apparent overestimation of the measured concentration, particularly when a substantial amount of endogenous H2O2 is already present in the sample. This phenomenon occurs due to the concentration of H2O2 exceeding the inflection point or transition region depicted in the calibration curves, as illustrated in Figure 7b. In order to circumvent such inaccuracies, it is imperative that spiking experiments either comprise minimal additions of H2O2 or, in instances where elevated background levels are anticipated, utilize substantially larger additions to ensure that measurements fall within the linear response range of the second segment of the calibration graph.
Table 2 offers a comparative analysis of the sensor developed in this study with other sensors for H2O2 detection that operates in neutral conditions reported in the literature.
The TiO2 nanowire-based sensor developed in this study demonstrates promising electrochemical performance for hydrogen peroxide detection under neutral pH conditions. When compared with other sensors reported in the literature that operate in similar neutral pH environments, this sensor exhibits a competitive LOD, comparable to or lower than many conventional electrodes and within a range that is suitable for detecting physiologically and environmentally relevant concentrations of H2O2. While some nanocomposite- or noble metal-based systems display higher sensitivities or broader linear ranges, they often involve more complex fabrication procedures and high-cost components. In contrast, the TiO2 nW sensor maintains a strong balance between sensitivity, reproducibility, and simplicity of design, making it highly applicable for practical uses in real sample analysis and in the development of cost-effective and reliable sensing platforms.
Figure 8 shows the results for determining the GTS.
The levels of genotoxicity and GTS are inversely proportional. Both parameters are estimated based on the number of polymorphic bands in the RAPD profiles of each group, using all three primers simultaneously. The default GTS level in the control group is set as 100%. All three primers are used to generate representative control bands and are found to be informative. Statistically significant changes (p < 0.05) compared to the control group are observed in only two experimental groups (Figure 8). The plants treated with 0.2 M NaCl solution alone show the highest number of changes: three normal bands disappear, and one new band appears. The GTS level in this group is the lowest among all experimental groups, at 69.23%, reflecting pronounced DNA damage or instability induced by salt stress—likely a result of elevated H2O2 levels, as demonstrated in the electrochemical measurements (Table 1). Treatment with Fe3O4 NPs at the highest concentration of 72 mg·L−1 results in the formation of only one new band. Interestingly, the application of Fe3O4 nanoparticles without salt stress preserves GTS at 92.31%, suggesting that the nanoparticles themselves do not exert genotoxic effects and may even play a protective role under non-stress conditions. This aligns with earlier electrochemical findings, where Fe3O4 nPs alone does not lead to excessive accumulation of H2O2. More importantly, in salt-stressed samples treated with Fe3O4 nPs, a clear mitigation of DNA damage is observed. When 0.2 M NaCl solution and Fe3O4 NPs at 72 mg·L−1 are combined, only one new band is observed and GTS is restored to 92.31%, nearly matching the control. Interestingly, both groups display the same polymorphic band. In contrast, simultaneous treatment with 0.2 M NaCl solution and Fe3O4 NPs at half the concentration (36 mg·L−1) have a greater genotoxic effect on barley seedlings. This treatment leads to the disappearance of one normal band, the appearance of one new band, and a decrease in the GTS level to 84.65%. These findings strongly correlate with electrochemical data represented in Table 1, which show reduced excess H2O2 levels in NaCl + Fe3O4 nPs conditions compared to NaCl alone. The decreased oxidative burden likely underlies the improvement in GTS, affirming the hypothesis that Fe3O4 nanoparticles contribute to oxidative stress tolerance. This dual evidence underscores the nanoparticles’ potential role as protective agents in stress physiology, enhancing plant resilience through both biochemical and genetic stability mechanisms.
This study opens up several avenues for future research and applications. Investigating the fine-tuning of TiO2 nanostructure morphology through doping, surface modification, or hybridization with other nanomaterials could enhance sensitivity, broaden the linear detection range, and enable multi-analyte detection. Integrating the sensor with wireless or microfluidic platforms may facilitate the development of in-field agricultural diagnostics or point-of-care biomedical devices. The sensor can detect endogenous H2O2 under stress conditions, positioning it as a tool for precision agriculture and enabling real-time oxidative stress monitoring in crops. In this context, using the sensor with stress-alleviating agents such as Fe3O4 nanoparticles represents an innovative approach to dynamic crop management. The sensor can also be used in molecular breeding programs, where early detection of oxidative damage and genomic instability can support the selection of stress-resilient cultivars. In biomedical diagnostics, the sensor can be used to monitor oxidative stress-related diseases. It can also be used to detect reactive oxygen species or pollutants in water and soil samples. Implementing these applications involves scaling up sensor production via cost-effective fabrication techniques, integrating the platform with digital data acquisition systems, and validating performance.

4. Conclusions

Based on the experimental findings and comparative analyses, the following conclusions can be drawn. TiO2 nanostructures were obtained using a simple, inexpensive, one-step method of direct hydrothermal synthesis on a Ti substrate. This method ensures the production of a homogeneous, ordered, durable, well-developed nanostructured coating. The study also found that the morphology of TiO2 nanostructures depends heavily on the synthesis parameters, which significantly affect the sensitivity of the electrochemical sensor. It was therefore determined that nanostructures obtained using a 5 M aqueous solution of NaOH, a synthesis temperature of 150 °C, and a time of 3 h show the highest sensitivity towards H2O2. A TiO2 nanowire-based electrochemical sensor was successfully developed and demonstrated reliable performance for hydrogen peroxide detection in neutral pH conditions. The sensor exhibited a favorable sensitivity, a linear detection range of 0–0.5 mM, and a low detection limit of 2.8 μM, placing its analytical performance within a competitive range relative to other systems reported in the literature. Chronoamperometric and cyclic voltammetry measurements confirmed the sensor’s responsiveness and stability, while interference studies indicated high selectivity toward H2O2 in the presence of common interfering substances such as NaCl, KNO3, glucose, citric acid, and ascorbic acid. Real sample analysis conducted using barley extract confirmed the sensor’s practical applicability in complex biological matrices. The sensor successfully quantified both added and endogenously produced hydrogen peroxide, with calibration data enabling accurate determination of peroxide levels in plant tissues subjected to stress conditions.
Importantly, electrochemical analysis of real samples revealed a clear impact of Fe3O4 nanoparticles on salt stress mitigation and improved salt stress tolerance in barley. It was found that the control samples and those treated with Fe3O4 alone had an almost zero endogenous H2O2 value. Samples that were subjected to salt stress but did not receive the addition of nanoparticles showed significantly higher levels of H2O2, reaching up to 0.36 mM. However, samples subjected to salt stress that also received a solution of Fe3O4 nanoparticles showed decreased H2O2 levels of 0.25 and 0.15 mM. This indicates the development of dose-dependent tolerance to oxidative stress in the presence of nanoparticles, a finding that was further supported by GTS analysis. This shows that Fe3O4 treatment significantly preserved GTS in salt-stressed plants (from 69.23% for NaCl-treated samples to 92.31% for samples treated with both NaCl and Fe3O4). The combined electrochemical and molecular results demonstrate that Fe3O4 nanoparticles not only reduce oxidative stress by lowering H2O2 levels but also promote physiological resilience at the genomic level. The developed TiO2 sensor has broad applications in precision agriculture, enabling real-time oxidative stress monitoring in crops and guiding stress-mitigating nanoparticle applications. It can also be adapted for biomedical diagnostics, environmental monitoring, and molecular breeding. Integration with Fe3O4 nanoparticles allows for dynamic stress management in agricultural systems, while its use in genomic stability analysis supports the breeding of stress-tolerant crops. The sensor’s simple fabrication and adaptability make it valuable for both research and agriculture, offering significant translational potential across multiple fields.

Author Contributions

Conceptualization, V.G., I.M. and M.K.; methodology, M.K. and I.M.; formal analysis, J.K. and I.M.; investigation, I.M., M.K., E.S., I.P., M.J. and A.M.; visualization, E.S.; writing—original draft preparation M.K. and E.S.; writing—review and editing: I.M., J.K., I.P., V.M. and A.M.; supervision: V.G. and I.K., resources: I.M. and I.K. All authors have read and agreed to the published version of the manuscript.

Funding

This research received no external funding.

Institutional Review Board Statement

Not applicable.

Informed Consent Statement

Not applicable.

Data Availability Statement

Data are contained within the article.

Conflicts of Interest

The authors declare no conflicts of interest.

References

  1. Panda, S.K.; Gupta, D.; Patel, M.; Vyver, C.V.D.; Koyama, H. Functionality of Reactive Oxygen Species (ROS) in Plants: Toxicity and Control in Poaceae Crops Exposed to Abiotic Stress. Plants 2024, 13, 2071. [Google Scholar] [CrossRef] [PubMed]
  2. Su, J.; Liu, Y.; Han, F.; Gao, F.; Gan, F.; Huang, K.; Li, Z. ROS, an Important Plant Growth Regulator in Root Growth and Development: Functional Genes and Mechanism. Biology 2024, 13, 1033. [Google Scholar] [CrossRef]
  3. Guo, W.; Xing, Y.; Luo, X.; Li, F.; Ren, M.; Liang, Y. Reactive Oxygen Species: A Crosslink between Plant and Human Eukaryotic Cell Systems. Int. J. Mol. Sci. 2023, 24, 13052. [Google Scholar] [CrossRef] [PubMed]
  4. Bardaweel, S.K.; Gul, M.; Alzweiri, M.; Ishaqat, A.; ALSalamat, H.A.; Bashatwah, R.M. Reactive Oxygen Species: The Dual Role in Physiological and Pathological Conditions of the Human Body. Eurasian J. Med. 2018, 50, 193–201. [Google Scholar] [CrossRef] [PubMed]
  5. Hasanuzzaman, M.; Bhuyan, M.H.M.B.; Zulfiqar, F.; Raza, A.; Mohsin, S.M.; Mahmud, J.A.; Fujita, M.; Fotopoulos, V. Reactive Oxygen Species and Antioxidant Defense in Plants under Abiotic Stress: Revisiting the Crucial Role of a Universal Defense Regulator. Antioxidants 2020, 9, 681. [Google Scholar] [CrossRef]
  6. Yoshikawa, T.; You, F. Oxidative Stress and Bio-Regulation. Int. J. Mol. Sci. 2024, 25, 3360. [Google Scholar] [CrossRef]
  7. Chaki, M.; Begara-Morales, J.C.; Barroso, J.B. Oxidative Stress in Plants. Antioxidants 2020, 9, 481. [Google Scholar] [CrossRef]
  8. He, Q.; Feng, W.; Chen, X.; Xu, Y.; Zhou, J.; Li, J.; Xu, P.; Tang, Y. H2O2-Induced Oxidative Stress Responses in Eriocheir sinensis: Antioxidant Defense and Immune Gene Expression Dynamics. Antioxidants 2024, 13, 524. [Google Scholar] [CrossRef]
  9. Zhong, Y.; Ma, T.; Fu, Z.; Chen, A.; Yu, J.; Huang, Y.; Fu, J. Effects of Hydrogen Peroxide-Induced Oxidative Stress on Intestinal Morphology, Redox Status, and Related Molecules in Squabs. Animals 2023, 13, 749. [Google Scholar] [CrossRef]
  10. Rahman, M.; Asaeda, T.; Fukahori, K.; Imamura, F.; Nohara, A.; Matsubayashi, M. Hydrogen Peroxide Measurement Can Be Used to Monitor Plant Oxidative Stress Rapidly Using Modified Ferrous Oxidation Xylenol Orange and Titanium Sulfate Assay Correlation. Int. J. Plant Biol. 2023, 14, 546–557. [Google Scholar] [CrossRef]
  11. Ransy, C.; Vaz, C.; Lombès, A.; Bouillaud, F. Use of H2O2 to Cause Oxidative Stress, the Catalase Issue. Int. J. Mol. Sci. 2020, 21, 9149. [Google Scholar] [CrossRef] [PubMed]
  12. de França, V.C.P.L.A.; Campos, W.F.; Dobbss, L.B. Dynamics of Salt Stress in Plants: Effects and Plant Responses. Curr. Opin. J. Res. Rev. 2023, 4, 000593. [Google Scholar]
  13. Balasubramaniam, T.; Shen, G.; Esmaeili, N.; Zhang, H. Plants’ Response Mechanisms to Salinity Stress. Plants 2023, 12, 2253. [Google Scholar] [CrossRef] [PubMed]
  14. Bhat, M.A.; Jamshieed, S.; Mujib, A.; Azooz, M.M.; Mahmooduzzafar; Aslam, J.; Ahmad, P. Plant Tissue Culture: A Useful Measure for the Screening of Salt Tolerance in Plants. In Salt Stress in Plants; Ahmad, P., Azooz, M.M., Prasad, M.N.V., Eds.; Springer: New York, NY, USA, 2013; pp. 465–495. [Google Scholar] [CrossRef]
  15. Liu, C.; Jiang, X.; Yuan, Z. Plant Responses and Adaptations to Salt Stress: A Review. Horticulturae 2024, 10, 1221. [Google Scholar] [CrossRef]
  16. Ahanger, M.A.; Tomar, N.S.; Tittal, M.; Argal, S.; Agarwal, R.M. Plant growth under water/salt stress: ROS production; antioxidants and significance of added potassium under such conditions. Physiol. Mol. Biol. Plants 2017, 23, 731–744. [Google Scholar] [CrossRef]
  17. Kesawat, M.S.; Satheesh, N.; Kherawat, B.S.; Kumar, A.; Kim, H.-U.; Chung, S.-M.; Kumar, M. Regulation of Reactive Oxygen Species during Salt Stress in Plants and Their Crosstalk with Other Signaling Molecules—Current Perspectives and Future Directions. Plants 2023, 12, 864. [Google Scholar] [CrossRef]
  18. Akyol, T.Y.; Yilmaz, O.; Uzilday, B.; Uzilday, R.Ö.; Turkan, İ. Plant response to salinity: An analysis of ROS formation, signaling, and antioxidant defense. Turk. J. Bot. 2020, 44, 1. [Google Scholar] [CrossRef]
  19. Atta, K.; Mondal, S.; Gorai, S.; Singh, A.P.; Kumari, A.; Ghosh, T.; Roy, A.; Hembram, S.; Gaikwad, D.J.; Mondal, S.; et al. Impacts of salinity stress on crop plants: Improving salt tolerance through genetic and molecular dissection. Front. Plant Sci. 2023, 14, 1241736. [Google Scholar] [CrossRef]
  20. Zvanarou, S.; Vágnerová, R.; Mackievic, V.; Usnich, S.; Smolich, I.; Sokolik, A.; Yu, M.; Huang, X.; Angelis, K.J.; Demidchik, V. Salt Stress Triggers Generation of Oxygen Free Radicals and DNA Damage in Moss Physcomitrella patens. Environ. Exp. Bot. 2020, 180, 104236. [Google Scholar] [CrossRef]
  21. Skorupa, M.; Szczepanek, J.; Mazur, J.; Domagalski, K.; Tretyn, A.; Tyburski, J. Salt stress and salt shock differently affect DNA methylation in salt-responsive genes in sugar beet and its wild, halophytic ancestor. PLoS ONE 2021, 16, e0251675. [Google Scholar] [CrossRef]
  22. Rajput, V.D.; Harish; Singh, R.K.; Verma, K.K.; Sharma, L.; Quiroz-Figueroa, F.R.; Meena, M.; Gour, V.S.; Minkina, T.; Sushkova, S.; et al. Recent Developments in Enzymatic Antioxidant Defence Mechanism in Plants with Special Reference to Abiotic Stress. Biology 2021, 10, 267. [Google Scholar] [CrossRef] [PubMed]
  23. Ghorbel, M.; Olayen, W.; Brini, F. Roles of Enzymatic Antioxidants in Stress Response and Signaling in Plants. In Defense-Related Enzymes in Plants; Upadhyay, S.K., Ed.; Academic Press: Cambridge, MA, USA, 2024; pp. 413–468. [Google Scholar] [CrossRef]
  24. Porwal, P.; Sonkar, S.; Singh, A.K. Plant Stress Enzymes Nanobiotechnology. In Nanobiotechnology: Mitigation of Abiotic Stress in Plants; Al-Khayri, J.M., Ansari, M.I., Singh, A.K., Eds.; Springer Nature: Cham, Switzerland, 2021; pp. 327–348. [Google Scholar] [CrossRef]
  25. Khairallah, Y.R.; Houri, T.; Osta, B.; Romanos, D.M.; Haddad, G.R. Responses of Antioxidant Enzymes to Oxidative Stress in the Floral Species Drimia Maritime. Adv. Environ. Stud. 2022, 6, 474–478. [Google Scholar] [CrossRef]
  26. Waśkiewicz, A.; Beszterda, M.; Goliński, P. Nonenzymatic Antioxidants in Plants. In Oxidative Damage to Plants: Antioxidant Networks and Signaling; Ahmad, P., Ed.; Academic Press: Cambridge, MA, USA, 2014; pp. 201–234. [Google Scholar] [CrossRef]
  27. Rudenko, N.N.; Vetoshkina, D.V.; Marenkova, T.V.; Borisova-Mubarakshina, M.M. Antioxidants of Non-Enzymatic Nature: Their Function in Higher Plant Cells and the Ways of Boosting Their Biosynthesis. Antioxidants 2023, 12, 2014. [Google Scholar] [CrossRef]
  28. Chaffai, R.; Ganesan, M.; Cherif, A. Signaling Pathways in Plant Responses to Abiotic Stress. In Plant Adaptation to Abiotic Stress: From Signaling Pathways and Microbiomes to Molecular Mechanisms; Springer: Singapore, 2024; pp. 209–247. [Google Scholar] [CrossRef]
  29. Manepalli, S.B.; Tomar, S.; Gaikwad, D.J.; Maitra, S. Abiotic stress signaling in plants and transgenic technology as a triumph: A review. J. Appl. Biol. Biotech. 2022, 10, 5–13. [Google Scholar] [CrossRef]
  30. Caesar, T. Analyzing Molecular Pathways in Plant Stress Responses: A Biochemical Perspective. J. Plant Biochem. Physiol. 2024, 12, 1000315. [Google Scholar]
  31. Zhu, J.-K. Abiotic Stress Signaling and Responses in Plants. Cell 2016, 167, 313–324. [Google Scholar] [CrossRef]
  32. Daré, R.G.; Lautenschlager, S.O.S. Nanoparticles with Antioxidant Activity. Antioxidants 2025, 14, 221. [Google Scholar] [CrossRef] [PubMed]
  33. Sachdev, S.; Ahmad, S. Role of Nanomaterials in Regulating Oxidative Stress in Plants. In Nanobiotechnology: Mitigation of Abiotic Stress in Plants; Al-Khayri, J.M., Ansari, M.I., Singh, A.K., Eds.; Springer: Cham, Switzerland, 2021; pp. 305–326. [Google Scholar] [CrossRef]
  34. Nongbet, A.; Panda, J.; Mohanta, Y.K.; Chakrabartty, I.; Shamim, M.Z.; Mohanta, T.K. Role of Nanoparticles to Protect Plants from Abiotic Stress by Scavenging Reactive Oxygen Species. In Nanotechnology for Abiotic Stress Tolerance and Management in Crop Plants; Pudake, R.N., Ravi Mani Tripathi, R.M., Gill, S.S., Eds.; Academic Press: Cambridge, MA, USA, 2024; pp. 95–114. [Google Scholar] [CrossRef]
  35. Sang, Y.; Zhang, L.; Li, Y.F.; Chen, L.Q.; Xu, J.L.; Huang, C.Z. A Visual Detection of Hydrogen Peroxide on the Basis of Fenton Reaction with Gold Nanoparticles. Anal. Chim. Acta 2010, 659, 224–228. [Google Scholar] [CrossRef]
  36. Wu, M.; Guo, X.; Cao, Y.; Yu, H.; Hu, Z.; Yang, Y.; Yao, T.; Wu, J. Cascading H2O2 Photosynthesis and Fenton Reaction for Self-Sustaining Pollutant Degradation. Chem. Eng. J. 2024, 489, 151091. [Google Scholar] [CrossRef]
  37. Xiao, J.; Guo, S.; Wang, D.; An, Q. Fenton-Like Reaction: Recent Advances and New Trends. Chem. Eur. J. 2024, 30, e202304337. [Google Scholar] [CrossRef]
  38. Konate, A.; He, X.; Zhang, Z.; Ma, Y.; Zhang, P.; Alugongo, G.M.; Rui, Y. Magnetic (Fe3O4) Nanoparticles Reduce Heavy Metals Uptake and Mitigate Their Toxicity in Wheat Seedling. Sustainability 2017, 9, 790. [Google Scholar] [CrossRef]
  39. Kicheeva, A.G.; Sushko, E.S.; Bondarenko, L.S.; Kydralieva, K.A.; Pankratov, D.A.; Tropskaya, N.S.; Dzeranov, A.A.; Dzhardimalieva, G.I.; Zarrelli, M.; Kudryasheva, N.S. Functionalized Magnetite Nanoparticles: Characterization, Bioeffects, and Role of Reactive Oxygen Species in Unicellular and Enzymatic Systems. Int. J. Mol. Sci. 2023, 24, 1133. [Google Scholar] [CrossRef] [PubMed]
  40. Gupta, N.; Singh, P.M.; Sagar, V.; Pandya, A.; Chinnappa, M.; Kumar, R.; Bahadur, A. Seed Priming with ZnO and Fe3O4 Nanoparticles Alleviate the Lead Toxicity in Basella alba L. through Reduced Lead Uptake and Regulation of ROS. Plants 2022, 11, 2227. [Google Scholar] [CrossRef]
  41. Zhou, M.; Sun, H.; Chen, S.; Yang, M.; Dong, R.; Yang, X.; Zang, L. Chemosensors for H2O2 Detection: Principles, Active Materials, and Applications. Chemosensors 2025, 13, 54. [Google Scholar] [CrossRef]
  42. Hsu, C.-C.; Lo, Y.-R.; Lin, Y.-C.; Shi, Y.-C.; Li, P.-L. A Spectrometric Method for Hydrogen Peroxide Concentration Measurement with a Reusable and Cost-Efficient Sensor. Sensors 2015, 15, 25716–25729. [Google Scholar] [CrossRef]
  43. Pouri, H.; Panta, R.; Bharathan, P.; Fang, J.; Zhang, J. Advances in Nanostructured Fluorescence Sensors for H2O2 Detection: Current Status and Future Direction. Micro 2025, 5, 15. [Google Scholar] [CrossRef]
  44. Haddad Irani-nezhad, M.; Khataee, A.; Hassanzadeh, J.; Orooji, Y. A Chemiluminescent Method for the Detection of H2O2 and Glucose Based on Intrinsic Peroxidase-Like Activity of WS2 Quantum Dots. Molecules 2019, 24, 689. [Google Scholar] [CrossRef]
  45. Sohrabi, H.; Maleki, F.; Khaaki, P.; Kadhom, M.; Kudaibergenov, N.; Khataee, A. Electrochemical-Based Sensing Platforms for Detection of Glucose and H2O2 by Porous Metal–Organic Frameworks: A Review of Status and Prospects. Biosensors 2023, 13, 347. [Google Scholar] [CrossRef]
  46. Ahmad, T.; Iqbal, A.; Halim, S.A.; Uddin, J.; Khan, A.; El Deeb, S.; Al-Harrasi, A. Recent Advances in Electrochemical Sensing of Hydrogen Peroxide (H2O2) Released from Cancer Cells. Nanomaterials 2022, 12, 1475. [Google Scholar] [CrossRef]
  47. Song, R.-M.; Li, Z.-H.; Wei, P.-J.; Zhao, X.-L.; Chen, C.; Zhu, Z.-G. Flexible Hydrogen Peroxide Sensors Based on Platinum Modified Free-Standing Reduced Graphene Oxide Paper. Appl. Sci. 2018, 8, 848. [Google Scholar] [CrossRef]
  48. Zhao, Z.; Zharnikov, M. Gold Nanoparticle-Loaded Porous Poly(ethylene glycol) Nanosheets for Electrochemical Detection of H2O2. Nanomaterials 2023, 13, 3137. [Google Scholar] [CrossRef] [PubMed]
  49. Molahalli, V.; Sharma, A.; Shetty, A.; Hegde, G. SnO2QDs Deposited on GO/PPy-Modified Glassy Carbon Electrode for Efficient Electrochemical Hydrogen Peroxide Sensor. Biosensors 2022, 12, 983. [Google Scholar] [CrossRef] [PubMed]
  50. Sobahi, N.; Imran, M.; Khan, M.E.; Mohammad, A.; Alam, M.M.; Yoon, T.; Mehedi, I.M.; Hussain, M.A.; Abdulaal, M.J.; Jiman, A.A. Electrochemical Sensing of H2O2 by Employing a Flexible Fe3O4/Graphene/Carbon Cloth as Working Electrode. Materials 2023, 16, 2770. [Google Scholar] [CrossRef]
  51. Guan, Y.; Xu, F.; Sun, L.; Luo, Y.; Cheng, R.; Zou, Y.; Liao, L.; Cao, Z. Hydrogen Peroxide Electrochemical Sensor Based on Ag/Cu Bimetallic Nanoparticles Modified on Polypyrrole. Sensors 2023, 23, 8536. [Google Scholar] [CrossRef] [PubMed]
  52. Guerrero, L.A.; Fernández, L.; González, G.; Montero-Jiménez, M.; Uribe, R.; Díaz Barrios, A.; Espinoza-Montero, P.J. Peroxide Electrochemical Sensor and Biosensor Based on Nanocomposite of TiO2 Nanoparticle/Multi-Walled Carbon Nanotube Modified Glassy Carbon Electrode. Nanomaterials 2020, 10, 64. [Google Scholar] [CrossRef] [PubMed]
  53. Zhang, Y.; Offenhäusser, A.; Mourzina, Y. A Study on the Mechanism and Properties of a Self-Powered H2O2 Electrochemical Sensor Based on a Fuel Cell Configuration with FePc and Graphene Cathode Catalyst Materials. Biosensors 2024, 14, 290. [Google Scholar] [CrossRef]
  54. Wang, S.; Zhang, T.; Zhu, X.; Zu, S.; Xie, Z.; Lu, X.; Zhang, M.; Song, L.; Jin, Y. Metal–Organic Frameworks for Electrocatalytic Sensing of Hydrogen Peroxide. Molecules 2022, 27, 4571. [Google Scholar] [CrossRef]
  55. Trujillo, R.M.; Barraza, D.E.; Zamora, M.L.; Cattani-Scholz, A.; Madrid, R.E. Nanostructures in Hydrogen Peroxide Sensing. Sensors 2021, 21, 2204. [Google Scholar] [CrossRef]
  56. Antonacci, A.; Arduini, F.; Moscone, D.; Palleschi, G.; Scognamiglio, V. Nanostructured (Bio)sensors for smart agriculture. Trends Anal. Chem. 2018, 98, 95–103. [Google Scholar] [CrossRef]
  57. Keles, G.; Sifa Ataman, E.; Taskin, S.B.; Polatoglu, İ.; Kurbanoglu, S. Nanostructured Metal Oxide-Based Electrochemical Biosensors in Medical Diagnosis. Biosensors 2024, 14, 238. [Google Scholar] [CrossRef]
  58. Sledevskis, E.; Krasovska, M.; Gerbreders, V.; Mihailova, I.; Keviss, J.; Mizers, V.; Bulanovs, A. Impact of ZnO Nanostructure Morphology on Electrochemical Sensing Performance for Lead Ion Detection in Real Water Samples. Chemosensors 2025, 13, 62. [Google Scholar] [CrossRef]
  59. Frías Márquez, D.M.; Méndez González, J.Á.; López González, R.; García Mendoza, C.; Tzompantzi Morales, F.J.; Quintana Owen, P.; Alvarez Lemus, M.A. Titanium Dioxide 1D Nanostructures as Photocatalysts for Degradation and Removal of Pollutants in Water. Catalysts 2024, 14, 896. [Google Scholar] [CrossRef]
  60. Gerbreders, V.; Krasovska, M.; Sledevskis, E.; Mihailova, I.; Mizers, V.; Keviss, J.; Bulanovs, A. Enhancing Salt Stress Tolerance in Rye with ZnO Nanoparticles: Detecting H2O2 as a Stress Biomarker by Nanostructured NiO Electrochemical Sensor. Crystals 2024, 14, 423. [Google Scholar] [CrossRef]
  61. Gerbreders, V.; Krasovska, M.; Sledevskis, E.; Mihailova, I.; Mizers, V. Co3O4 Nanostructured Sensor for Electrochemical Detection of H2O2 as a Stress Biomarker in Barley: Fe3O4 Nanoparticles-Mediated Enhancement of Salt Stress Tolerance. Micromachines 2024, 15, 311. [Google Scholar] [CrossRef]
  62. Mizers, V.; Gerbreders, V.; Krasovska, M.; Sledevskis, E.; Mihailova, I.; Ogurcovs, A.; Bulanovs, A.; Gerbreders, A. Non-Enzymatic Co3O4 Nanostucture-based Electrochemical Sensor for H2O2 Detection. Latv. J. Phys. Tech. Sci. 2023, 60, 63–84. [Google Scholar] [CrossRef]
  63. Bertel, L.; Miranda, D.A.; García-Martín, J.M. Nanostructured Titanium Dioxide Surfaces for Electrochemical Biosensing. Sensors 2021, 21, 6167. [Google Scholar] [CrossRef]
  64. Saeed, A.A.; Abbas, M.N.; El-Hawary, W.F.; Issa, Y.M.; Singh, B. A Core–Shell Au@TiO2 and Multi-Walled Carbon Nanotube-Based Sensor for the Electroanalytical Determination of H2O2 in Human Blood Serum and Saliva. Biosensors 2022, 12, 778. [Google Scholar] [CrossRef] [PubMed]
  65. de Oliveira, R.H.; Gonçalves, D.A.; dos Reis, D.D. TiO2/MWCNT/Nafion-Modified Glassy Carbon Electrode as a Sensitive Voltammetric Sensor for the Determination of Hydrogen Peroxide. Sensors 2023, 23, 7732. [Google Scholar] [CrossRef]
  66. Mhadhbi, M.; Abderazzak, H.; Avar, B. Synthesis and Properties of Titanium Dioxide Nanoparticles. In Updates on Titanium Dioxide; Bejaoui, B., Ed.; IntechOpen: London, UK, 2023. [Google Scholar] [CrossRef]
  67. Sekino, T. Synthesis and Applications of Titanium Oxide Nanotubes. In Inorganic and Metallic Nanotubular Materials; Kijima, T., Ed.; Springer: Berlin/Heidelberg, Germany, 2010; pp. 17–32. [Google Scholar] [CrossRef]
  68. López Zavala, M.Á.; Lozano Morales, S.A.; Ávila-Santos, M. Synthesis of Stable TiO2 Nanotubes: Effect of Hydrothermal Treatment, Acid Washing and Annealing Temperature. Heliyon 2017, 3, e00456. [Google Scholar] [CrossRef]
  69. Roy, P.; Berger, S.; Schmuki, P. TiO2 Nanotubes: Synthesis and Applications. Angew. Chem. Int. Ed. 2011, 50, 2904–2939. [Google Scholar] [CrossRef]
  70. Hasanah, E.U.; Kustiningsih, I.; Slamet, S.; Baig, M.A.A. Recent Development and Application of TiO2 Nanotubes Photocatalytic Activity for Degradation Synthetic Dyes—A Review. J. Rekayasa Kimia Lingkungan 2021, 16, 52–67. [Google Scholar] [CrossRef]
  71. Wahyuni, S.; Kartini, I.; Kadarwati, S. The Properties and Activity of TiO2-Based Nanorods as an Anti-Fouling Agent and a Photocatalyst. Bull. Chem. React. Eng. Catal. 2024, 19, 47–60. [Google Scholar] [CrossRef]
  72. Hosseini, S.N.; Chen, X.; Baesjou, P.J.; Imhof, A.; van Blaaderen, A. Synthesis and Characterization of Anatase TiO2 Nanorods: Insights from Nanorods’ Formation and Self-Assembly. Appl. Sci. 2022, 12, 1614. [Google Scholar] [CrossRef]
  73. Suryana, R.; Sehati; Kusumandari, K. Synthesis of Nanorods Titanium Dioxide via Anodic Alumina Membrane Template and Their Applications in Dye-Sensitized Solar Cells. J. Phys. Conf. Ser. 2016, 739, 012108. [Google Scholar] [CrossRef]
  74. Chi, B.; Victorio, E.S.; Jin, T. Synthesis of TiO2-Based Nanotube on Ti Substrate by Hydrothermal Treatment. J. Nanosci. Nanotechnol. 2007, 7, 668–672. [Google Scholar] [CrossRef] [PubMed]
  75. Abdullah, M.; Kamarudin, S.K. Influence of Highly Concentrated Sodium Hydroxide (NaOH) Towards Formation of Highly Ordered TiO2 Nanotubes (TNT) Structure. Malays. J. Anal. Sci. 2016, 20, 1405–1412. [Google Scholar] [CrossRef]
  76. Victoria Dimas, B.; Hernández Pérez, I.; Garibay Febles, V.; Díaz Barriga Arceo, L.; Suárez Parra, R.; Rivera Olvera, J.N.; Luna Paz, R.; Melo Máximo, D.V.; González Reyes, L. Atomic-Scale Investigation on the Evolution of Tio2-Anatase Prepared by a Sonochemical Route and Treated with NaOH. Materials 2020, 13, 685. [Google Scholar] [CrossRef]
  77. Pattanayak, D.K.; Yamaguchi, S.; Matsushita, T.; Kokubo, T. Nanostructured Positively Charged Bioactive TiO2 Layer Formed on Ti Metal by NaOH, Acid and Heat Treatments. J. Mater. Sci. Mater. Med. 2011, 22, 1803–1812. [Google Scholar] [CrossRef]
  78. Kokina, I.; Plaksenkova, I.; Galek, R.; Jermaļonoka, M.; Kirilova, E.; Gerbreders, V.; Krasovska, M.; Sledevskis, E. Genotoxic Evaluation of Fe3O4 Nanoparticles in Different Three Barley (Hordeum vulgare L.) Genotypes to Explore the Stress-Resistant Molecules. Molecules 2021, 26, 6710. [Google Scholar] [CrossRef]
  79. Atienzar, F.A.; Conradi, M.; Evenden, A.J.; Jha, A.N.; Depledge, M.H. Qualitative assessment of genotoxicity using random amplified polymorphic DNA: Comparison of genomic template stability with key fitness parameters in Daphnia magna exposed to benzo[a]pyrene. Environ. Toxicol. Chem. 1999, 18, 2275–2282. [Google Scholar] [CrossRef]
  80. Ozyigit, I.I.; Arda, L.; Yalcin, B.; Yalcin, I.E.; Ucar, B.; Hocaoglu-Ozyigit, A. Lemna minor, a hyperaccumulator shows elevated levels of Cd accumulation and genomic template stability in binary application of Cd and Ni: A physiological and genetic approach. Int. J. Phytoremediat. 2021, 23, 1255–1269. [Google Scholar] [CrossRef]
  81. Silprasit, K.; Ngamniyom, A.; Kerksakul, P.; Thumajitsakul, S. Using Morphology and Genomic Template Stability (GTS) to Track Herbicide Effect on Some Submersed Aquatic Plants. Appl. Environ. Res. 2016, 38, 75–85. [Google Scholar] [CrossRef]
  82. Mihailova, I.; Gerbreders, V.; Krasovska, M.; Sledevskis, E.; Mizers, V.; Keviss, J.; Bulanovs, A.; Ogurcovs, A. A Non-Enzymatic Electrochemical Hydrogen Peroxide Sensor Based on Copper Oxide Nanostructures. Beilstein J. Nanotechnol. 2022, 13, 424–436. [Google Scholar] [CrossRef] [PubMed]
  83. Mihailova, I.; Krasovska, M.; Sledevskis, E.; Gerbreders, V.; Mizers, V.; Ogurcovs, A. Assessment of Oxidative Stress by Detection of H2O2 in Rye Samples Using a CuO- and Co3O4-Nanostructure-Based Electrochemical Sensor. Chemosensors 2023, 11, 532. [Google Scholar] [CrossRef]
  84. Walimbe, P.D.; Kumar, R.; Shringi, A.K.; Keelson, O.; Ouma, H.A.; Yan, F. Electrochemical Detection of H2O2 Using Bi2O3/Bi2O2Se Nanocomposites. Nanomaterials 2024, 14, 1592. [Google Scholar] [CrossRef]
  85. Rusu, M.M.; Fort, C.I.; Vulpoi, A.; Barbu-Tudoran, L.; Baia, M.; Cotet, L.C.; Baia, L. Ultrasensitive Electroanalytical Detection of Pb2+ and H2O2 Using Bi and Fe—Based Nanoparticles Embedded into Porous Carbon Xerogel—The Influence of Nanocomposite Pyrolysis Temperatures. Gels 2023, 9, 868. [Google Scholar] [CrossRef]
  86. Ray, C.; Dutta, S.; Roy, A.; Sahoo, R.; Pal, T. Redox Mediated Synthesis of Hierarchical Bi2O3/MnO2 Nanoflowers: A Non-Enzymatic Hydrogen Peroxide Electrochemical Sensor. Dalton Trans. 2016, 45, 4780–4790. [Google Scholar] [CrossRef]
  87. Failla, V.; Ferlazzo, A.; Abbate, V.; Neri, G.; Saccullo, E.; Gulino, A.; Rescifina, A.; Patamia, V.; Floresta, G. THP as a sensor for the electrochemical detection of H2O2. Bioorg. Chem. 2024, 152, 107721. [Google Scholar] [CrossRef]
  88. Çelebi, M.S.; Kara, S.K. Non-enzymatic hydrogen peroxide sensor based on palladium-decorated poly(thionine) modified glassy carbon electrode. J. Chin. Chem. Soc. 2024, 71, 482–492. [Google Scholar] [CrossRef]
  89. Aparicio-Martínez, E.; Ibarra, A.; Estrada-Moreno, I.A.; Velia Osuna, V.; Rocio, B.; Dominguez, R.B. Flexible electrochemical sensor based on laser scribed Graphene/Ag nanoparticles for non-enzymatic hydrogen peroxide detection. Sens. Actuators B Chem. 2019, 301, 127101. [Google Scholar] [CrossRef]
  90. Li, P.; Chen, L.; Yao, Q.; Khan, H.U.; Chen, D.; Guo, Y. Graphene supported gold hollow sphere for real-time electrochemical detection of H2O2 released from cells. J. Electroanal. Chem. 2024, 958, 118153. [Google Scholar] [CrossRef]
Figure 1. SEM image of TiO2 nanostructures synthesized on Ti substrate in the presence of different concentrations of NaOH. The nanostructures of TiO2 were obtained in an aqueous solution of NaOH at concentrations of (a) 1 M, (b) 3 M, (c) 5 M, and (d) 7 M. The synthesis took place at a temperature of 150 °C for 3 h. Here the bottom line is a general view of the sample surface, and the top line is a more detailed view at higher magnification.
Chemosensors 13 00256 g001
Figure 2. The morphology of TiO2 nanostructures depends on the synthesis temperature: (a) 120 °C, (b) 150 °C, and (c) 180 °C. The synthesis was performed in a solution containing 5 M NaOH for 3 h.
Chemosensors 13 00256 g002
Figure 3. The morphology of TiO2 nanostructures depends on the synthesis time: (a) 1 h and (b) 3 h. The synthesis was performed in a solution containing 5 M NaOH at 150 °C.
Chemosensors 13 00256 g003
Figure 4. XRD pattern of TiO2 samples obtained at different NaOH concentrations. The concentrations of NaOH utilized in the synthesis are indicated in the legend. Furthermore, the graph illustrates the peaks obtained from the Ti substrate in grey, whilst those corresponding to the TiO2 planes are marked in black.
Chemosensors 13 00256 g004
Figure 5. CV measurements for TiO2 electrodes obtained in an aqueous solution of NaOH at concentrations ranging from 1 to 7 M (ad). All measurements were carried out in a PBS solution (pH = 7.4) with subsequent addition of H2O2 in concentrations of 0 to 5 mM at a 100 mV·s−1 scan speed. The dependence of the electrochemical response on the concentration of added H2O2 for the peak at −1.1 V (e).
Chemosensors 13 00256 g005
Figure 6. CV measurements for TiO2 electrodes obtained at different temperatures during the synthesis process (a) and synthesis time (b). All measurements were carried out in a PBS solution (pH = 7.4) with subsequent addition of H2O2 in concentrations of 0 to 5 mM at a 100 mV·s−1 scan speed. (c) CV graphs for as-synthesized and reused electrodes obtained in PBS solution (pH = 7.4) in the presence of 100 µM H2O2. (d) CV measurements for the TiO2 electrode at elevated pH values (in 0.1 M NaOH) for different H2O2 concentrations. (e) The dependence of the scan speed and (f) the dependance of square root of scan speed on electrochemical response. The measurement was carried out in the presence of 100 µM H2O2 in 0.1 M PBS.
Chemosensors 13 00256 g006
Figure 7. (a) The chronoamperometric (i–t) response of the TiO2 nanostructured electrode recorded at a fixed potential (−1.1 V) in 0.1 M PBS solution upon stepwise additions of H2O2 in the following amounts: 4 steps of 25 µM, 10 steps of 50 µM, 4 steps of 100 µM, and 8 steps of 500 µM. (b) Calibration curve obtained from the i-t graph. (c) Chronoamperograms for real samples containing barley extracts obtained by stepwise addition of 50 µM portions of H2O2. (d) Interference study with the addition of H2O2 (1) and potential interferents NaCl (2), KNO3 (3), glucose (4), citric acid (5), and ascorbic acid (6) in concentrations of 50 µM.
Chemosensors 13 00256 g007
Figure 8. Genomic template stability (GTS, %) in barley seedlings treated with 0.2 M NaCl solution and/or Fe3O4 nanoparticles (NPs) at two concentrations: 36 mg·L−1 and 72 mg·L−1.
Chemosensors 13 00256 g008
Table 1. Analysis of real barley extract samples for the presence of H2O2 as a marker of oxidative stress.
BufferControlNaCl
Added
(mM)
Found
(mM)
Excess
(mM)
Added
(mM)
Found
(mM)
Excess
(mM)
Added
(mM)
Found
(mM)
Excess
(mM)
0.020.0200.020.0200.020.340.32
0.040.0400.040.0400.040.380.34
0.060.0600.060.055−0.0050.060.40.34
0.080.0800.080.0800.080.440.36
0.100.100.100.100.100.470.37
0.150.1500.150.20.050.150.550.40
0.200.200.200.220.020.200.680.48
0.250.2500.250.2500.251.451.2
0.300.3000.300.296−0.0040.301.671.37
Fe3O4 nPs 72 mg·L−1Fe3O4 nPs 36 mg·L−1/NaClFe3O4 nPs 72 mg·L−1/NaCl
Added
(mM)
Found
(mM)
Excess
(mM)
Added
(mM)
Found
(mM)
Excess
(mM)
Added
(mM)
Found
(mM)
Excess
(mM)
0.020.008−0.0120.020.0470.190.020.070.05
0.040.050.010.040.0970.210.040.140.10
0.060.080.020.060.150.220.060.190.13
0.080.10.020.080.180.230.080.240.16
0.100.150.050.100.210.250.100.280.18
0.150.180.030.150.280.280.150.340.19
0.200.200.200.350.310.200.380.18
0.250.23−0.020.250.400.720.250.430.18
0.300.25−0.050.300.431.060.300.450.15
Table 2. Comparative analysis of electrochemical sensors for H2O2 detection in neutral pH presented in other sources.
ElectrodeSupporting Electrolyte (pH)SensitivityLinear RangeLODReference
BOSePBS (pH = 7.4)75.7 μA·μM−1·cm−20–15 μM[84]
GC/Chi-(CXBiFe-1050)PBS (pH = 7)4.55 μA·mM−150–1000 μM2.5 μM[85]
Bi2O3/MnO2(pH = 7.2)0.914 μA·μM−1·cm−20.2–290 μM0.05 μM[86]
THP/SPCEPBS (pH = 7.4)0–1000 μM0.14 μM[87]
Pd/PTH@GCEPBS (pH  =  7.5)40.0 μA·mM−10.2–7.0 mM12.3 μM[88]
LSG-AgPBS (pH = 7.4)0.1–10 mM7.9 μM[89]
rROGO-S-Au HS/GCEPBS (pH = 7.4)0.19 mA·mM−1·cm−25 μM–11.5 mM5 μM[90]
TiO2 nWPBS (pH = 7.4)0.0393 mA·mM−10–0.5 mM2.8 μMThis publication
Disclaimer/Publisher’s Note: The statements, opinions and data contained in all publications are solely those of the individual author(s) and contributor(s) and not of MDPI and/or the editor(s). MDPI and/or the editor(s) disclaim responsibility for any injury to people or property resulting from any ideas, methods, instructions or products referred to in the content.

