Author Contributions
Conceptualization, B.C., X.G., G.M., Z.Z. and Y.X.; methodology, X.G. and B.C.; validation, B.C.; formal analysis, B.C.; investigation, B.C. and Z.T.; resources, X.G. and G.M.; data curation, B.C., Z.Z. and Y.X.; writing—original draft preparation, B.C.; writing—review and editing, B.C., X.G. and Z.T.; visualization, B.C., Y.X. and Z.Z.; supervision, X.G. and G.M.; project administration, X.G. and G.M. All authors have read and agreed to the published version of the manuscript.
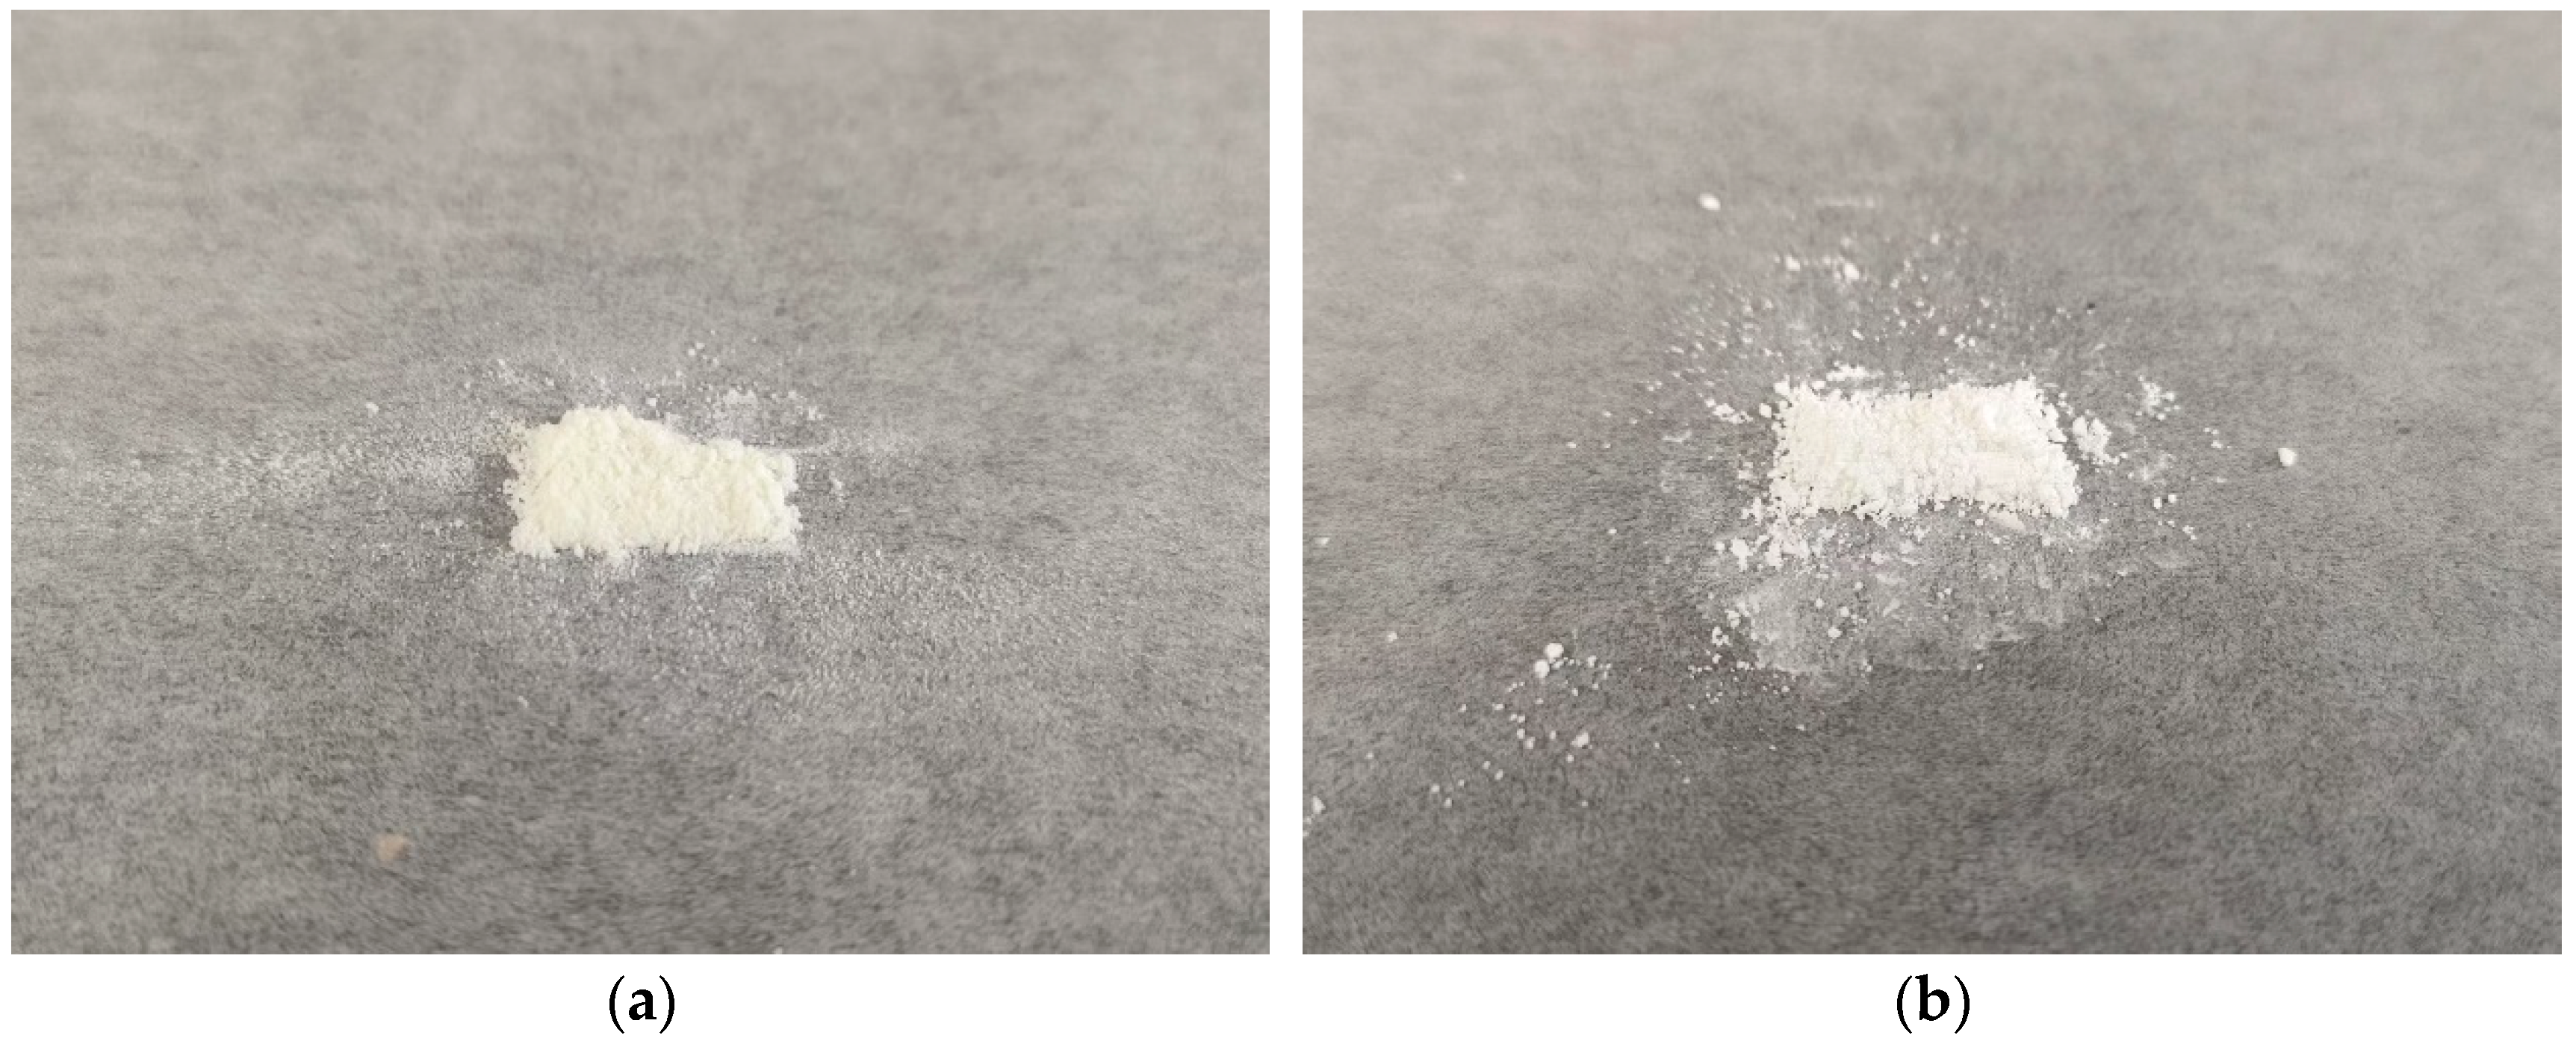
Figure 1.
Atorvastatin calcium drug substance powder. (a) Amorphous atorvastatin calcium; (b) Form I atorvastatin calcium.
Figure 1.
Atorvastatin calcium drug substance powder. (a) Amorphous atorvastatin calcium; (b) Form I atorvastatin calcium.
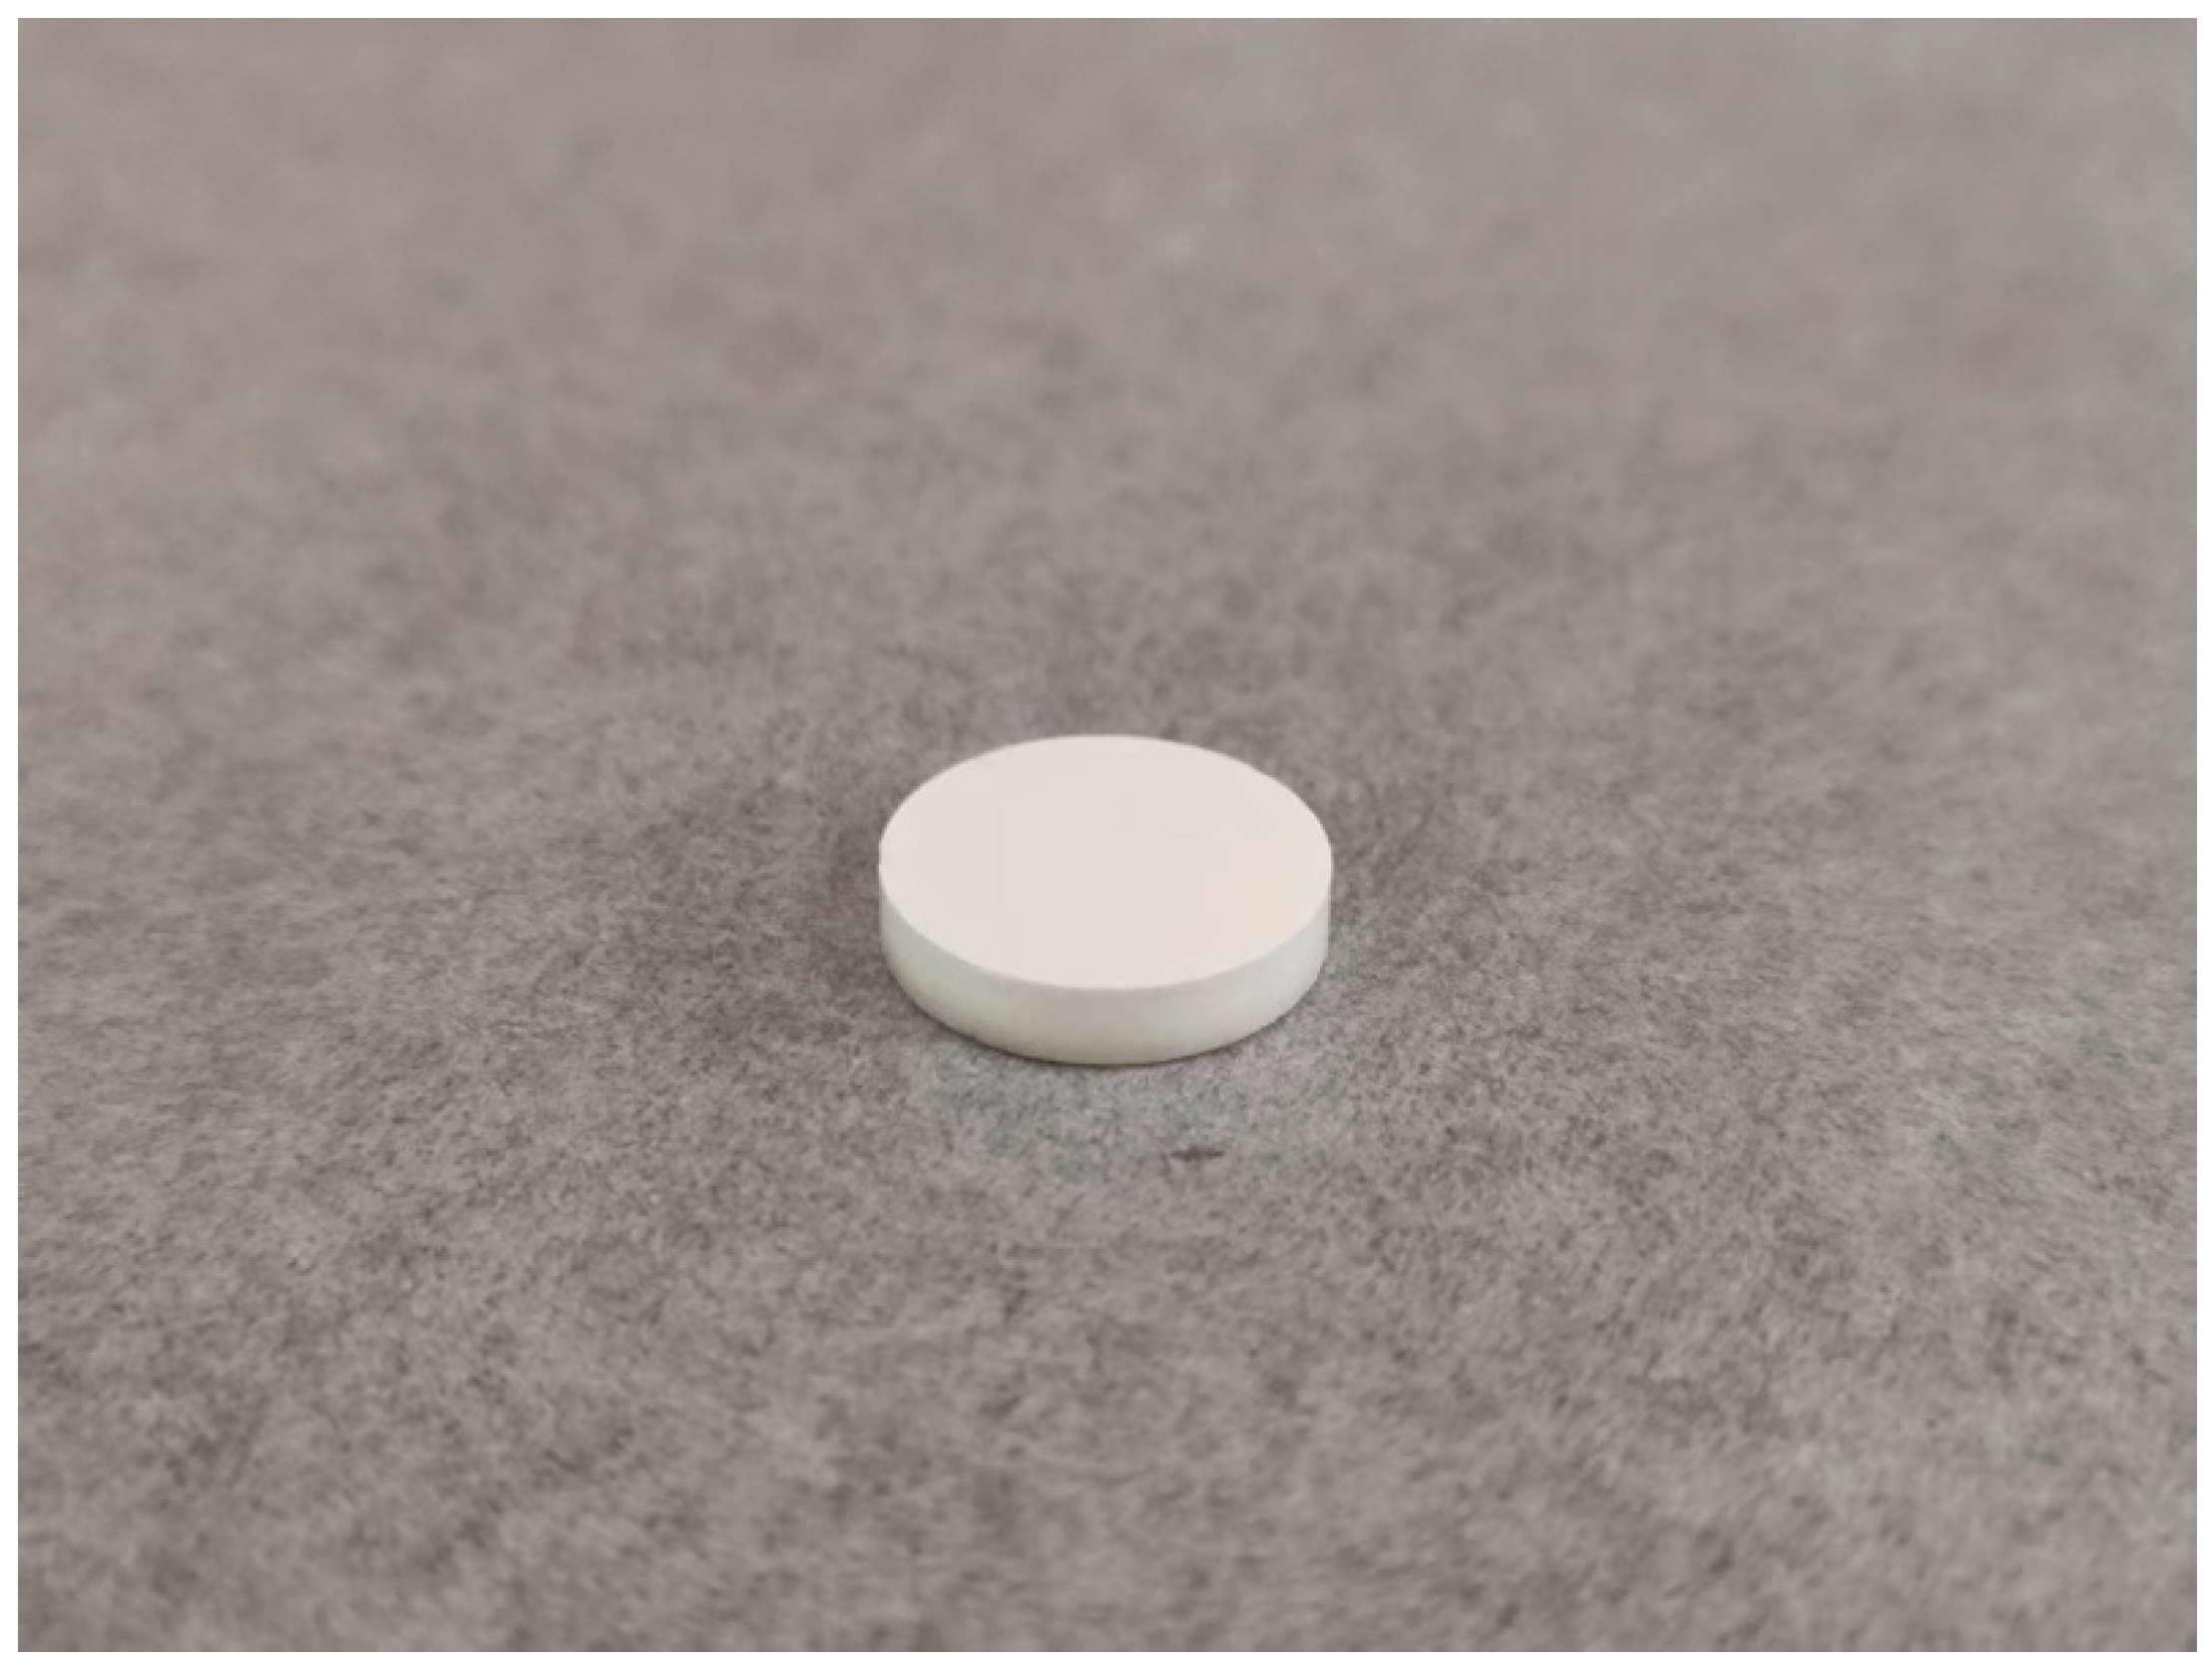
Figure 2.
A round atorvastatin calcium tablet.
Figure 2.
A round atorvastatin calcium tablet.
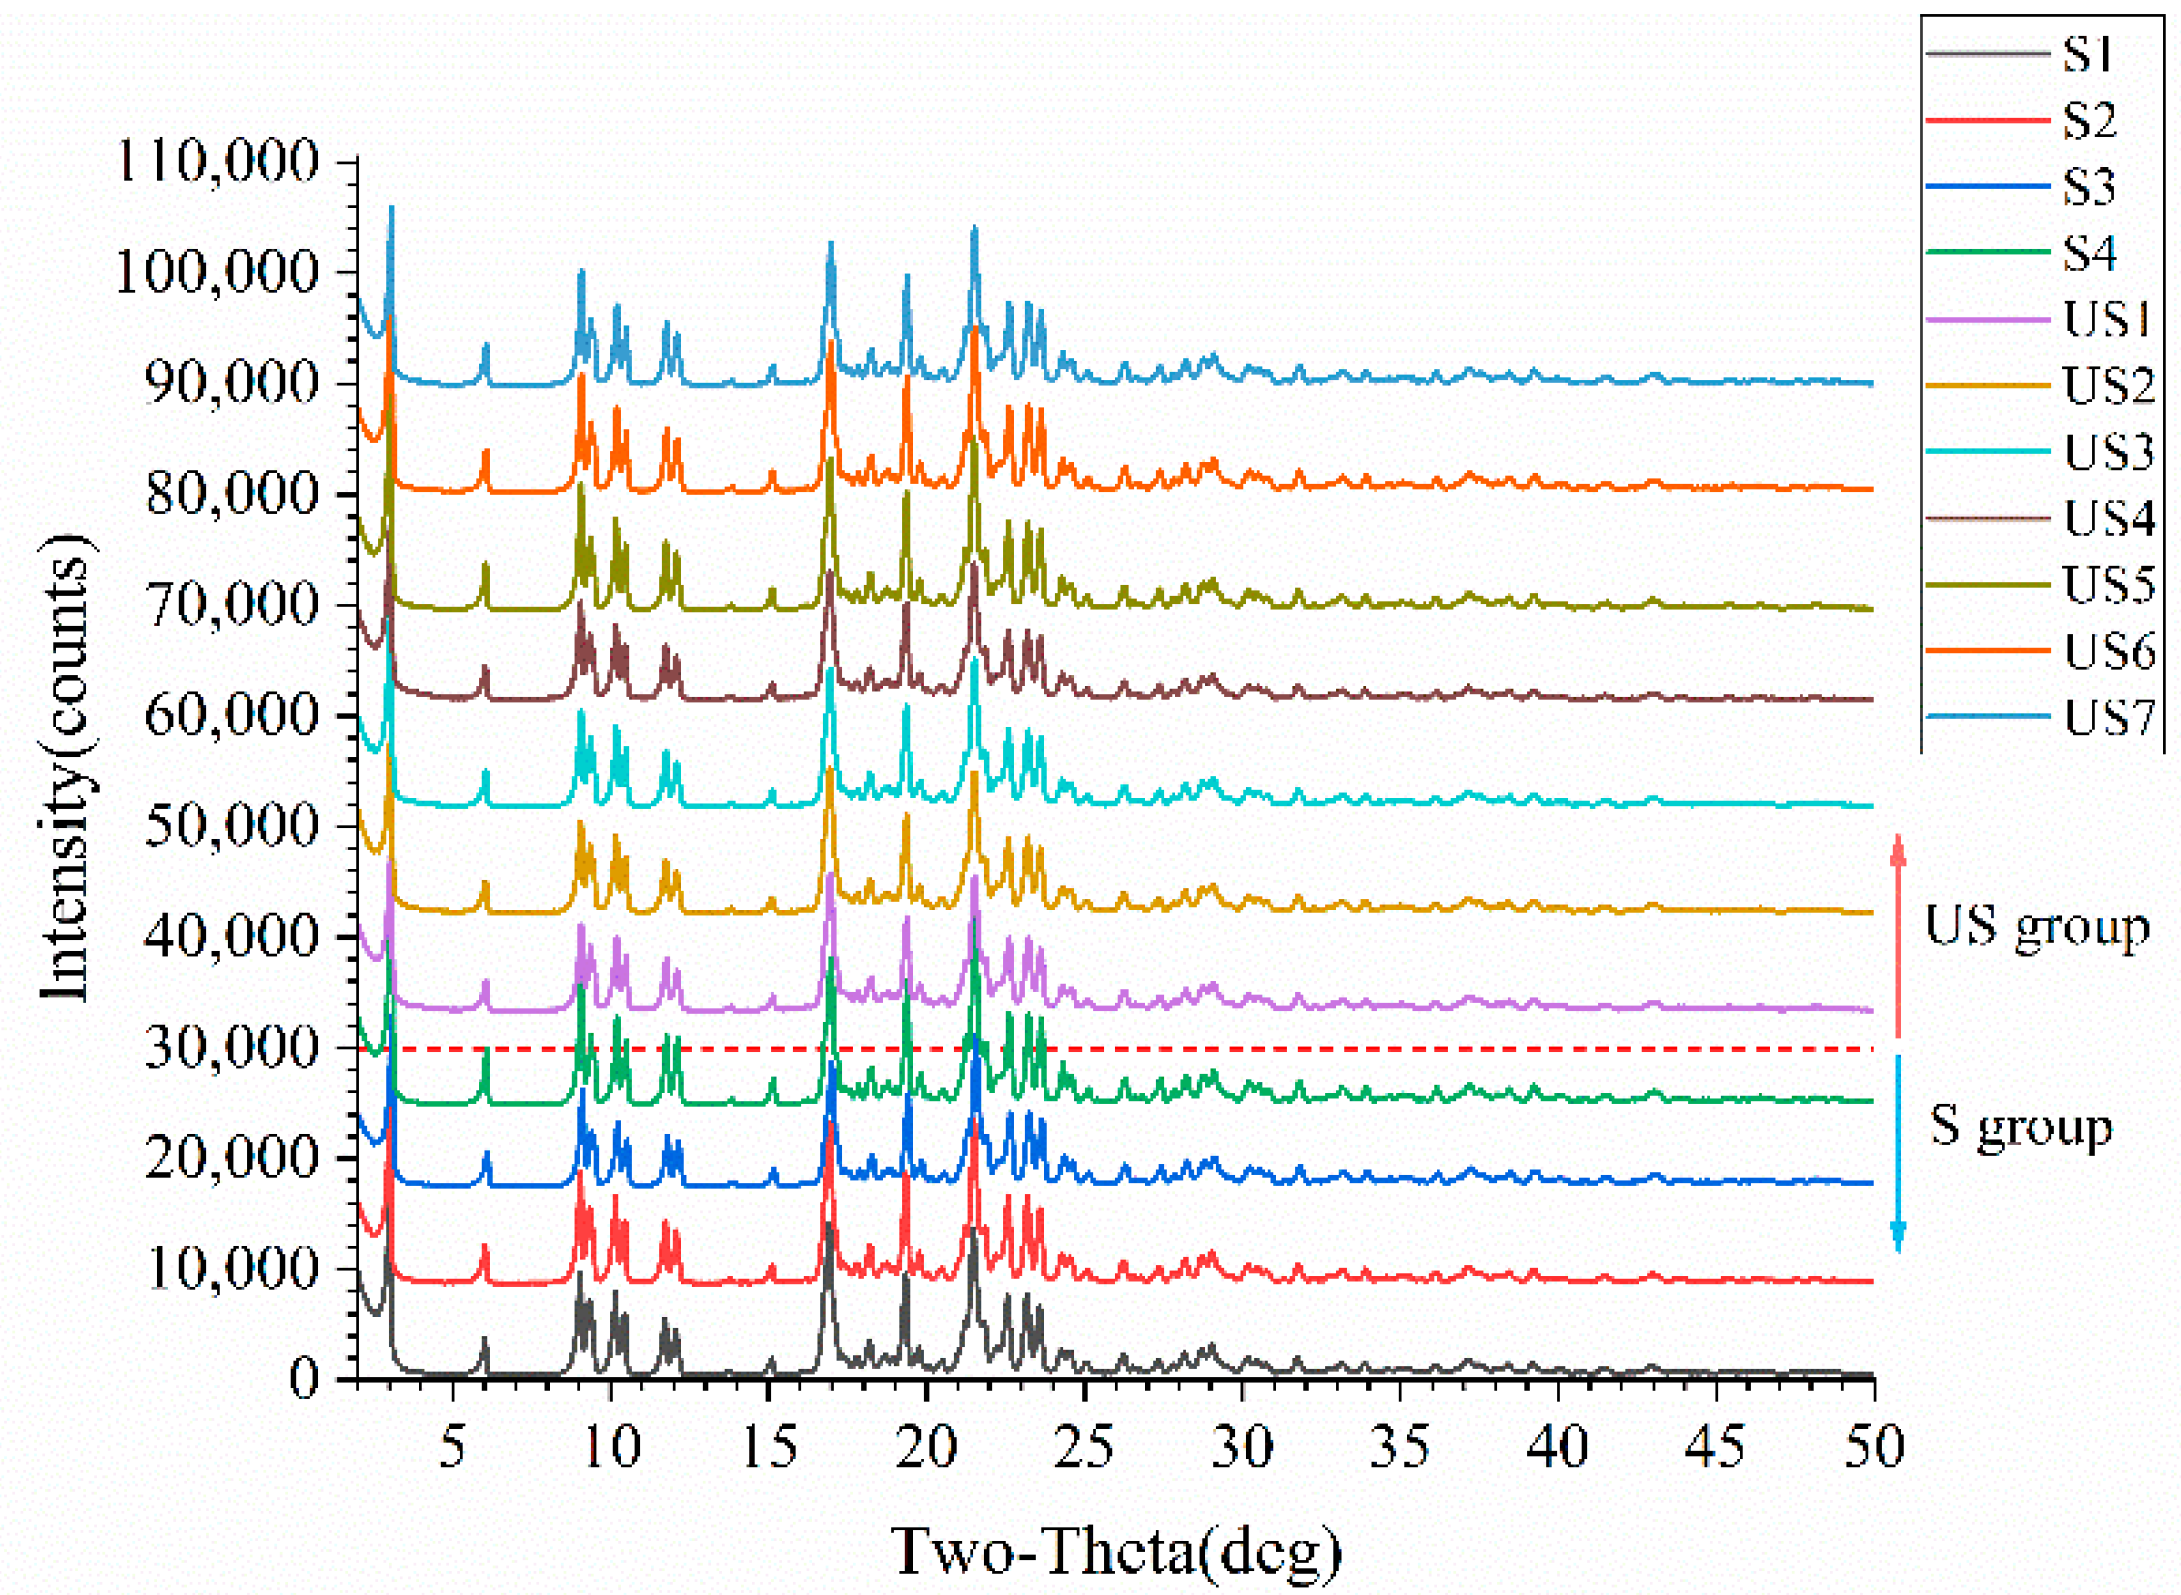
Figure 3.
PXRD patterns of stable and unstable samples. The red dashed line divides the PXRD patterns of the two sample groups, with unstable (US) group samples above the line and stable (S) group samples below.
Figure 3.
PXRD patterns of stable and unstable samples. The red dashed line divides the PXRD patterns of the two sample groups, with unstable (US) group samples above the line and stable (S) group samples below.
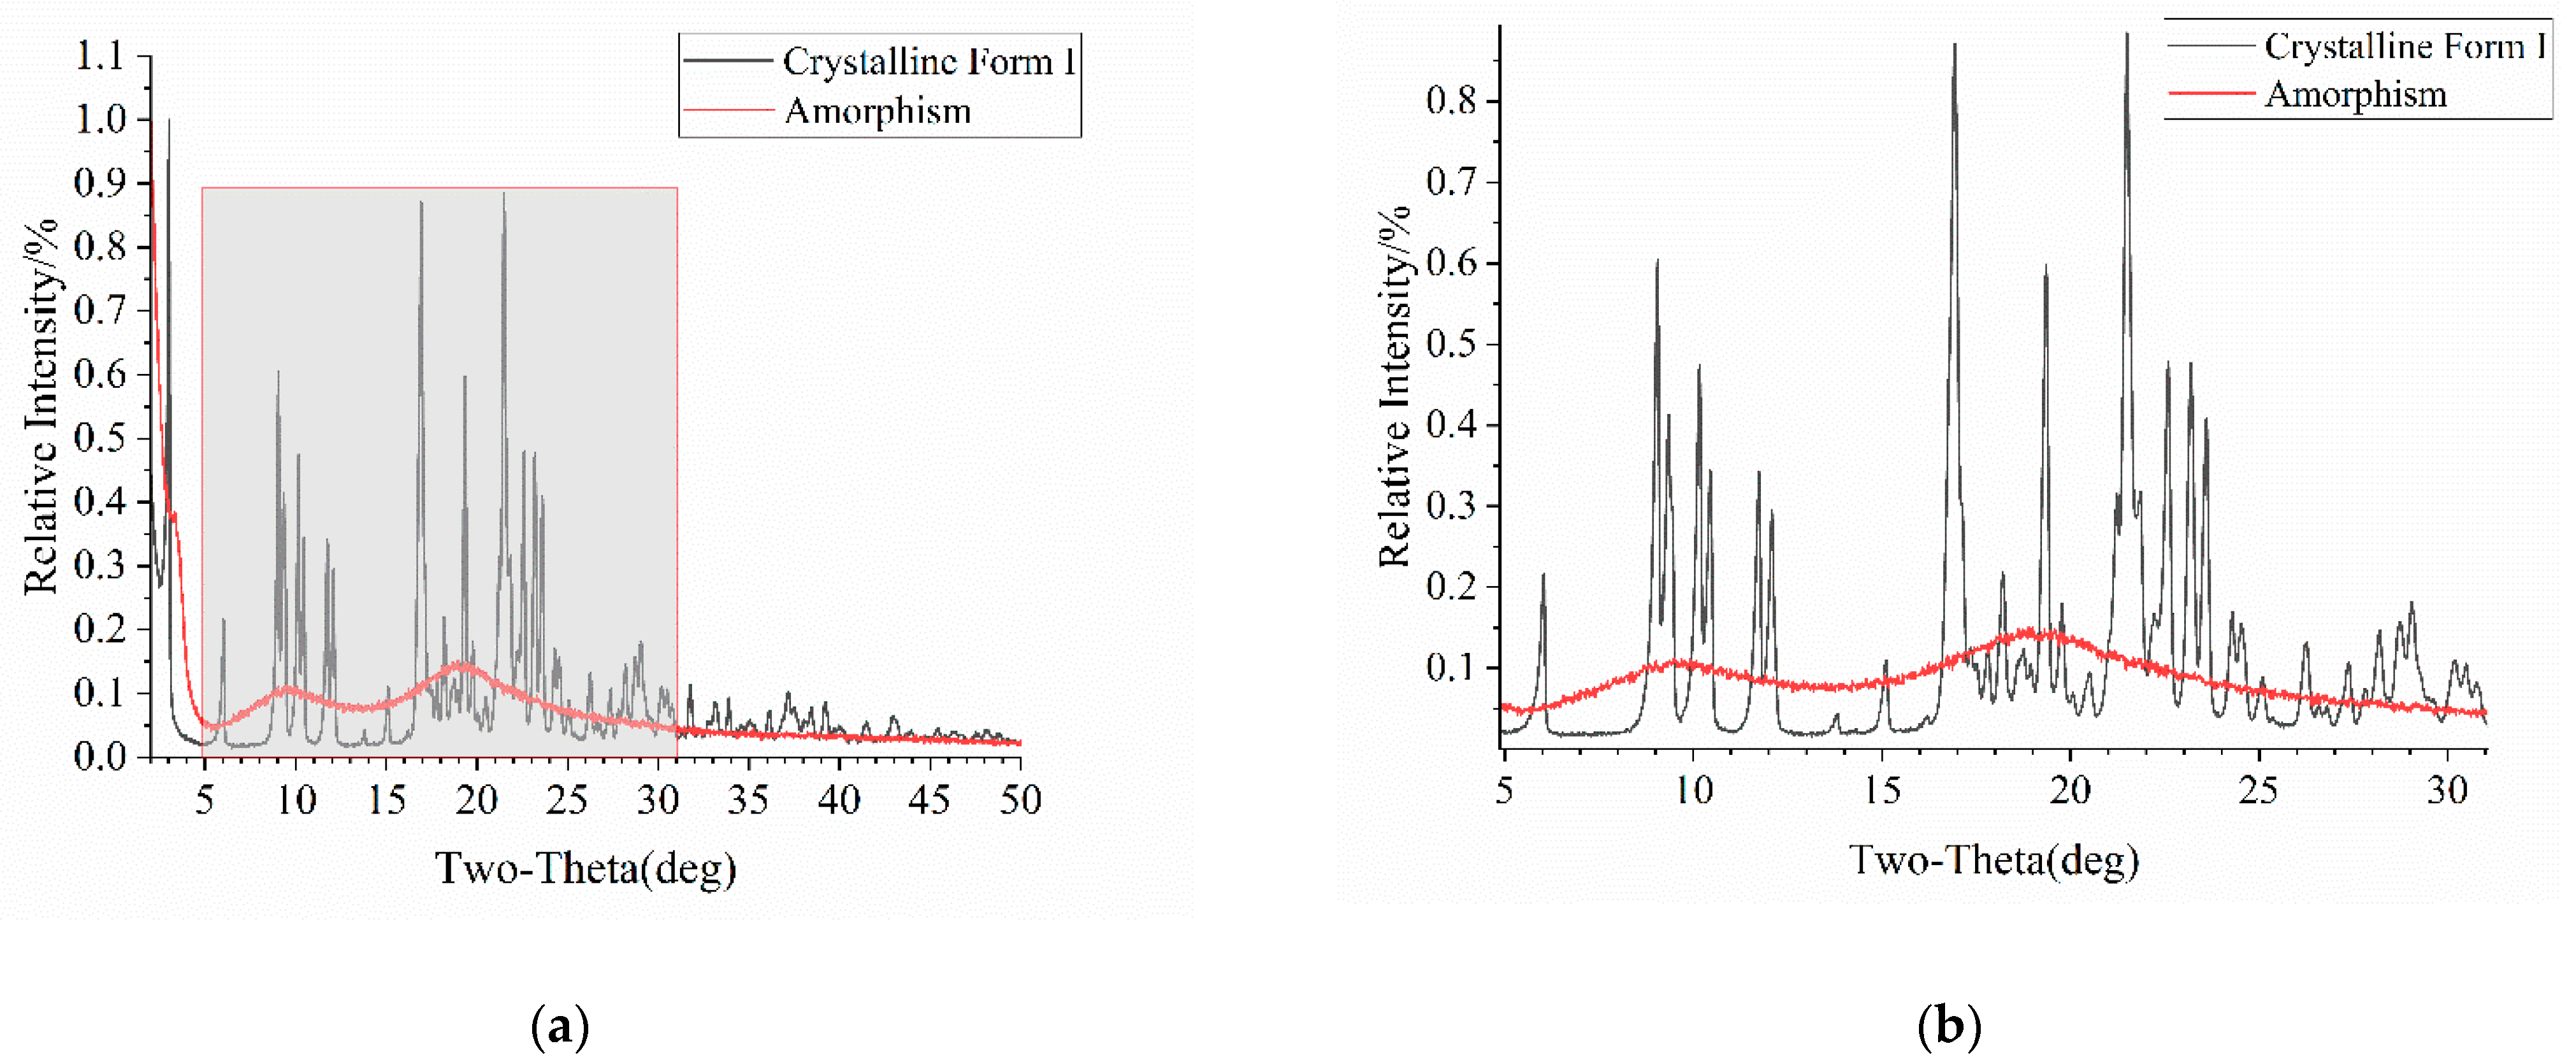
Figure 4.
PXRD patterns of Form I and amorphous atorvastatin calcium: (a) original figure with the gray area representing the enlarged portion; (b) enlarged figure.
Figure 4.
PXRD patterns of Form I and amorphous atorvastatin calcium: (a) original figure with the gray area representing the enlarged portion; (b) enlarged figure.
Figure 5.
PXRD patterns of mixed samples. PXRD patterns from bottom to top correspond to samples with increasing amorphous content of 0%, 5%, 10%, 15%, 20%, and 30%, respectively.
Figure 5.
PXRD patterns of mixed samples. PXRD patterns from bottom to top correspond to samples with increasing amorphous content of 0%, 5%, 10%, 15%, 20%, and 30%, respectively.
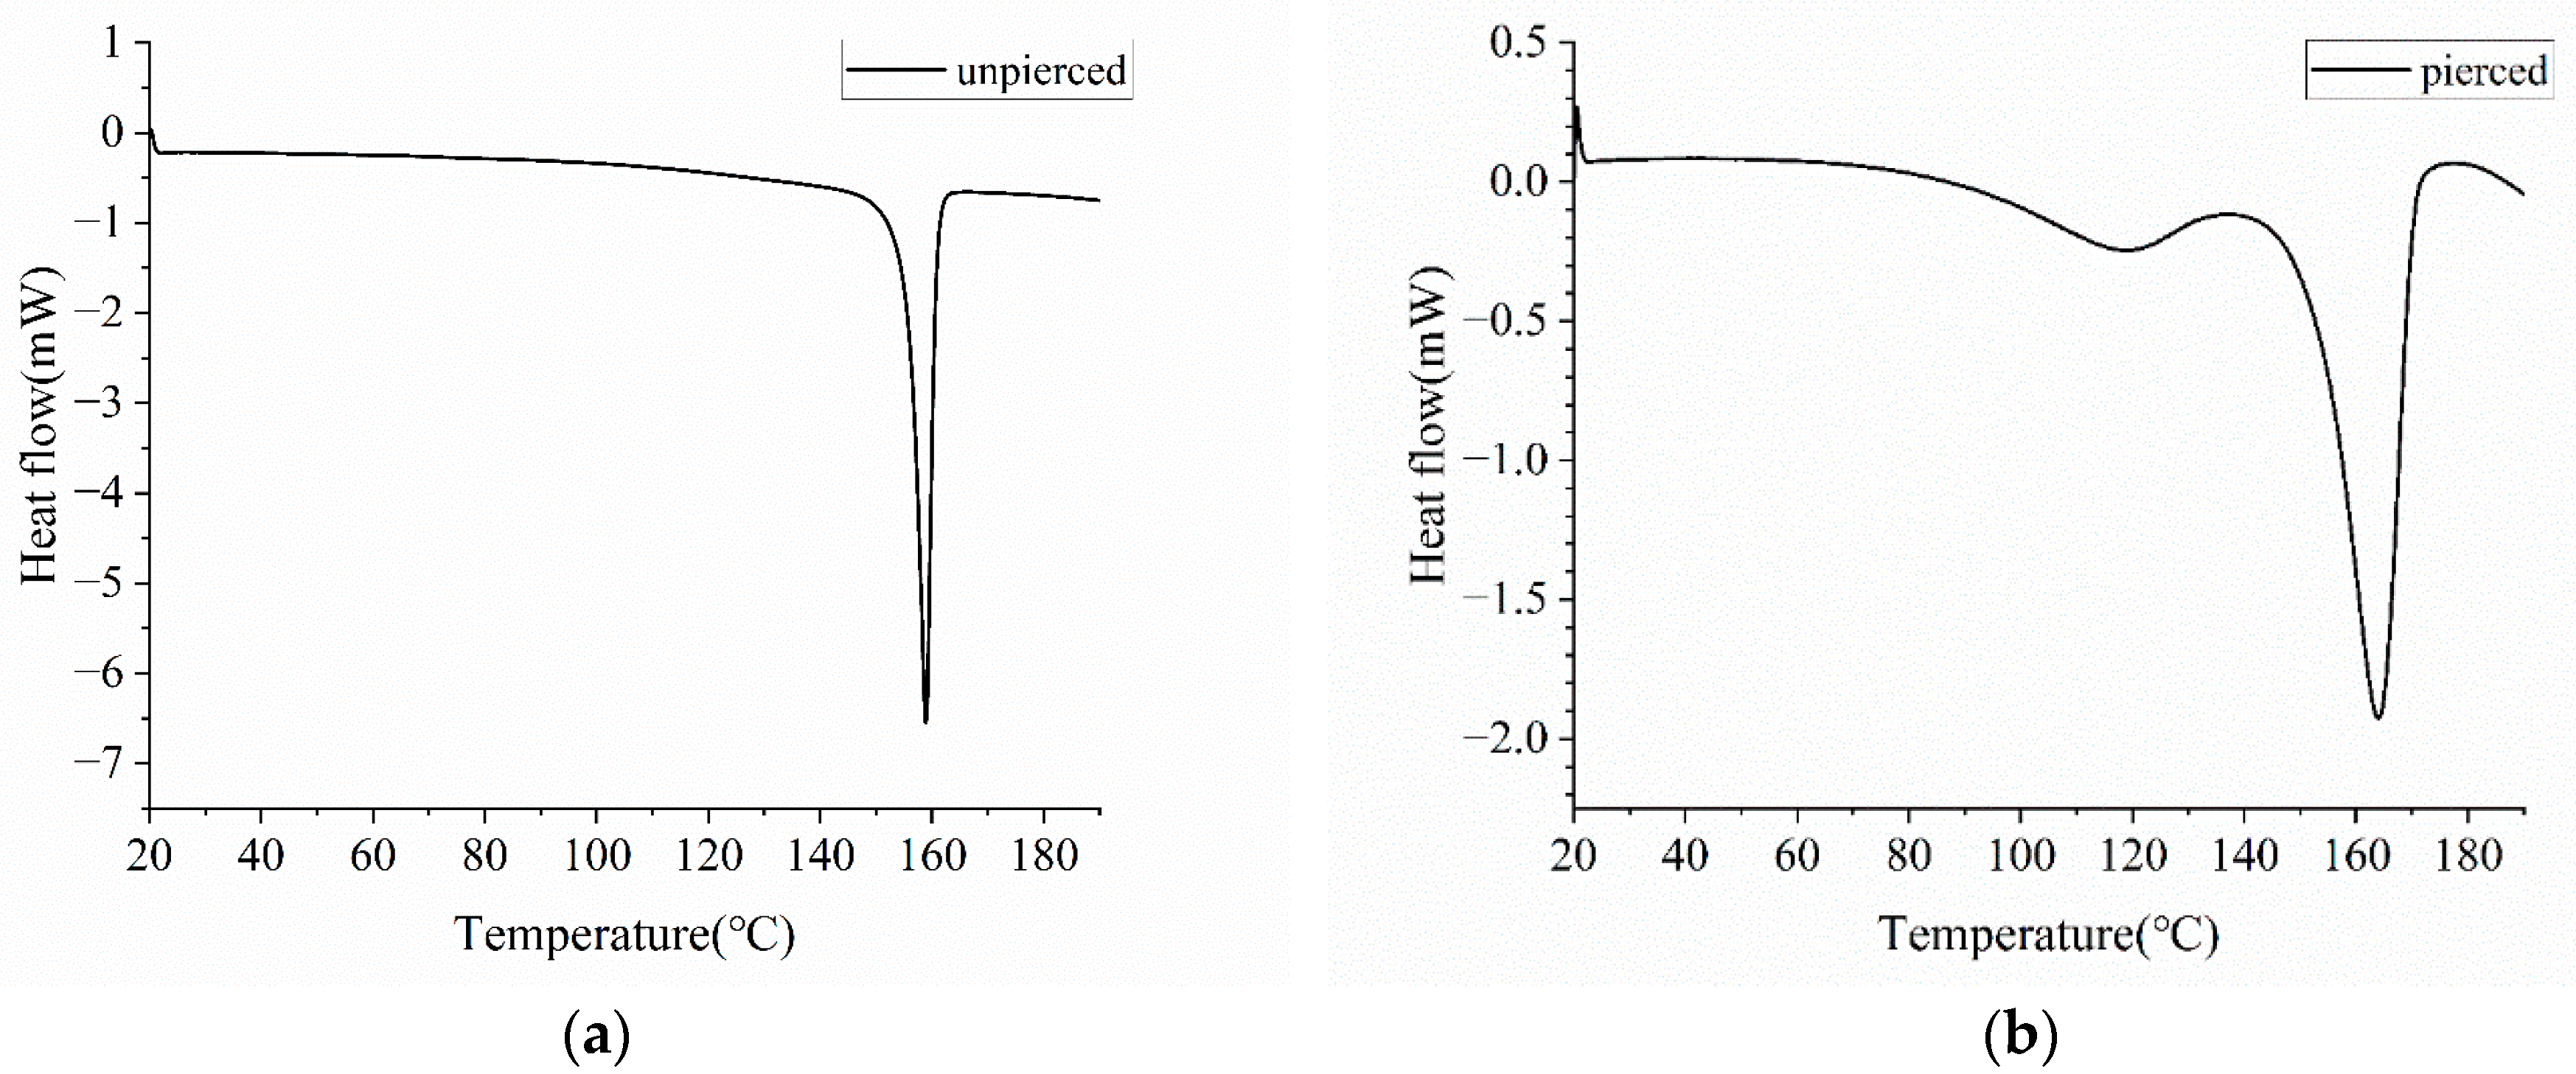
Figure 6.
DSC curves of Form I atorvastatin calcium. The crucible used for detection is (a) unpierced; (b) pierced.
Figure 6.
DSC curves of Form I atorvastatin calcium. The crucible used for detection is (a) unpierced; (b) pierced.
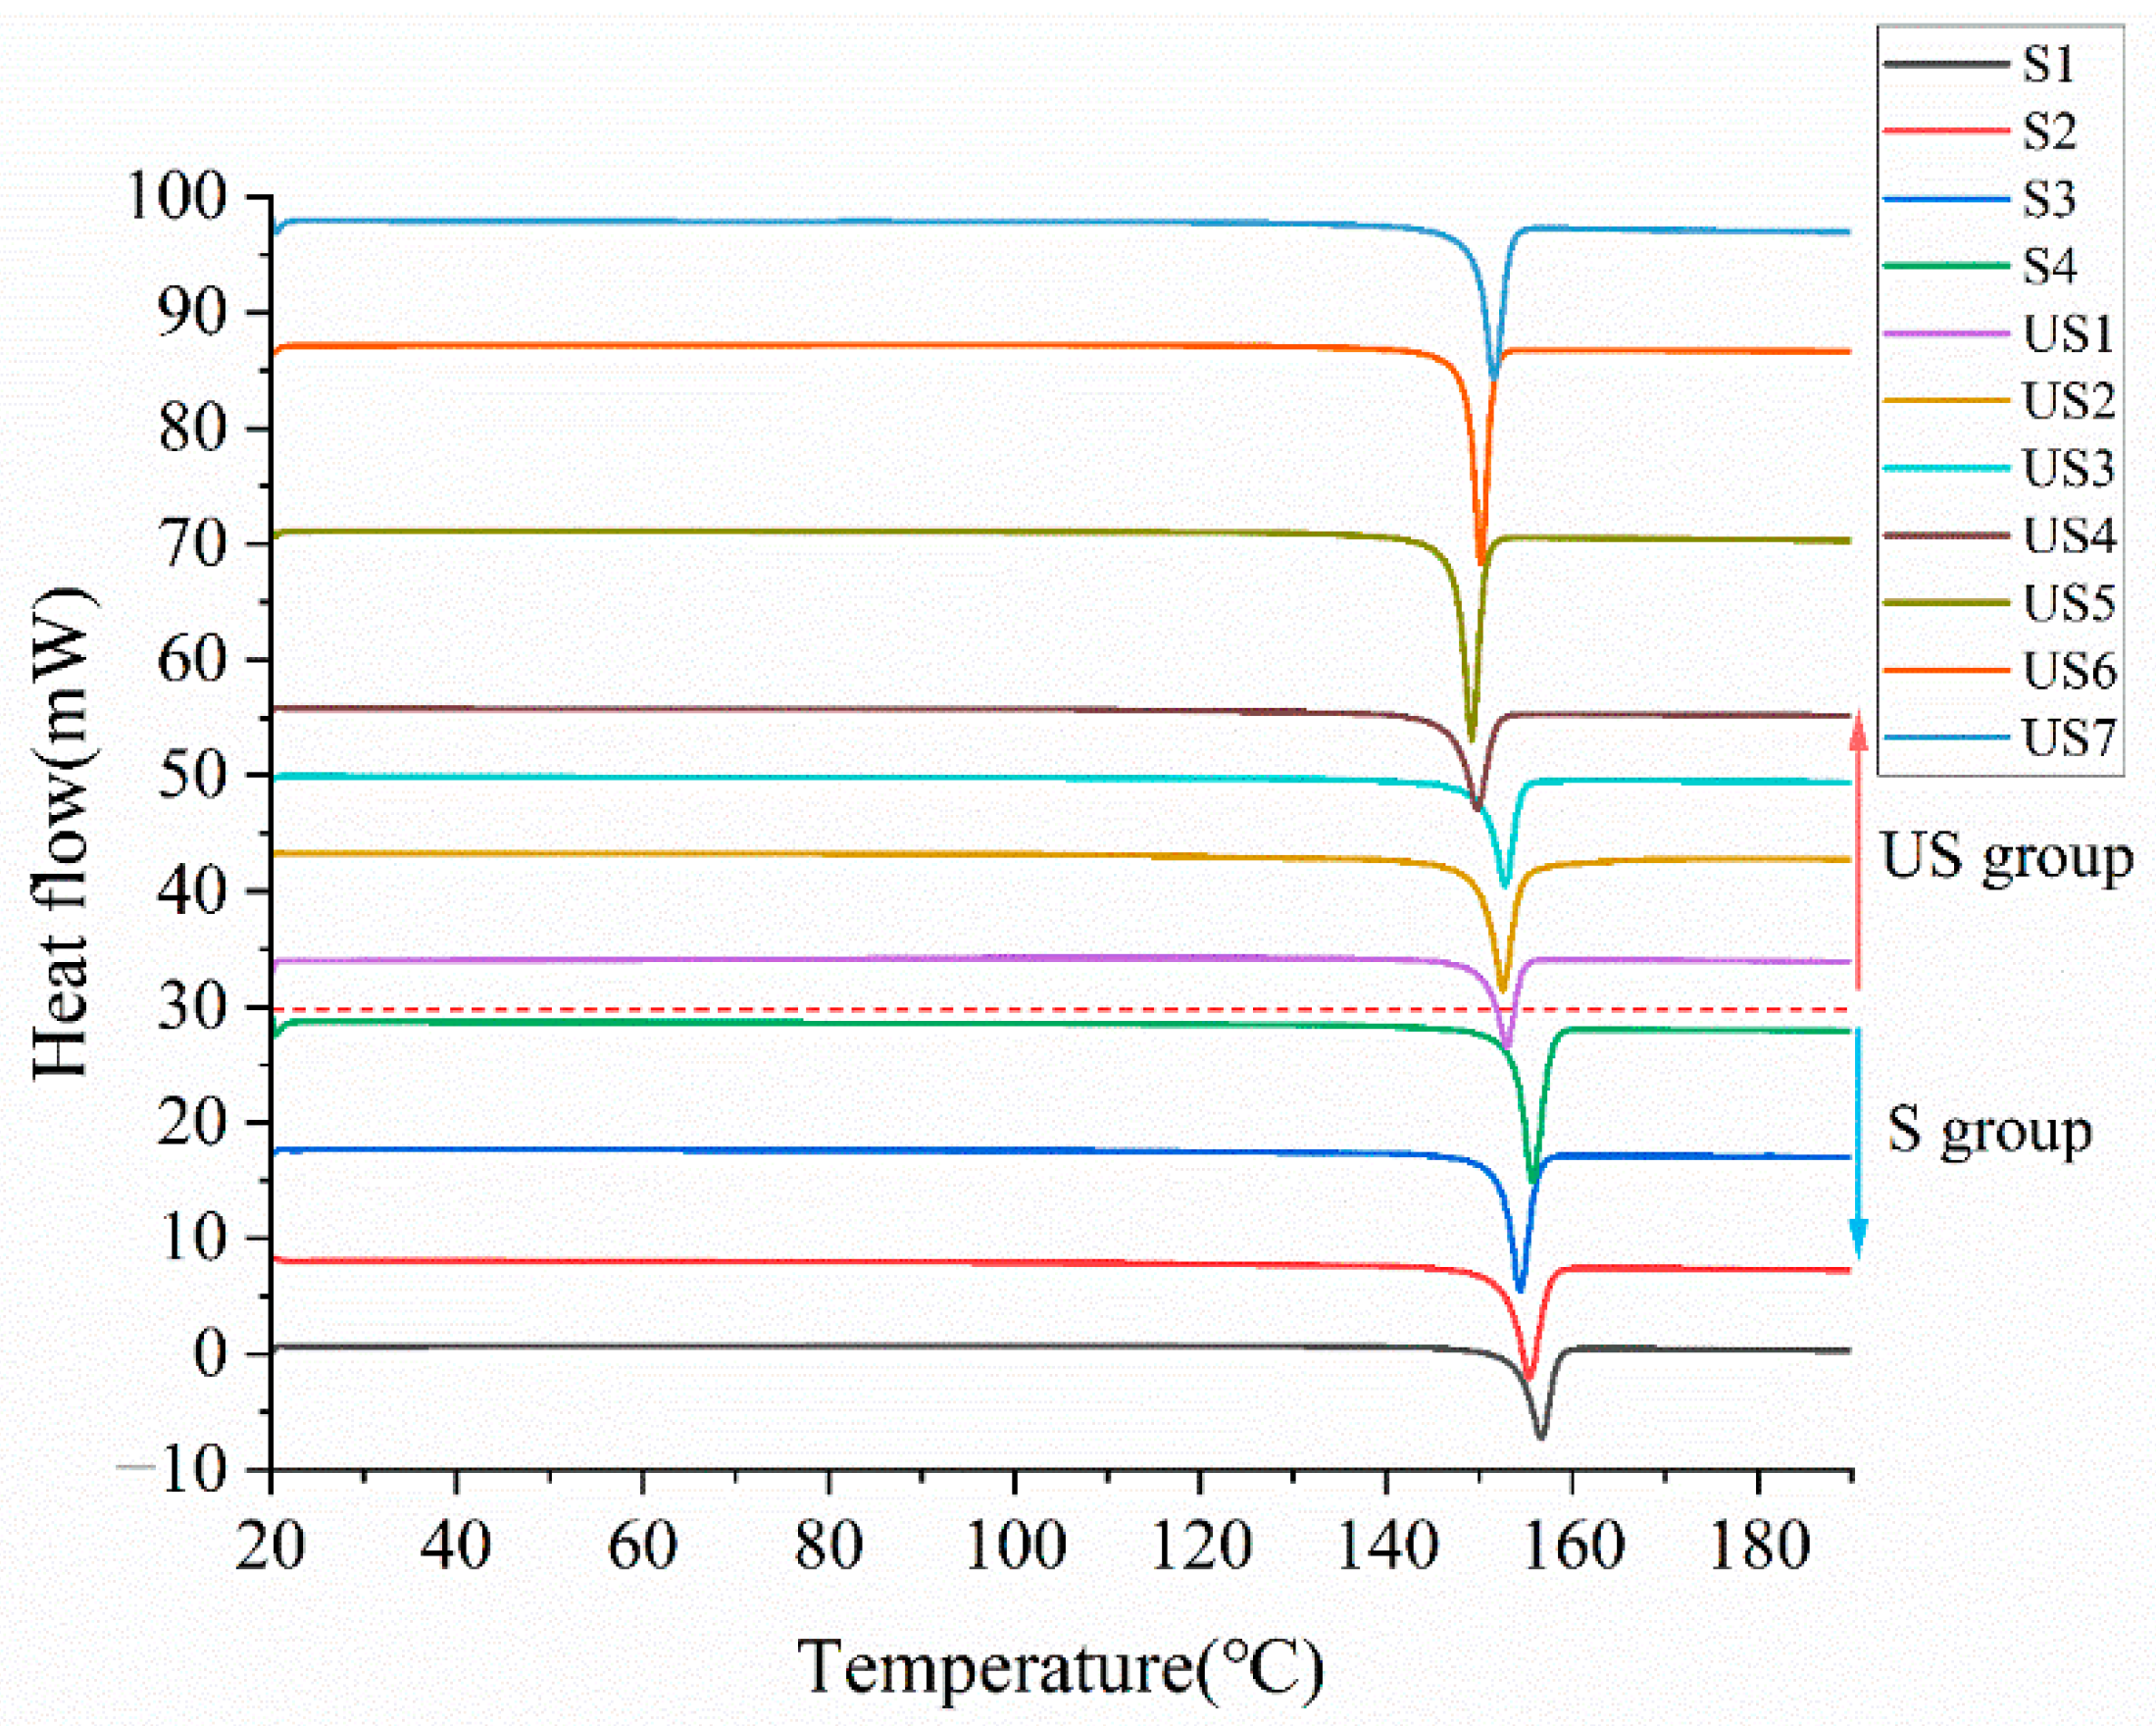
Figure 7.
DSC curves of stable and unstable samples. The red dashed line separates the DSC curves of the two sample groups, with unstable (US) group samples above the line and stable (S) group samples below.
Figure 7.
DSC curves of stable and unstable samples. The red dashed line separates the DSC curves of the two sample groups, with unstable (US) group samples above the line and stable (S) group samples below.
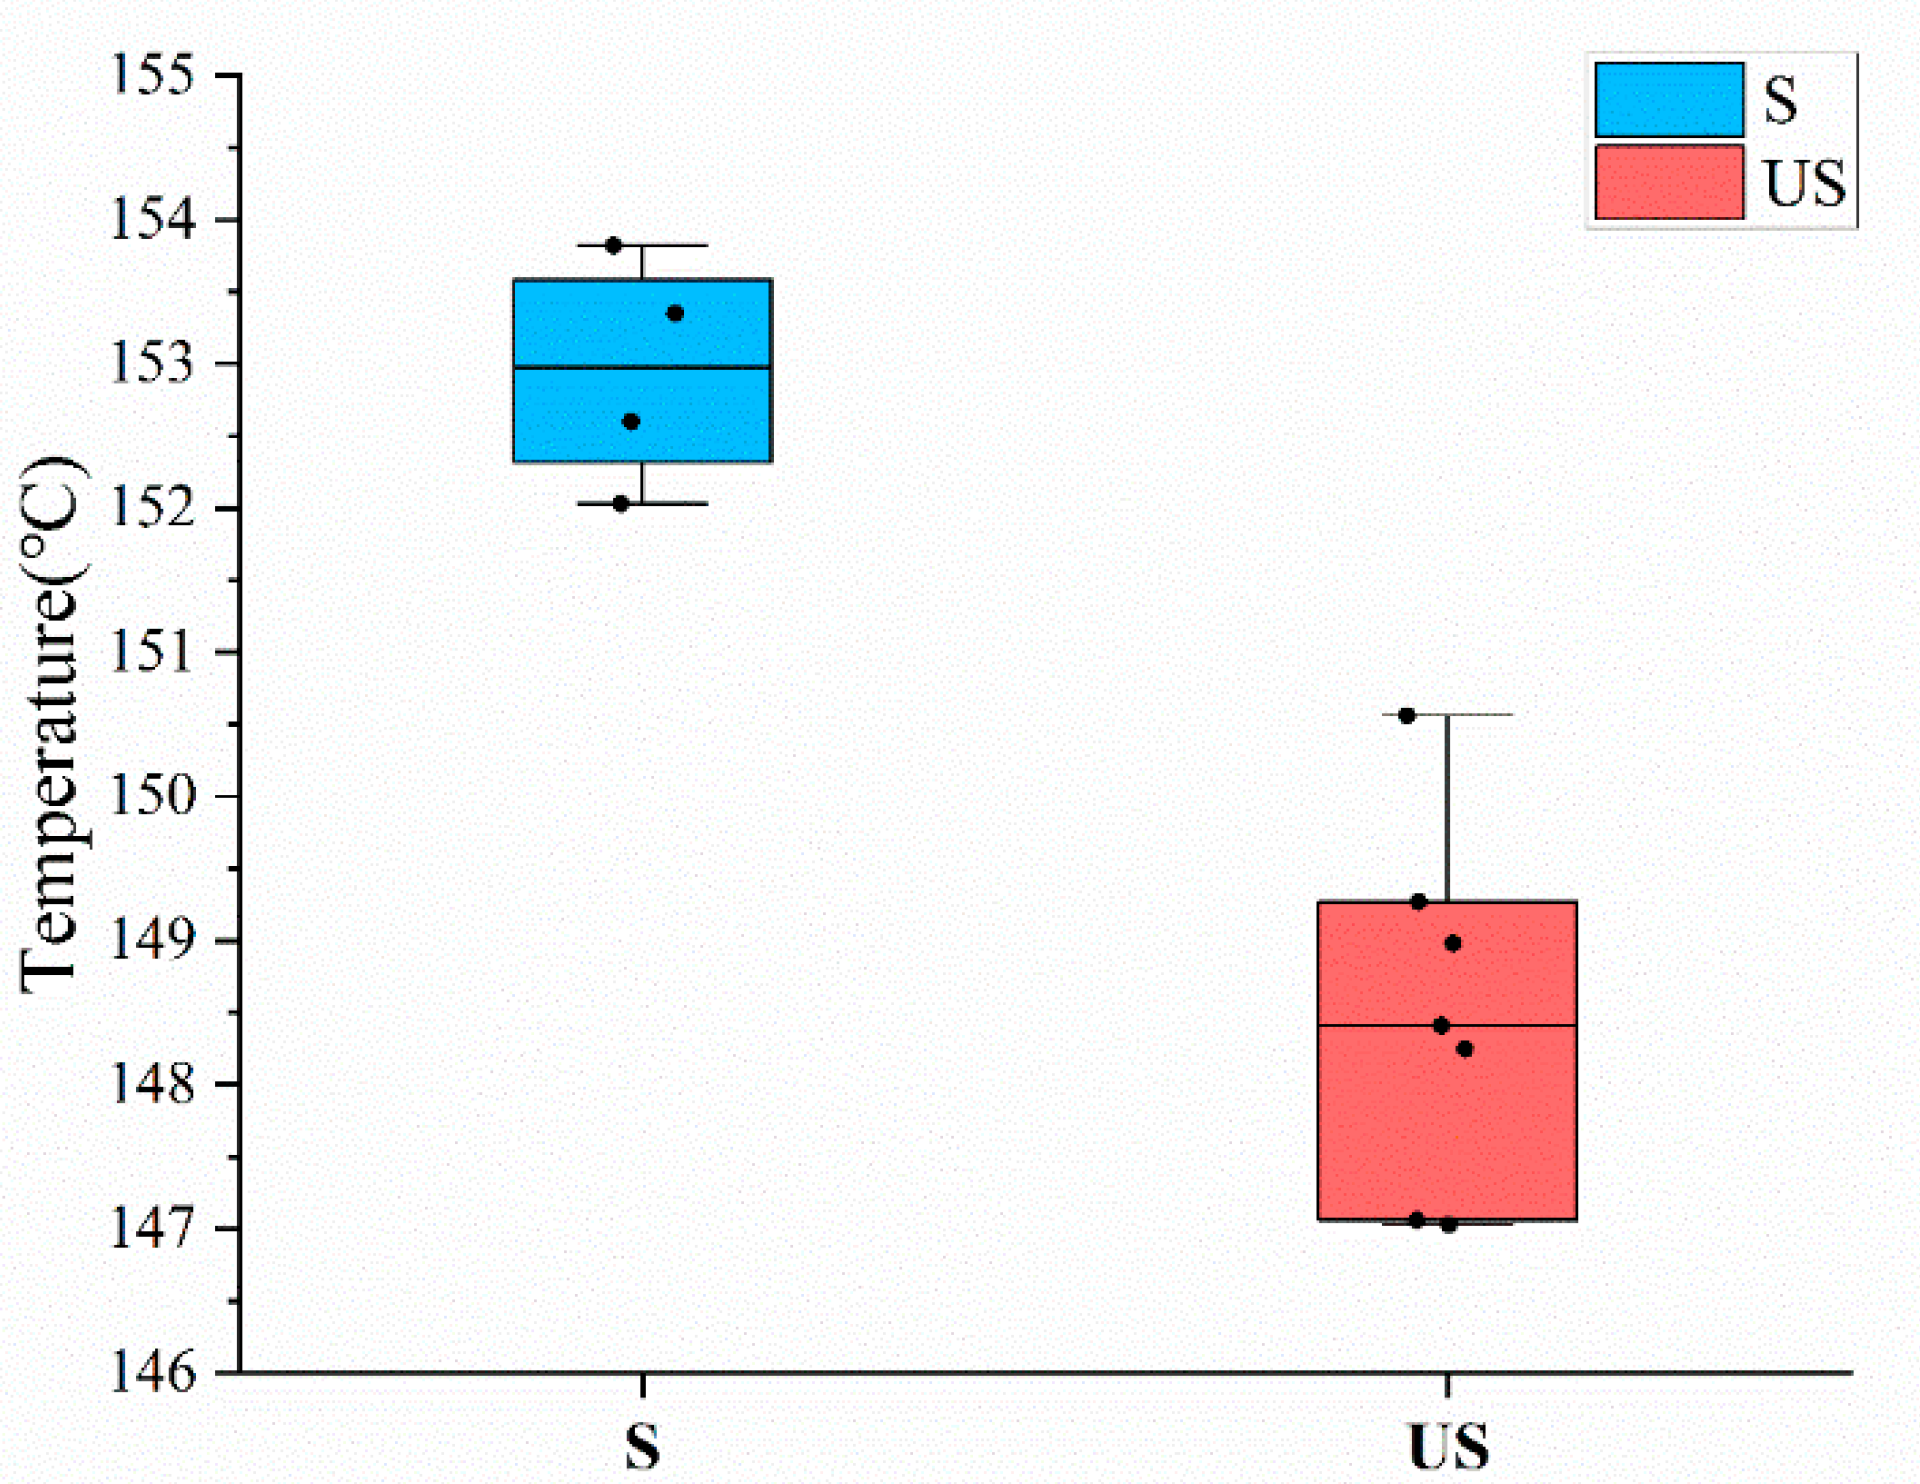
Figure 8.
Box plot of samples in S group and US group. The bullets in the figure represent the melting point of each sample.
Figure 8.
Box plot of samples in S group and US group. The bullets in the figure represent the melting point of each sample.
Figure 9.
Fitting effect of PXRD-M1.
Figure 9.
Fitting effect of PXRD-M1.
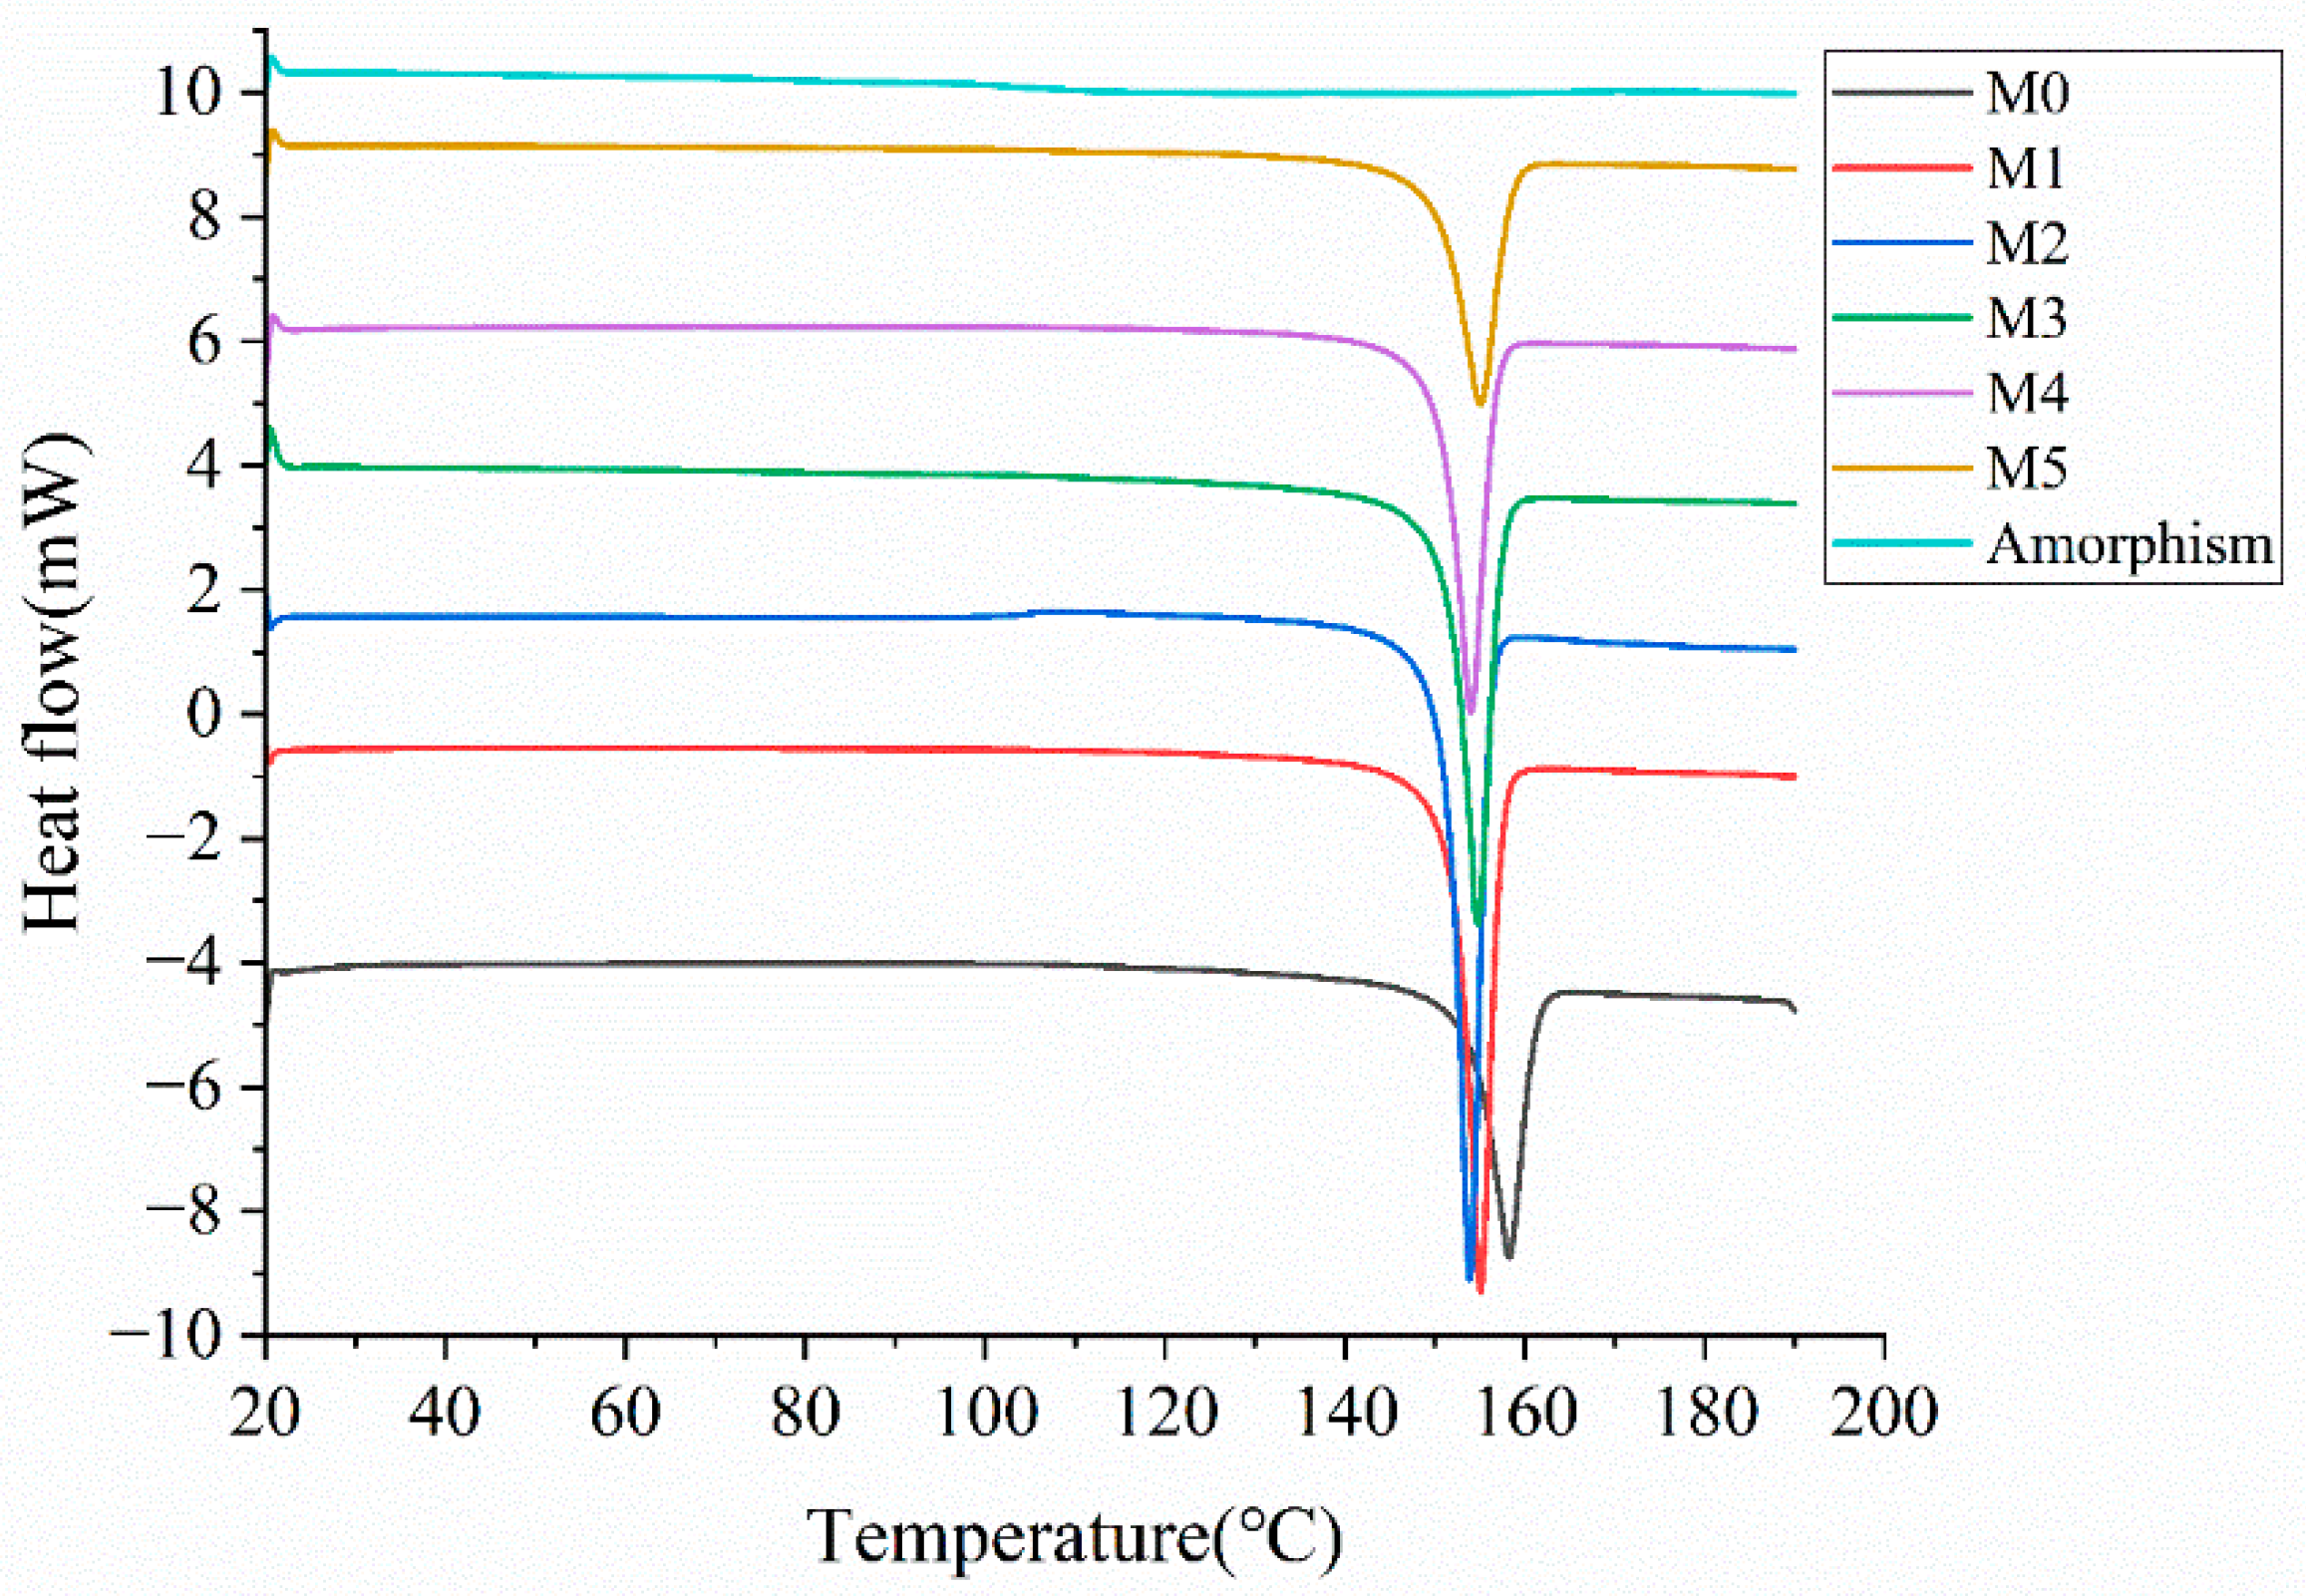
Figure 10.
DSC curves of mixed samples. DSC curves from bottom to top correspond to mixed samples with amorphous content of 0%, 5%, 10%, 15%, 20%, 30%, and amorphous sample, respectively.
Figure 10.
DSC curves of mixed samples. DSC curves from bottom to top correspond to mixed samples with amorphous content of 0%, 5%, 10%, 15%, 20%, 30%, and amorphous sample, respectively.
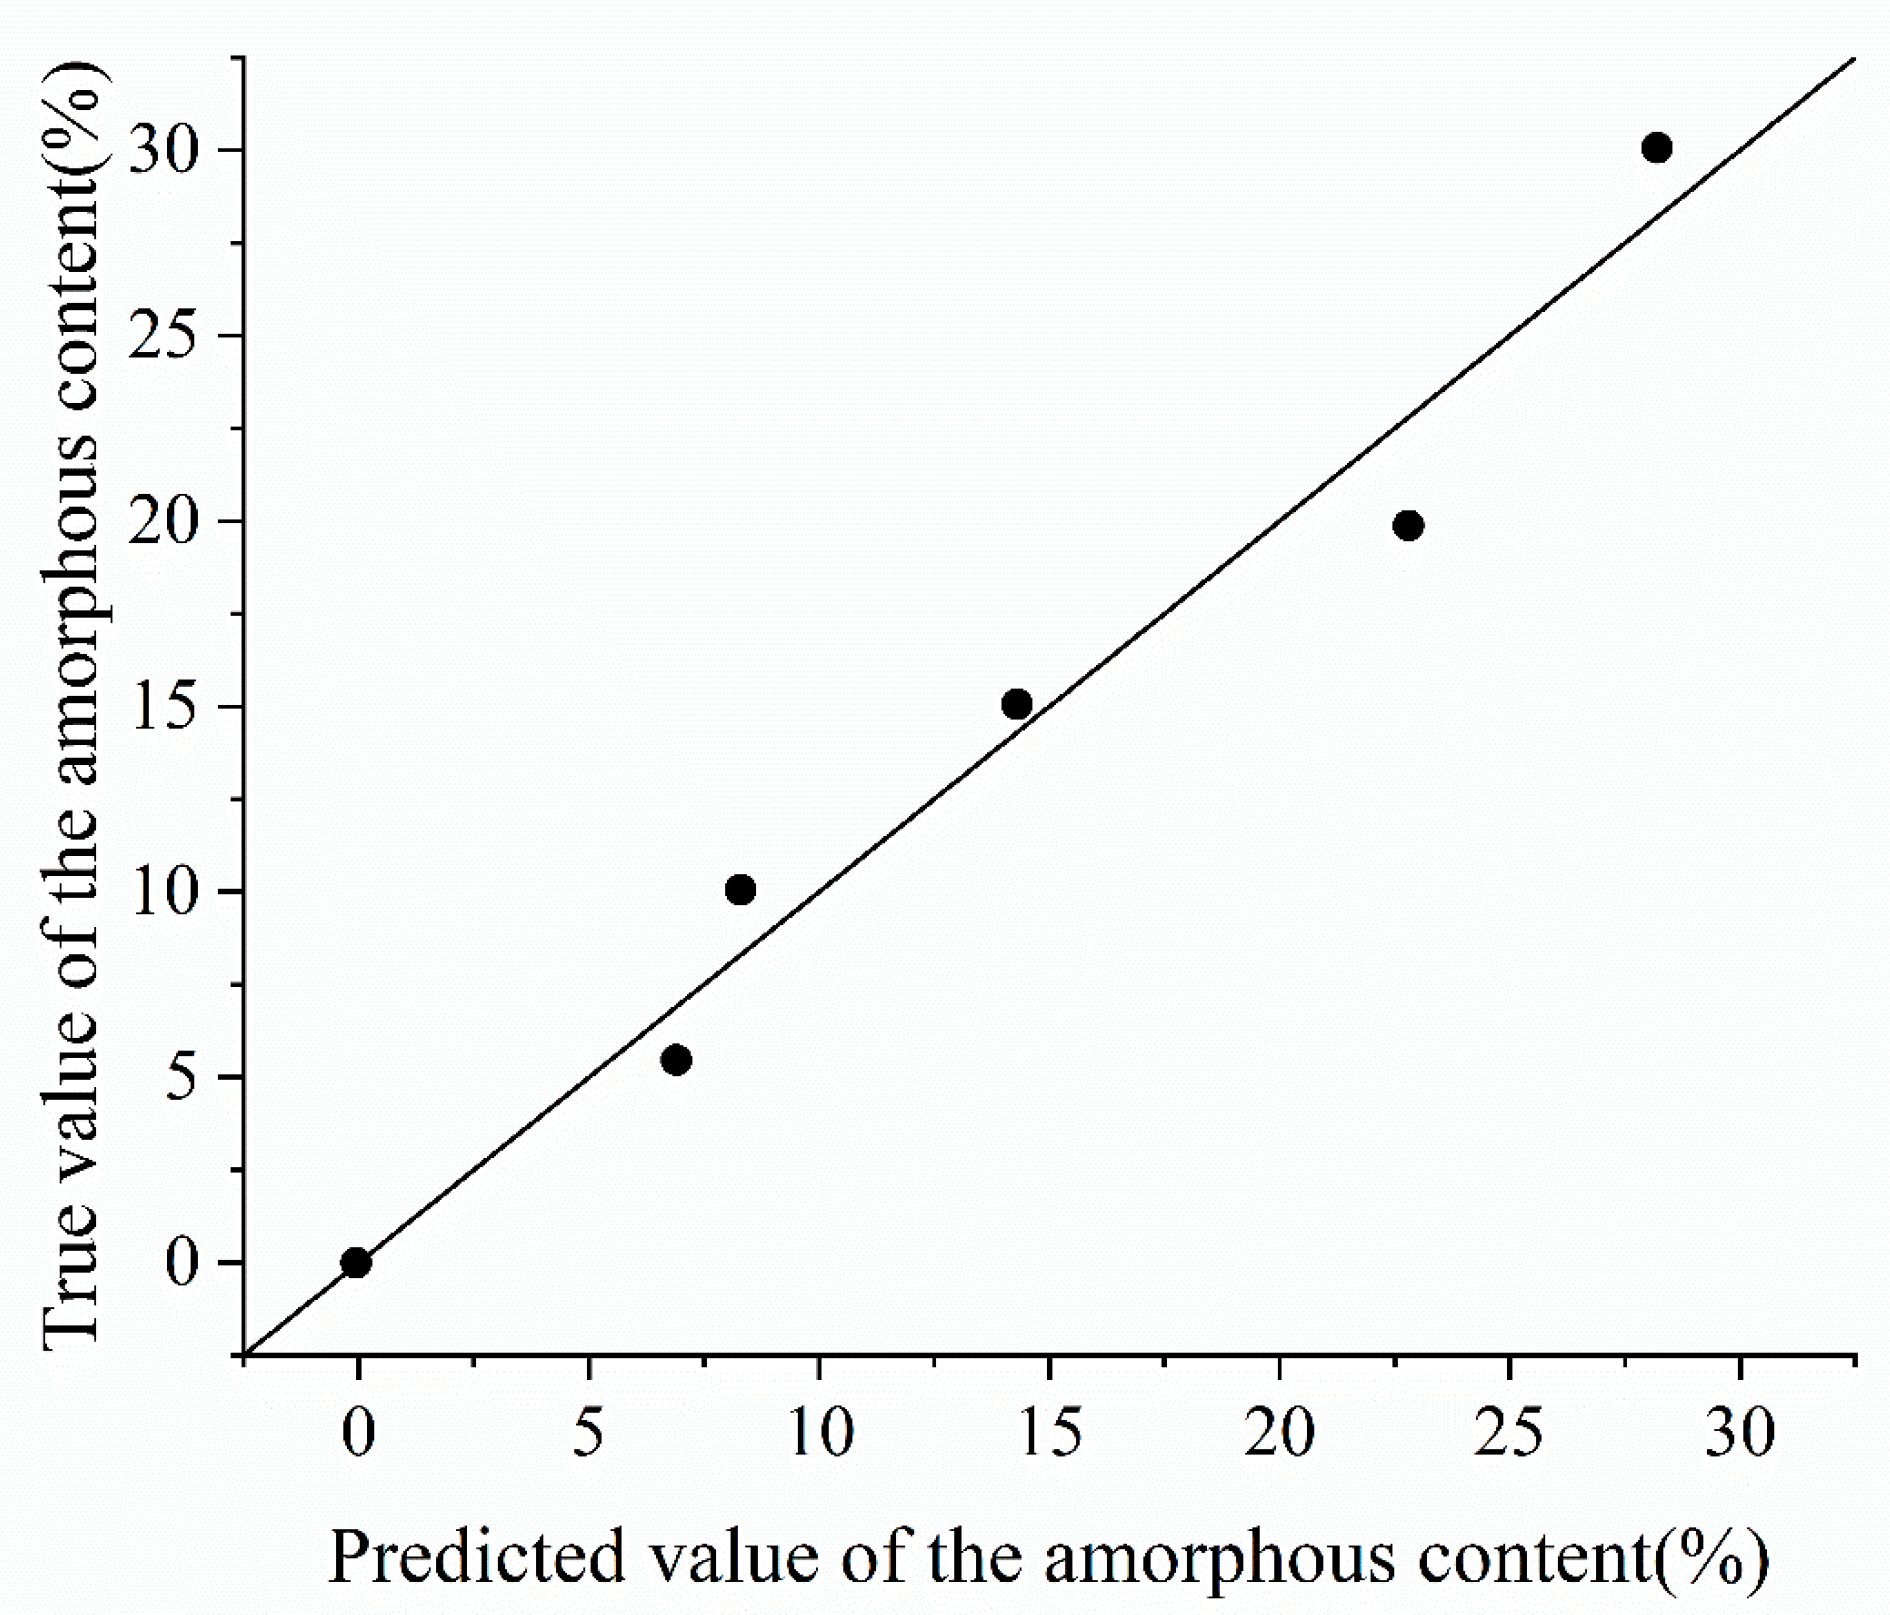
Figure 11.
Fitting effect of DSC-M.
Figure 11.
Fitting effect of DSC-M.
Figure 12.
NIRS spectra of mixed samples. NIR spectra from bottom to top correspond to samples with increasing amorphous content of 0%, 5%, 10%, 15%, 20%, and 30%, respectively.
Figure 12.
NIRS spectra of mixed samples. NIR spectra from bottom to top correspond to samples with increasing amorphous content of 0%, 5%, 10%, 15%, 20%, and 30%, respectively.
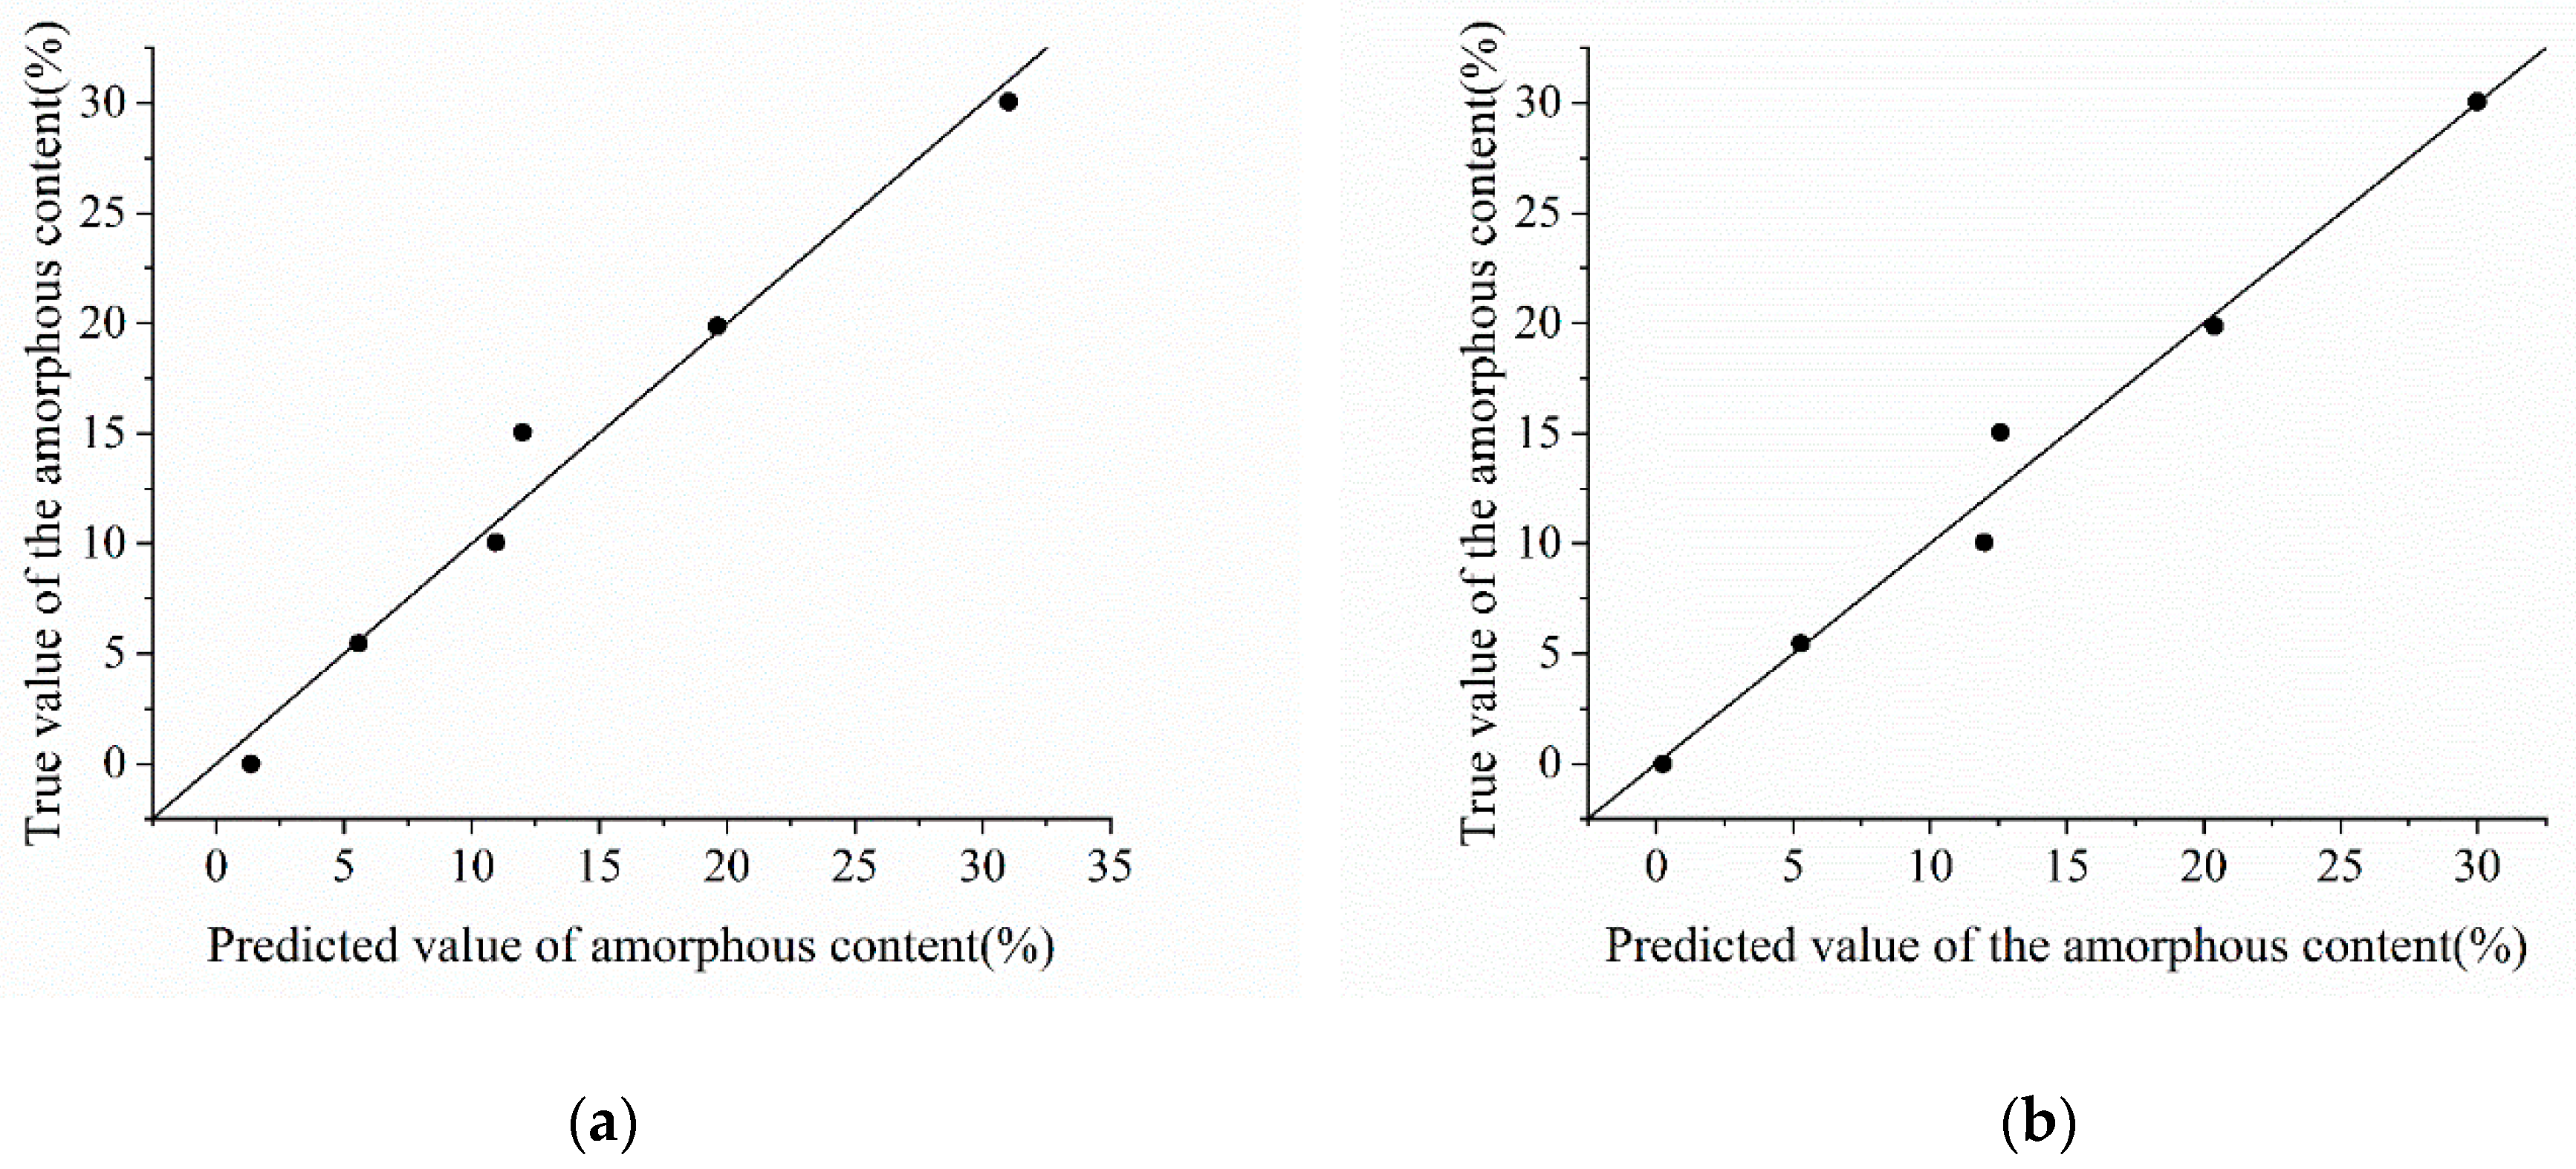
Figure 13.
Fitting effect of NIRS models. (a) NIRS-M1; (b) NIRS-M5.
Figure 13.
Fitting effect of NIRS models. (a) NIRS-M1; (b) NIRS-M5.
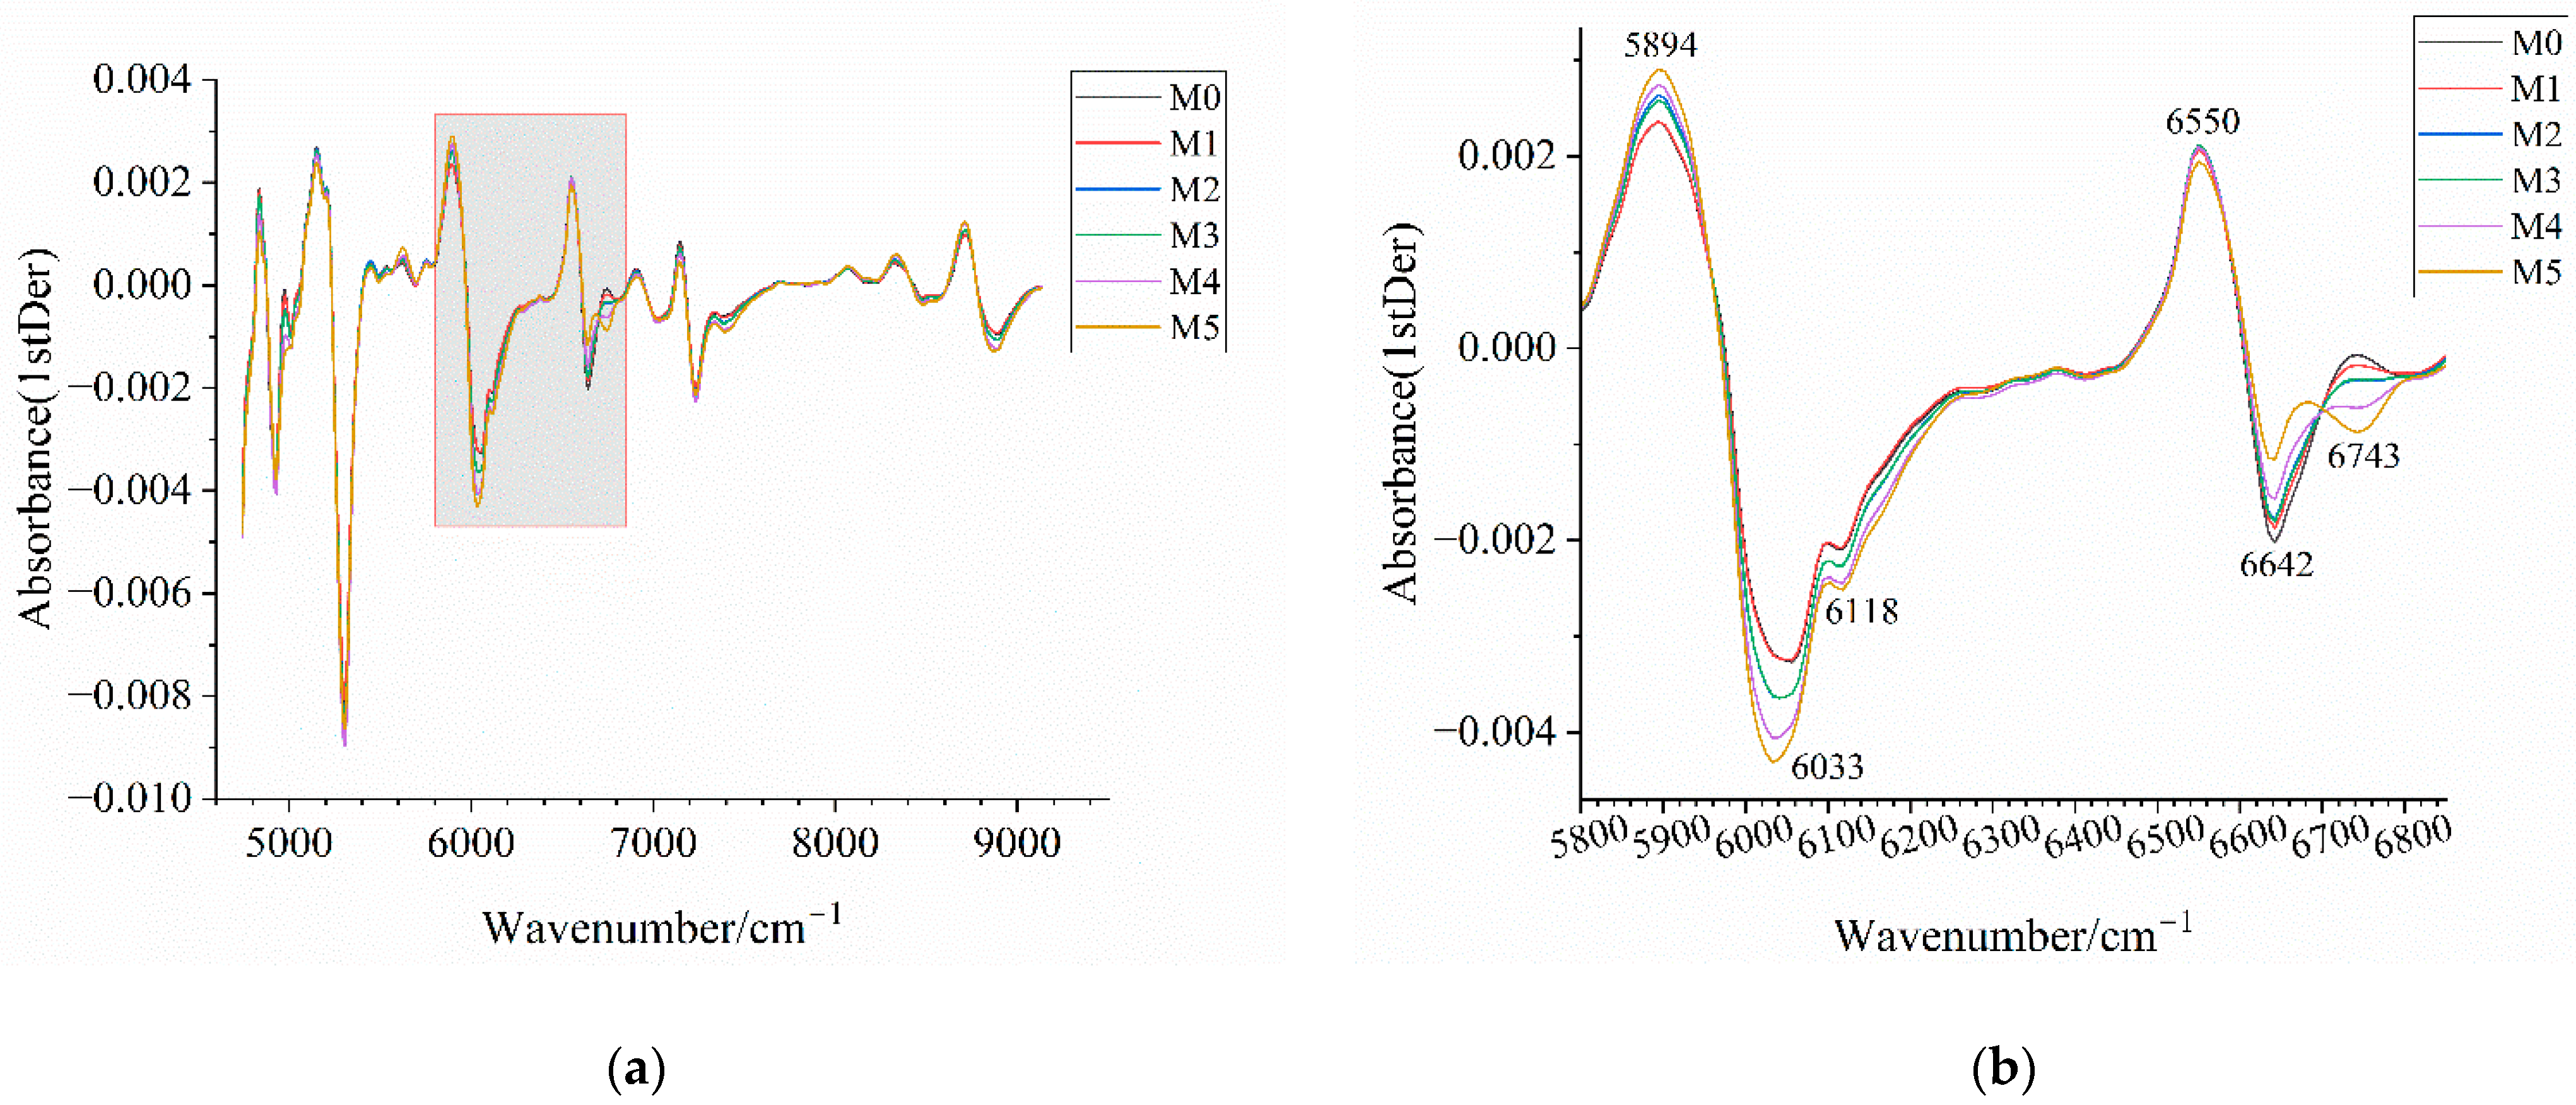
Figure 14.
Near-infrared spectra of mixed samples after preprocessing. (a) Near-infrared spectrum after 1stDer preprocessing; (b) enlarged view of the wavenumber range 5800–6850 cm−1 in (a) with annotations highlighting the distinctive wavenumber regions among samples; (c) near-infrared spectra after SNV-1stDer preprocessing; (d) enlarged view of the wavenumber range 5800–6850 cm−1 in (c) with annotations highlighting the distinctive wavenumber regions among samples. M0–M5 correspond to mixed samples with an amorphous content of 0%, 5%, 10%, 15%, 20%, and 30%, respectively.
Table 1.
The characteristics of Form I atorvastatin calcium drug substances.
Table 1.
The characteristics of Form I atorvastatin calcium drug substances.
| Samples | Stability |
|---|
| S1 | Stable |
| S2 | Stable |
| S3 | Stable |
| S4 | Stable |
| US1 | Unstable |
| US2 | Unstable |
| US3 | Unstable |
| US4 | Unstable |
| US5 | Unstable |
| US6 | Unstable |
| US7 | Unstable |
Table 2.
Comparison of melting points of stable and unstable samples.
Table 2.
Comparison of melting points of stable and unstable samples.
| Samples | Melting Point/°C | Samples | Melting Point/°C |
|---|
| S1 | 153.82 | US3 | 148.41 |
| S2 | 152.60 | US4 | 147.06 |
| S3 | 152.03 | US5 | 147.03 |
| S4 | 153.35 | US6 | 148.25 |
| US1 | 150.56 | US7 | 149.27 |
| US2 | 148.98 | | |
Table 3.
Parameters of PLS model based on PXRD data.
Table 3.
Parameters of PLS model based on PXRD data.
| Model | Preprocessing Methods | Number of PLS Components | | | |
|---|
| PXRD-M1 | None | 2 | 0.943 | 0.995 | 0.978 |
| PXRD-M2 | 1stder | 2 | 0.729 | 0.953 | 0.785 |
| PXRD-M3 | 2ndDer | 2 | 0.563 | 0.992 | 0.767 |
| PXRD-M4 | MSC | 1 | 0.478 | 0.99 | 0.822 |
| PXRD-M5 | SNV | 1 | 0.534 | 0.992 | 0.909 |
| PXRD-M6 | MSC-1stDer | 2 | 0.609 | 0.999 | 0.845 |
| PXRD-M7 | SNV-1stDer | 2 | 0.612 | 0.997 | 0.864 |
Table 4.
The predicted value of the amorphous content for two types of samples based on PXRD-M1 model.
Table 4.
The predicted value of the amorphous content for two types of samples based on PXRD-M1 model.
| Samples | Predicted Value of the Amorphous Content/% | Samples | Predicted Value of the Amorphous Content/% |
|---|
| S1 | 0.623 | US3 | 6.99 |
| S2 | 0.0178 | US4 | 16.9 |
| S3 | 6.14 | US5 | 3.19 |
| S4 | 1.45 | US6 | 3.44 |
| US1 | 12.1 | US7 | 9.21 |
| US2 | 9.27 | | |
Table 5.
Enthalpies of fusion of samples.
Table 5.
Enthalpies of fusion of samples.
| Samples | Enthalpy of Fusion/J/g | Samples | Enthalpy of Fusion/J/g | Samples | Enthalpy of Fusion/J/g |
|---|
| h0 | −97.13 | S1 | −87.43 | US3 | −80.33 |
| h1 | −89.00 | S2 | −93.66 | US4 | −82.37 |
| h2 | −87.37 | S3 | −94.50 | US5 | −90.30 |
| h3 | −80.31 | S4 | −102.88 | US6 | −91.48 |
| h4 | −70.41 | US1 | −76.88 | US7 | −89.66 |
| h5 | −64.08 | US2 | −85.21 | - | - |
Table 6.
Predicted value of the amorphous content based on enthalpies of fusion.
Table 6.
Predicted value of the amorphous content based on enthalpies of fusion.
| Samples | Predicted Value of the Amorphous Content/% | Samples | Predicted Value of the Amorphous Content/% | Samples | Predicted Value of the Amorphous Content/% |
|---|
| h0 | −0.0544 | S1 | 8.24 | US3 | 14.3 |
| h1 | 6.90 | S2 | 2.91 | US4 | 12.6 |
| h2 | 8.30 | S3 | 2.20 | US5 | 5.79 |
| h3 | 14.3 | S4 | −4.97 | US6 | 4.78 |
| h4 | 22.8 | US1 | 17.3 | US7 | 6.34 |
| h5 | 28.2 | US2 | 10.1 | | |
Table 7.
Parameters of PLS model based on NIRS.
Table 7.
Parameters of PLS model based on NIRS.
| Model | Preprocessing Method | Number of PLS Components | | | |
|---|
| NIRS-M1 | 1stDer | 2 | 0.915 | 0.977 | 0.942 |
| NIRS-M2 | MSC | 2 | 0.937 | 0.975 | 0.927 |
| NIRS-M3 | SNV | 2 | 0.936 | 0.974 | 0.925 |
| NIRS-M4 | MSC-1stDer | 2 | 0.892 | 0.982 | 0.941 |
| NIRS-M5 | SNV-1stDer | 2 | 0.892 | 0.982 | 0.942 |
| NIRS-M6 | 2ndDer | 1 | 0.593 | 0.962 | 0.903 |
Table 8.
The predicted value of the amorphous content based on the NIRS-PLS model.
Table 8.
The predicted value of the amorphous content based on the NIRS-PLS model.
| Samples | Predicted Value of the Amorphous Content/% |
|---|
| NIRS-M1 | NIRS-M5 |
|---|
| S1 | 0.734 | 2.70 |
| S2 | 1.36 | 0.251 |
| S3 | 4.54 | 6.31 |
| S4 | 4.52 | 5.47 |
| US1 | 6.47 | 5.24 |
| US2 | 5.75 | 5.68 |
| US3 | 6.16 | 6.04 |
| US4 | 10.8 | 9.92 |
| US5 | 7.92 | 7.30 |
| US6 | 6.69 | 7.00 |
| US7 | 10.2 | 9.01 |
Table 9.
Model accuracy for classifying between stable and unstable samples of the optimal model based on three detection techniques.
Table 9.
Model accuracy for classifying between stable and unstable samples of the optimal model based on three detection techniques.
| Model | Model Accuracy/% |
|---|
| PXRD-M1 | 72.73% |
| DSC-M | 63.64% |
| NIRS-M1 | 100.0% |
| NIRS-M5 | 72.73% |


