
Analysis of Social Media Discussions on (#)Diet by Blue, Red, and Swing States in the U.S.

 ,
,  , , and
Abstract
1. Introduction
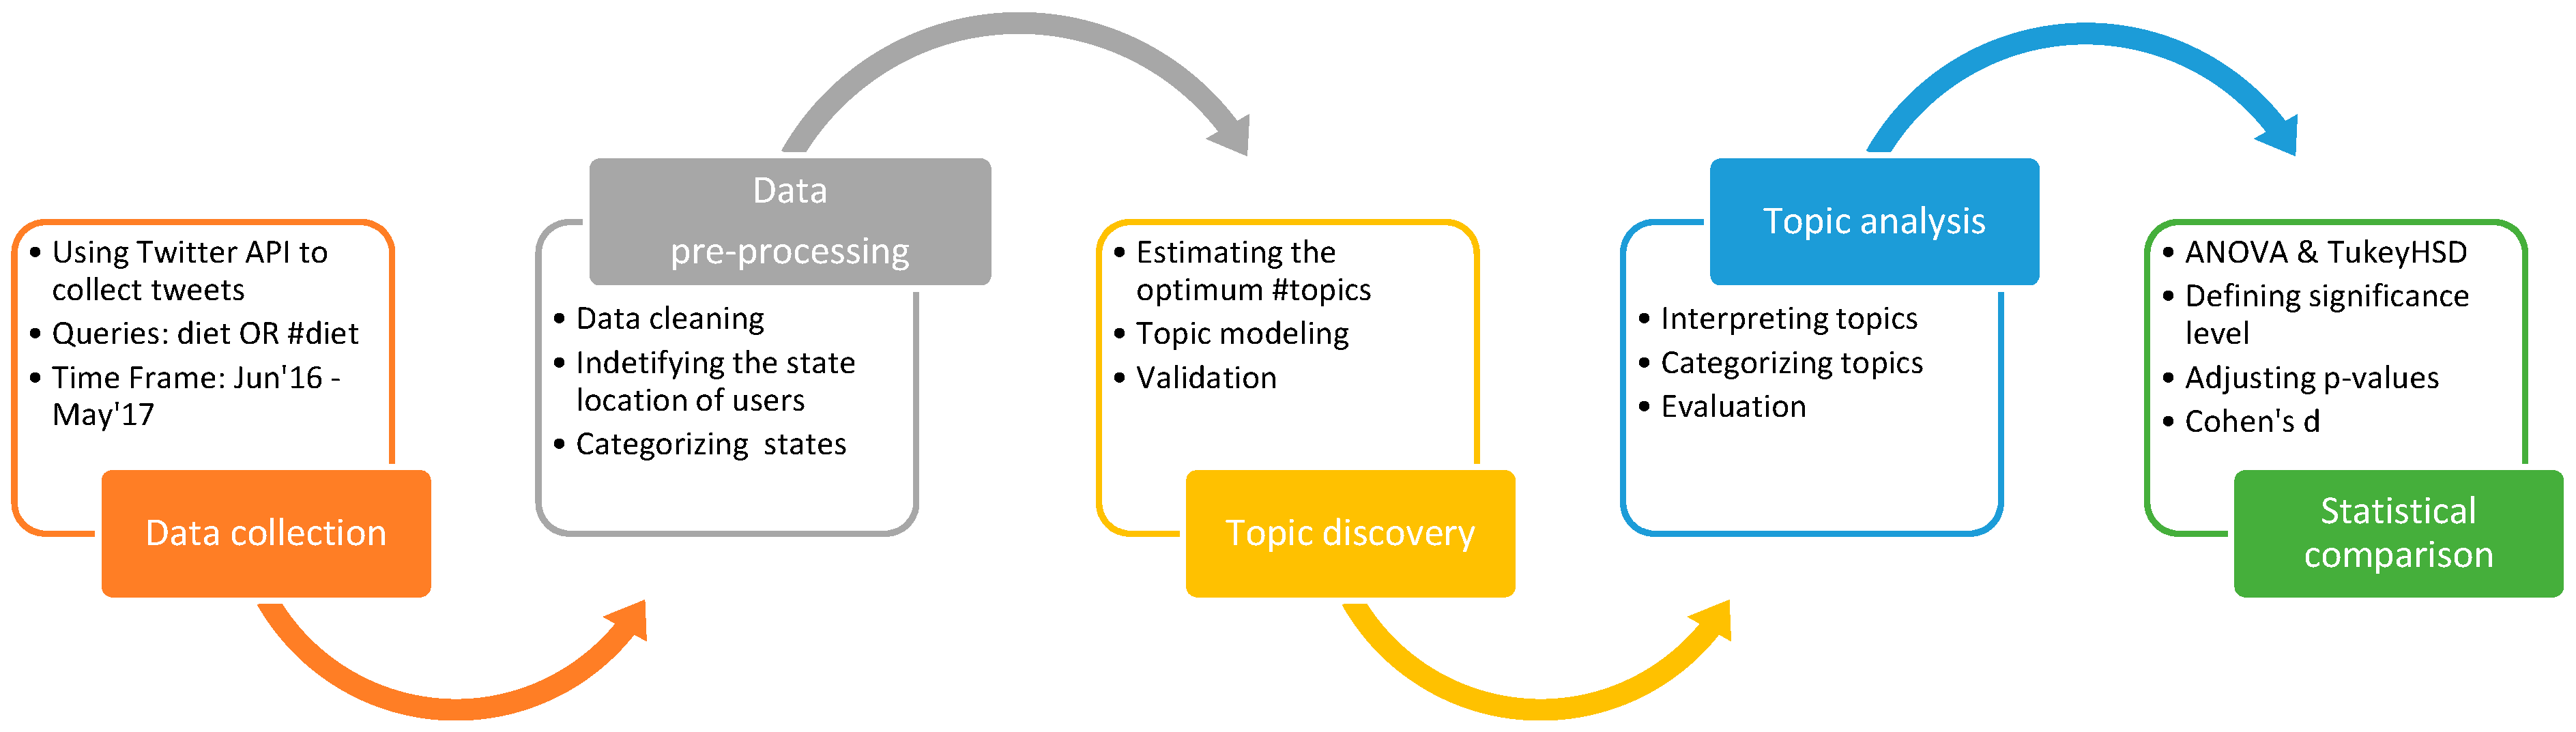
2. Materials and Methods
2.1. Data Collection
2.2. Data Pre-Processing
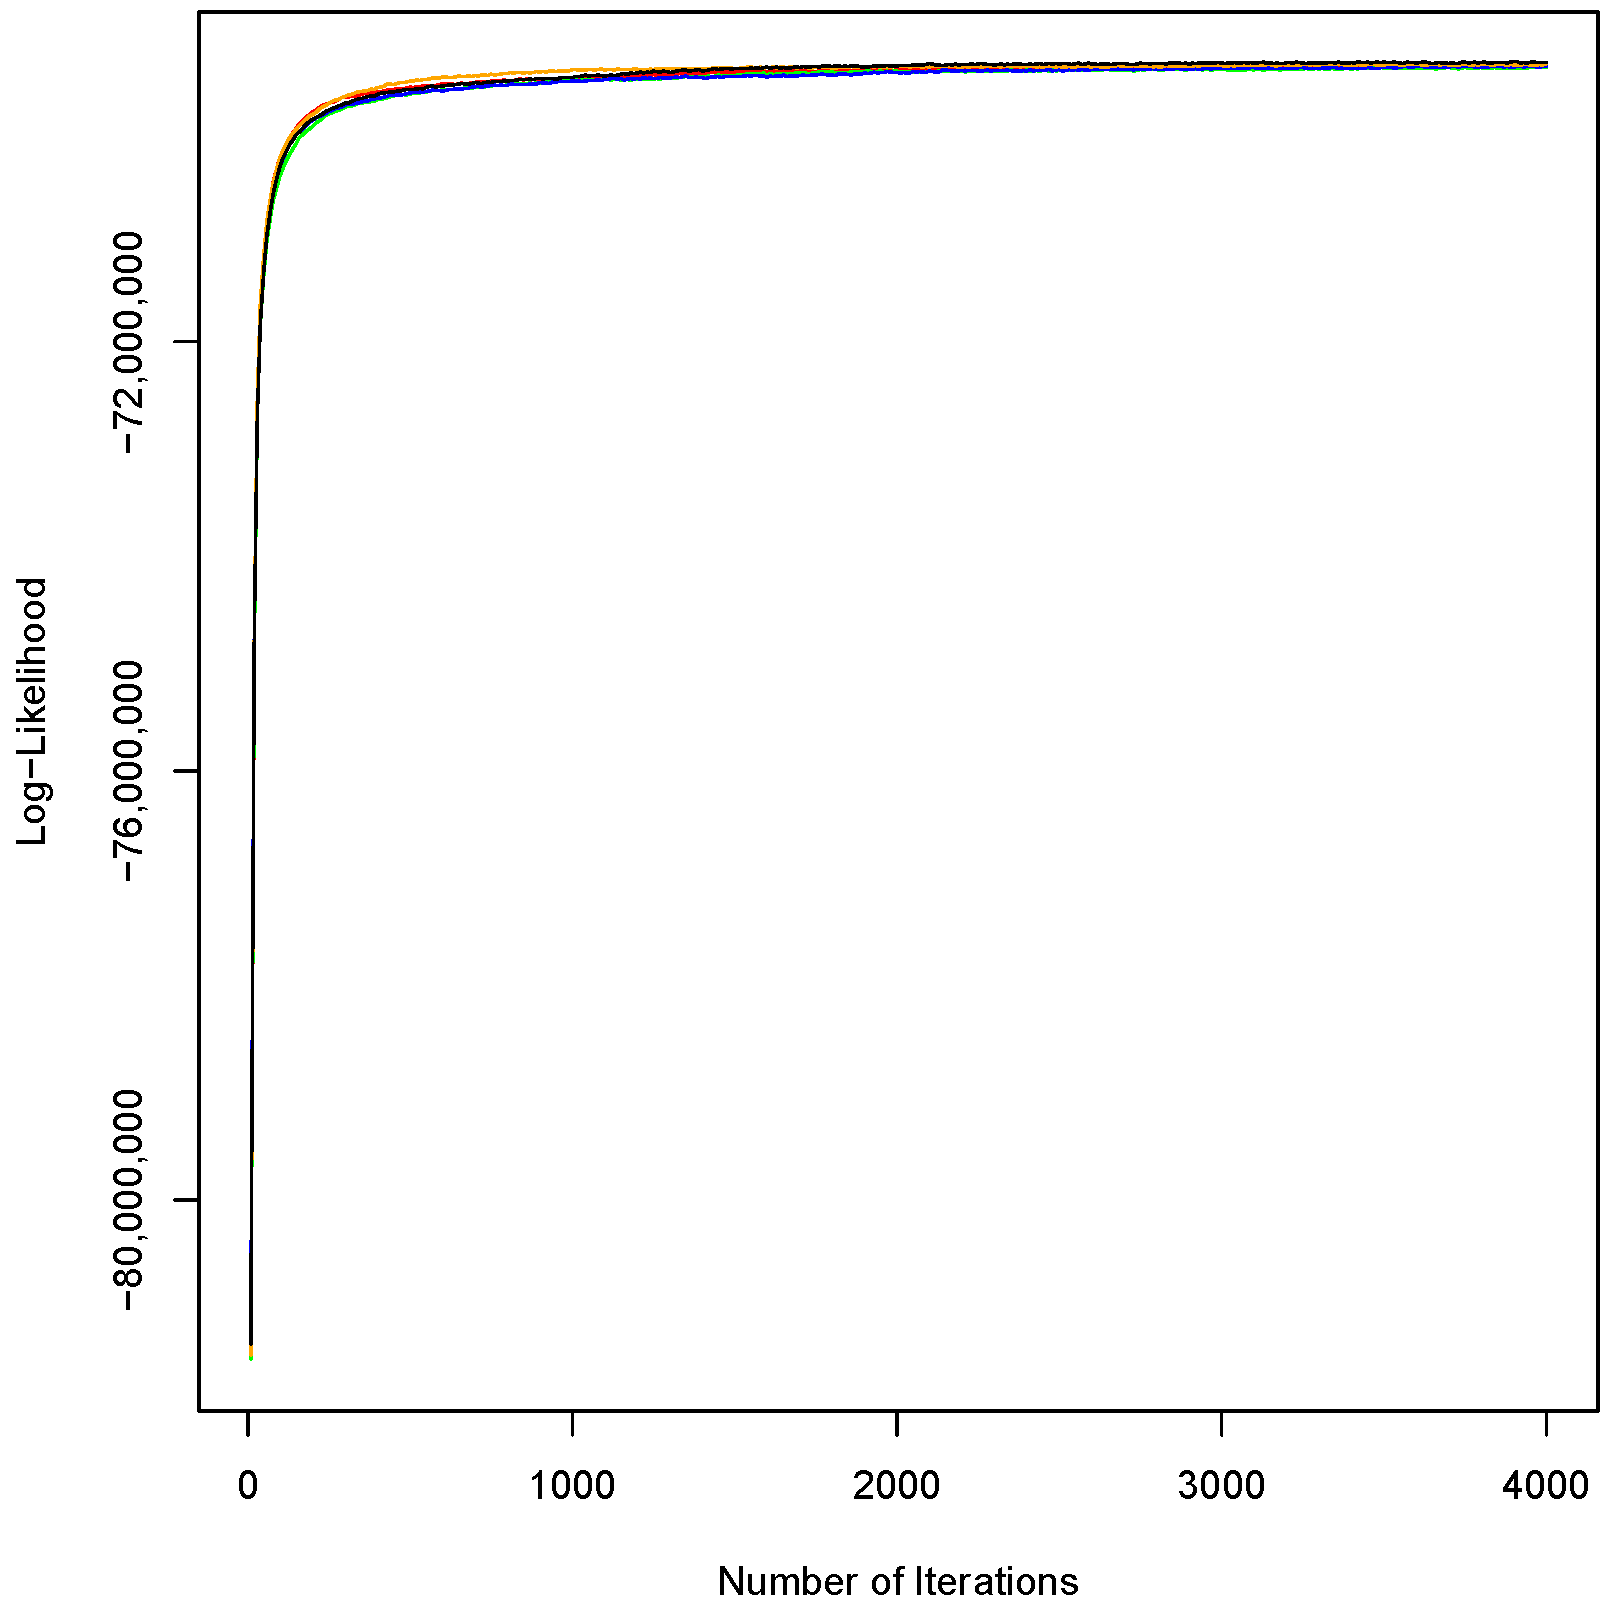
2.3. Topic Discovery
| Topics | Documents | |
| & | ||
| P(Wi|Tk) | P(Tk|Dj) |
2.4. Topic Analysis
2.5. Statistical Comparison
3. Results
- No significant difference between republican and swing states across 10 topics, including self-monitoring, diet sodas, recipes, celebrity diets, nutrition information, healthy diet planning, AAA diet, fitness inspiration, fitness information, and dietary log. However, a significant difference was detected between republican and swing states based on 22 (68.75%) topics, in which swing states had higher discussion than republican states on 13 topics.
- No significant difference between democratic and republican states in five topics, including diet information, diet pills, vegetarian/vegan, diet change, and Atkins diets. However, a significant difference was identified between republican and democratic states in 27 (84%) topics, in which republican states had higher discussion than democratic states on 17 topics.
- No significant difference between democratic and swing states on the diabetes topic. However, a difference was detected between democratic and swing states in 31 (96.875%) topics, in which swing states had higher discussion than democratic states in 22 topics.
- While the republican and swings states discussed the types of diets more than other states, the discussions of democratic states focused on positive and negative outcomes of diets, such as weight loss and chronic diseases. Compared to the republican and the swing states, the democratic states made more mentions of fitness role models (e.g., celebrities) to inspire healthy behaviors.
- U.S. news scored and ranked diets based on their healthiness, in which the higher score represented a healthier diet [53]. Based on this ranking, the democratic states were more interested in diets with a higher healthy score representing the value of a diet for improving health and helping fight diseases, such as the Mediterranean (4.8/5) and AAA (3/5) diets; however, the republican and swing states were more interested in diets with a lower healthy score, such as paleo (2.5/5), and ketogenic/LCHF (Keto) (1.7/5). Studies also show that Yo-Yo [54] and gluten-free diets for people without celiac disease [55] are not healthy diets.
4. Discussion
5. Conclusions
Author Contributions
Funding
Conflicts of Interest
Appendix A

| Topic | Description |
|---|---|
| Self-monitoring | The practice of observing health behaviors, actions, and decisions related to health. |
| Weight loss | Physical activity aimed at reducing weight and body mass index (BMI). |
| Diet Information | Information used to enable a person to take control over and improve their diet. |
| Diabetes | Chronic condition/disease in which blood glucose (sugar) levels are too high. |
| Diet Promotion and Advertisement | Information used to enable a person to take control over and improve their diet. |
| Diet Pill | Weight loss medications to reduce or control weight. |
| Unhealthy Diet | Food choices comprised of low nutritional value. |
| Gluten Free Diet | Dietary plan of eating foods that do not have gluten. |
| Vegetarian/Vegan Diet | Dietary plan abstaining from the consumption of meat and sometimes by-products of animal slaughter [75]. |
| Diet Education | Information focused on increasing knowledge or spreading information related to Diet. |
| Recipes | Set of instructions for food preparation. |
| Balanced Diet | Fulfilling all of a person’s nutritional needs to function correctly. |
| Paleo/HCG Diet | While Paleo dietary plan is based on low-carbohydrate foods, the human chorionic gonadotropin (HCG) dietary plan is based on low-calories and low-fat foods [75]. |
| Healthy Diet Information | Sharing information on food choices comprised of high nutritional value. |
| Physical Activity | Movement of the body by engaging in an organized or unorganized activity and exerting energy. |
| Mediterranean Diet | Dietary plan of primarily plant-based foods, healthy oils, and herbs and spices to flavor foods. Red meat is often limited to a few times a month or less [75]. |
| Detox | A process or period of time in which a person abstains from or rids the body of toxic or unhealthy substances by flushing the system with water or naturally occurring products (fruits and vegetables). |
| Ketogenic/LCHF Diet | The low-carbohydrate, high-fat (LCHF) method is based on replacing carbohydrate with healthy fats. Consisting of low-carb foods forcing the body to turn fat into ketones for use as energy, Ketogenic diet is an example of LCHF diets [75]. |
| Obesity | Having weight above what is considered healthy. |
| Celebrity Diets and Workouts | Physical activity routines promoted by celebrity social media accounts or associated with the celebrity name. |
| Diet Change | Changing eating habits. |
| Nutrition Information | Information on the nutrition value of a food. |
| No-Sugar Diet | Removing sources of added sugar from daily food intake. |
| Atkins Diet | A dietary pattern strict in low-carbohydrate foods [75]. |
| Health Diet Plan | Develop a plan to consume food choices comprised of high nutritional value. |
| Yo-Yo Dieting | A process of losing weight, regaining it, and then dieting again. |
| Acid Alkaline Association (AAA) Diet | Dietary plan of eating 80% alkaline foods and 20% acid-producing foods [75]. |
| Fitness Inspiration | Motivation to engage in fitness or become more active in lifestyle behaviors. |
| Fitness Program | Temporal representation of exercise or dieting behavior that is captured through specific constraints (e.g., minutes, day, morning, week). |
| Fitness Information | Information on the condition of being physically fit and healthy. |
| Dietary Log | Planning a consistent pattern of diets, such as cutting meat over time. |
References
- Abbar, S.; Mejova, Y.; Weber, I. You tweet what you eat: Studying food consumption through twitter. In Proceedings of the 33rd Annual ACM Conference on Human Factors in Computing Systems, Seoul, Korea, 18–23 April 2015; pp. 3197–3206. [Google Scholar]
- Bauer, U.E.; Briss, P.A.; Goodman, R.A.; Bowman, B.A. Prevention of chronic disease in the 21st century: Elimination of the leading preventable causes of premature death and disability in the USA. Lancet 2014, 384, 45–52. [Google Scholar] [CrossRef]
- Poor Nutrition|CDC. Available online: https://www.cdc.gov/chronicdisease/resources/publications/factsheets/nutrition.htm (accessed on 19 June 2020).
- CDC. FastStats. 28 February 2020. Available online: https://www.cdc.gov/nchs/fastats/obesity-overweight.htm (accessed on 19 June 2020).
- Hillemeier, M.; Lynch, J.; Harper, S.; Casper, M. Data Set Directory of Social Determinants of Health at the Local Level; US Department of Health and Human Services, Centers for Disease Control and Prevention: Atlanta, GA, USA, 2004. [Google Scholar]
- Marmot, M.; Allen, J.J. Social Determinants of Health Equity. Am. J. Public Health 2014, 104, S517–S519. [Google Scholar] [CrossRef]
- Kannan, V.D.; Veazie, P.J. Political orientation, political environment, and health behaviors in the United States. Prev. Med. 2018, 114, 95–101. [Google Scholar] [CrossRef]
- Martyn, C. Politics as a determinant of health. BMJ 2004, 329, 1423–1424. [Google Scholar] [CrossRef] [PubMed][Green Version]
- Dawes, D.E. The Political Determinants of Health; Johns Hopkins University Press: Baltimore, MD, USA, 2020. [Google Scholar]
- Paul, M.J.; Dredze, M. Social Monitoring for Public Health. Synth. Lect. Inf. Concepts Retr. Serv. 2017, 9, 1–183. [Google Scholar] [CrossRef]
- Mosier, S.L.; Rimal, A.P. Where’s the meat? An evaluation of diet and partisanship identification. Br. Food J. 2020, 122, 896–909. [Google Scholar] [CrossRef]
- Lusk, J.L.; Norwood, F.B. Some vegetarians spend less money on food, others don’t. Ecol. Econ. 2016, 130, 232–242. [Google Scholar] [CrossRef]
- Korda, H.; Itani, Z. Harnessing Social Media for Health Promotion and Behavior Change. Health Promot. Pract. 2013, 14, 15–23. [Google Scholar] [CrossRef] [PubMed]
- Gamache, R.; Kharrazi, H.; Weiner, J.P. Public and Population Health Informatics: The Bridging of Big Data to Benefit Communities. Yearb. Med. Inform. 2018, 27, 199–206. [Google Scholar] [CrossRef]
- Hatef, E.; Weiner, J.P.; Kharrazi, H. A public health perspective on using electronic health records to address social determinants of health: The potential for a national system of local community health records in the United States. Int. J. Med. Inform. 2019, 124, 86–89. [Google Scholar] [CrossRef]
- Karami, A.; Lundy, M.; Webb, F.; Dwivedi, Y.K. Twitter and Research: A Systematic Literature Review Through Text Mining. IEEE Access 2020, 8, 67698–67717. [Google Scholar] [CrossRef]
- Center, P.R. Social Media Fact Sheet; Pew Research Center: Washington, DC, USA, 2017. [Google Scholar]
- Karami, A.; Dahl, A.A.; Turner-McGrievy, G.; Kharrazi, H.; Shaw, G., Jr. Characterizing Diabetes, Diet, Exercise, and Obesity Comments on Twitter. Int. J. Inf. Manag. 2018, 38, 1–6. [Google Scholar] [CrossRef]
- Turner-McGrievy, G.; Karami, A.; Monroe, C.; Brandt, H.M. Dietary pattern recognition on Twitter: A case example of before, during, and after four natural disasters. Nat. Hazards 2020, 103, 1035–1049. [Google Scholar] [CrossRef]
- Money, V.; Karami, A.; Turner-McGrievy, B.; Kharrazi, H. Seasonal characterization of diet discussions on Reddit. Proc. Assoc. Inf. Sci. Technol. 2020, 57, 320. [Google Scholar] [CrossRef]
- Fried, D.; Surdeanu, M.; Kobourov, S.; Hingle, M.; Bell, D. Analyzing the language of food on social media. In Proceedings of the 2014 IEEE International Conference on Big Data (Big Data), Washington, DC, USA, 27–30 October 2014; IEEE: New York, NY, USA, 2014; pp. 778–783. [Google Scholar]
- Widener, M.J.; Li, W. Using geolocated Twitter data to monitor the prevalence of healthy and unhealthy food references across the US. Appl. Geogr. 2014, 54, 189–197. [Google Scholar] [CrossRef]
- Aslam, S. Twitter by the Numbers: Stats, Demographics & Fun Facts. 2021. Available online: https://www.omnicoreagency.com/twitter-statistics/#:~:text=Twitter%20Demographics&text=There%20are%20262%20million%20International,users%20have%20higher%20college%20degrees (accessed on 11 February 2021).
- Clement, J. Twitter: Number of Active Users 2010–2019. In Statista [Internet]. Available online: https://www.statista.com/statistics/282087/number-of-monthly-active-twitter-users/ (accessed on 19 June 2020).
- Silver, N. The Odds of An Electoral College-Popular Vote Split Are Increasing. Five Thirty Eight, 31 October 2016. [Google Scholar]
- Hswen, Y.; Zhang, A.; Sewalk, K.C.; Tuli, G.; Brownstein, J.S.; Hawkins, J.B. Investigation of Geographic and Macrolevel Variations in LGBTQ Patient Experiences: Longitudinal Social Media Analysis. J. Med. Internet Res. 2020, 22, e17087. [Google Scholar] [CrossRef]
- Blei, D.M.; Ng, A.Y.; Jordan, M.I. Latent dirichlet allocation. J. Mach. Learn. Res. 2003, 3, 993–1022. [Google Scholar]
- Karami, A.; Gangopadhyay, A.; Zhou, B.; Kharrazi, H. Fuzzy Approach Topic Discovery in Health and Medical Corpora. Int. J. Fuzzy Syst. 2018, 20, 1334–1345. [Google Scholar] [CrossRef]
- Karami, A.; Elkouri, A. Political Popularity Analysis in Social Media. In Proceedings of the iConference Washington, Washington, DC, USA, 31 March–3 April 2019. [Google Scholar]
- Karami, A.; Pendergraft, N.M. Computational Analysis of Insurance Complaints: GEICO Case Study. In Proceedings of the International Conference on Social Computing, Behavioral-Cultural Modeling, & Prediction and Behavior Representation in Modeling and Simulation, Washington, DC, USA, 10–13 July 2018. [Google Scholar]
- Karami, A.; Collins, M. What do the US West Coast public libraries post on Twitter? Proc. Assoc. Inf. Sci. Technol. 2018, 55, 216–225. [Google Scholar] [CrossRef]
- Karami, A.; Lundy, M.; Webb, F.; Turner-McGrievy, G.; McKeever, B.; McKeever, R. Identifying and Analyzing Health-Related Themes in Disinformation Shared by Conservative and Liberal Russian Trolls on Twitter. Int. J. Environ. Res. Public Health 2021, 18, 2159. [Google Scholar] [CrossRef] [PubMed]
- Hemsley, J.; Erickson, I.; Jarrahi, M.H.; Karami, A. Digital nomads, coworking, and other expressions of mobile work on Twitter. First Monday 2020. [Google Scholar] [CrossRef]
- Karami, A.; Anderson, M. Social media and COVID-19: Characterizing anti-quarantine comments on Twitter. Proc. Assoc. Inf. Sci. Technol. 2020, 57, e349. [Google Scholar] [CrossRef] [PubMed]
- Karami, A.; Webb, F. Analyzing health tweets of LGB and transgender individuals. Proc. Assoc. Inf. Sci. Technol. 2020, 57, 264. [Google Scholar] [CrossRef]
- Röder, M.; Both, A.; Hinneburg, A. Exploring the Space of Topic Coherence Measures. In Proceedings of the Eighth ACM International Conference on Web Search and Data Mining, Shanghai, China, 31 January–6 February 2015; ACM: New York, NY, USA, 2015; pp. 399–408. [Google Scholar]
- Rehurek, R.; Sojka, P. Software framework for topic modelling with large corpora. In Proceedings of the LREC 2010 Workshop on New Challenges for NLP Frameworks, Valletta, Malta, 22 May 2010. [Google Scholar]
- McCallum, A.K. Mallet: A Machine Learning for Language Toolkit; University of Massachusetts Amherst: Amherst, MA, USA, 2002. [Google Scholar]
- Lim, B.H.; Valdez, C.E.; Lilly, M.M. Making meaning out of interpersonal victimization: The narratives of IPV survivors. Violence Women 2015, 21, 1065–1086. [Google Scholar] [CrossRef]
- McHugh, M.L. Interrater Reliability: The Kappa statistic. Biochem. Med. 2012, 22, 276–282. [Google Scholar] [CrossRef]
- R Foundation for Statistical Computing: Vienna, Austria, 2002. Available online: http://www R-project org (accessed on 19 June 2020).
- Tukey, J.W. Comparing Individual Means in the Analysis of Variance. Biometrics 1949, 5, 99. [Google Scholar] [CrossRef]
- Kim, J.H.; Ji, P.I. Significance testing in empirical finance: A critical review and assessment. J. Empir. Financ. 2015, 34, 1–14. [Google Scholar] [CrossRef]
- Good, I. C140. Standardized tail-area prosabilities. J. Stat. Comput. Simul. 1982, 16, 65–66. [Google Scholar] [CrossRef]
- Benjamini, Y.; Hochberg, Y. Controlling the False Discovery Rate—A Practical and Powerful Approach to Multiple Testing. J. R. Stat. Soc. Ser. B Methodol. 1995, 57, 289–300. [Google Scholar] [CrossRef]
- Jafari, M.; Ansari-Pour, N. Why, When and How to Adjust Your P Values? Cell J. 2019, 20, 604–607. [Google Scholar]
- Sullivan, G.M.; Feinn, R. Using Effect Size—Or Why the P Value Is Not Enough. J. Grad. Med. Educ. 2012, 4, 279–282. [Google Scholar] [CrossRef]
- Cohen, J. Statistical Power Analysis for the Behavioral Sciences; Academic Press: Cambridge, MA, USA, 2013. [Google Scholar]
- Sawilowsky, S.S. New Effect Size Rules of Thumb. J. Mod. Appl. Stat. Methods 2009, 8, 26. [Google Scholar] [CrossRef]
- Cheung, A.C.K.; Slavin, R.E. How Methodological Features Affect Effect Sizes in Education. Educ. Res. 2016, 45, 283–292. [Google Scholar] [CrossRef]
- Newman, M.L.; Groom, C.J.; Handelman, L.D.; Pennebaker, J.W. Gender Differences in Language Use: An Analysis of 14,000 Text Samples. Discourse Process. 2008, 45, 211–236. [Google Scholar] [CrossRef]
- Akoglu, H. User’s guide to correlation coefficients. Turk. J. Emerg. Med. 2018, 18, 91–93. [Google Scholar] [CrossRef]
- Best Diets Overall. Available online: https://health.usnews.com/best-diet/best-diets-overall (accessed on 20 June 2020).
- Bangalore, S.; Fayyad, R.; Laskey, R.; Demicco, D.A.; Messerli, F.H.; Waters, D.D. Body-Weight Fluctuations and Outcomes in Coronary Disease. N. Engl. J. Med. 2017, 376, 1332–1340. [Google Scholar] [CrossRef]
- Niland, B.; Cash, B.D. Health Benefits and Adverse Effects of a Gluten-Free Diet in Non–Celiac Disease Patients. Gastroenterol. Hepatol. 2018, 14, 82–91. [Google Scholar]
- Krukowski, R.A.; Harvey-Berino, J.; Bursac, Z.; Ashikaga, T.; West, D.S. Patterns of success: Online self-monitoring in a web-based behavioral weight control program. Health Psychol. 2013, 32, 164–170. [Google Scholar] [CrossRef] [PubMed]
- Ko, H.-C.; Wang, L.-L.; Xu, Y.-T. Understanding the Different Types of Social Support Offered by Audience to A-List Diary-Like and Informative Bloggers. Cyberpsychol. Behav. Soc. Netw. 2013, 16, 194–199. [Google Scholar] [CrossRef]
- Dahl, A.A.; Hales, S.B.; Turner-McGrievy, G.M. Integrating social media into weight loss interventions. Curr. Opin. Psychol. 2016, 9, 11–15. [Google Scholar] [CrossRef]
- Loef, M.; Walach, H. The combined effects of healthy lifestyle behaviors on all cause mortality: A systematic review and meta-analysis. Prev. Med. 2012, 55, 163–170. [Google Scholar] [CrossRef] [PubMed]
- Harris, J.K.; Moreland-Russell, S.; Tabak, R.G.; Ruhr, L.R.; Maier, R.C. Communication about Childhood Obesity on Twitter. Am. J. Public Health 2014, 104, e62–e69. [Google Scholar] [CrossRef]
- Ryan, G.; Sfar-Gandoura, H. Disseminating research information through Facebook and Twitter (DRIFT): Presenting an evidence-based framework. Nurse Res. 2018, 26, 41–49. [Google Scholar] [CrossRef]
- Diabetes Prevention Program (DPP) Research Group. The Diabetes Prevention Program (DPP): Description of lifestyle intervention. Diabetes Care 2002, 25, 2165–2171. [Google Scholar] [CrossRef] [PubMed]
- Farinetti, A.; Zurlo, V.; Manenti, A.; Coppi, F.; Mattioli, A.V. Mediterranean diet and colorectal cancer: A systematic review. Nutrition 2017, 43–44, 83–88. [Google Scholar] [CrossRef] [PubMed]
- Grosso, G.; Bella, F.; Godos, J.; Sciacca, S.; Del Rio, D.; Ray, S.; Galvano, F.; Giovannucci, E.L. Possible role of diet in cancer: Systematic review and multiple meta-analyses of dietary patterns, lifestyle factors, and cancer risk. Nutr. Rev. 2017, 75, 405–419. [Google Scholar] [CrossRef]
- Myrick, J.G. Connections between viewing media about President Trump’s dietary habits and fast food consumption intentions: Political differences and implications for public health. Appetite 2020, 147, 104545. [Google Scholar] [CrossRef] [PubMed]
- Chan, E.Y. Political orientation and physical health: The role of personal responsibility. Pers. Individ. Differ. 2019, 141, 117–122. [Google Scholar] [CrossRef]
- Mediterranean Diet for Heart Health. In Mayo Clinic [Internet]. Available online: https://www.mayoclinic.org/healthy-lifestyle/nutrition-and-healthy-eating/in-depth/mediterranean-diet/art-20047801 (accessed on 20 December 2020).
- State Snapshots|CDC. 17 June 2020. Available online: https://www.cdc.gov/chronicdisease/programs-impact/state-snapshots/index.htm (accessed on 24 January 2021).
- Kharrazi, H.; Gamache, R.; Weiner, J. Role of Informatics in Bridging Public and Population Health. In Public Health Informatics and Information Systems; Springer: Berlin, Germany, 2020; pp. 59–79. [Google Scholar]
- Hatef, E.; Ma, X.; Rouhizadeh, M.; Singh, G.; Weiner, J.P.; Kharrazi, H. Assessing the Impact of Social Needs and Social Determinants of Health on Health Care Utilization: Using Patient and Community-Level Data. Popul. Health Manag. 2020. [Google Scholar] [CrossRef]
- Angrosino, M.V. Naturalistic Observation; Routledge: New York, NY, USA, 2016. [Google Scholar]
- Subramanian, S.V.; Huijts, T.; Perkins, J.M. Association between political ideology and health in Europe. Eur. J. Public Health 2009, 19, 455–457. [Google Scholar] [CrossRef]
- Hughes, A.; Wojcik, S. 10 Facts about Americans and Twitter; Pew Research Center: Washington, DC, USA, 2019. [Google Scholar]
- Dredze, M.; Paul, M.J.; Bergsma, S.; Tran, H. Carmen: A Twitter Geolocation System with Applications to Public Health. In Proceedings of the AAAI Workshop on Expanding the Boundaries of Health Informatics Using AI (HIAI), Bellevue, WA, USA, 14–15 July 2013; p. 45. [Google Scholar]
- Turner-McGrievy, G.; Wirth, M.D.; Hill, K.L.; Dear, E.R.; Hébert, J.R. Examining commonalities and differences in food groups, nutrients, and diet quality among popular diets. Clin. Nutr. ESPEN 2021, 41, 377–385. [Google Scholar] [CrossRef] [PubMed]


| Label | Top Words per Topic |
|---|---|
| Self-Monitoring | diet, pounds, days, lost, weeks, months, month, past, year, ago |
| Weight Loss | weight, loss, diet, program, weightloss, tips, plan, workout, fast, healthy |
| Diet Information | diet, healthy, tips, balanced, eat, maintain, care, strong, body, essential |
| Diabetes | diet, diabetes, blood, type, high, pressure, improve, pain, stress, reduce |
| Diet Sodas | diet, coke, drink, pepsi, soda, caffeine, drpepper, tastes, drank, cherry |
| Diet Promotion | diet, work, bad, exercise, people, good, body, word, fad, matter |
| Diet Pill | weight, diet, fat, pill, belly, fast, burn, weightloss, garcinia, appetite |
| Unhealthy Diet | diet, eat, pizza, ice, cream, lunch, dinner, donuts, candy, cookies |
| Gluten-Free Diet | diet, recipes, paleo, gluten-free, special, cookbook, food, delicious, healthy, mediterranean |
| Vegetarian/Vegan Diets | diet, vegan, vegetarian, food, make, eat, plantbased, parents, organic, meat |
| Diet Education | diet, video, plan, day, meal, paleo, guide, playlist, book, ketogenic |
| Recipes | diet, chicken, cheese, salad, recipe, soup, rice, fries, pizza, pasta |
| Balanced Diet | diet, balanced, chocolate, protein, cream, ice, milk, cake, cookie, snack |
| Paleo/HCG Diets | diet, week, weight, plan, lose, paleo, hcg, day, meal, menu |
| Healthy Diet | diet, healthy, foods, fruits, daily, veggies, great, vegetables, fiber, superfoods |
| Physical Activity | weightloss, fitness, diet, health, gym, workout, fatloss, gymtime, yoga, bodybuilding |
| Mediterranean Diet | diet, risk, cancer, mediterranean, heart, disease, reduce, diabetes, prevent, brain |
| Detox | diet, detox, water, day, tea, green, body, juice, cleanse, drink |
| Ketogenic/LCHF Diets | diet, ketogenic, based, keto, plant, great, lchf, lifestyle, food, lowcarb |
| Obesity | diet, gut, health, brain, obesity, metabolism, immune, microbiome, bacteria, dna |
| Celebrity Diets | diet, workout, plan, routine, secrets, celebrity, reveals, kardashian, body, kim |
| Diet Change | diet, change, big, food, people, make, health, poor, mental, habits |
| Nutrient Information | health, wellness, nutrition, weightloss, diet, foods, natural, vitamin, supplement, lowcarb |
| No-Sugar Diet | diet, soda, sugar, cut, drink, bad, water, cutting, regular, stop |
| Atkins Diet | diet, atkins, low, carb, fat, high, protein, calorie, fiber, cholesterol |
| Healthy Diet Planning | diet, food, healthy, eat, nutrition, make, lifestyle, healthier, live, tips |
| Yo-Yo Dieting | dieting, eating, extension, yo-yo, tips, make, good, eat, avoid, loseweight |
| AAA Diet | fitness, weightloss, health, diet, fatloss, aaadiet, tips, burnfat, natural, loseweight |
| Fitness Inspiration | weight, diet, healthy, exercise, fatloss, fitspiration, tips, solution, weightloss, nutrition |
| Fitness Program | diet, start, today, day, tomorrow, back, week, gonna, working, strict, ready, month, gym |
| Fitness Information | diet, fitness, goals, workingout, leanmuscle, common, mistakes, biggest, myths, success |
| Dietary Log | eat, diet, feel, cut, meat, good, dairy, thing, food, made |
| Topic | ANOVA | Tukey Multiple Comparison Test | ||
|---|---|---|---|---|
| F-Value | Rep vs. Swing | Rep vs. Dem | Dem vs. Swing | |
| Self-Monitoring | 457.6 * | NS | * Rep > Dem | * Dem < Swing |
| Weight Loss | 2155.6 * | * Rep > Swing | * Rep < Dem | * Dem > Swing |
| Diet Information | 161.3 * | * Rep < Swing | NS | * Dem < Swing |
| Diabetes | 28.6 * | * Rep < Swing | * Rep < Dem | NS |
| Diet Sodas | 1433.7 * | NS | * Rep > Dem | * Dem < Swing |
| Diet Promotion | 392.3 * | * Rep < Swing | * Rep > Dem | * Dem < Swing |
| Diet Pill | 68.4 * | * Rep > Swing | NS | * Dem > Swing |
| Unhealthy Diet | 1342.9 * | * Rep > Swing | * Rep > Dem | * Dem < Swing |
| Gluten Free Diet | 742.5 * | * Rep > Swing | * Rep > Dem | * Dem < Swing |
| Vegetarian/Vegan Diets | 36.1 * | * Rep < Swing | NS | * Dem < Swing |
| Diet Education | 89.8 * | * Rep < Swing | * Rep > Dem | * Dem < Swing |
| Recipes | 111.8 * | NS | * Rep > Dem | * Dem < Swing |
| Balanced Diet | 1402.6 * | * Rep > Swing | * Rep > Dem | * Dem < Swing |
| Paleo/HCG Diets | 430.3 * | * Rep > Swing | * Rep > Dem | * Dem < Swing |
| Healthy Diet Information | 405.2 * | * Rep < Swing | * Rep > Dem | * Dem < Swing |
| Physical Activity | 9349.9 * | * Rep > Swing | * Rep < Dem | * Dem > Swing |
| Mediterranean Diet | 81.1 * | * Rep < Swing | * Rep < Dem | * Dem < Swing |
| Detox | 349.8 * | * Rep > Swing | * Rep > Dem | * Dem < Swing |
| Ketogenic/LCHF Diets | 292.4 * | * Rep < Swing | * Rep > Dem | * Dem < Swing |
| Obesity | 79.1 * | * Rep < Swing | * Rep < Dem | * Dem > Swing |
| Celebrity Diets | 45.7 * | NS | * Rep < Dem | * Dem > Swing |
| Diet Change | 29.4 * | * Rep < Swing | NS | * Dem < Swing |
| Nutrient Information | 2629.8 * | NS | * Rep < Dem | * Dem > Swing |
| No-Sugar Diet | 461.1 * | * Rep < Swing | * Rep > Dem | * Dem < Swing |
| Atkins Diet | 35.6 * | * Rep < Swing | NS | * Dem < Swing |
| Healthy Diet Planning | 104.8 * | NS | * Rep > Dem | * Dem < Swing |
| Yo-Yo Dieting | 183.6 * | * Rep < Swing | * Rep > Dem | * Dem < Swing |
| AAA Diet | 9386.1 * | NS | * Rep < Dem | * Dem > Swing |
| Fitness Inspiration | 4788.5 * | NS | * Rep < Dem | * Dem > Swing |
| Fitness Program | 879 * | * Rep > Swing | * Rep > Dem | * Dem < Swing |
| Fitness Information | 72.1 * | NS | * Rep < Dem | * Dem > Swing |
| Dietary Log | 954 * | NS | * Rep > Dem | * Dem < Swing |
| Topic | Mean of Cohen’s d of Sample Sizes | Effect Size | ||||
|---|---|---|---|---|---|---|
| Rep vs. Swing | Rep vs. Dem | Dem vs. Swing | Rep vs. Swing | Rep vs. Dem | Dem vs. Swing | |
| Self-Monitoring | NS | 0.1 | 0.2 | NS | Very Small | Small |
| Weight Loss | 0.2 | 0.2 | 0.2 | Small | Small | Small |
| Diet Information | 0.1 | NS | 0.1 | Very Small | NS | Very Small |
| Diabetes | 0.1 | 0.1 | NS | Very Small | Very Small | NS |
| Diet Sodas | NS | 0.1 | 0.2 | NS | Very Small | Small |
| Diet Promotion | 0.2 | 0.1 | 0.1 | Small | Very Small | Very Small |
| Diet Pill | 0.1 | NS | 0.2 | Very Small | NS | Small |
| Unhealthy Diet | 0.1 | 0.2 | 0.2 | Very Small | Small | Small |
| Gluten Free Diet | 0.1 | 0.2 | 0.1 | Very Small | Small | Very Small |
| Vegetarian/Vegan Diets | 0.1 | NS | 0.2 | Very Small | NS | Small |
| Diet Education | 0.2 | 0.2 | 0.1 | Small | Small | Very Small |
| Recipes | NS | 0.2 | 0.2 | NS | Small | Small |
| Balanced Diet | 0.2 | 0.2 | 0.1 | Small | Small | Very Small |
| Paleo/HCG Diets | 0.1 | 0.1 | 0.2 | Very Small | Very Small | Small |
| Healthy Diet | 0.1 | 0.2 | 0.2 | Very Small | Small | Small |
| Physical Activity | 0.3 | 0.4 | 0.4 | Small | Small | Small |
| Mediterranean Diet | 0.2 | 0.1 | 0.2 | Small | Very Small | Small |
| Detox | 0.1 | 0.2 | 0.1 | Very Small | Small | Very Small |
| Ketogenic/LCHF Diets | 0.1 | 0.2 | 0.3 | Very Small | Small | Small |
| Obesity | 0.1 | 0.1 | 0.2 | Very Small | Very Small | Small |
| Celebrity Diets | NS | 0.2 | 0.2 | NS | Small | Small |
| Diet Change | 0.1 | NS | 0.1 | Very Small | NS | Very Small |
| Nutrient Information | NS | 0.3 | 0.3 | NS | Small | Small |
| No-Sugar Diet | 0.2 | 0.1 | 0.3 | Small | Very Small | Small |
| Atkins Diet | 0.2 | NS | 0.2 | Small | NS | Small |
| Healthy Diet Planning | NS | 0.2 | 0.2 | NS | Small | Small |
| Yo-Yo Dieting | 0.2 | 0.1 | 0.1 | Small | Very Small | Very Small |
| AAA Diet | NS | 0.3 | 0.4 | NS | Small | Small |
| Fitness Inspiration | NS | 0.3 | 0.3 | NS | Small | Small |
| Fitness Program | 0.2 | 0.2 | 0.2 | Small | Small | Small |
| Fitness Information | NS | 0.2 | 0.1 | NS | Small | Very Small |
| Dietary Log | NS | 0.2 | 0.2 | NS | Small | Small |
| Topics | Rank among Top-10 Topics | Class | ||
|---|---|---|---|---|
| Dem (D) | Rep (R) | Swing (S) | ||
| Self-Monitoring | - | 8 | 9 | RS |
| Weight Loss | 4 | - | - | D |
| Diet Information | - | - | 10 | S |
| Diabetes | 9 | - | - | D |
| Diet Sodas | 7 | 1 | 1 | DRS |
| Diet Promotion | - | - | 7 | S |
| Unhealthy Diet | 8 | 2 | 2 | DRS |
| Gluten-Free Diet | - | 6 | - | R |
| Balanced Diet | - | 5 | - | R |
| Healthy Diet | - | 7 | 4 | RS |
| Physical Activity | 1 | - | - | D |
| Mediterranean Diet | 6 | 9 | 6 | DRS |
| Nutrient Information | 5 | - | - | D |
| No-Sugar Diet | - | 10 | 8 | RS |
| AAA Diet | 2 | - | - | D |
| Fitness Inspiration | 3 | - | - | D |
| Fitness Program | 10 | 3 | 5 | DRS |
| Dietary Log | - | 4 | 3 | RS |
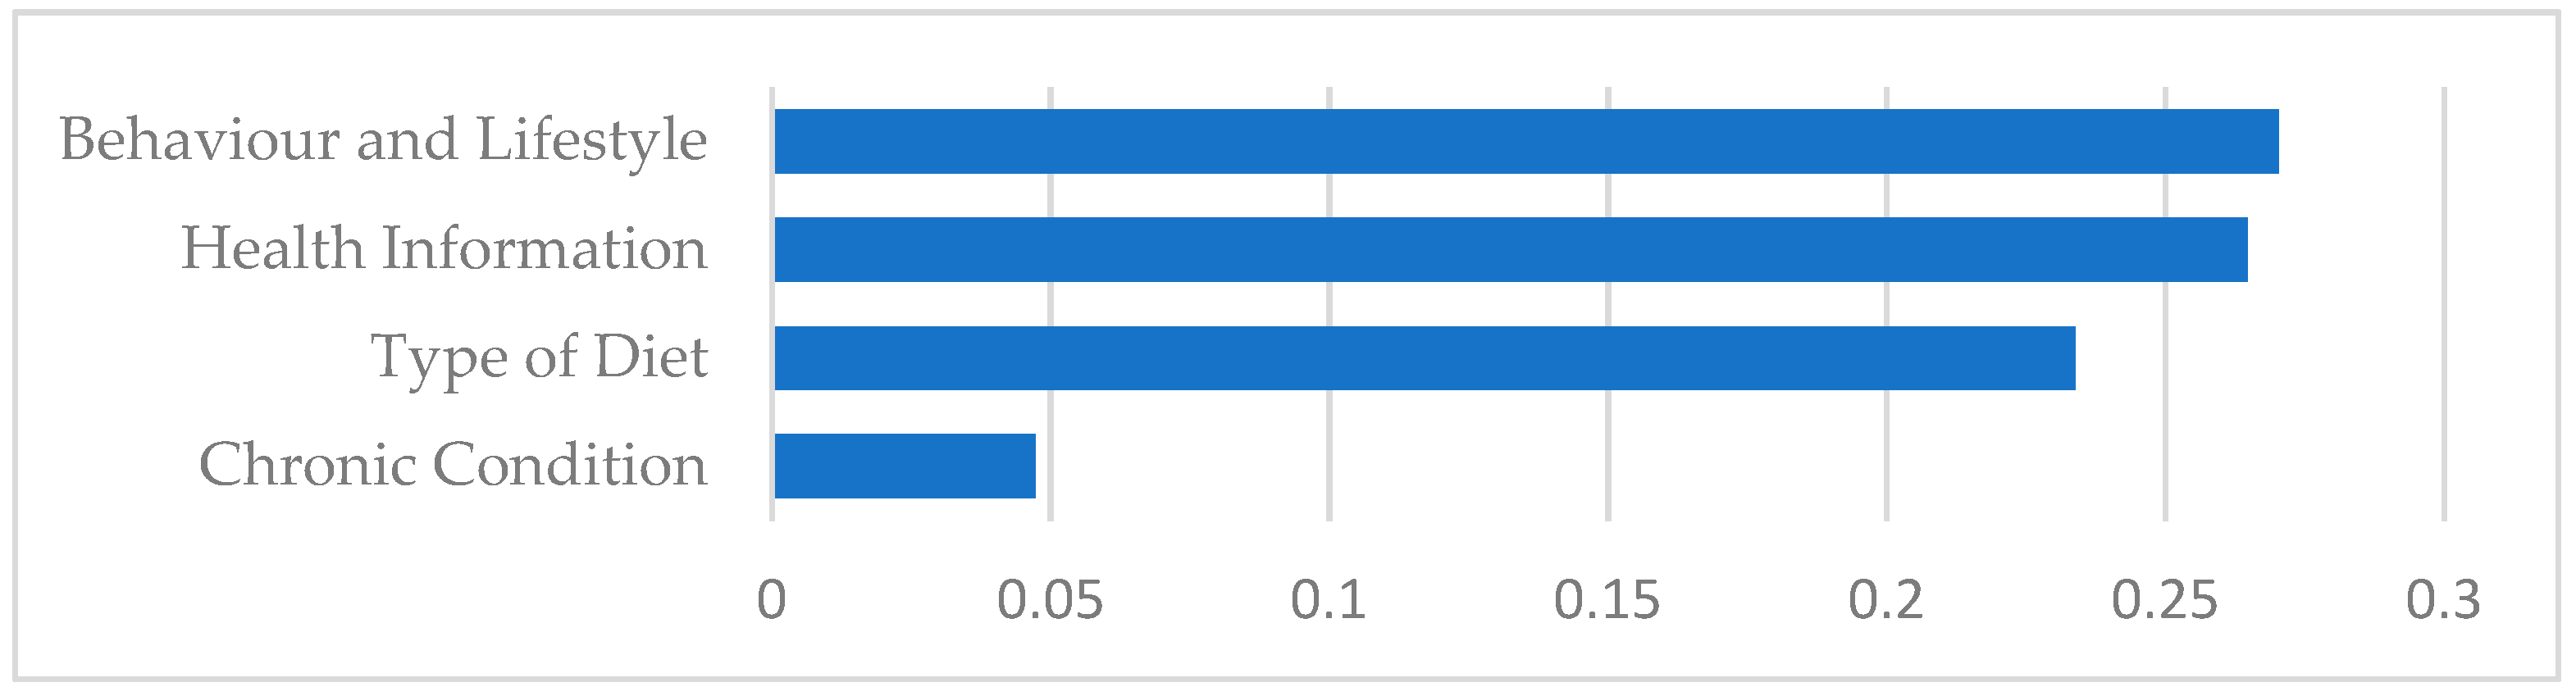
| Category | Behavior and Lifestyle | Health Information | Chronic Condition | Type of Diet |
|---|---|---|---|---|
| Topics | Self-Monitoring Diet Sodas Unhealthy Diet Dietary Log Diet Promotion Physical Activity Healthy Diet Planning Fitness Inspiration Fitness Program Dietary Log | Weight Loss Diet Information Diet Pill Diet Education Recipes Healthy Diet Information Celebrity Diets Diet Change Nutrient Information No-Sugar Diet Fitness Information | Diabetes Obesity | Gluten-Free Diet Vegetarian/Vegan Diets Balanced Diet Paleo/HCG Diets Mediterranean Diet Detox Ketogenic/LCHF Diets Atkins Diet Yo-Yo Dieting AAA Diet |
| Category | ANOVA | Tukey Multiple Comparison Test | ||
|---|---|---|---|---|
| F-Value | Rep vs. Swing | Rep vs. Dem | Dem vs. Swing | |
| Behavior and Lifestyle | 28.1 * | * Rep > Swing | NS | * Dem > Swing |
| Health Information | 453.1 * | * Rep < Swing | * Rep < Dem | * Dem > Swing |
| Chronic Condition | 94.4 * | * Rep < Swing | * Rep < Dem | NS |
| Type of Diet | 74.4 * | * Rep > Swing | * Rep > Dem | * Dem > Swing |
| Category | Mean of Cohen’s d of Sample Sizes | Effect Size | ||||
|---|---|---|---|---|---|---|
| Rep vs. Swing | Rep vs. Dem | Dem vs. Swing | Rep vs. Swing | Rep vs. Dem | Dem vs. Swing | |
| Behavior and Lifestyle | 0.1 | NS | 0.1 | Very Small | NS | Very Small |
| Health Information | 0.2 | 0.2 | 0.2 | Small | Small | Small |
| Chronic Condition | 0.2 | 0.1 | NS | Small | Very Small | NS |
| Type of Diet | 0.3 | 0.1 | 0.1 | Small | Very Small | Very Small |
Publisher’s Note: MDPI stays neutral with regard to jurisdictional claims in published maps and institutional affiliations. |
© 2021 by the authors. Licensee MDPI, Basel, Switzerland. This article is an open access article distributed under the terms and conditions of the Creative Commons Attribution (CC BY) license (https://creativecommons.org/licenses/by/4.0/).
Share and Cite
Karami, A.; Dahl, A.A.; Shaw, G., Jr.; Valappil, S.P.; Turner-McGrievy, G.; Kharrazi, H.; Bozorgi, P. Analysis of Social Media Discussions on (#)Diet by Blue, Red, and Swing States in the U.S. Healthcare 2021, 9, 518. https://doi.org/10.3390/healthcare9050518
Karami A, Dahl AA, Shaw G Jr., Valappil SP, Turner-McGrievy G, Kharrazi H, Bozorgi P. Analysis of Social Media Discussions on (#)Diet by Blue, Red, and Swing States in the U.S. Healthcare. 2021; 9(5):518. https://doi.org/10.3390/healthcare9050518
Chicago/Turabian StyleKarami, Amir, Alicia A. Dahl, George Shaw, Jr., Sruthi Puthan Valappil, Gabrielle Turner-McGrievy, Hadi Kharrazi, and Parisa Bozorgi. 2021. "Analysis of Social Media Discussions on (#)Diet by Blue, Red, and Swing States in the U.S." Healthcare 9, no. 5: 518. https://doi.org/10.3390/healthcare9050518
APA StyleKarami, A., Dahl, A. A., Shaw, G., Jr., Valappil, S. P., Turner-McGrievy, G., Kharrazi, H., & Bozorgi, P. (2021). Analysis of Social Media Discussions on (#)Diet by Blue, Red, and Swing States in the U.S. Healthcare, 9(5), 518. https://doi.org/10.3390/healthcare9050518