Article

Temperature and Seepage Effects on 3D Active Earth Pressure of Unsaturated Retaining Walls

1
School of Civil Engineering, Central South University, Changsha 410075, China
2
Shenzhen Municipal Group Co., Ltd., Shenzhen 518000, China
*
Author to whom correspondence should be addressed.
Mathematics 2026, 14(4), 645; https://doi.org/10.3390/math14040645
Submission received: 20 December 2025 / Revised: 30 January 2026 / Accepted: 10 February 2026 / Published: 12 February 2026
(This article belongs to the Special Issue Multiscale Modeling in Engineering and Mechanics, 2nd Edition)

Abstract

Temperature and seepage are critical factors influencing the stability of unsaturated retaining walls, as they modulate soil shear strength through alterations in matric suction. This study proposes a three-dimensional analytical framework for evaluating active earth pressure under thermal and seepage conditions. With a kinematic upper-bound approach, temperature-dependent suction evolution and steady-state seepage are incorporated into a horn-shaped failure mechanism. The proposed method is validated against published analytical/numerical solutions, confirming its reliability. A systematic parametric study is conducted to examine how temperature, seepage velocity, wall geometry, and soil pore characteristics affect the active earth pressure behavior. The results reveal distinct behavioral trends depending on soil type: for sand, the active earth pressure increases with rising temperature, indicating reduced stability; conversely, for clay, it decreases with temperature elevation, suggesting enhanced stability. While seepage has minimal impact on sand, it exhibits a clear directional dependence in clays, with infiltration increasing active thrust and evaporation promoting stability through suction recovery. Three-dimensional analysis yields substantially lower earth pressure values compared with conventional two-dimensional approaches, highlighting potential design economies. The proposed method provides engineers with a practical tool for coupled thermal hydraulic mechanical analysis of retaining walls in unsaturated fills, facilitating more realistic and cost-effective designs under varying environmental conditions.

1. Introduction

The stability assessment of retaining structures is a fundamental challenge in geotechnical engineering, which is complicated by multiple interacting factors such as seismic loading, thermal effects, seepage, and soil properties. Although reliable assessment methods remain a research priority, conventional approaches are often limited. These methods typically rely on two-dimensional plane-strain assumptions and employ classical Coulomb or Rankine theory [1], tending to yield conservative results primarily due to their inability to account for partially saturated conditions or three-dimensional strain effects.
Theoretical advances in this field originated from the concept of matric suction, defined as the pressure difference between pore water and pore air [2]. Its incorporation into effective stress theory established a key foundation for understanding suction’s role in soil strength. Subsequent progress included the development of the soil–water characteristic curve (SWCC). Based on pore-size distribution theory, the SWCC provides a closed-form solution [3], offering a mathematical model that links suction, water content, and permeability, thereby enabling coupled hydro-mechanical analysis. This framework was further extended through a dual-stress variable approach, in which net stress and matric suction were treated as independent state variables [4]. This led to a systematic theory characterizing suction’s influence on mechanical behavior, validated through experiments. Practical application was advanced by shear-strength prediction models that utilized SWCC normalization [5]. The integration of thermal effects marked a significant advance, pioneered by Romero et al. [6], who elevated temperature to an explicit variable within the dual-stress framework, resulting in the first practical thermo-hydro-mechanical coupled model. Later, Griffiths and Lu [7] solved for matric suction distributions under steady seepage conditions using van Genuchten’s parameterization. Concurrently, Lu and Likos [8] refined the theoretical foundations; their analysis of conceptual differences between major stress frameworks led to the seminal “suction stress” concept. Recent work by Li and Yang [9] applied these principles to stability assessment. They established an analytical framework using limit-analysis upper-bound approaches to evaluate retaining wall stability under steady seepage. However, the limitations of conventional two-dimensional analysis are well documented. The plane-strain methods may overestimate earth pressure [10] and fail to capture critical three-dimensional effects. The governing role of matric suction in unsaturated soil behavior is firmly established [11,12,13]. For instance, backfill soils experience continuous moisture changes; in such environments, soil type, seepage rate, and geometry collectively influence stability through suction dissipation, which reduces shear strength. The necessity of incorporating seepage effects has been quantitatively confirmed through slope-stability analyses under rainfall infiltration [14].
The influence of temperature is also increasingly recognized. The SWCC serves as a key link between thermal conditions and unsaturated soil behavior. Studies confirm that temperature variations modify water viscosity, surface tension, and air–water interface properties [15,16,17,18], thereby altering the SWCC and soil permeability. Furthermore, matric suction functions as a coupling parameter across scales. At the microscale, it is governed by Laplace pressure at soil interfaces [8]; at the macroscale, it manifests as a suction stress field controlled jointly by temperature and seepage. Experiments on MX-80 bentonite show that temperature-induced changes in water retention can surpass those from air–water tension alone [19]. Matric suction enhances shear strength by increasing soil stiffness and modifying the interparticle friction angle [20]. These findings confirm that unsaturated soil behavior is governed by coupled seepage–thermal interactions, which differ fundamentally from saturated soil mechanics [21]. Despite this understanding, current research often examines seepage and thermal effects in isolation [22,23], highlighting a clear need for integrated analysis.
The shortcomings of 2D analysis have motivated the development of 3D methods. The creation of three-dimensional kinematically admissible failure mechanisms has significantly advanced limit analysis [24]. This methodology applies the virtual work principle and ideal plasticity to construct collapse mechanisms [25] and determines the minimum upper-bound solution by balancing external work rates and internal energy dissipation. This approach bypasses complex constitutive modeling, simplifying 3D stability assessments. Three primary motivations drive the adoption of 3D analysis in this context. First, few studies evaluate effective earth pressure for inclined walls with sloped backfill in 3D. Second, 2D analyses consistently produce overly conservative results compared to more realistic 3D predictions [26]. Third, spatial arching effects are prevalent in actual failure mechanisms [27]; accurate engineering representation requires three-dimensional consideration of these effects.
To address these gaps, this study presents a three-dimensional analytical framework based on the upper-bound theorem of limit analysis. The framework systematically incorporates thermal effects into active earth pressure calculations for retaining walls. To facilitate parametric studies and mechanistic interpretation, steady-state seepage (modeled in one-dimensional vertical flow) is adopted. This simplification allows for obtaining closed-form solutions to the coupled thermo-hydraulic equations, providing a clear benchmark. Within this framework, we employ a three-dimensional horn-shaped failure mechanism. By combining this mechanism with functional equilibrium equations, we analytically derive the active earth pressure coefficient ( K a ). A subsequent parametric study comprehensively evaluates the influences of 3D effects, temperature, seepage velocity, and key soil parameters on K a . This theoretical framework provides engineers with a practical tool for performing a simplified, yet coupled, thermo-hydro-mechanical failure analysis.

2. Problem Definition and Methodology

2.1. Analytical Framework and Fundamental Assumptions

The distribution of matric suction in natural sedimentary soils is controlled by interacting hydraulic and thermal processes, including permeability, soil–water retention behavior, seepage conditions, and temperature-dependent interfacial effects. For retaining walls, where the unsaturated backfill can be reasonably treated as being in a long-term stabilized state, this study focuses on stability under one-dimensional steady vertical seepage while accounting for thermal influences.
To obtain an analytically tractable coupled thermal–hydraulic–mechanical formulation, a quasi-static framework is adopted with the following assumptions. Seepage is idealized as a one-dimensional vertical steady flow with a constant flux q (negative for infiltration and positive for evaporation). The temperature field is assumed to be uniform ( T constant), and the soil–water contact angle is θ . Pore water is treated as incompressible, which is appropriate for the considered temperature range and steady flow conditions because water density variations are minor (<2% over 0–50 °C) and gas compressibility has negligible influence on the steady suction profile governed by Darcy’s law. The analysis follows a two-step quasi-static procedure: the steady matric suction (and suction stress) distribution is first established under the prescribed seepage and thermal conditions, and the resulting suction field is then taken as a fixed background state in the subsequent kinematic upper-bound limit analysis.
Accordingly, the proposed model is most suitable for long-term stability assessment under sustained environmental loading (e.g., seasonal thermal variations and steady infiltration/evaporation), where the suction field can be assumed to reach a steady state prior to failure. It is not intended for transient conditions such as rapid rainfall infiltration or abrupt thermal shocks.

2.2. Introduction of Matric Suction and Soil–Water Characteristic Curves

The shear strength of soils is crucial for calculating active earth pressure in unsaturated conditions. Therefore, accurately defining its characteristics is essential. Currently, the Mohr–Coulomb failure criterion combined with the effective stress principle is widely adopted to describe the shear strength of unsaturated soils. This approach has gained broad acceptance among researchers within the classical soil mechanics framework as it effectively incorporates the influence of matric suction in unsaturated soils. In this context, an effective stress formulation was introduced for unsaturated soils [28] that considers three key parameters: net normal stress σ u a , matric suction u a u w , and the effective stress parameter χ . Their proposed expression for effective stress in unsaturated soils is represented as
σ = σ u a + χ u a u w
where σ represents the effective stress, σ denotes the total stress, u a is the pore air pressure, and χ constitutes the effective stress parameter. The parameter χ quantitatively reflects the contribution of matric suction to the effective stress. For completely saturated soils ( χ = 1.0 ), this equation reduces to Terzaghi’s classical effective stress formulation, while for completely dry soils ( χ = 0.0 ), the matric suction effect vanishes. Consequently, for most unsaturated soil conditions, the effective stress parameter χ assumes values within the bounded range of 0.0 < χ < 1.0 , representing the transitional state between fully saturated and completely dry conditions. This parameterization provides a continuous theoretical framework that bridges conventional saturated soil mechanics with unsaturated soil behavior.
The soil–water characteristic curve (SWCC), describing the relationship between matric suction and water content, serves as a key indicator of a material’s water retention capacity. Numerous models have been developed to characterize the soil–water characteristic curve (SWCC). Among the predominant approaches are: a model introducing a pore-size distribution index, building on the foundational work of Bishop and Blight [29]; a framework that modifies the Mohr–Coulomb yield criterion to incorporate matric suction effects for unsaturated soils [30]; and a smooth, closed-form three-parameter model capable of fitting a broad range of SWCC data [31]. Given its superior fitting accuracy and wider applicability, the three-parameter model is adopted in this study. Its formulation is expressed as
θ = θ r + θ s θ r 1 + α u a u w n n 1 n
where θ , θ r , and θ s represent the volumetric water content, residual volumetric water content, and saturated volumetric water content, respectively. The parameters α and n are SWCC fitting coefficients. The parameter α corresponds to the inverse of the air-entry value and is generally expressed in units of m 1 or kPa 1 . The conversion relationship between these units is given by
α m 1 = α kPa 1 × γ w kN / m 3
In this study, the model adopts the unit of kPa 1 , with typical values ranging from 0.001 to 0.5 kPa 1 . The dimensionless parameter n characterizes the soil pore-size distribution, typically varying between 1.1 and 8.5 [32,33].

2.3. Unsaturated Soil Strength Theory

Lu and Likos [34] introduced the concept of suction stress to characterize matric suction’s influence on effective stress, proposing a modified version of Bishop’s effective stress equation:
σ = σ u a σ s
where suction stress ( σ s ) represents the contribution of matric suction to the effective stress state in unsaturated soils. This approach overcomes limitations in traditional effective stress representations while maintaining compatibility with conventional Mohr–Coulomb failure criteria. By combining the model with the effective saturation S e , the suction stress σ s is derived as
σ s = u a u w , u a u w 0 σ s = u a u w 1 + α u a u w n n 1 / n , u a u w > 0
Equation (5) consists of two distinct components: the first term represents the classical effective stress formulation for saturated soils ( σ = σ u w ), while the second term accounts for matric suction effects in unsaturated soils. In the present study focusing on limit analysis of unsaturated soils, the second term is adopted as the primary consideration. This selective approach is justified by the following technical rationale: the shear strength ( τ ) of unsaturated soils can be characterized using a modified Mohr–Coulomb criterion incorporating matric suction through the effective stress principle:
τ = c + σ u a tan φ σ s tan φ
where c and φ represent the effective cohesion and effective internal friction angle, respectively. The term σ s tan φ reflects the shear strength reduction effect and is conventionally referred to as the apparent cohesion ( c app ), expressed as follows:
c app = σ s tan φ

2.4. Matric Suction Under Steady-State Seepage and Thermal Effects

2.4.1. Steady-State 1D Vertical Seepage

The backfill is subject to moisture migration driven by infiltration and evaporation. Given the inherent complexity of unsaturated seepage, this study adopts a simplified one-dimensional vertical steady-state flow model to determine the matric suction distribution. This idealization enables a closed-form solution crucial for parametric analysis and mechanistic insight. This idealization provides a tractable benchmark; the deviation relative to multi-dimensional flow depends on boundary conditions. While multi-dimensional (2D or 3D) flow regimes may more accurately reflect some field conditions, they remain a subject for future investigation.
In unsaturated soils, hydraulic conductivity is described as a function of matric suction. In this study, the Gardner model is adopted to represent this hydraulic conductivity function, expressed as
k = k s e α u a u w
where k is the hydraulic conductivity and k s is the saturated hydraulic conductivity. Based on the definition of hydraulic head h m and Darcy’s law,
h m = u a u w γ w
q = k d h m + z d z
where h m is hydraulic head, γ w is the unit weight of water, q represents the water infiltration rate (negative) or evaporation rate (positive), and z denotes the vertical distance above the groundwater table. When there is neither infiltration nor evaporation in the soil, the following relationship holds:
u a u w = z γ w
Substituting Equations (8) and (9) into Equation (10) yields the differential equation governing seepage:
q = k s e α u a u w 1 γ w d u a u w d z + 1
Under one-dimensional steady-state seepage, the matric suction exhibits a vertical profile that varies with depth. At the water table (defined as z = 0 in this study), the matric suction is zero. Applying this boundary condition—i.e., u a u w = 0 at z = 0 —Equation (12) can be solved to obtain the analytical solution for the depth-dependent suction profile:
u a u w = 1 α ln 1 + q k s e γ w α z q k s
By combining the suction stress distribution formula under one-dimensional steady-state seepage conditions with the effective stress formulation incorporating matric suction, the shear strength can be expressed as
σ s = 1 α ln 1 + q k s e γ w α z q k s 1 + ln 1 + q k s e γ w α z q k s n n 1 / n
The above formulation represents the general analytical solution for suction stress under one-dimensional steady-state seepage conditions.

2.4.2. Physical Basis of Temperature Effects

Similarly, the influence of temperature on unsaturated soil strength fundamentally stems from temperature-dependent variations in matric suction. This suction stress ( σ s ) can be expressed as a temperature-dependent function:
σ s = ψ 1 + α ψ n n 1 / n
where ψ represents the temperature-affected matric suction, n is the pore-size distribution parameter for unsaturated soils (ranging 1.1–8.5), and α denotes inverse of air-entry value (ranging 0.001–0.5 kPa−1).
Furthermore, the matric suction in unsaturated soils under thermal influence can be expressed as follows:
ψ = ψ T r β + T β T r + T r
where T represents the temperature in Kelvin (with the reference state T r = 273.15 K = 0 °C) and ψ T r represents the matric suction at this baseline reference temperature. Based on the conventional expression for one-dimensional steady-state seepage at 0 °C, ψ T r can be obtained from
ψ T r = 1 α ln 1 + q k s e γ w α z q k s
where β represents the regression parameter related to various parameters of saturated soils, with β and β T r expressed as follows:
β = Δ h Δ h + a + b T r cos θ C
β T r = Δ h T r C 1
where θ C T represents the temperature-dependent soil–water contact angle, with a and b serving as temperature-influenced fitting parameters (typically taken as a = 0.11766 N/m and b = 0.0001535 N/(m·K)) [35], while Δ h denotes the specific immersion enthalpy per unit area, expressed as
Δ h = Δ h T r 1 T r 1 T 0.38
Here, Δ h T r denotes the specific immersion enthalpy per unit area at reference temperature T r (with characteristic reference values established for different soil types), while the cosine of the soil–water contact angle is given by
cos θ C = Δ h + T C 1 a + b T
where C 1 is a constant calculated as follows:
C 1 = Δ h T r + a + b T r cos θ C 0 T r
where θ C 0 is defined as the soil–water contact angle at the reference temperature [36].
By combining Equations (14)–(17), the distribution patterns of both matric suction ( ψ ) and suction stress ( σ s ) along the depth direction in unsaturated soils under one-dimensional steady-state seepage conditions, while accounting for thermal effects, can be derived as follows:
c app = 1 α tan φ ln 1 + q k s e γ w α z q k s β T r + T r β + T 1 + ln 1 + q k s e γ w α z q k s β T r + T r β + T n n 1 / n
σ s = 1 α ln 1 + q k s e γ w α z q k s β T r + T r β + T 1 + ln 1 + q k s e γ w α z q k s β T r + T r β + T n n 1 / n

3. Three-Dimensional Limit Analysis of Retaining Walls

The upper-bound theorem of limit analysis requires no stress analysis. It solves stability problems by applying the principle of virtual work, which balances the work rate due to external forces with the internal energy dissipation rates along a kinematically admissible failure mechanism. While most conventional methods for active earth pressure assume a two-dimensional plane-strain state, real soil behavior behind retaining walls is inherently three-dimensional. To bridge this gap, this study develops a three-dimensional evaluation model for the global failure of backfill soil. The model combines upper-bound limit analysis with a three-dimensional horn-shaped failure mechanism to assess the active earth pressure under realistic spatial conditions.

3.1. 3D Rotational Failure Mechanism

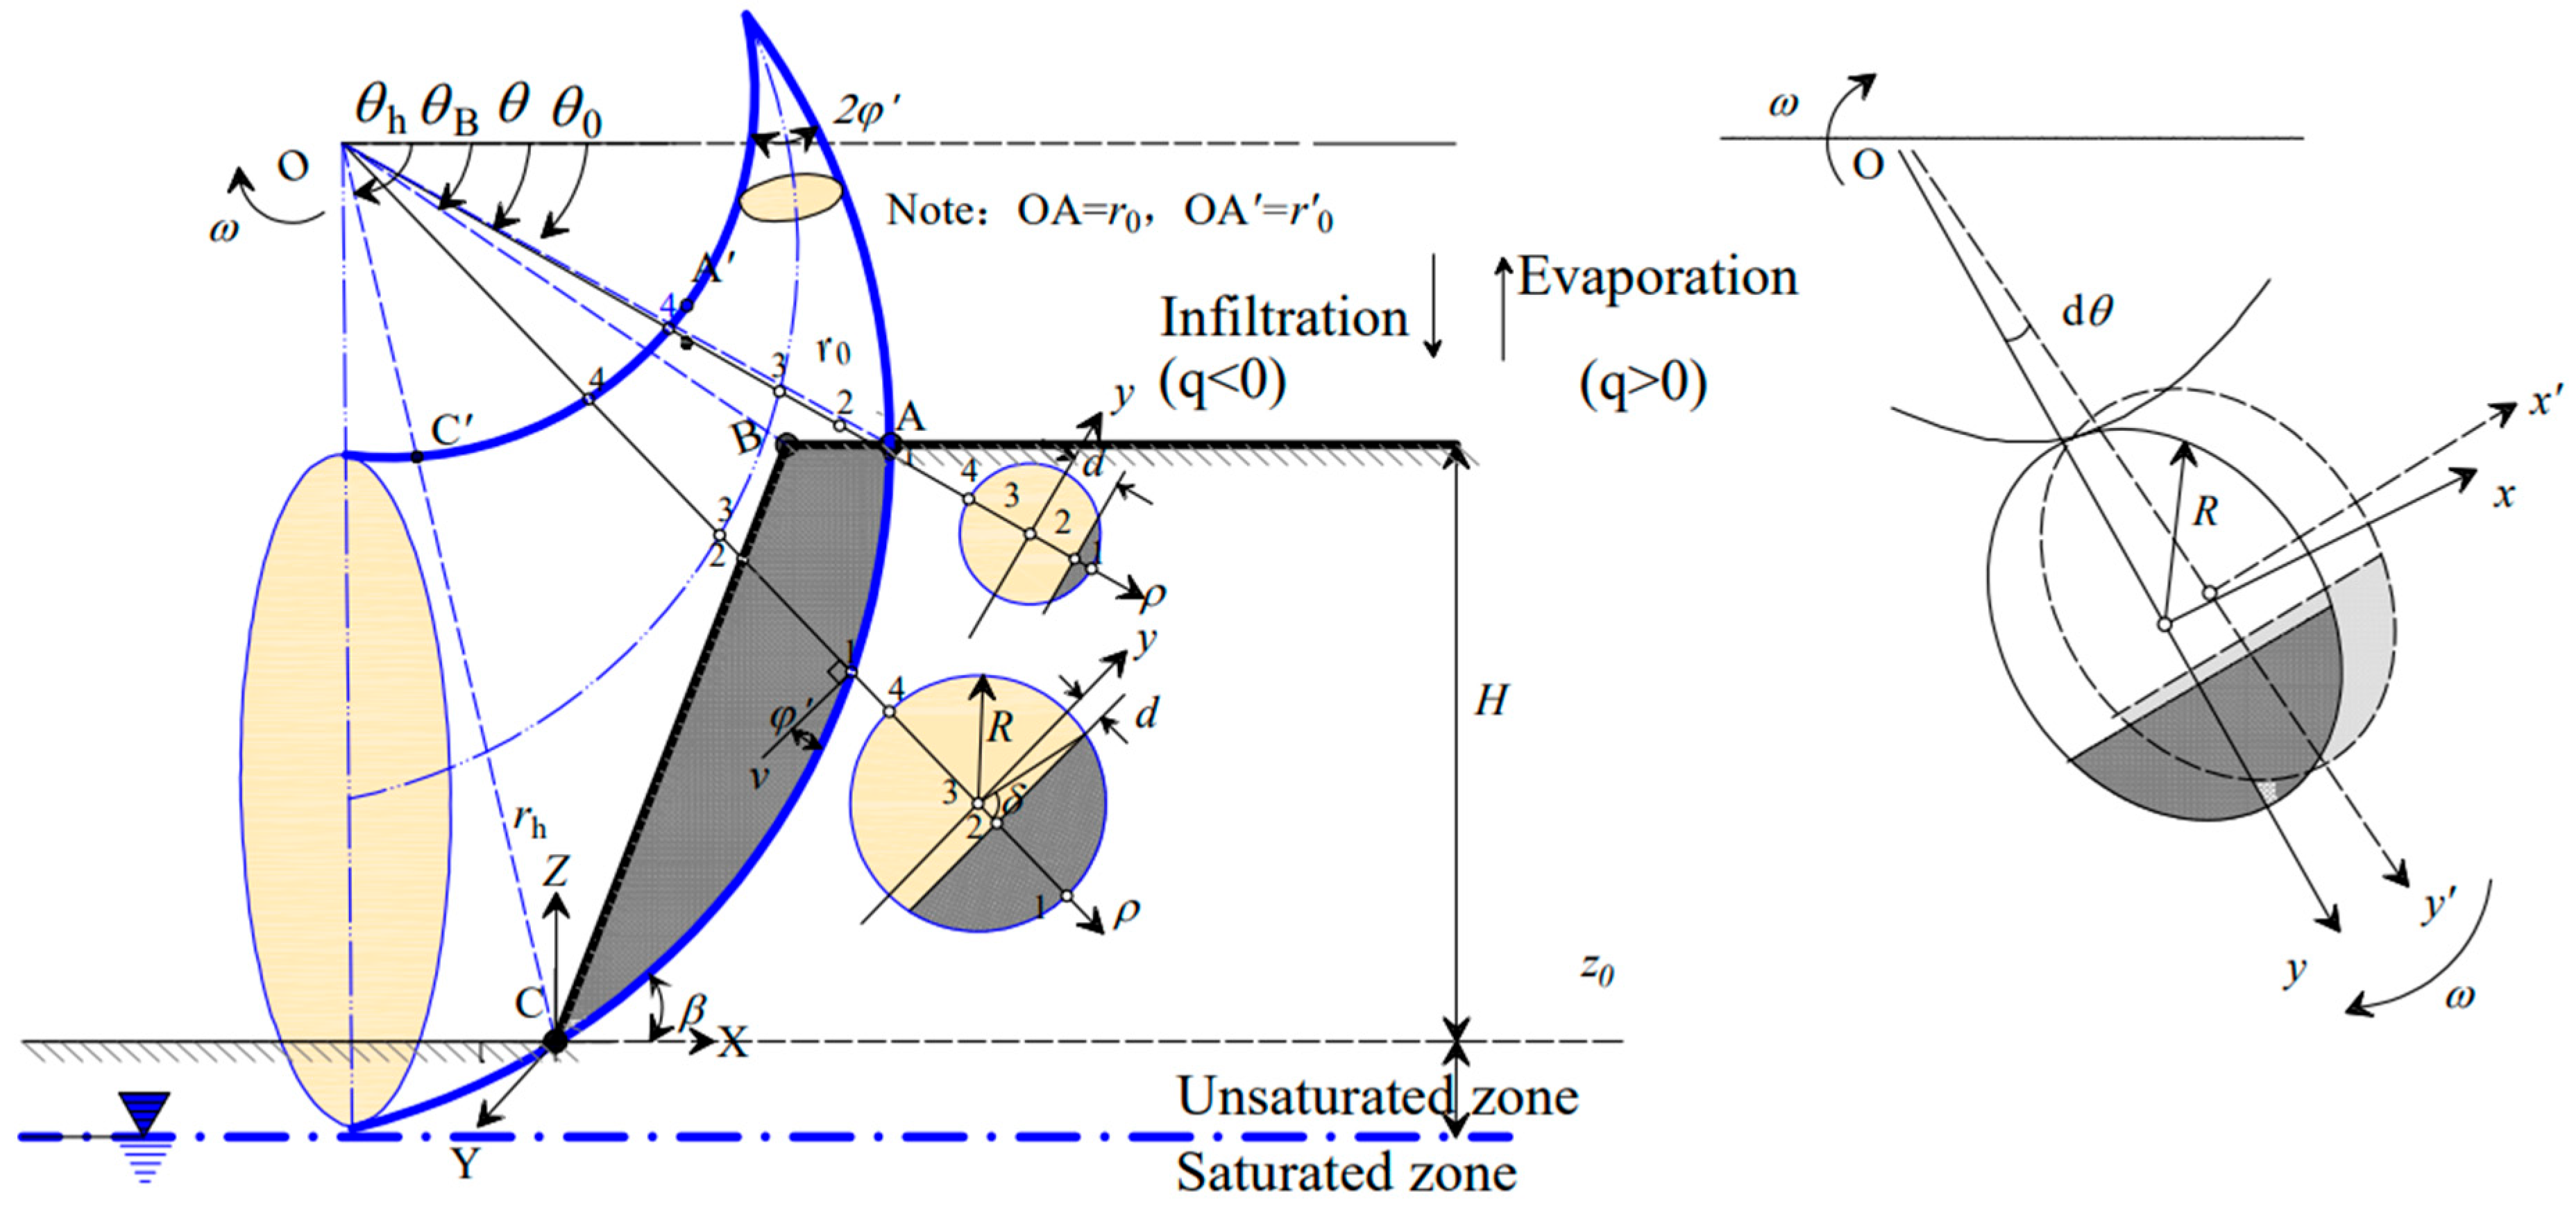
The upper-bound theorem of limit analysis (LA) has been established as an important method for stability analysis of slopes and retaining walls, with demonstrated advantages in addressing stability problems [37,38,39,40,41]. The LA method constructs a kinematically admissible failure mechanism, where the true limit load corresponds to the minimum value that equilibrates the external virtual work with the internal virtual energy dissipation:
V σ * ij ε ˙ * ij d V A T i u ˙ i d A + V F i u ˙ * i d V
where σ * ij represents the stress tensor related to the strain rate ε ˙ * , and u ˙ i denotes the velocity vector, while T i and F i signify the surface traction and body force vectors, respectively. Additionally, A and V correspond to the boundary of surface forces and the volume of body forces, respectively. This study employs the ultimate failure mechanism for retaining walls, as illustrated in Figure 1.
As illustrated in Figure 1, the phreatic surface is assumed to be located at a depth z 0 below the toe of the slope, subject to one-dimensional steady-state seepage. The soil profile is divided into a saturated zone and an unsaturated zone, with the retaining wall structure situated in the unsaturated zone. The analysis considers a retaining wall of height H , width B and an inclination of β , embedded in a homogeneous cohesive–frictional soil. The soil’s mechanical properties are characterized by its cohesion c and internal friction angle φ . The failure mechanism consists of a rigid block ABC rotating about center O with angular velocity ω . The lower (AC) and upper (A’C’) boundaries of the failure mechanism are defined by two logarithmic spiral curves, r and r respectively, expressed as:
r θ = r 0 e θ θ 0 tan φ
where θ 0 represents the initial failure angle, while θ denotes a general angular coordinate during the failure process ( θ 0 θ θ h ). At the incipient of collapse, all cross-sections of the failure mechanism undergo radial rotation about the conical axis. Each circular cross-section, characterized by a constant radius R , maintains its geometric shape. The center of each cross-section is spatially distributed along the conical axis. The distance from the rotation center to the center of an arbitrary cross-section is defined as r m , given by
r m = r + r / 2
R = r r / 2
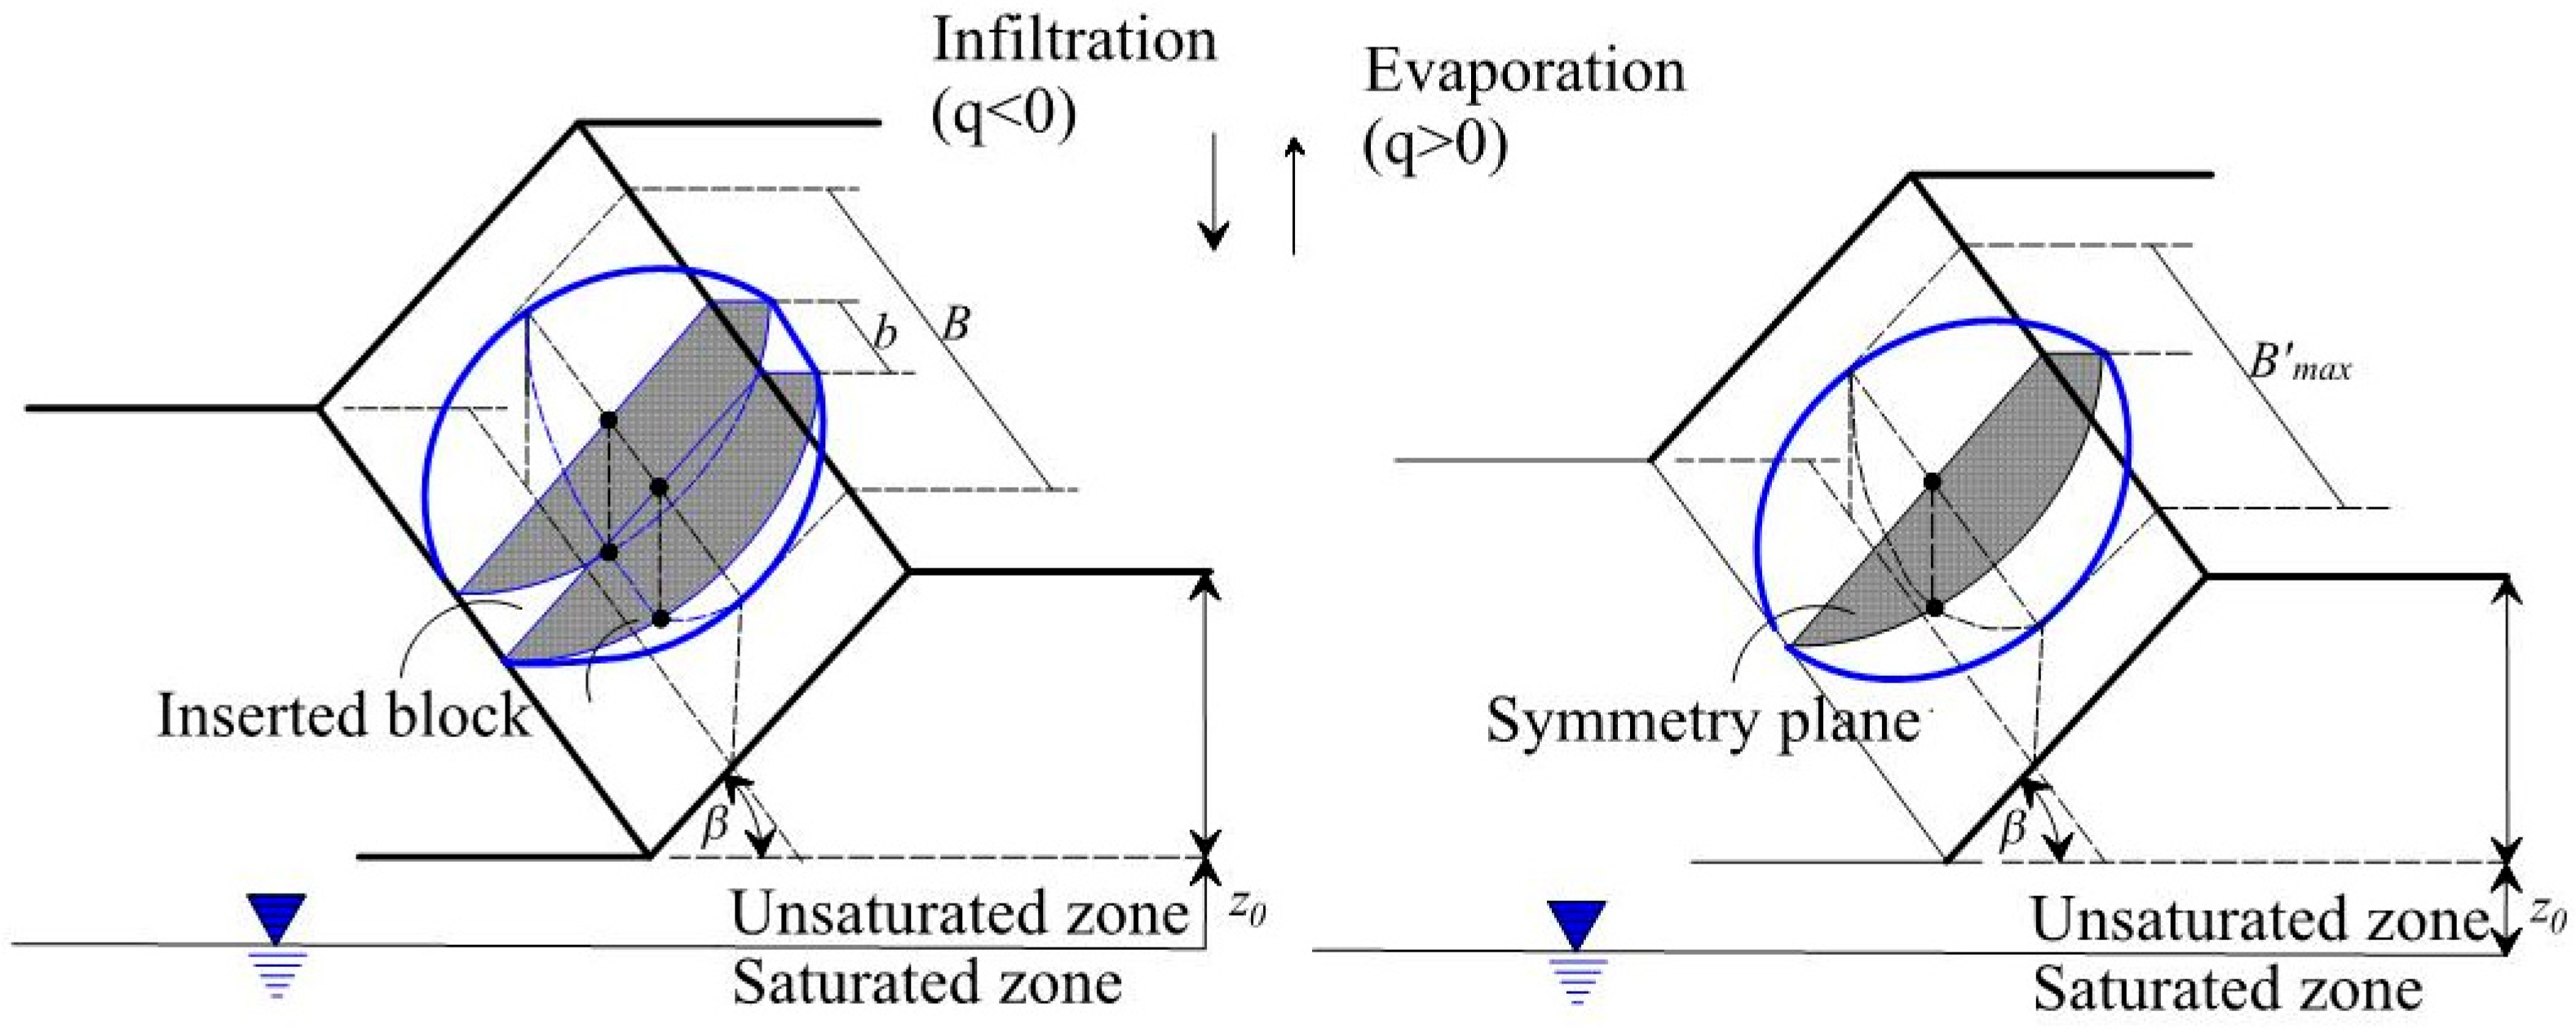
Using established methods, this study develops a generalized failure mechanism for retaining walls of arbitrary width. The approach integrates a two-dimensional plane-strain block of width b within the symmetry plane of the three-dimensional configuration. This innovative method enables a continuous transition from three-dimensional to two-dimensional conditions through parametric variation of b . This approach results in a universal failure mechanism. As illustrated in Figure 2, the width b of the planar insert is expressed as
b = B B max
where B denotes the longitudinal width of the retaining wall (as illustrated in Figure 2), and B max is the maximum width of the three-dimensional section. When B is sufficiently large, B max remains finite, causing the width of the two-dimensional plane-strain insert block b to significantly exceed that of the three-dimensional section. In this case, the contribution of the three-dimensional section to the overall behavior becomes negligible, indicating that three-dimensional effects are no longer significant. Consequently, the three-dimensional failure mechanism degenerates to a two-dimensional condition. This “two-dimensional insert block” is primarily a mathematical construct that facilitates a continuous parametric transition from fully 3D to 2D plane-strain conditions within a unified kinematic framework. Its introduction allows the mechanism to naturally capture the diminishing contribution of 3D arching effects as the wall width increases. The proposed failure mechanism is controlled by three independent parameters, θ 0 , θ h , and r 0 / r 0 , which collectively determine the kinematic and energy dissipation characteristics of the system.
θ 0 θ θ h < π 0 < r 0 / r 0 < 1 b 0

3.2. Establishment of Work Balance Equation

The work components during the failure mechanism’s collapse process comprise: the work rate by soil gravity ( W γ ), the work rate by retaining wall support force ( W P a ), the internal energy dissipation rate due to soil resistance ( D c ), and the internal energy dissipation rate induced by apparent matric suction considering thermal effects under steady-state seepage ( D c app ). In the limit state, these four components satisfy the following mathematical relationship:
W γ W P a = D c + D c app
From the foregoing formulation, the maximum active earth pressure resisted by the retaining wall under limit failure conditions is
P a = W γ D c D c app W P a / P a
The work rate component W γ consists of two distinct contributions: the three-dimensional portion W γ - 3 D and the two-dimensional insert block portion W γ - insert . Within the failure mechanism framework, these can be explicitly expressed as
W γ - 3 D = W γ - 3 D ABC = ω γ r 0 4 g 1
W γ - insert = W γ - insert ABC = ω b γ r 0 3 g 2
where g 1 and g 2 represent dimensionless coefficients, the detailed calculation methods for which are provided in Appendix A.
The internal energy dissipation includes two components: D c app from the apparent cohesion c app of unsaturated soil under thermo-seepage conditions, and D c from the effective cohesion c that resists shear displacement. Both components comprise three-dimensional sections and two-dimensional insert blocks, as described by the following expression:
D c - 3 D = D c - 3 D AC = ω c r 0 3 g 4
D c - insert = D c - insert AC = ω b c r 0 2 g 5
D c app = D c app - 3 D + D c app - insert
The internal energy dissipation comprises four components: D c - 3 D and D c - insert represent dissipation from the 3D horn and 2D insert block of effective cohesion, while D c app - 3 D and D c app - insert correspond to the respective portions from matric suction. All components contribute to resisting slip failure through their respective mechanical mechanisms.
The failure mechanism does not exhibit complete plane-strain conditions but rather partial-width sliding. To represent the actual failure body’s effective influence range along the longitudinal direction, the concept of equivalent width B e is introduced, which can be calculated using the following expression:
B e = A r H / sin β
where A r represents the actual effective area of active earth pressure distribution, calculated by the following expression:
A r = 2 r 0 e θ h θ 0 tan φ sin θ h + β θ D θ h R 2 d 1 2 sin 2 θ + β + b H sin β
where d 1 denotes the distance from the rotation center to the sliding surface. The stability of slopes can be evaluated using a dimensionless active earth pressure coefficient, which can be expressed by the following equation:
P a = 1 2 γ H 2 B e K a
This study employs limit analysis (LA) to derive upper-bound solutions by optimizing constraint variables θ 0  , θ h  , and r / r  . These variables determine many possible failure modes, leading to multiple solutions. To find the strict upper-bound solution, we must identify the most critical solution associated with the least stable failure mode. This is essentially an optimization problem of finding the extremum among all possible solutions. As described above, this involves a problem of extremum optimization. To address this, common approaches include global optimization and local optimization methods, the former being computationally expensive, while the latter suffers from limited search capability. Therefore, this paper develops a hybrid algorithm in MATLAB R2023b that combines global and local optimization techniques, enabling faster and more accurate determination of the upper-bound solutions in limit analysis.

4. Parameter Study and Discussion

This study investigates the failure mechanism of retaining walls considering three-dimensional effects under steady-state seepage and temperature effects. Based on the upper-bound theorem of limit analysis, by incorporating matric suction caused by both temperature and seepage into the energy equilibrium equation, the active earth pressure coefficient is defined to establish an evaluation framework for maximum earth pressure in limit failure. The framework examines various influencing parameters including the width-to-height ratio of the retaining wall, wall height, seepage velocity, temperature variation, and soil geometry. The reliability of the proposed model is first verified against conditions from the previously published literature [42,43,44,45,46]. The remaining parameters are presented in Table 1, where c / γ H represents the reciprocal of the normalized critical height, with data originating from Lu and Likos [8], Vahedifard et al. [32], and Lu and Godt [33]. Unless otherwise specified, the parameter values listed in Table 1 are adopted throughout this study. The parameters are selected as representative values within commonly reported ranges; for clay, α is fixed to isolate the influence of n in the parametric analysis.

4.1. Comparison with Existing Solutions

This study focuses on the failure mechanism of retaining walls considering three-dimensional effects. It should be emphasized that three-dimensional wall failure fundamentally differs from two-dimensional conditions, as evidenced by their distinct mathematical formulations and collapse patterns. Validation was performed using published data from Antão et al. [42] under conditions neglecting thermal effects, with vertical wall inclination ( β = 90 ° ), cohesionless soil ( c = 0 ), and varying width-to-height ratios (where B / H = 1000 approximates infinite width, representing 2D conditions). As shown in Table 2, comparative analysis of active earth pressure coefficients across different friction angles demonstrates excellent agreement between the present study and Antão et al.’s results, with discrepancies within 5%. These minor variations are attributed to differences in failure mechanism assumptions, computational logic, and numerical precision. Nevertheless, the close agreement confirms the validity of the proposed method for both 3D and 2D conditions. The results consistently show that required retaining forces decrease with increasing soil friction angle, a trend observed across all B / H ratios. This observation justifies the subsequent adoption of β = 90 ° as the baseline case for further analysis. Moreover, comparative results for various soil friction angles confirm the method’s capability to account for soil cohesion effects while demonstrating strong generalizability. Finally, the proposed methodology is also applicable to non-vertical retaining walls.
The distribution of active earth pressure on retaining walls varies with wall geometry and soil properties. According to conventional geotechnical practice, this pressure typically acts perpendicular to the wall at one-third of the wall height from the base. However, studies have shown that the direction of earth pressure application significantly affects the results [43].
To improve model rigor, the mathematical formulation incorporates the angle ( δ ) between the active earth pressure direction and the wall’s normal vertical direction. The proposed approach was systematically validated against established data (Table 3).
The proposed method shows discrepancies within 5% compared with the results of Yang and Li’s findings, indicating good agreement. Supported by existing data on the δ / φ ratio relationship, the study further verifies the model’s feasibility under both three-dimensional and two-dimensional conditions along the B / H dimension. Notably, when B / H approaches infinity, the scenario degenerates to a plane-strain (two-dimensional) condition. All results conform to theoretical expectations.
To ensure consistency with Li and Yang [47], the following parameters for sand were adopted: φ = 30 ° , δ / φ = 1 / 3 , α = 0.1   kPa 1 , n = 5 , and H = 5   m . When B / H is sufficiently large (e.g., B / H 50 ), the computed K a shows negligible variation (<1%) with further increases in width, implying a converged plane-strain (2D) response; therefore, B / H = 1000 is used to approximate the 2D limit. Based on the data in Table 4, the following conclusions can be drawn: (1) 3D analysis yields lower earth pressure values. In all comparison cases, the K a values calculated by the 3D model are consistently lower than those from the 2D model. For instance, for a sand wall with B / H = 2 , the 3D K a is 0.310, representing a 14.4% reduction compared to the 2D value (0.362). This reduction is attributed to the 3D failure mechanism (the horn-shaped block in Figure 1), which allows for lateral shear displacement of the soil, thereby relieving the active thrust on the wall. (2) The 3D model achieves a smooth transition to 2D conditions. At B / H = 1000 , the width of the insert block far exceeds the 3D component, simulating the limit condition for 2D plane strain. Comparisons with existing 2D models show that the discrepancy is within 10%. This demonstrates that the proposed mathematical construction allows the failure mechanism to transition continuously from a 3D spatial state to a 2D plane-strain state as B / H increases, providing a unified kinematic framework for both models. (3) Limitations of the 2D model, with the comparison highlighting the inherent limitations of traditional 2D analysis: (a) it fails to capture the spatial arching effect, leading to an overestimation of earth pressure for finite-width walls; (b) it yields a fixed result that ignores geometric variability. For walls with small B / H ratios, this conservatism can be excessive, resulting in uneconomical designs and increased engineering costs.

4.2. Effects of 3D and Temperature

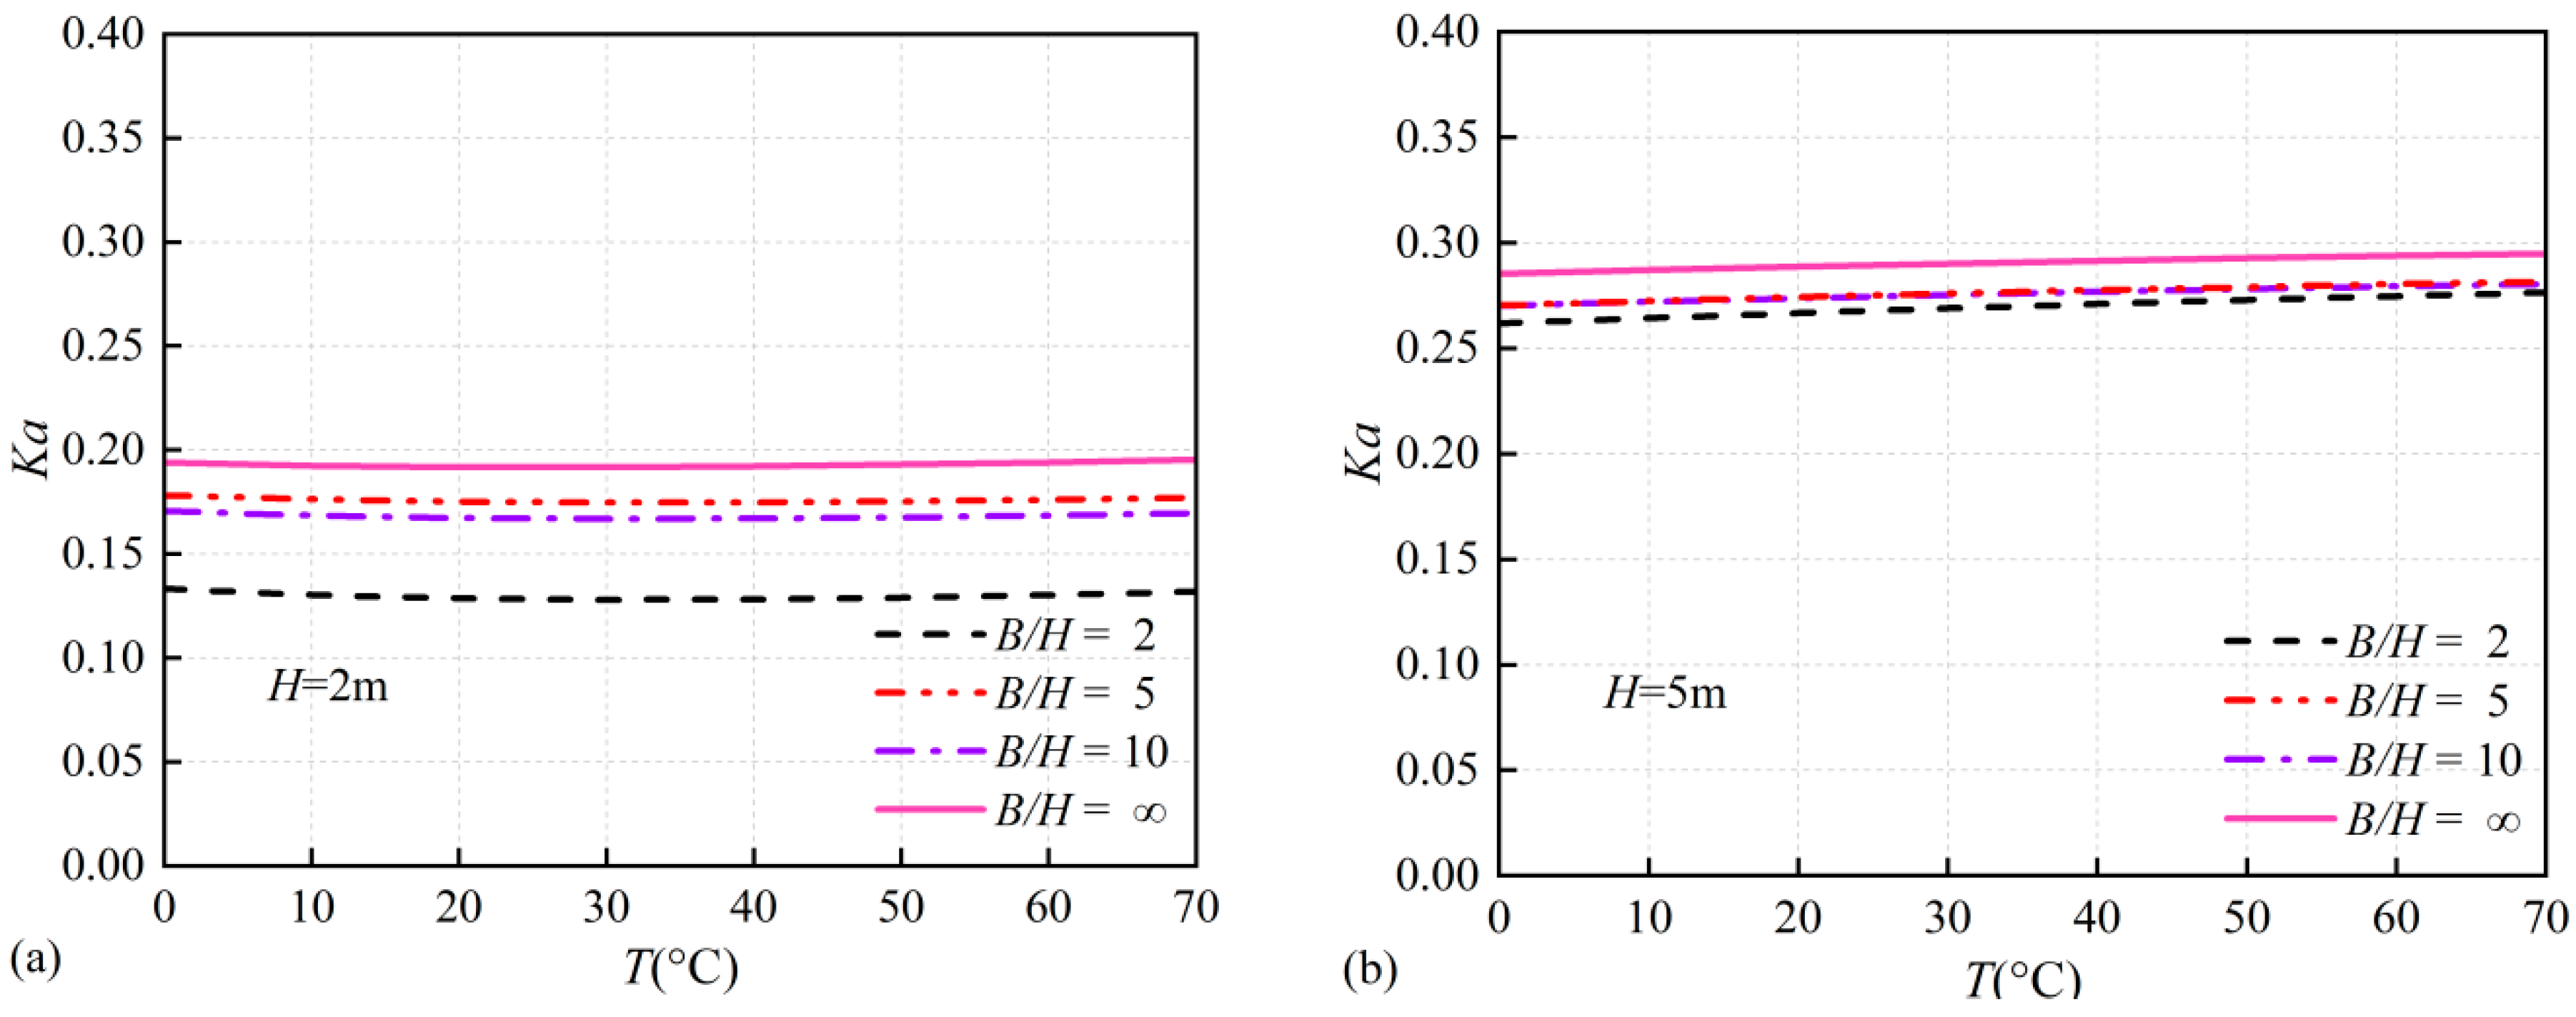
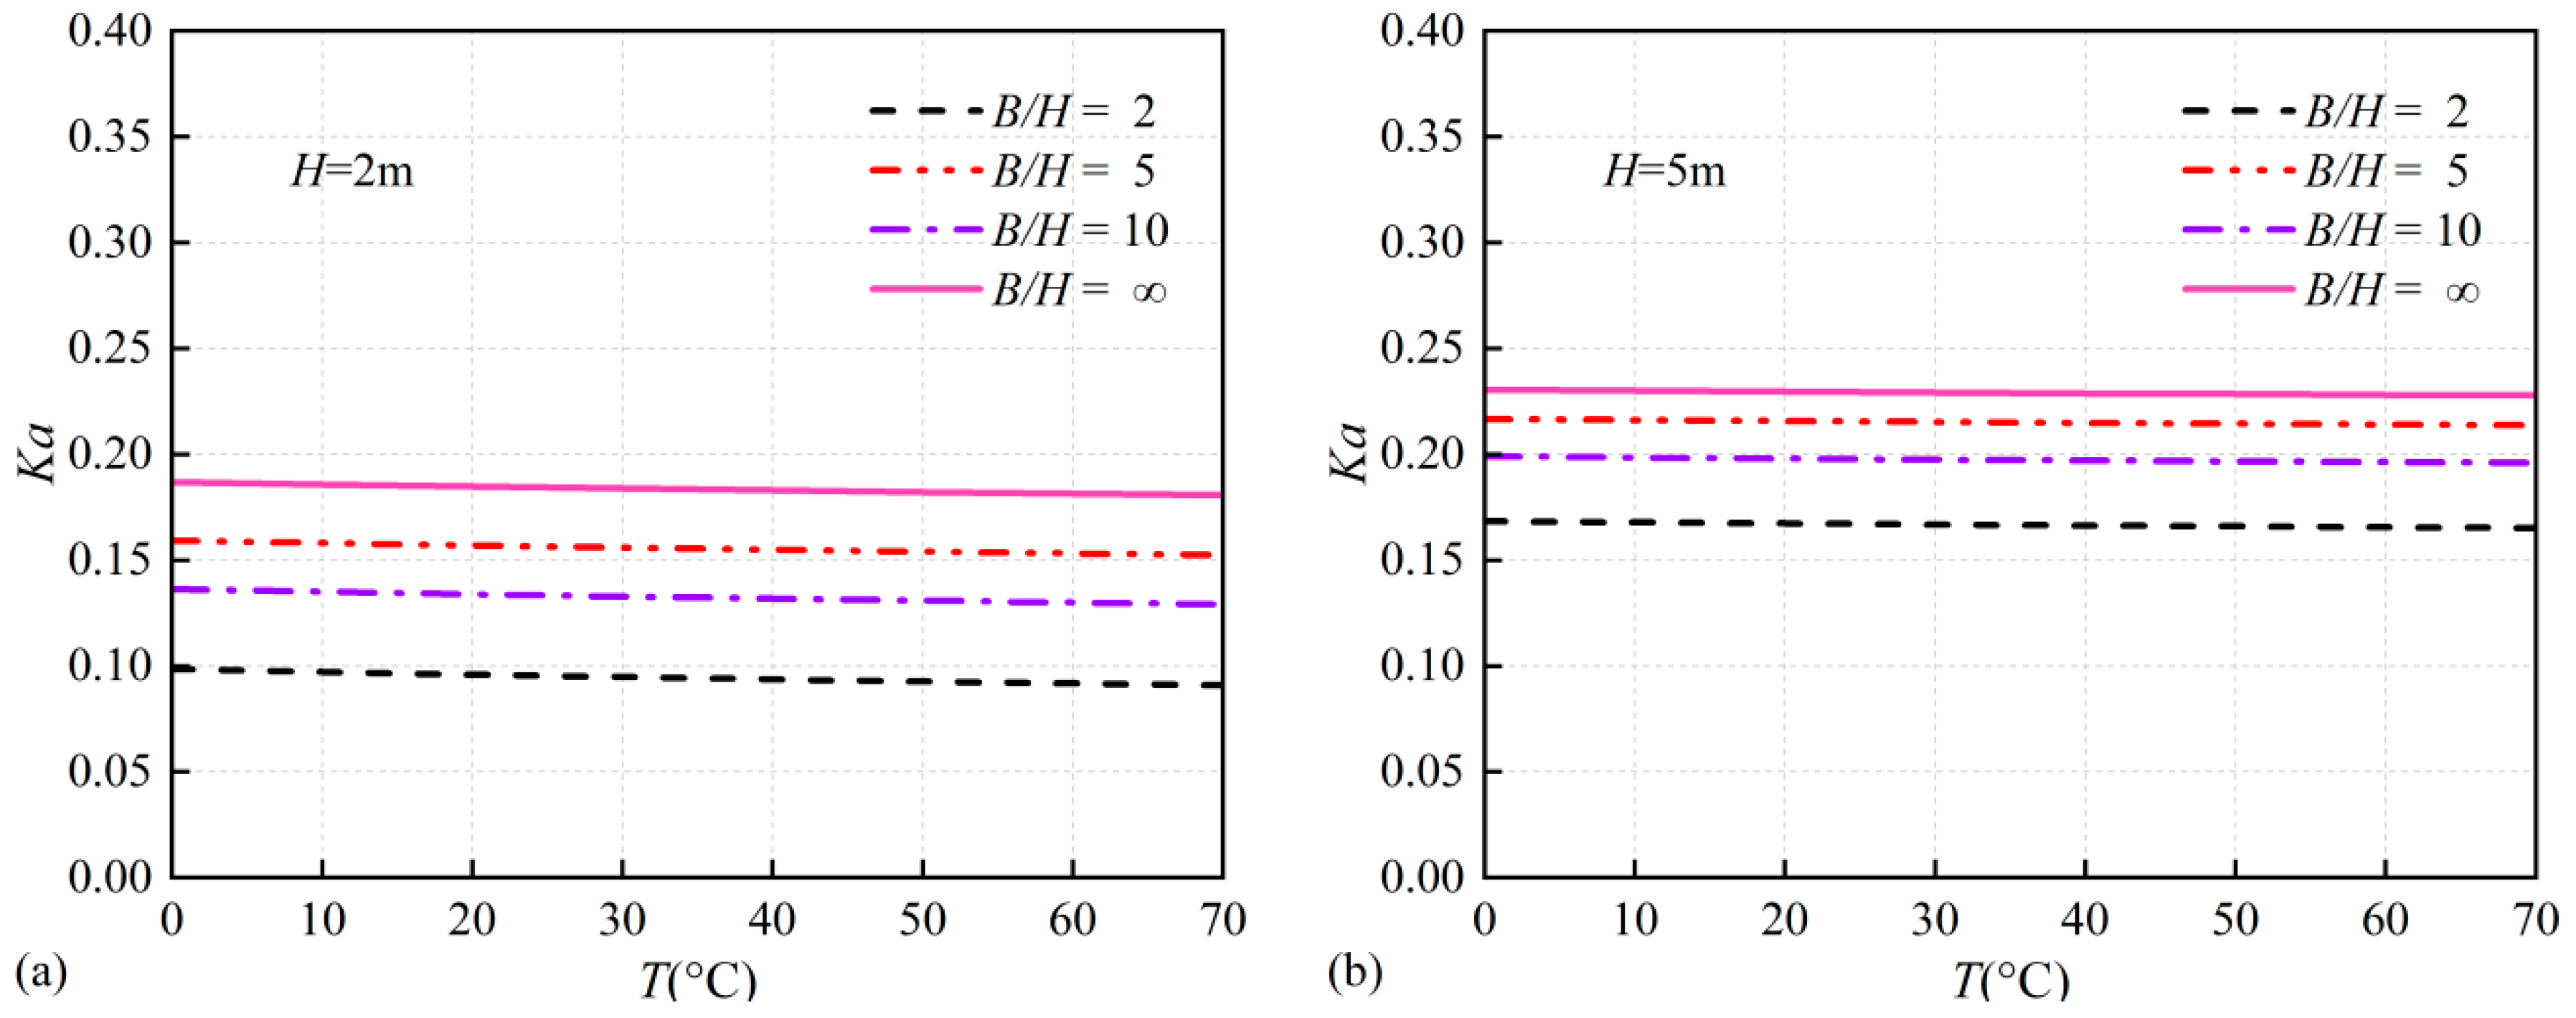
This study investigates the variation in the active earth pressure coefficient ( K a ) for retaining walls under three-dimensional conditions, neglecting seepage effects. By analyzing soil failure mechanisms, thermal effects, and three-dimensional constraints, the mechanical behaviors of sand and clay under specific parameter combinations (summarized in Table 1) are compared. The numerical results (Figure 3 and Figure 4) reveal both similarities and differences in the responses of the two soil types to temperature and three-dimensional effects.
For sand, the K a value exhibits a slow increasing trend with rising temperature. For instance, under the condition of B / H = shown in Figure 3b, K a increases from 0.28 to 0.30, indicating that temperature elevation reduces the strength of sand. This weakening effect is attributed to the low initial matric suction of sand. As temperature rises, the matric suction in unsaturated soil decreases, leading to a slight reduction in apparent cohesion, thereby compromising the stability of the retaining wall.
In contrast, for clay, the K a value decreases gradually with increasing temperature. As illustrated in Figure 4b, under the same condition ( B / H = ), K a declines from 0.231 to 0.226, suggesting that temperature elevation enhances the stability of clay. This is due to the high initial matric suction of clay, which, under thermal influence, strengthens the apparent cohesion, resists soil failure, and consequently improves stability.
Regarding the wall height effect, both sand and clay demonstrate better stability at lower wall heights, while stability diminishes with increasing wall height. Across all conditions, K a consistently rises as wall height increases. However, the sensitivity to wall height differs between the two soil types. When wall height increases from 2 m to 5 m, the increase in K a for sand under the same B / H condition is greater than that for clay. For example, at B / H = 2 , the increase is 0.15 for sand compared to 0.072 for clay, indicating that sand is more sensitive to changes in wall height.
In practice, soil failure typically exhibits three-dimensional characteristics. Three-dimensional analysis accounts for the stability contribution of the lateral boundaries of the failure soil mass, which is entirely neglected in two-dimensional analysis. Within the investigated parameter space, increasing B / H from 2 to B / H can raise K a substantially, by up to approximately 98.83%, indicating that the 3D width effect may be substantial for relatively small B / H (Figure 3a). This demonstrates that considering three-dimensional effects in retaining wall design can help reduce engineering costs. It should be noted that the maximum theoretical reduction (e.g., 98.83% for the given case) represents an upper-bound potential derived from the specific horn-shaped mechanism under idealized conditions. In practice, the actual magnitude of 3D relief will be influenced by additional factors such as wall roughness, backfill heterogeneity, and boundary constraints. Hence, while 3D analysis clearly indicates potential economies, design applications should incorporate appropriate safety factors and consider site-specific conditions.

4.3. Influence of Seepage Velocity

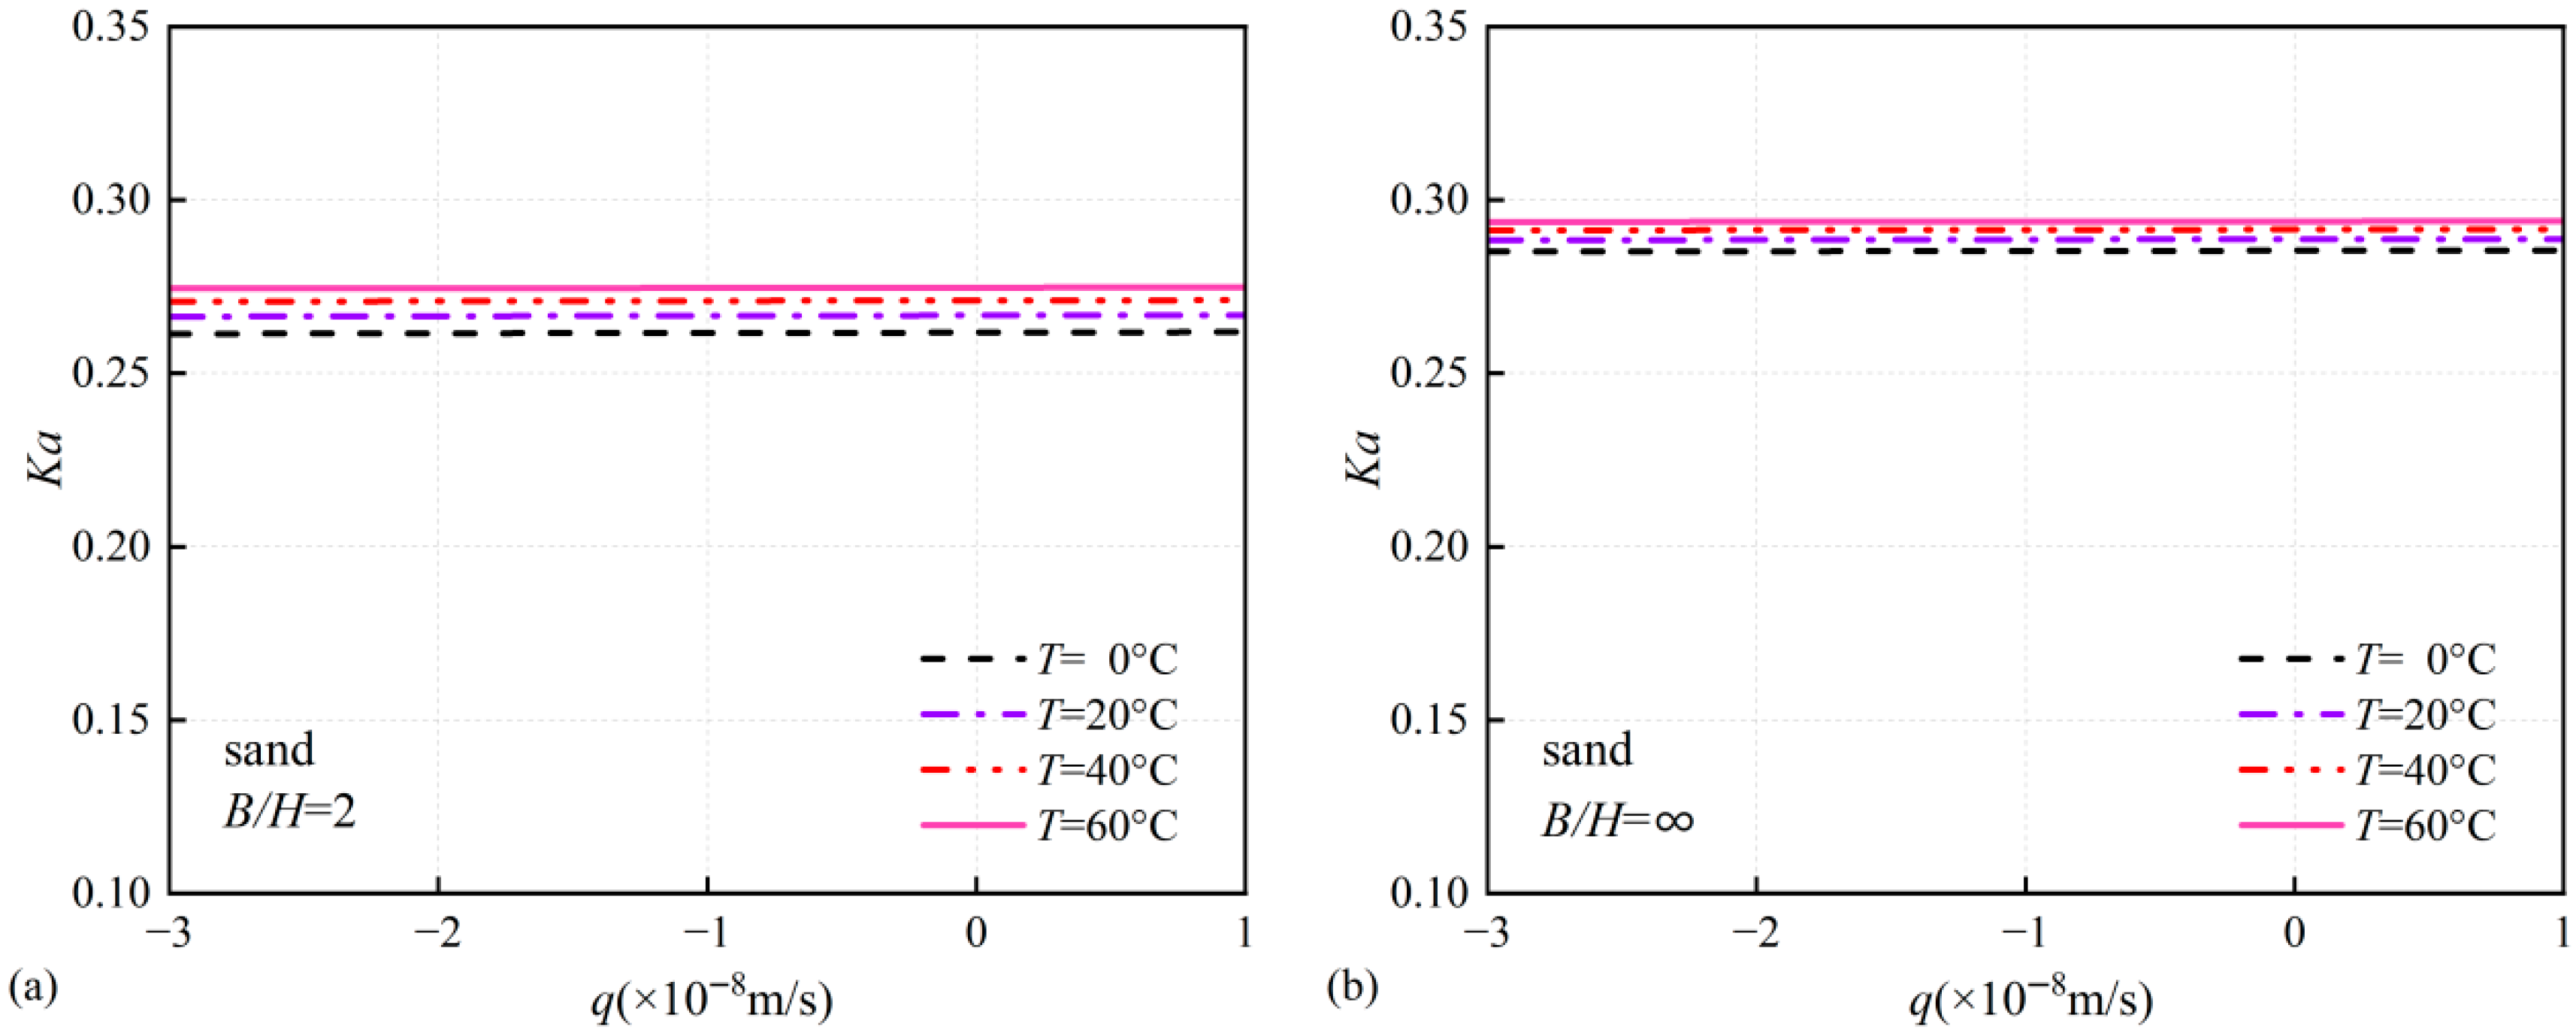
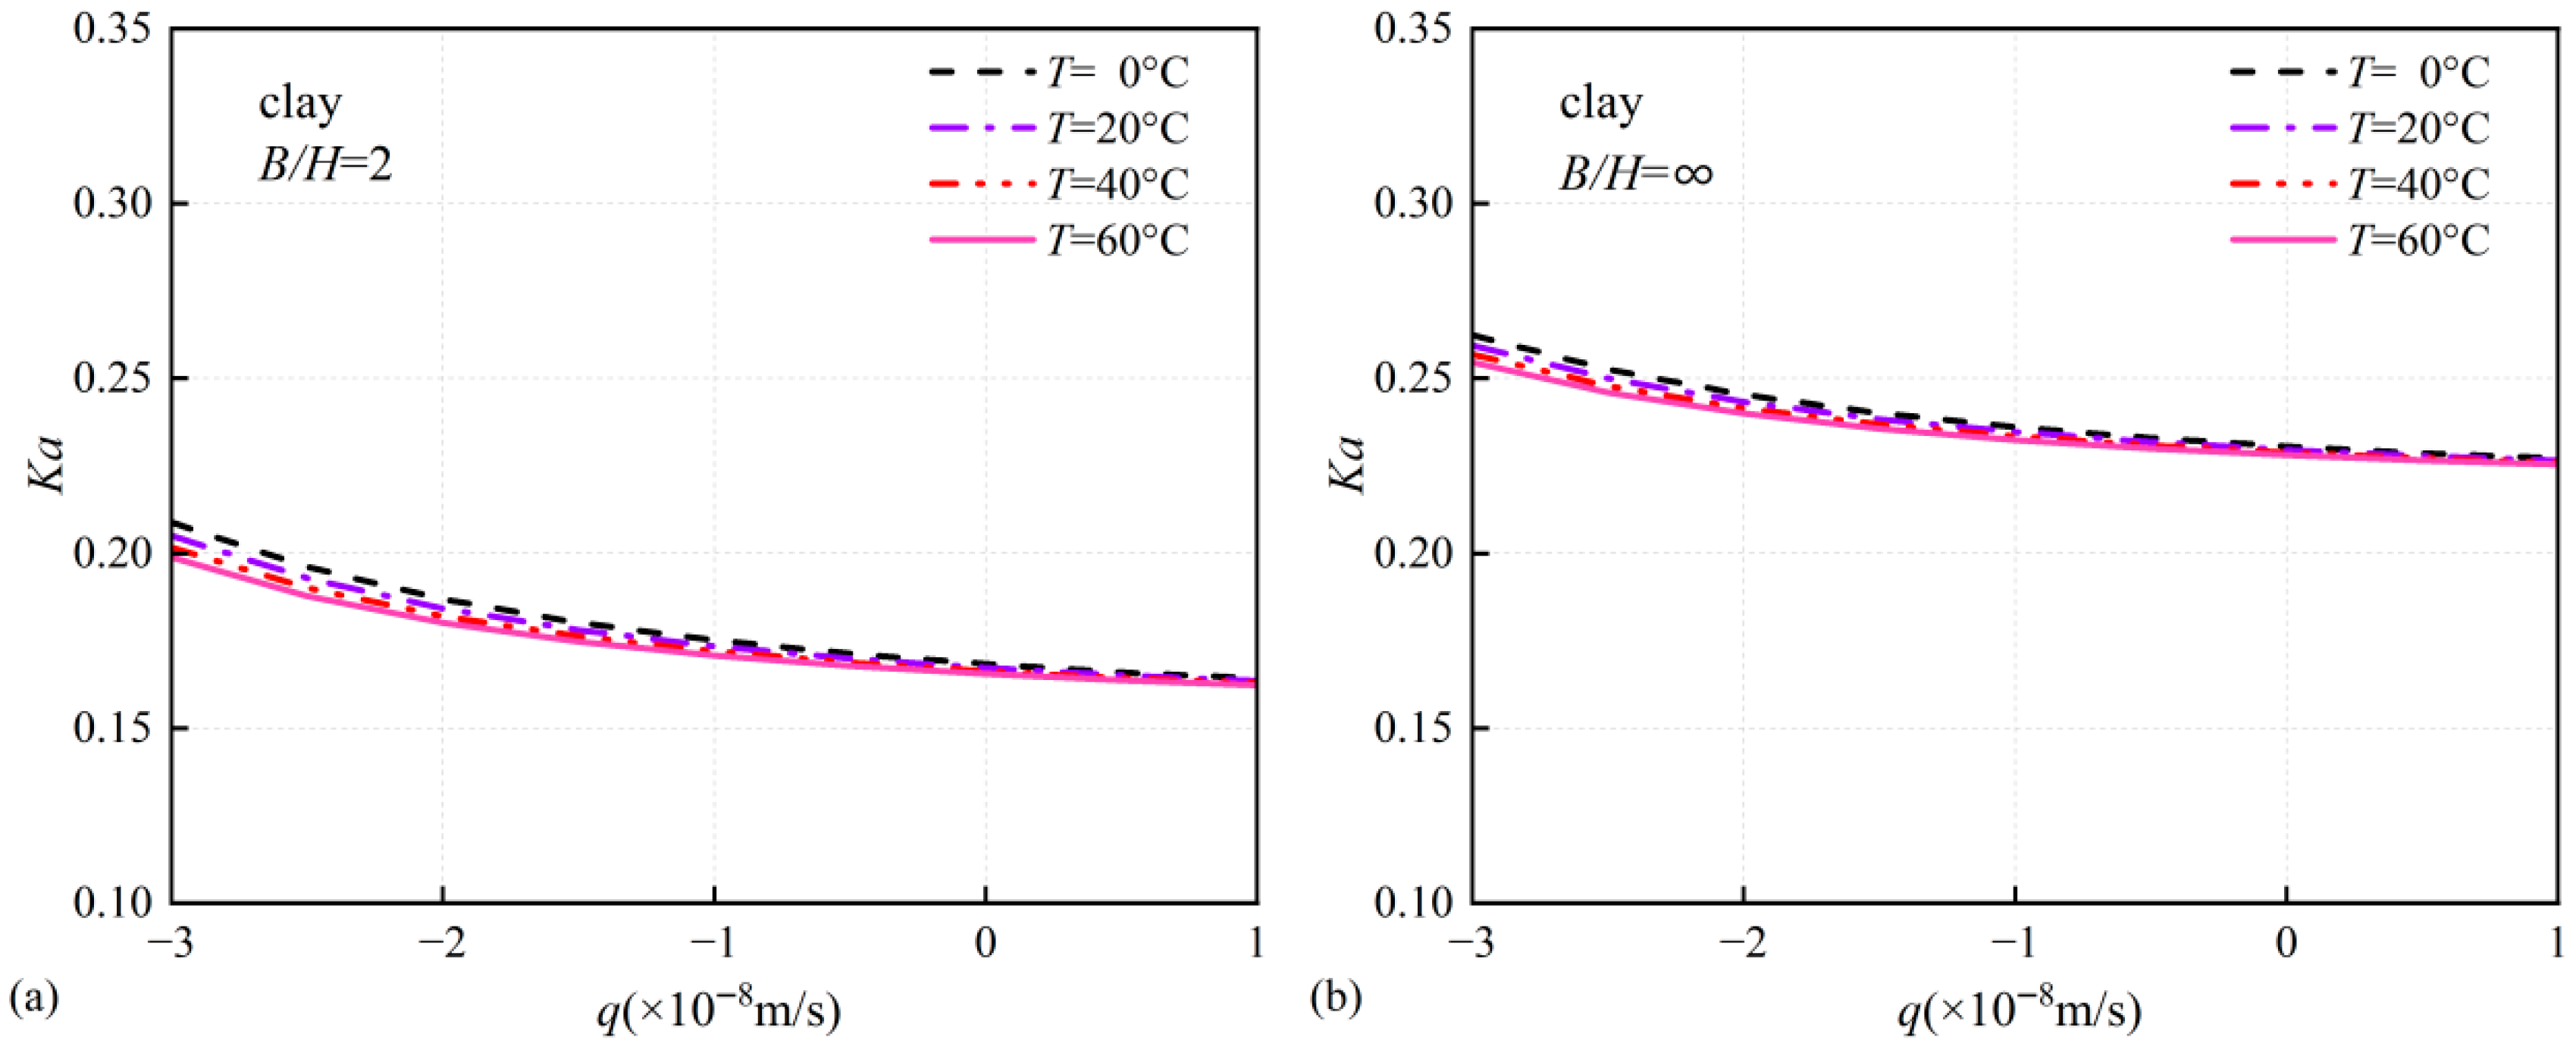
Figure 5 and Figure 6 compare the responses of sandy soil and clay to seepage, presenting results under identical seepage conditions at a wall height of H = 5   m , subject to varying temperatures and 3D effects. The conclusion from the previous section is reaffirmed: considering 2D effects yields more conservative results. For retaining walls backfilled with sandy soil, stability decreases with increasing temperature, whereas the opposite is observed for clay.
Furthermore, the charts indicate that seepage has negligible influence on sandy soil, as its active earth pressure coefficient K a shows no significant change throughout the transition from infiltration to evaporation. In contrast, clay demonstrates a clear sensitivity to seepage. Specifically, infiltration increases the active thrust on the retaining wall, while evaporation reduces it. As shown in Figure 6a, during infiltration ( q = 3 × 10 8 m / s ), K a is approximately 0.2. Infiltration raises pore water pressure, thereby reducing matric suction and compromising wall stability, which in turn necessitates higher retaining forces. As seepage transitions from infiltration to no-flow and then to evaporation ( q = 1 × 10 8 m / s with q < 0 for infiltration and with q > 0 for evaporation), K a decreases to about 0.16. During this process, soil moisture loss reduces pore water pressure, enhances matric suction (thereby increasing apparent cohesion), and improves wall stability, allowing for a reduction in required retaining forces.
These numerical results emphasize that in practical engineering applications, particularly in seepage-active zones, adjustments to retaining forces must account for both seepage direction and velocity. Additionally, reinforcement measures should be strengthened under high-infiltration conditions.

4.4. Influence of Soil Pore Distribution

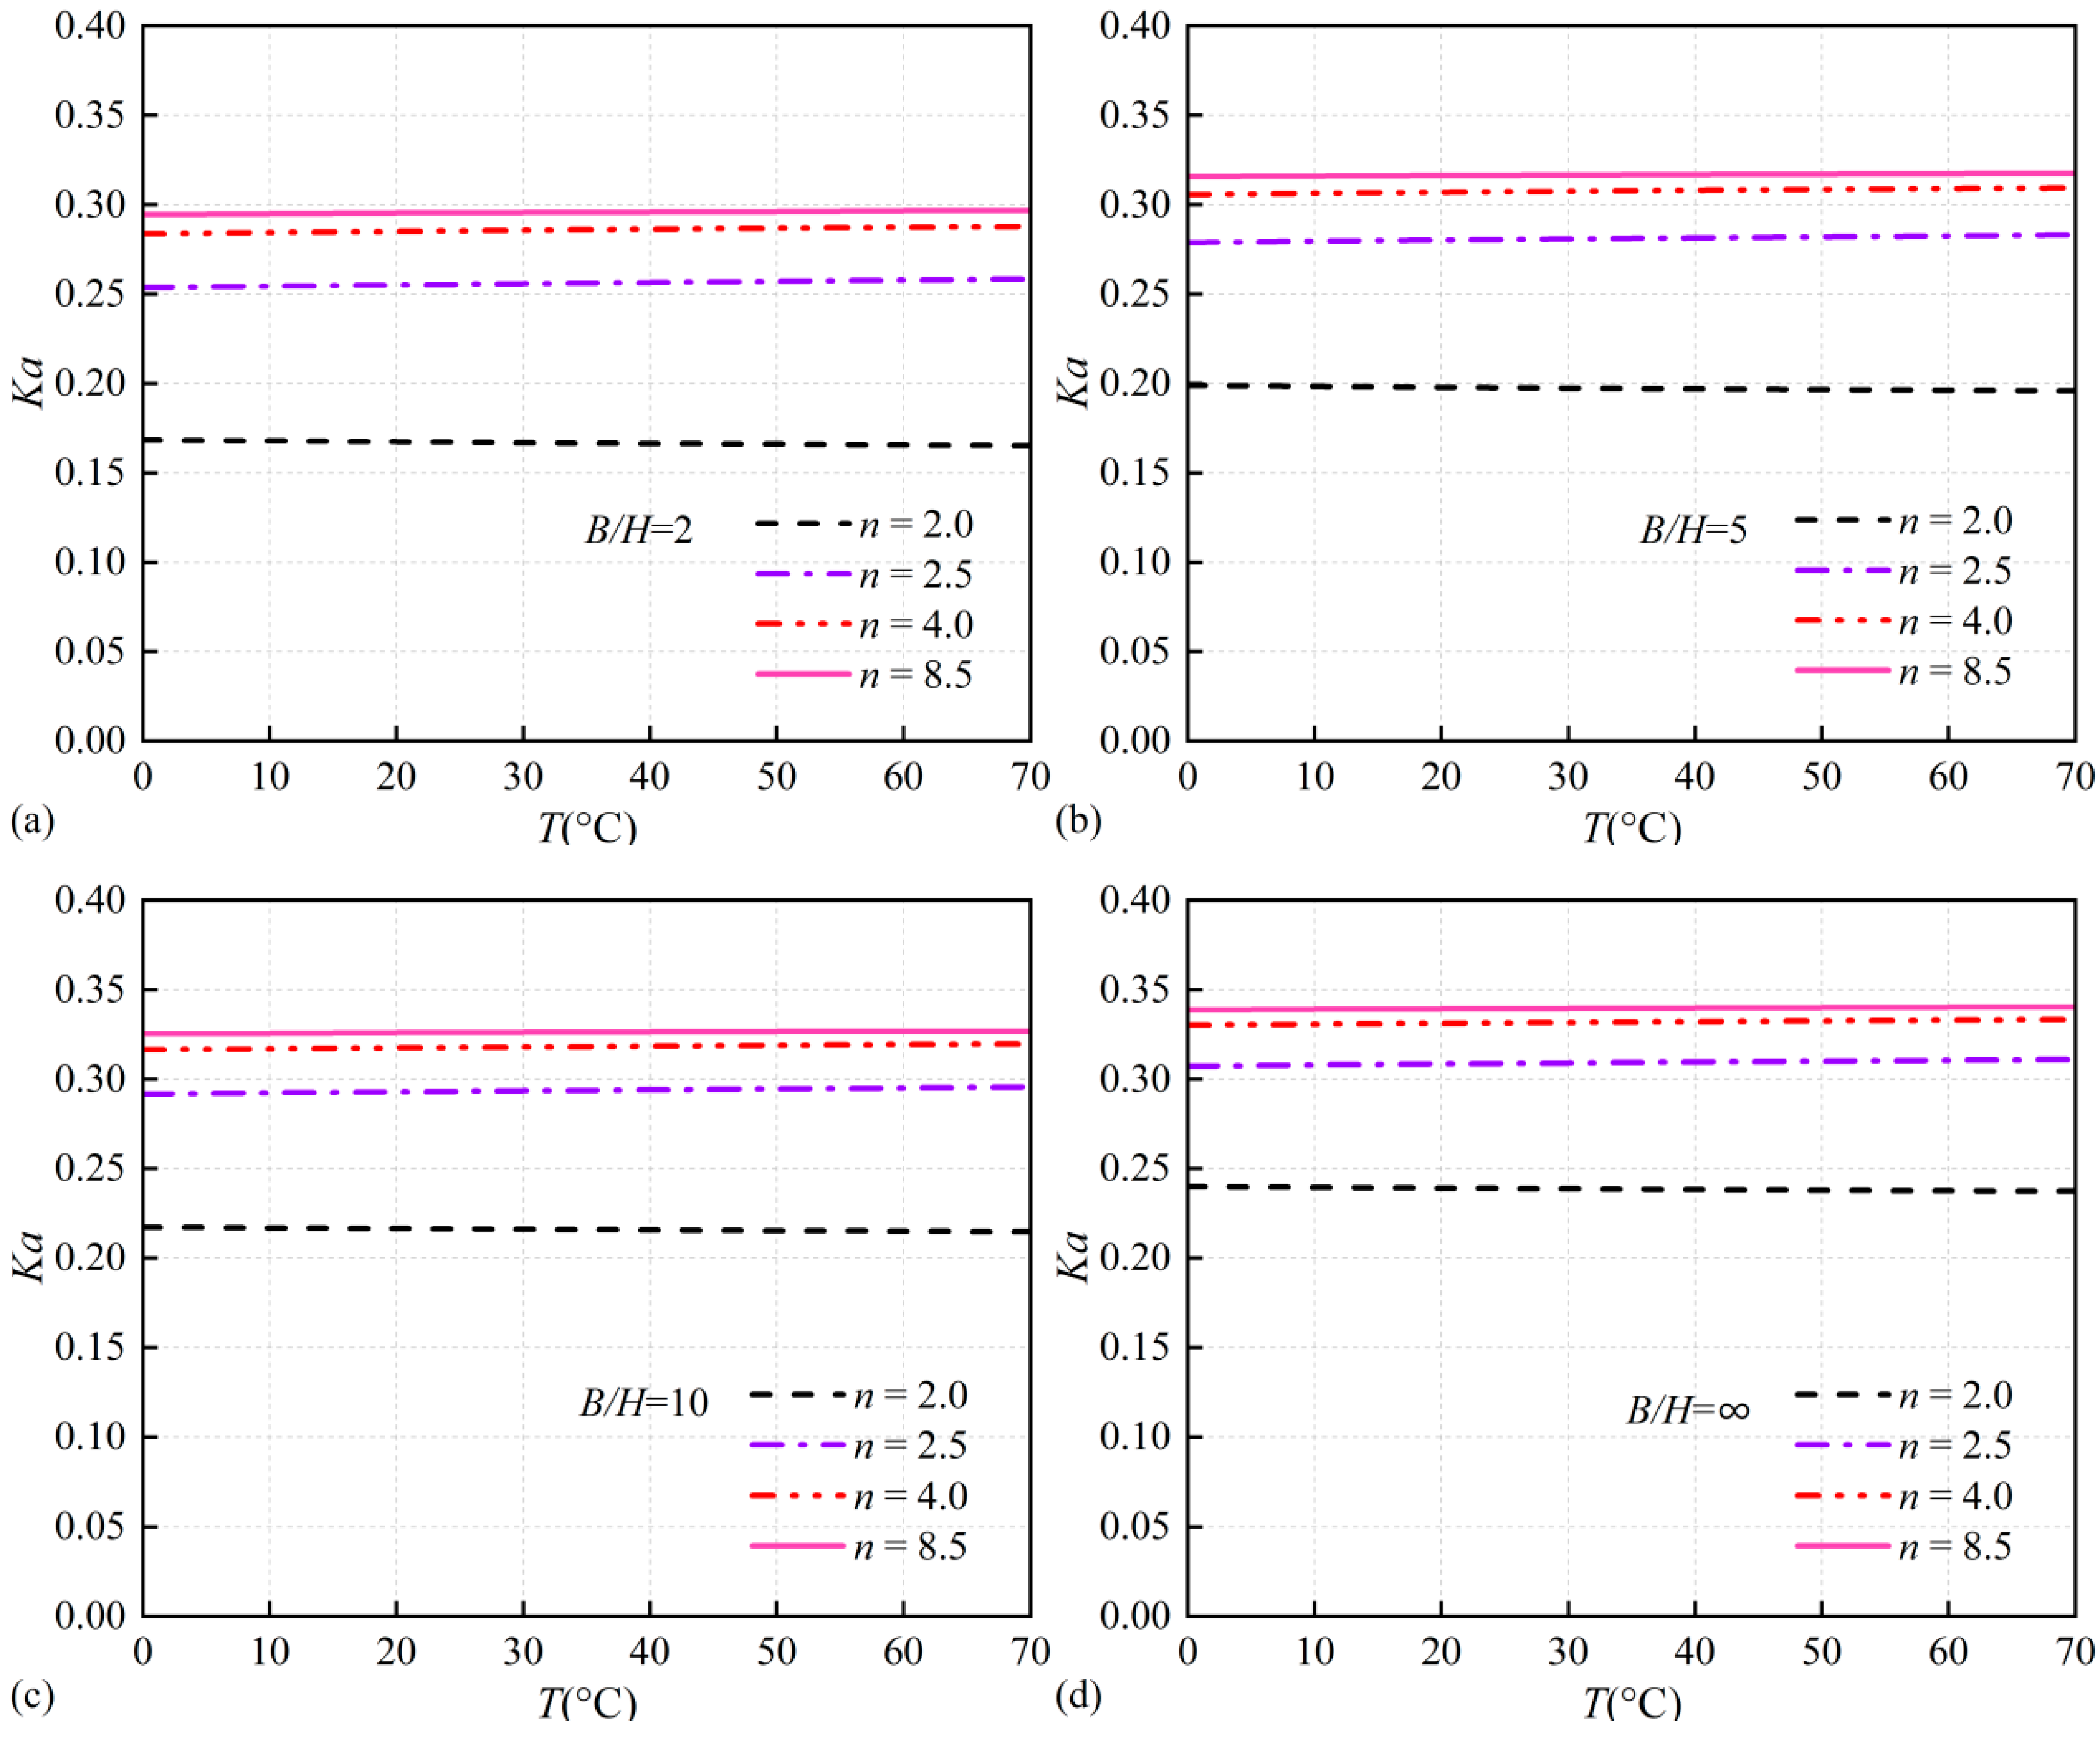
The parameters n and α govern the water retention and permeability of unsaturated soils. Consequently, they serve as fundamental inputs for analyzing seepage, slope stability, foundation settlement, and related phenomena. The dimensionless pore distribution parameter n governs the shape of the soil–water characteristic curve (SWCC), where values n > 1 indicate increasingly uniform pore-size distribution, while values approaching 1 suggest broader pore-size distribution. Generally, larger values of n and α indicate looser soil fabrics and lower matric suction in unsaturated materials. Therefore, Figure 7 illustrates the influence of varying n values on the active earth pressure coefficient while keeping α = 0.005   kPa 1 constant, with additional examination of temperature effects under different conditions. The investigation employs parameters representative of clay conditions: c / γ H = 0.05 , α = 0.005   kPa 1 , and q = 0 .
The results show that as both n and B / H increase, the active earth pressure coefficient of the retaining wall rises and eventually stabilizes. This suggests that with decreasing matric suction, the contribution of apparent cohesion gradually diminishes, leading to reduced wall stability and a corresponding increase in required active thrust. Interestingly, a slight decrease in K a with rising temperature is observed when n = 2 , whereas a slight increase occurs for other n values. This finding partly explains the differing thermal responses between sand (discussed in the previous sections n = 4 ) and clay, which can be attributed to the influence of the soil parameter n . Qualitative Sensitivity Consideration: Although a comprehensive parametric sensitivity study is not performed here, the results underscore that the pore-size distribution parameter n and the scaling parameter α are influential factors. The general trend indicates that soils with higher n (more uniform pores) and higher α (lower air-entry pressure) tend to develop lower matric suction, leading to higher active earth pressure coefficients ( K a ) and reduced stability. This highlights the importance of characterizing the soil–water retention curve (SWCC) accurately in practice, as natural variability in n and α can significantly affect the predicted earth pressures.

5. Conclusions

This study establishes a kinematic analytical framework for the active earth pressure coefficient ( K a ) that incorporates the effects of temperature and steady-state seepage. A three-dimensional failure mechanism is adopted to examine the distinct mechanical responses of two soil types (sand and clay) under varying retaining wall conditions, thereby assessing the stability of retaining structures. The validity of the proposed method is confirmed through comparisons with existing data. Parametric analyses of retaining walls with sand and clay yield the following key findings:
  • Three-dimensional effects substantially reduce design conservatism. Compared to conventional two-dimensional analysis, the 3D approach yields significantly lower active earth pressure coefficients (up to 98.83% reduction). This demonstrates that realistic 3D mechanisms provide more economical design solutions while maintaining safety. It is acknowledged that this maximum theoretical reduction is derived from the idealized horn-shaped mechanism; actual savings will depend on site-specific conditions and should be incorporated with appropriate engineering judgment and safety factors.
  • Soil-specific thermal response is critical. Under increasing temperature, sandy soils exhibit reduced stability ( K a increases), while clayey soils show improved stability ( K a decreases). This opposite behavior is governed by their contrasting initial matric suction and its temperature-dependent evolution.
  • Seepage effects are soil-type dependent and direction-sensitive. Seepage has negligible influence on sandy soils but significantly affects clayey soils. For clays, infiltration increases active thrust, while evaporation enhances stability through suction recovery, highlighting the need to consider seepage direction in design.
  • Wall height and soil permeability parameters ( α , n ) are key influencing factors. Stability decreases with increasing wall height for both soil types, with sand showing greater sensitivity. Furthermore, the pore-size distribution parameter n and scaling parameter α , which define the soil–water retention behavior, markedly influence the active earth pressure. Increases in these parameters (associated with lower matric suction) generally lead to higher K a values, underscoring the importance of accurate hydraulic characterization in stability assessments. Therefore, in engineering practice, the accurate determination of hydraulic parameters (SWCC) for unsaturated soils is crucial for the reliable prediction of earth pressure.
The framework offers a practical tool for performing coupled thermal–hydraulic–mechanical analysis of retaining walls in unsaturated soils, supporting more realistic and cost-effective designs under varying environmental conditions. Future work should move beyond the simplified assumption of one-dimensional vertical steady-state seepage to conduct coupled analyses involving transient seepage and retaining wall mechanical behavior. These efforts aim to refine the stability evaluation system for retaining walls across different dimensions, providing theoretical support for the engineering design of complex scenarios and irregular structures.

Author Contributions

Conceptualization, G.L.; Methodology, L.X.; Software, Z.Z.; Validation, R.W.; Formal Analysis, G.L.; Resources, L.X.; Data Curation, Z.Z.; Writing—Original Draft, R.W.; Writing—Review and Editing, D.Z.; Supervision, D.Z. All authors have read and agreed to the published version of the manuscript.

Funding

This work was supported by the project “Key technologies for deformation control in shield tunneling through operated subway station and utility tunnels” of Shenzhen Municipal Group Co., Ltd. Project Number: TJ-SZBB202512172013.

Data Availability Statement

The raw data supporting the conclusions of this article will be made available by the authors on request.

Conflicts of Interest

Authors Long Xia, Guihua Long and Zhipeng Zhou were employed by the Shenzhen Municipal Group Co., Ltd. The remaining authors declare that the research was conducted in the absence of any commercial or financial relationships that could be construed as a potential conflict of interest.

Appendix A. Specific Expressions for Work Rates

W γ - 3 D = W γ - 3 D ABC = ω γ r 0 4 g 1
W γ - insert = W γ - insert ABC = ω b γ r 0 3 g 2
W P a = ω r 0 P a g 3
D c - 3 D = D c - 3 D AC = ω c r 0 3 g 4
D c - insert = D c - insert AC = ω b c r 0 2 g 5
g 1 = 2 θ 0 θ B 1 8 f 2 2 f 3 f 3 3 2 3 f 1 f 3 2 1 2 f 1 2 f 3 + 2 3 f 1 f 2 2 f 2 2 f 3 2           + 1 8 f 2 4 + 1 2 f 1 2 f 2 2 arccos f 3 f 2 cos θ d θ           + 2 θ B θ h 1 8 f 2 2 f 4 f 4 3 2 3 f 1 f 4 2 1 2 f 1 2 f 4 + 2 3 f 1 f 2 2 f 2 2 f 4 2           + 1 8 f 2 4 + 1 2 f 1 2 f 2 2 arccos f 4 f 2 cos θ d θ
g 2 = b r 0 f 5 f 6 f 7
g 3 = sin β + δ sin θ h e θ h θ 0 tan φ 1 3 H r 0                 cos β + δ cos θ h e θ h θ 0 tan φ + 1 3 H r 0 cot β
g 4 = 2 θ 0 θ B 2 f 1 f 2 + f 2 f 3 f 2 2 f 3 2 + 1 2 f 2 3 + f 1 2 f 2 arccos f 3 f 2 d θ           + 2 θ B θ h 2 f 1 f 2 + f 2 f 4 f 2 2 f 4 2 + 1 2 f 2 3 + f 1 2 f 2 arccos f 4 f 2 d θ
g 5 = b r 0 e 2 θ h θ 0 tan φ 1 2 tan φ
D c app = D c app - 3 D + D c app - insert                   = ω θ C θ D 0 δ 1 c app 2 R r m + R cos δ 2 d δ + b r 2 d θ
δ 1 = arccos sin β + θ h sin β + θ e θ h θ 0 tan φ f 1 / f 2
f 1 = r m r 0 = 1 2 e θ θ 0 tan φ + r 0 r 0 e θ θ 0 tan φ
f 2 = R r 0 = 1 2 e θ θ 0 tan φ r 0 r 0 e θ θ 0 tan φ
f 3 = d 1 r 0 = sin θ 0 sin θ f 1
f 4 = d 2 r 0 = cos θ 0 cos θ 0 e θ θ 0 tan φ f 1
f 5 = 1 3 1 + 9 tan 2 φ 3 tan φ cos θ h + sin θ h e 3 θ θ 0 tan φ           3 tan φ cos θ 0 sin θ 0
f 6 = L 6 r 0 2 cos θ 0 L r 0 sin θ 0
f 7 = H 6 r 0 sin θ h + β sin β e θ h θ 0 tan φ cos θ 0 L r 0 + cos θ h e θ h θ 0 tan φ

References

  1. Zhang, D.; Zeng, L.; Lv, Z.; Yu, X.; Liu, C.; Jiang, A.; Jiang, X.; Li, Q.; Yang, Y. Failure Mode of Deep-Buried Rectangular Chamber and Upper Bound Solution of Surrounding Rock Pressure. Mathematics 2025, 13, 69. [Google Scholar] [CrossRef] [Scilit]
  2. Xie, Y.; Zhou, D.; Liao, H.; Zhu, J. Failure Mode of Tunnel Face Under Transient Unsaturated Seepage with Temperature Influence. Mathematics 2025, 13, 1311. [Google Scholar] [CrossRef] [Scilit]
  3. Cheng, Z.; Zhou, D.; Chen, Q.; Gu, S. Safety Analysis of Subway Station Under Seepage Force Using a Continuous Velocity Field. Mathematics 2025, 13, 2541. [Google Scholar] [CrossRef] [Scilit]
  4. Shan, J.-T.; Yang, X.-L.; Xia, L.; Long, G.-H.; Yang, B.-Y.; Ren, L.-W. Influence of plant root reinforcement on 3D geosynthetic slopes. J. Cent. South Univ. 2026, 1–18. [Google Scholar] [CrossRef] [Scilit]
  5. Vanapalli, S.K.; Fredlund, D.G.; Pufahl, D.E.; Clifton, A.W. Model for the Prediction of Shear Strength with Respect to Soil Suction. Can. Geotech. J. 1996, 33, 379–392. [Google Scholar] [CrossRef] [Scilit]
  6. Romero, E.; Gens, A.; Lloret, A. Temperature effects on the hydraulic behaviour of an unsaturated clay. Geotech. Geol. Eng. 2001, 19, 311–332. [Google Scholar] [CrossRef] [Scilit]
  7. Griffiths, D.V.; Lu, N. Unsaturated Slope Stability Analysis with Steady Infiltration or Evaporation Using Elasto-Plastic Finite Elements. Int. J. Numer. Anal. Methods Geomech. 2005, 29, 249–267. [Google Scholar] [CrossRef] [Scilit]
  8. Lu, N.; Likos, W.J. Unsaturated Soil Mechanics; John Wiley & Sons: Hoboken, NJ, USA, 2004. [Google Scholar]
  9. Li, Z.-W.; Yang, X.-L. Stability Assessment of 3D Reinforced Soil Structures under Steady Unsaturated Infiltration. Geotext. Geomembr. 2022, 50, 371–382. [Google Scholar] [CrossRef] [Scilit]
  10. Michalowski, R.L. Limit Analysis and Stability Charts for 3D Slope Failures. J. Geotech. Geoenviron. Eng. 2010, 136, 583–593. [Google Scholar] [CrossRef] [Scilit]
  11. Xu, J.; Wang, P.; Huang, F.; Yang, X. Active Earth Pressure of 3D Earth Retaining Structure Subjected to Rainfall Infiltration. Eng. Geol. 2021, 293, 106294. [Google Scholar] [CrossRef] [Scilit]
  12. Mahmood, K.; Kim, J.M.; Ashraf, M.; Ziaurrehman. The Effect of Soil Type on Matric Suction and Stability of Unsaturated Slope under Uniform Rainfall. KSCE J. Civ. Eng. 2015, 20, 1294–1299. [Google Scholar] [CrossRef] [Scilit]
  13. Chen, Y.; Gao, Y.; Ng, C.W.W. A new capillary barrier system for retaining wall backfilled with fine-grained soil. Comput. Geotech. 2020, 118, 103324. [Google Scholar] [CrossRef] [Scilit]
  14. Alonso, E.; Gens, A.; Lioret, A.; Delahaye, C. Effect of rain infiltration on the stability of slopes. Unsaturated Soils 1995, 1, 241–249. [Google Scholar]
  15. Pham, T.A.; Sutman, M. Modeling the combined effect of initial density and temperature on the soil–water characteristic curve of unsaturated soils. Acta Geotech. 2023, 18, 6427–6455. [Google Scholar] [CrossRef] [Scilit]
  16. Qiao, X.; Ma, S.; Pan, G.; Liu, G. Effects of temperature change on the soil water characteristic curve and a prediction model for the Mu Us Bottomland, Northern China. Water 2019, 11, 1235. [Google Scholar] [CrossRef] [Scilit]
  17. Uchaipichat, A.; Khalili, N. Experimental investigation of thermo-hydro-mechanical behaviour of an unsaturated silt. Géotechnique 2009, 59, 339–353. [Google Scholar] [CrossRef] [Scilit]
  18. Gao, H.; Shao, M. Effects of temperature changes on soil hydraulic properties. Soil Tillage Res. 2015, 153, 145–154. [Google Scholar] [CrossRef] [Scilit]
  19. Jacinto, A.C.; Villar, M.V.; Gómez-Espina, R. Adaptation of the van Genuchten expression to the effects of temperature and density for compacted bentonites. Appl. Clay Sci. 2009, 42, 575–582. [Google Scholar] [CrossRef] [Scilit]
  20. Abd, I.A.; Fattah, M.Y.; Mekkiyah, H. Relationship between the matric suction and the shear strength in unsaturated soil. Case Stud. Constr. Mater. 2020, 13, e00441. [Google Scholar] [CrossRef] [Scilit]
  21. Yang, X.L.; Yin, J.H. Upper bound solution for ultimate bearing capacity with a modified Hoek-Brown failure criterion. Int. J. Rock Mech. Min. Sci. 2005, 42, 550–560. [Google Scholar] [CrossRef] [Scilit]
  22. Hou, C.T.; Yang, X.L. 3D stability analysis of tunnel face with influence of unsaturated transient flow. Tunn. Undergr. Space Technol. 2022, 123, 104414. [Google Scholar] [CrossRef] [Scilit]
  23. Thota, S.K.; Vahedifard, F. Closed-form modeling of matric suction in unsaturated soils under undrained heating. Geomech. Energy Environ. 2022, 32, 100370. [Google Scholar] [CrossRef] [Scilit]
  24. Michalowski, R.L.; Drescher, A. Three-dimensional stability of slopes and excavations. Géotechnique 2009, 59, 839–850. [Google Scholar] [CrossRef] [Scilit]
  25. Yang, X.L.; Huang, F. Collapse mechanism of shallow tunnel based on nonlinear Hoek-Brown failure criterion. Tunn. Undergr. Space Technol. 2011, 26, 686–691. [Google Scholar] [CrossRef] [Scilit]
  26. Li, Z.W.; Yang, X.L. Stability of 3D slope under steady unsaturated flow condition. Eng. Geol. 2018, 242, 150–159. [Google Scholar] [CrossRef] [Scilit]
  27. Li, Z.; Yang, X.; Li, Y. Active earth pressure coefficients based on a 3D rotational mechanism. Comput. Geotech. 2019, 112, 342–349. [Google Scholar] [CrossRef] [Scilit]
  28. Li, Z.; Yang, X. Three-dimensional active earth pressure under transient unsaturated flow conditions. Comput. Geotech. 2020, 123, 103559. [Google Scholar] [CrossRef] [Scilit]
  29. Zhang, Z.L.; Zhu, J.Q.; Yang, X.L. Three-dimensional active earth pressures for unsaturated backfills with cracks considering steady seepage. Int. J. Geomech. 2023, 23, 04022270. [Google Scholar] [CrossRef] [Scilit]
  30. Hou, C.T.; Yang, X.L. Three-dimensional face stability of tunnels in unsaturated soils with nonlinear soil strength. Int. J. Geomech. 2021, 21, 06021006. [Google Scholar] [CrossRef] [Scilit]
  31. Zhang, Z.L.; Yang, X.L. Seismic stability analysis of slopes with cracks in unsaturated soils using pseudo-dynamic approach. Transp. Geotech. 2021, 19, 100583. [Google Scholar] [CrossRef] [Scilit]
  32. Vahedifard, F.; Leshchinsky, B.A.; Mortezaei, K.; Lu, N. Active earth pressures for unsaturated retaining structures. J. Geotech. Geoenviron. Eng. 2015, 141, 04015048. [Google Scholar] [CrossRef] [Scilit]
  33. Lu, N.; Godt, J. Infinite slope stability under steady unsaturated seepage conditions. Water Resour. Res. 2008, 44, W11404. [Google Scholar] [CrossRef] [Scilit]
  34. Lu, N.; Likos, W.J. Suction stress characteristic curve for unsaturated soil. J. Geotech. Geoenviron. Eng. 2006, 132, 131–142. [Google Scholar] [CrossRef] [Scilit]
  35. Thota, S.K.; Vahedifard, F. Stability analysis of unsaturated slopes under elevated temperatures. Eng. Geol. 2021, 293, 106317. [Google Scholar] [CrossRef] [Scilit]
  36. Grant, S.A.; Salehzadeh, A. Calculation of temperature effects on wetting coefffcients of porous solids and their capillary pressure functions. Water Resour. Res. 1996, 32, 261–270. [Google Scholar] [CrossRef] [Scilit]
  37. Yang, X.L.; Yin, J.H. Slope stability analysis with nonlinear failure criterion. J. Eng. Mech. 2004, 130, 267–273. [Google Scholar] [CrossRef] [Scilit]
  38. Gao, Y.F.; Zhang, F.; Lei, G.H.; Li, D.Y. An extended limit analysis of three-dimensional slope stability. Géotechnique 2013, 63, 518–524. [Google Scholar] [CrossRef] [Scilit]
  39. Yang, X.L.; Wang, J.M. Ground movement prediction for tunnels using simplified procedure. Tunn. Undergr. Space Technol. 2011, 26, 462–471. [Google Scholar] [CrossRef] [Scilit]
  40. Li, Z.W.; Li, T.Z.; Yang, X.L. Three-dimensional active earth pressure from cohesive backfills with tensile strength cutoff. Int. J. Numer. Anal. Methods Geomech. 2020, 44, 942–961. [Google Scholar] [CrossRef] [Scilit]
  41. Yang, X.L.; Li, L.; Yin, J.H. Seismic and static stability analysis for rock slopes by a kinematical approach. Geotechnique 2004, 54, 543–549. [Google Scholar] [CrossRef]
  42. Antão, A.N.; Santana, T.G.; da Silva, M.V.; Guerra, N.M.C. Three-dimensional active earth pressure coefficients by upper bound numerical limit analysis. Comput. Geotech. 2016, 79, 96–104. [Google Scholar] [CrossRef] [Scilit]
  43. Yang, X.L.; Li, Z.W. Upper bound analysis of 3D static and seismic active earth pressure. Soil Dyn. Earthq. Eng. 2018, 108, 18–28. [Google Scholar] [CrossRef] [Scilit]
  44. Xu, S.; Zhou, D. An analytical framework for assessing the unsaturated bearing capacity of strip footings under transient infiltration. Mathematics 2023, 11, 3480. [Google Scholar] [CrossRef] [Scilit]
  45. Kang, X.D.; Zhou, D. Analytical Solution for Bearing Capacity of Reinforced Strip Footings on Unsaturated Soils under Steady Flow. Mathematics 2023, 11, 3746. [Google Scholar] [CrossRef] [Scilit]
  46. Shan, J.T.; Wu, Y.M. Three-dimensional stability of two-step slope with crack considering temperature effect on unsaturated soil. Cent. South Univ. 2025, 32, 1060–1079. [Google Scholar] [CrossRef] [Scilit]
  47. Li, Z.-W.; Yang, X.-L. Active Earth Pressure for Soils with Tension Cracks under Steady Unsaturated Flow Conditions. Can. Geotech. J. 2018, 55, 1850–1859. [Google Scholar] [CrossRef] [Scilit]
Figure 1. Three-dimensional horn collapse mechanism.
Mathematics 14 00645 g001
Figure 2. Three-dimensional mechanism incorporating a two-dimensional plane-strain block.
Mathematics 14 00645 g002
Figure 3. Variation in K a under thermal influence versus different B / H and T values corresponding to sand, c / γ H = 0 . (a) H = 2   m , (b) H = 5   m .
Mathematics 14 00645 g003
Figure 4. Variation in K a under thermal influence versus different B / H and T values corresponding to clay: c / γ H = 0.05 . (a) H = 2   m , (b) H = 5   m .
Mathematics 14 00645 g004
Figure 5. Variation in K a versus different q and T values corresponding to sand: H = 5 m, c / γ H = 0 . (a) B/H = 2, (b) B/H = ∞.
Mathematics 14 00645 g005
Figure 6. Variation in K a versus different q and T values corresponding to clay: H = 5 m, c / γ H = 0.05 . (a) B/H = 2, (b) B/H = ∞.
Mathematics 14 00645 g006
Figure 7. Variation in K a under thermal influence versus different B/H and n values corresponding to clay—H = 5 m, c / γ H = 0.05 : (a) B/H = 2; (b) B/H = 5; (c) B/H = 10; (d) B/H = ∞.
Mathematics 14 00645 g007
Table 1. Comparative parameters of two soil types.
Soil c / γ H φ  (°) γ  (kN/m3) k s  (m/s) Δ h T r  (J/m2) n α  (kPa−1)
Sand030203 × 10−5−0.28540.1
Clay0–0.1520205 × 10⁻⁸−0.5161.1–8.50.005
Table 2. Comparison between the present solution for K a and that of Antão et al. [42], corresponding to b , β = 90 ° and c / γ H = 0 .
B / H Reference φ
15202530354045
2Antão et al.0.56000.45570.37180.30050.24160.18810.1508
This study0.57340.47070.38710.31400.25560.20290.1647
5Antão et al.0.5750.47750.39070.31950.25770.20470.1619
This study0.57760.48220.39880.31660.24520.18440.1406
10Antão et al.0.57350.47570.39250.32170.26080.20910.1648
This study0.58200.48160.39960.32680.24310.18880.1472
Antão et al.0.58840.48950.40480.33180.26900.21490.1682
This study0.58130.48150.39970.32420.25910.20650.1599
Table 3. Comparison between the present solution for K a and that of Yang and Li [43], without temperature effects, corresponding to ( q = 0 denotes no-flow condition) b , β = 90 ° and c / γ H = 0 .
B / H δ / φ Reference φ
15°20°25°30°35°40°45°
2.00Yang and Li0.56000.45570.37180.30050.24060.18810.1508
This study0.57340.47070.38710.31400.25560.20290.1647
1/3Yang and Li0.52450.42550.35030.27830.22380.17840.1407
This study0.53680.43770.36470.29340.24010.19050.1543
1/2Yang and Li0.51350.41560.33680.27240.220.17640.1402
This study0.52430.43080.35160.29110.23170.18850.1551
2/3Yang and Li0.50530.40880.34080.26970.2190.17740.1426
This study0.51890.42140.35390.28310.23290.18970.1559
1Yang and Li0.4970.40430.33180.27390.22760.18970.1583
This study0.51130.42190.34890.28860.2420.20610.1725
5.00Yang and Li0.5750.47750.39070.31950.25770.20470.1619
This study0.57760.48220.39880.31660.25570.20460.1657
1/3Yang and Li0.54370.44510.36350.29630.23950.1920.1516
This study0.5520.45930.38170.31090.24710.1950.1570
1/2Yang and Li0.53280.43530.35560.29040.23570.19010.1470
This study0.54320.45080.37160.29510.2460.19850.1541
2/3Yang and Li0.52460.42870.35090.28790.23520.19140.1542
This study0.53360.44630.37000.30120.24170.20130.1619
1Yang and Li0.51160.42450.35140.29310.24510.20550.1721
This study0.52160.43340.36240.30380.25530.21490.1807
0Yang and Li0.58840.48950.40480.33180.2690.21490.1682
This study0.58130.48150.39970.32420.25910.20650.1599
1/3Yang and Li0.55680.45880.37710.30840.25020.20060.1583
This study0.55360.45480.37510.30570.24890.19760.1575
1/2Yang and Li0.5460.4490.36920.30250.24650.19890.1581
This study0.5450.4480.36810.30140.2460.19850.1581
2/3Yang and Li0.53780.44340.36450.30010.24610.20050.1613
This study0.53670.44120.36120.29940.24570.20130.1619
1Yang and Li0.53030.43880.36550.30620.25710.21590.1806
This study0.52640.43470.36240.30380.25530.21490.1807
Table 4. Comparison of 3D and 2D active earth pressure coefficients ( K a ).
c / γ H This Study ( K a )This Study ( K a )Yang and Li ( K a )3D Reduction RatioRelative Deviation
B / H = 2 B / H = 1000 2D K a B / H = 2 K a B / H = 1000 K a B / H = 2  × % K a 2 D K a B / H = 1000 K a 2 D  × %
0.000.3100.3530.36212.12.49
0.010.2830.3320.34214.72.92
0.020.2560.3110.32117.63.11
0.030.2290.2900.30121.03.65
0.040.2020.2690.28024.93.93
0.050.1750.2480.25929.44.25
0.060.1480.2270.23934.85.02
0.070.1260.2060.21838.85.50
0.080.1040.1850.19843.86.56
0.090.0820.1640.17649.96.81
0.100.0600.1430.15758.48.91
Disclaimer/Publisher’s Note: The statements, opinions and data contained in all publications are solely those of the individual author(s) and contributor(s) and not of MDPI and/or the editor(s). MDPI and/or the editor(s) disclaim responsibility for any injury to people or property resulting from any ideas, methods, instructions or products referred to in the content.