Article

Optimizing HPV Vaccination Strategy: An Optimal Control Problem

1
Laboratory of Bio-Informatic, Mathematics, Statistics (BIMS)-LR 16 IPT 09, Pasteur Institute of Tunis, Belvédère, Tunis 1002, Tunisia
2
Mediterranean School of Business (MSB), South Mediterranean University, Jardins du Lac, Tunis 1053, Tunisia
3
National School of Engineers of Tunis (ENIT), University of Tunis El Manar, Tunis 1068, Tunisia
4
Laboratory of Nonlinear Analysis and Applied Mathematics, Department of Mathematics, Faculty of Science, University of Tlemcen, Tlemcen 13000, Algeria
5
Preparatory Institute for Engineering Studies of Tunis (IPEIT), University of Tunis, Monfleury, Tunis 1008, Tunisia
*
Authors to whom correspondence should be addressed.
Mathematics 2026, 14(10), 1634; https://doi.org/10.3390/math14101634
Submission received: 16 January 2026 / Revised: 12 February 2026 / Accepted: 26 February 2026 / Published: 12 May 2026

Abstract

Human papillomavirus (HPV) is one of the most widespread sexually transmitted infections globally, whose persistent infection plays a major role in causing cervical cancer. Vaccination is therefore a key prevention strategy. Using a gender-stratified dynamic transmission model tailored to a Tunisian case, we investigate the impact of bivalent HPV vaccination. The proposed model accounts for partial cross-immunity and captures both direct and indirect effects of female-only vaccination. We derive the basic reproduction number and the corresponding herd immunity threshold, and a global sensitivity analysis shows that vaccine coverage, efficacy, and cross-protection are strong drivers of transmission reduction. Their combined effects on disease spread are quantified by varying these parameters across biologically relevant ranges. An optimal control problem was formulated and analyzed using Pontryagin’s Maximum Principle to minimize persistent infections and cancer cases while limiting vaccination effort. Three vaccination scenarios are compared: an ideal case with full vaccine availability and two resource-constrained cases with respective maximum coverage rates of 100 % and 80 % . The numerical simulations revealed that the optimal strategy under unconstrained conditions can achieve significant suppression of infection, persistence, and cancer. Under constrained effort, the optimal control still achieves substantial reductions in disease burden, with minor differences in dynamics and speed of immunity buildup. Our results highlight the effectiveness of female-only HPV vaccination in providing both direct and indirect protection. They also emphasize the importance of sustained coverage in constrained settings.

1. Introduction

Human papillomavirus (HPV) is one of the most prevalent sexually transmitted infections worldwide, with over 200 identified types, of which around 30 are transmitted through direct sexual contact [1]. Although most infections are asymptomatic and resolve spontaneously, persistent infections with high-risk HPV types are strongly associated with the development of several anogenital and oropharyngeal cancers [1,2,3]. Among these, cervical cancer remains the most significant burden globally, accounting for a substantial proportion of morbidity and mortality among women [1,4].
Approximately 70 % of cervical cancer cases worldwide are caused by HPV types 16 and 18, making them the most oncogenic and high-priority targets for vaccination. However, other high-risk HPV types—such as 31, 33, 45, 52, and 58—are responsible for an estimated 20–30% of global cervical cancer cases, further contributing to the disease burden [5]. In response to this epidemiological profile, all currently available HPV vaccines include protection against HPV-16 and -18. The bivalent vaccine targets only these two types, while the quadrivalent vaccine adds coverage for types 6 and 11 (associated with genital warts). the nanovalent vaccine extends protection to five additional high-risk types (31, 33, 45, 52, and 58) in recognition of their substantial role in cervical carcinogenesis [6].
Regarding the vaccination strategy, although the disease primarily affects females, many countries have adopted gender-neutral HPV vaccination strategies that include both boys and girls in their national immunization schedules, with countries such as Australia, the United States, the United Kingdom, and Canada demonstrating the feasibility and benefits of universal coverage in reducing virus circulation. However, in low- and middle-income countries, financial and logistical constraints often necessitate prioritizing one gender—typically females—for vaccination. This has been the case in Tunisia, where resource limitations have led policymakers to implement a female-only vaccination strategy, especially as evidence suggests that the female-only vaccination programs can still provide indirect protection to males through herd effects [7,8]. Due to the same constraints, the bivalent vaccine has been presented as the main choice for national use. This choice has also stemmed from the fit of this vaccine to the Tunisian circulating genotypes. In fact, recent epidemiological studies in Tunisia reveal a distinct type distribution: HPV-31 is the most prevalent high-risk type, followed by types 16, 59, and 52, with HPV-18 ranking only eighth in frequency [9]. Cost-effectiveness analyses confirm that the bivalent vaccine is the most efficient choice for the Tunisian context [10,11]. Moreover, this vaccine exhibits broader cross-protection against the most prevalent genotypes in Tunisia, which is particularly valuable when there is a mismatch between vaccine-included types and circulating high-risk HPV types [12,13]. However, despite identifying the most cost-effective strategy, questions regarding the long-term impact persist, highlighting the need to optimize vaccine allocation to achieve maximal long-term cross-protection in settings where non-vaccine-targeted types dominate. In this context, mathematical modeling and optimal control have been widely used for a range of diseases to optimize control strategies, whether from a health point of view or from an economic one [14,15,16], and HPV is not an exception [17,18]. In [19], the authors use mathematical modeling to study the impact of vaccine cross-immunity on cancer cases. While in [8], mathematical modeling serves to evaluate the cost-effectiveness and health impact of various HPV vaccine dosing strategies in low- and middle-income countries. Mathematical modeling extends in [20] to other aspects, where the author aims to study whether an optimal control of HPV infection can lower the number of cancer cells responsible for cervical cases. A different aspect is presented in [21], where optimal control is used to determine the best vaccination plans for the related non-autonomous model in which the immunization rates vary with time.
In this study, we develop a gender-structured mathematical model and formulate an optimal control problem to determine time-dependent bivalent vaccination strategies under realistic resource constraints, focusing on identifying vaccination rates that minimize persistent infections and cervical cancer cases, evaluating the impact of different resource-limited scenarios, and providing evidence to inform national immunization policies and improve vaccine allocation efficiency in resource-limited settings.
With this aim, we propose a modeling framework, structured by gender, which is needed to capture the heterosexual aspect of the population. The optimal control problem is proposed to compare the effect of three different types of constraints on cancer and persistent infection prevalence: (i) the ideal scenario with no resource constraints, (ii) resource constraints coupled with a maximal vaccination effort of 100 % and (iii) resource constraints coupled with a maximal vaccination effort of 80 % .
This paper is organized as follows. The mathematical model is described in Section 2. This is followed by Section 3, where we discuss the well-posedness of the model and the boundedness of the solutions, presenting the computations of the basic reproduction number R 0 and herd-immunity vaccination coverage. In Section 4, a global sensitivity analysis of the parameters influencing the strain-specific basic reproduction numbers was conducted to identify the principal drivers of transmission. Subsequently, targeted parameter variations were performed to qualitatively assess how vaccination coverage, vaccine efficacy, and cross-protection shape strain-specific transmission and herd immunity thresholds. In Section 5, the optimal control problem is presented and then studied both analytically and numerically. The estimation of the parameters needed for the numerical simulations is provided in Appendices Appendix A and Appendix B. The paper concludes with a discussion of the results and the conclusion.

2. Model Formulation

The proposed model, inspired by the work in [19], describes the transmission dynamics of two-strain Human papillomavirus (HPV) infection within a heterosexual population, under the assumption of homogeneous mixing between genders, implying uniform contact probabilities across sexually-active individuals, independent of age [22,23]. In this framework, strain 1 corresponds to genotypes 16 and 18, while strain 2 comprises genotypes 31, 59, and 52. The total population at time t, denoted by N ( t ) , is partitioned into female and male subpopulations N f ( t ) and N m ( t ) , i.e.,
N ( t ) = N f ( t ) + N m ( t ) .
The female population, at time t, N f ( t ) is further subdivided into nine epidemiological compartments: susceptible females S f ( t ) , vaccinated females V ( t ) who received the bivalent Cervarix vaccine, females infected with strain i, I f i ( t ) for i = 1 , 2 , females recovered from strain i, R f i ( t ) , females with persistent infection by strain i, P f i ( t ) , and females with cervical cancer C ( t ) , i.e.,
N f ( t ) = S f ( t ) + V ( t ) + I f 1 ( t ) + I f 2 ( t ) + R f 1 ( t ) + R f 2 ( t ) + P f 1 ( t ) + P f 2 ( t ) + C ( t ) .
Susceptible females enter the population at a recruitment rate ( 1 f ) Λ f , where f denotes the vaccination rate. They may become infected through contact with infectious males carrying either strain 1 or 2 at forces of infection λ m 1 and λ m 2 or may exit due to natural mortality at a rate of μ f . The vaccinated compartment receives newly recruited females at a rate of f Λ f . Vaccinated females may become infected by strain 1 at a reduced rate ( 1 ξ ) λ m 1 , where ξ represents vaccine efficacy, or by strain 2 at a reduced rate η I λ m 2 , where η I denotes the residual susceptibility to the non-targeted strain, and therefore 1 η I quantifies the average level of cross-protection efficacy.
Individuals join the infected compartments I f 1 and I f 2 through infections occurring from contacts between infectious males and females in susceptible, vaccinated, or recovered states. Recovered females acquire partial immunity to the same strain, which reduces their infection rates by factors ε 1 for strain 1 and ε 2 for strain 2. They exit these through either natural mortality at a rate of μ f or progression to another compartment at a rate of τ f i . A proportion p i recovers and joins the recovered compartments R f i , which lose individuals through reinfection or natural mortality. The remaining fraction ( 1 p i ) progresses to the persistent infection compartments P f i , which lose individuals by natural mortality or progression either to recovery at rates of q 1 κ f 1 (strain 1) and q 2 η C κ f 2 (strain 2) or to cancer at rates of ( 1 q 1 ) κ f 1 and ( 1 q 2 ) η C κ f 2 , respectively. The cancer compartment C loses individuals via natural mortality μ f and disease-induced mortality δ .
The male population at time t, N m ( t ) is stratified into susceptible males S m ( t ) , infected males I m i ( t ) , and recovered males R m i ( t ) for strains i = 1 , 2 , i.e.,
N m ( t ) = S m ( t ) + I m 1 ( t ) + R m 1 ( t ) + I m 2 ( t ) + R m 2 ( t ) .
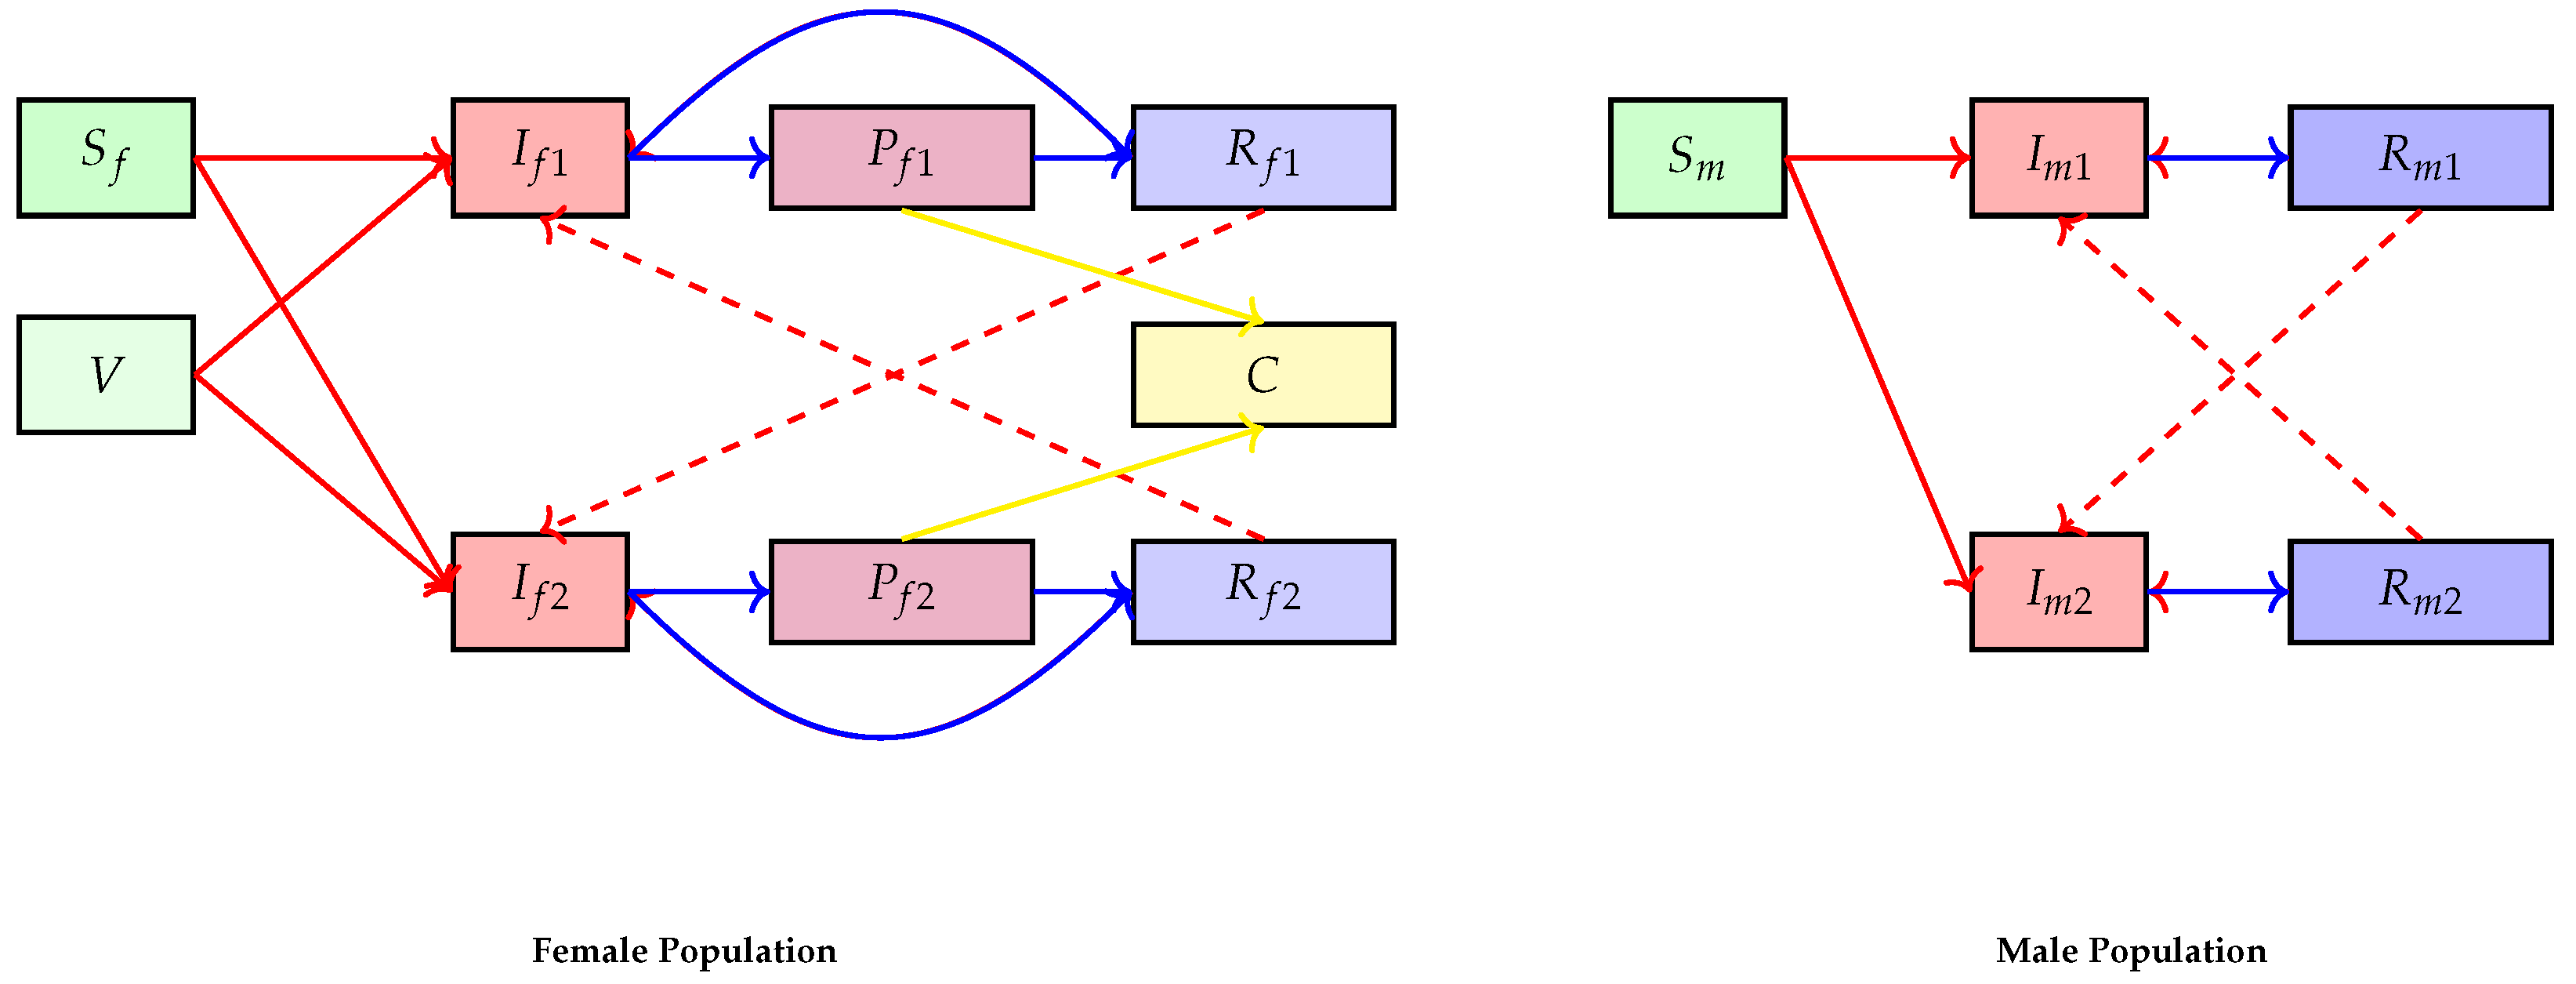
Susceptible males are recruited at a rate of Λ m and can become infected at force of infection rates λ f i , i = 1 , 2 through contact with infectious females or exit through natural mortality at a rate of μ m . The infected compartments I m i , i = 1 , 2 gain individuals through infection of susceptible or recovered males and lose them through recovery at a rate of τ m i , i = 1 , 2 or natural mortality. The recovered male compartments lose individuals through either reinfection or natural mortality. Note that reinfection of recovered males by the same strain occurs at reduced rates modeled by parameters ε 3 for strain 1 and ε 4 for strain 2 (See Figure 1).
The model equations are given by the system (1)–(14) below:
d S f d t = ( 1 f ) Λ f λ m 1 + λ m 2 + μ f S f
d V d t = f Λ f ( 1 ξ ) λ m 1 + η I λ m 2 + μ f V
d I f 1 d t = λ m 1 ( 1 ξ ) V + S f + ε 1 R f 1 + R f 2 τ f 1 + μ f I f 1
d I f 2 d t = λ m 2 η I V + S f + R f 1 + ε 2 R f 2 τ f 2 + μ f I f 2
d R f 1 d t = p 1 τ f 1 I f 1 + q 1 κ f 1 P f 1 μ f + λ m 2 + ε 1 λ m 1 R f 1
d R f 2 d t = p 2 τ f 2 I f 2 + q 2 η c κ f 2 P f 2 μ f + λ m 1 + ε 2 λ m 2 R f 2
d P f 1 d t = 1 p 1 τ f 1 I f 1 κ f 1 + μ f P f 1
d P f 2 d t = 1 p 2 τ f 2 I f 2 η c κ f 2 + μ f P f 2
d C d t = 1 q 1 κ f 1 P f 1 + η c 1 q 2 κ f 2 P f 2 ( μ f + δ ) C
d S m d t = Λ m λ f 1 + λ f 2 + μ m S m
d I m 1 d t = λ f 1 S m + ε 3 R m 1 + R m 2 τ m 1 + μ m I m 1
d I m 2 d t = λ f 2 S m + R m 1 + ε 4 R m 2 τ m 2 + μ m I m 2
d R m 1 d t = τ m 1 I m 1 μ m + ε 3 λ f 1 + λ f 2 R m 1
d R m 2 d t = τ m 2 I m 2 μ m + λ f 1 + ε 4 λ f 2 R m 2
where
λ m 1 = β m 1 I m 1 N m , λ m 2 = β m 2 I m 2 N m , λ f 1 = β f 1 I f 1 + θ p 1 P f 1 N f and λ f 2 = β f 2 I f 2 + θ p 2 P f 2 N f .

3. Mathematical Analysis

3.1. Existence, Positivity and Boundedness of the Solutions

To ensure that the model is well-posed, it is important to prove the existence of a unique solution for each initial condition. For biological meaning, all solutions with non-negative initial conditions must remain non-negative at all positive times. The following propositions deal with these two aspects to show that the model is suitable for studying living populations.
Let X be the vector of state variables, where
X = ( X 1 , , X 14 ) = ( S f , V , I f 1 , I f 2 , R f 1 , R f 2 , P f 1 , P f 2 , C , S m , I m 1 , I m 2 , R m 1 , R m 2 ) .
Proposition 1.
For every initial condition X ( 0 ) , there exists a unique solution. Additionally, for any non-negative initial condition X ( 0 ) , the solution X ( t ) remains positive for all t [ 0 , T ] with T > 0 . Furthermore, the set Ω given by
Ω = X = ( X 1 , , X 14 ) ( R 14 ) : 0 N f ( t ) Λ f μ f and 0 N f ( t ) Λ m μ m , for all t [ 0 , T ] .
is positively invariant under system (1)–(14).
Proof. 
  • Existence and uniqueness of the solution: Assume the initial condition X ( 0 ) = X 0 , is given. The right-hand side f ( X ) is of class C 1 on U R × R 14 containing ( 0 , X 0 ) . Thus, the Cauchy–Lipschitz theorem grants the existence and uniqueness of a solution on a neighbourhood of the initial time. Moreover, because the vector field is C 1 over [ 0 , T ] × R n , the boundedness of the solutions (shown below) ensures that the solution extends uniquely to the whole interval.
  • Positivity: For all 1 i 14 , if X i = 0 and all other variables are positive, i.e., X k 0 for k i , X i ˙ 0 . Thus, on each of the aforementioned hyperplanes, the vector field is either invariant or points to the interior of the positive region. As a result, the solution is unable to exit the positive zone.
  • Boundedness: Moreover, for all time t [ 0 , T ] , N f ( 0 ) Λ f μ f , and N m ( 0 ) Λ m μ m , one has
    N f ( t ) = N f ( 0 ) Λ f μ f e μ f t + Λ f μ f δ e μ f t 0 t e μ f s C ( s ) d s N f ( 0 ) Λ f μ f e μ f t + Λ f μ f Λ f μ f .
    and
    N m ( t ) = N m ( 0 ) Λ m μ m e μ m t + Λ m μ m Λ m μ m .
    Since, for all t 0 , the total population N ( t ) = N f ( t ) + N m ( t ) , one has
    N ( t ) Λ f μ f + Λ m μ m .
This proposition addresses challenges related to both mathematical existence and biological applicability to live populations.  □

3.2. Disease-Free Equilibrium, Basic Reproduction Number, and Herd Immunity

To assess the epidemic potential of the two HPV strains circulating in the population, we compute the basic reproduction number R 0 using the next-generation matrix (NGM) method [24,25]. This threshold quantity represents the expected number of secondary infections generated by a single infected individual introduced into a fully susceptible population.
Let us denote the infected compartments associated with strain 1 by
x 1 = I f 1 P f 1 I m 1 T ,
and those for strain 2 by
x 2 = I f 2 P f 2 I m 2 T .
At the disease-free equilibrium E 0 , all infected compartments are set to zero, and the susceptible compartments are given by
S f 0 = ( 1 f ) Λ f μ f , V 0 = f Λ f μ f , S m 0 = Λ m μ m ,
We first derive the basic reproduction number of strain 1, and we decompose the dynamics of the infected compartments into new infection terms F 1 and transition terms 𝒱 1 such that
d x 1 d t = F 1 ( x 1 ) 𝒱 1 ( x 1 ) ,
with
F 1 = β m 1 S f 0 + ( 1 ξ ) V 0 N m I m 1 0 β f 1 S m 0 N f I f 1 + β f 1 θ p 1 S m 0 N f P f 1 , 𝒱 1 = ( τ f 1 + μ f ) I f 1 ( 1 p 1 ) τ f 1 I f 1 + ( κ f 1 + μ f ) P f 1 ( τ m 1 + μ m ) I m 1 .
Linearizing around the DFE, the corresponding Jacobian matrices F 1 and V 1 are
F 1 = 0 0 β m 1 ( S f 0 + ( 1 ξ ) V 0 ) N m 0 0 0 β f 1 S m 0 N f β f 1 θ p 1 S m 0 N f 0 , V 1 = τ f 1 + μ f 0 0 ( 1 p 1 ) τ f 1 κ f 1 + μ f 0 0 0 τ m 1 + μ m .
Following the standard NGM approach [24,25], these matrices satisfy the required conditions: F 1 is non-negative, and V 1 is a non-singular M-matrix ( V 1 1 0 ); its inverse is therefore
V 1 1 = 1 τ f 1 + μ f 0 0 ( 1 p 1 ) τ f 1 ( τ f 1 + μ f ) ( κ f 1 + μ f ) 1 κ f 1 + μ f 0 0 0 1 τ m 1 + μ m .
Multiplying F 1 by V 1 1 , we obtain
F 1 V 1 1 = 0 0 β m 1 S f * + ( 1 ξ ) V * N m * ( τ m 1 + μ m ) 0 0 0 β f 1 S m * N f * ( τ f 1 + μ f ) + β f 1 θ p 1 S m * ( 1 p 1 ) τ f 1 N f * ( τ f 1 + μ f ) ( κ f 1 + μ f ) β f 1 θ p 1 S m * N f * ( κ f 1 + μ f ) 0 .
Using S m * / N m * = 1 and S f * + ( 1 ξ ) V * N f * = 1 f ξ , the basic reproduction number of strain 1, R 0 , 1 , is defined as the spectral radius of F 1 V 1 1 :
R 0 , 1 = β m 1 β f 1 ( 1 f ξ ) κ f 1 + μ f + τ f 1 θ p 1 ( 1 p 1 ) ( κ f 1 + μ f ) ( τ f 1 + μ f ) ( τ m 1 + μ m ) .
Repeating the derivation for strain 2, we obtain
R 0 , 2 = β m 2 β f 2 1 f ( 1 η I ) η c κ f 2 + μ f + τ f 2 θ p 2 ( 1 p 2 ) ( η c κ f 2 + μ f ) ( τ f 2 + μ f ) ( τ m 2 + μ m ) .
While R 0 , 1 is directly reduced by vaccination through coverage f and efficacy ξ , R 0 , 2 is influenced indirectly via cross-protection, captured by the parameters η I and η c .
Hence, the overall basic reproduction number is given by
R 0 = max R 01 , R 02 .
This reflects the fact that the strain with the highest reproduction number will dominate the initial spread in a naive population.
As a direct consequence of Theorem 2 cited in [25], we obtain the local stability for the DFE. The result is formalized as follows.
Proposition 2.
The DFE E 0 = ( ( 1 f ) Λ f μ f , f Λ f μ f , 0 , 0 , 0 , 0 , 0 , 0 , 0 , Λ m μ m , 0 , 0 , 0 , 0 ) is locally asymptotically stable if R 0 < 1 and unstable if R 0 > 1 .

Herd Immunity Threshold

To determine the vaccination coverage required to eliminate both HPV strains, we derive the herd immunity threshold f c , defined as the critical proportion of vaccinated females needed to reduce the basic reproduction number of both strains below unity. The herd immunity threshold is the minimal vaccination coverage f = f c such that both reproduction numbers satisfy R 01 ( f c ) < 1 and R 02 ( f c ) < 1 . Solving R 0 i ( f c ) = 1 for f c , we obtain the strain-specific thresholds:
f c , 1 = β m 1 β f 1 κ f 1 + μ f + τ f 1 θ p 1 ( 1 p 1 ) ( κ f 1 + μ f ) ( τ f 1 + μ f ) ( τ m 1 + μ m ) ξ β m 1 β f 1 κ f 1 + μ f + τ f 1 θ p 1 ( 1 p 1 ) ,
f c , 2 = β m 2 β f 2 η c κ f 2 + μ f + τ f 2 θ p 2 ( 1 p 2 ) ( η c κ f 2 + μ f ) ( τ f 2 + μ f ) ( τ m 2 + μ m ) ( 1 η I ) β m 2 β f 2 η c κ f 2 + μ f + τ f 2 θ p 2 ( 1 p 2 ) .
To simultaneously control both strains, it is necessary and sufficient that
f f c : = max { f c , 1 , f c , 2 } .
where f c is the overall herd immunity threshold.
This threshold indicates the minimum fraction of vaccinated females required to prevent sustained transmission of both HPV strains in the population. It depends not only on the transmission potential of each strain but also on vaccine-induced cross-protection ( ξ , η I ), infectiousness of persistent infections ( θ p i ), and gender-specific progression rates.

3.3. Existence of One-Strain Endemic Equilibria

Proposition 3.
The one-strain endemic equilibrium of the model (1)–(14) is given by
  • E 1 * = ( S f 1 * , V 1 * , I f 1 * , 0 , R f 1 * , 0 , P f 1 * , 0 , C 1 * , S m 1 * , I m 1 * , 0 , R m 1 * , 0 ) for strain 1;
  • E 2 * = ( S f 2 * , V 2 * , 0 , I f 2 * , 0 , R f 2 * , 0 , P f 2 * , C 2 * , S m 2 * , 0 , I m 2 * , 0 , R m 2 * ) for strain 2,
where, for i { 1 , 2 }
S f i * = ( 1 f ) Λ f λ m i * + μ f where λ m i * = β m i μ m I m i * Λ m , V 1 * = f Λ f ( 1 ξ ) λ m 1 * + μ f and V 2 * = f Λ f η C λ m 2 * + μ f , P f i * = A P i I f i * where A P i = ( 1 p i ) τ f i α i κ f i + μ f with α 1 = 1 and α 2 = η I , R f i * = A R i ε i λ m i * + μ f I f i * where A R i = p i τ f i + α i q i κ f i A P i , C i * = A C i I f i * where A C i = A P i α i ( 1 q i ) κ f i δ + μ f , S m i * = Λ m λ f i * + μ m where λ f i * = β f i μ f ( 1 + θ P i A P i ) I f i * Λ f , R m i * = τ m i ε i + 2 λ f i * + μ m I m i * , I m i * = Λ m λ f i * ε i + 2 λ f i * + μ m μ m λ f i * + μ m ε i + 2 λ f i * + μ m + τ m i .
and I f i * is any positive root of
Q ( I f i * ) = Λ f λ m i * ( ε i λ m i * + μ f ) γ i f ( λ m i * + μ f ) + ( 1 f ) ( γ i λ m i * + μ f ) + ( γ i λ m i * + μ f ) ( λ m i * + μ f ) I f i * ε i A R i λ m i * ( τ f i + μ f ) ( ε i λ m i * + μ f ) .
where γ 1 = 1 ξ and γ 2 = η I .
Proof. 
The strain 1 equilibrium is obtained by setting strain 2 compartments to 0. The model is reduced.
The first and second equations yield
S f 1 * = ( 1 f ) Λ f λ m 1 * + μ f .
and
V 1 * = f Λ f ( 1 ξ ) λ m 1 * + μ f .
where λ m 1 * = β m 1 I m 1 * N m * = β m 1 μ m I m 1 * Λ m . Then, the fifth and sixth equations yield
P f 1 * = A P 1 I f 1 * where A P 1 = ( 1 p 1 ) τ f 1 κ f 1 + μ f
and
C * = A C I f 1 * where A C = A P 1 ( 1 q 1 ) κ f 1 δ + μ f .
Then, the fourth equation yields
R f 1 * = A R 1 ε 1 λ m 1 * + μ f I f 1 * where A R 1 = p 1 τ f 1 + q 1 κ f 1 A P 1 .
On the other hand, the seventh equation yields
S m * = Λ m λ f 1 * + μ m ,
where λ f 1 = β f 1 ( 1 + θ P 1 A P 1 ) I f 1 * N f * , and the nineth equation results in
R m 1 * = τ m 1 ε 3 λ f 1 * + μ m I m 1 * .
Thus, the eighth yields
I m 1 * = λ f 1 * ( ε 3 λ f 1 * + μ m ) Λ m ( τ m 1 + μ m ) ( ε 3 λ f 1 * + μ m ) ε 3 τ m ( λ f 1 * + μ m ) = λ f 1 * ( ε 3 λ f 1 * + μ m ) Λ m μ m τ m 1 + μ m + ε 3 λ f 1 * ( λ f 1 * + μ m ) .
Since I m 1 * depends on I f 1 * , λ m 1 * would consequently depend on it. Thus, I f 1 * is any positive root of the expression given by
Q ( I f 1 * ) = Λ f λ m 1 * ( ε 1 λ m 1 * + μ f ) ( 1 ξ ) f ( λ m 1 * + μ f ) + ( 1 f ) ( ( 1 ξ ) λ m 1 * + μ f ) + ( ( 1 ξ ) λ m 1 * + μ f ) ( λ m 1 * + μ f ) I f 1 * ε 1 A R 1 λ m 1 * ( τ f 1 + μ f ) ( ε 1 λ m 1 * + μ f ) .

3.4. Existence of the Two-Strain Equilibrium

Due to the complexity of the system, the coexistence equilibrium was numerically checked for 80 % vaccine coverage.
S f = 420,258.52 , V = 2,607,271.35 , I f 1 = 12,853.23 , I f 2 = 34,055.00 , R f 1 = 222,202.84 , R f 2 = 1,764,366.08 , P f 1 = 30,428.05 , P f 2 = 181,304.36 , C = 152,782.62 , S m = 1,588,933.34 , I m 1 = 27,661.49 , I m 2 = 79,041.11 , R m 1 = 405,766.85 , R m 2 = 3,625,740.07 .
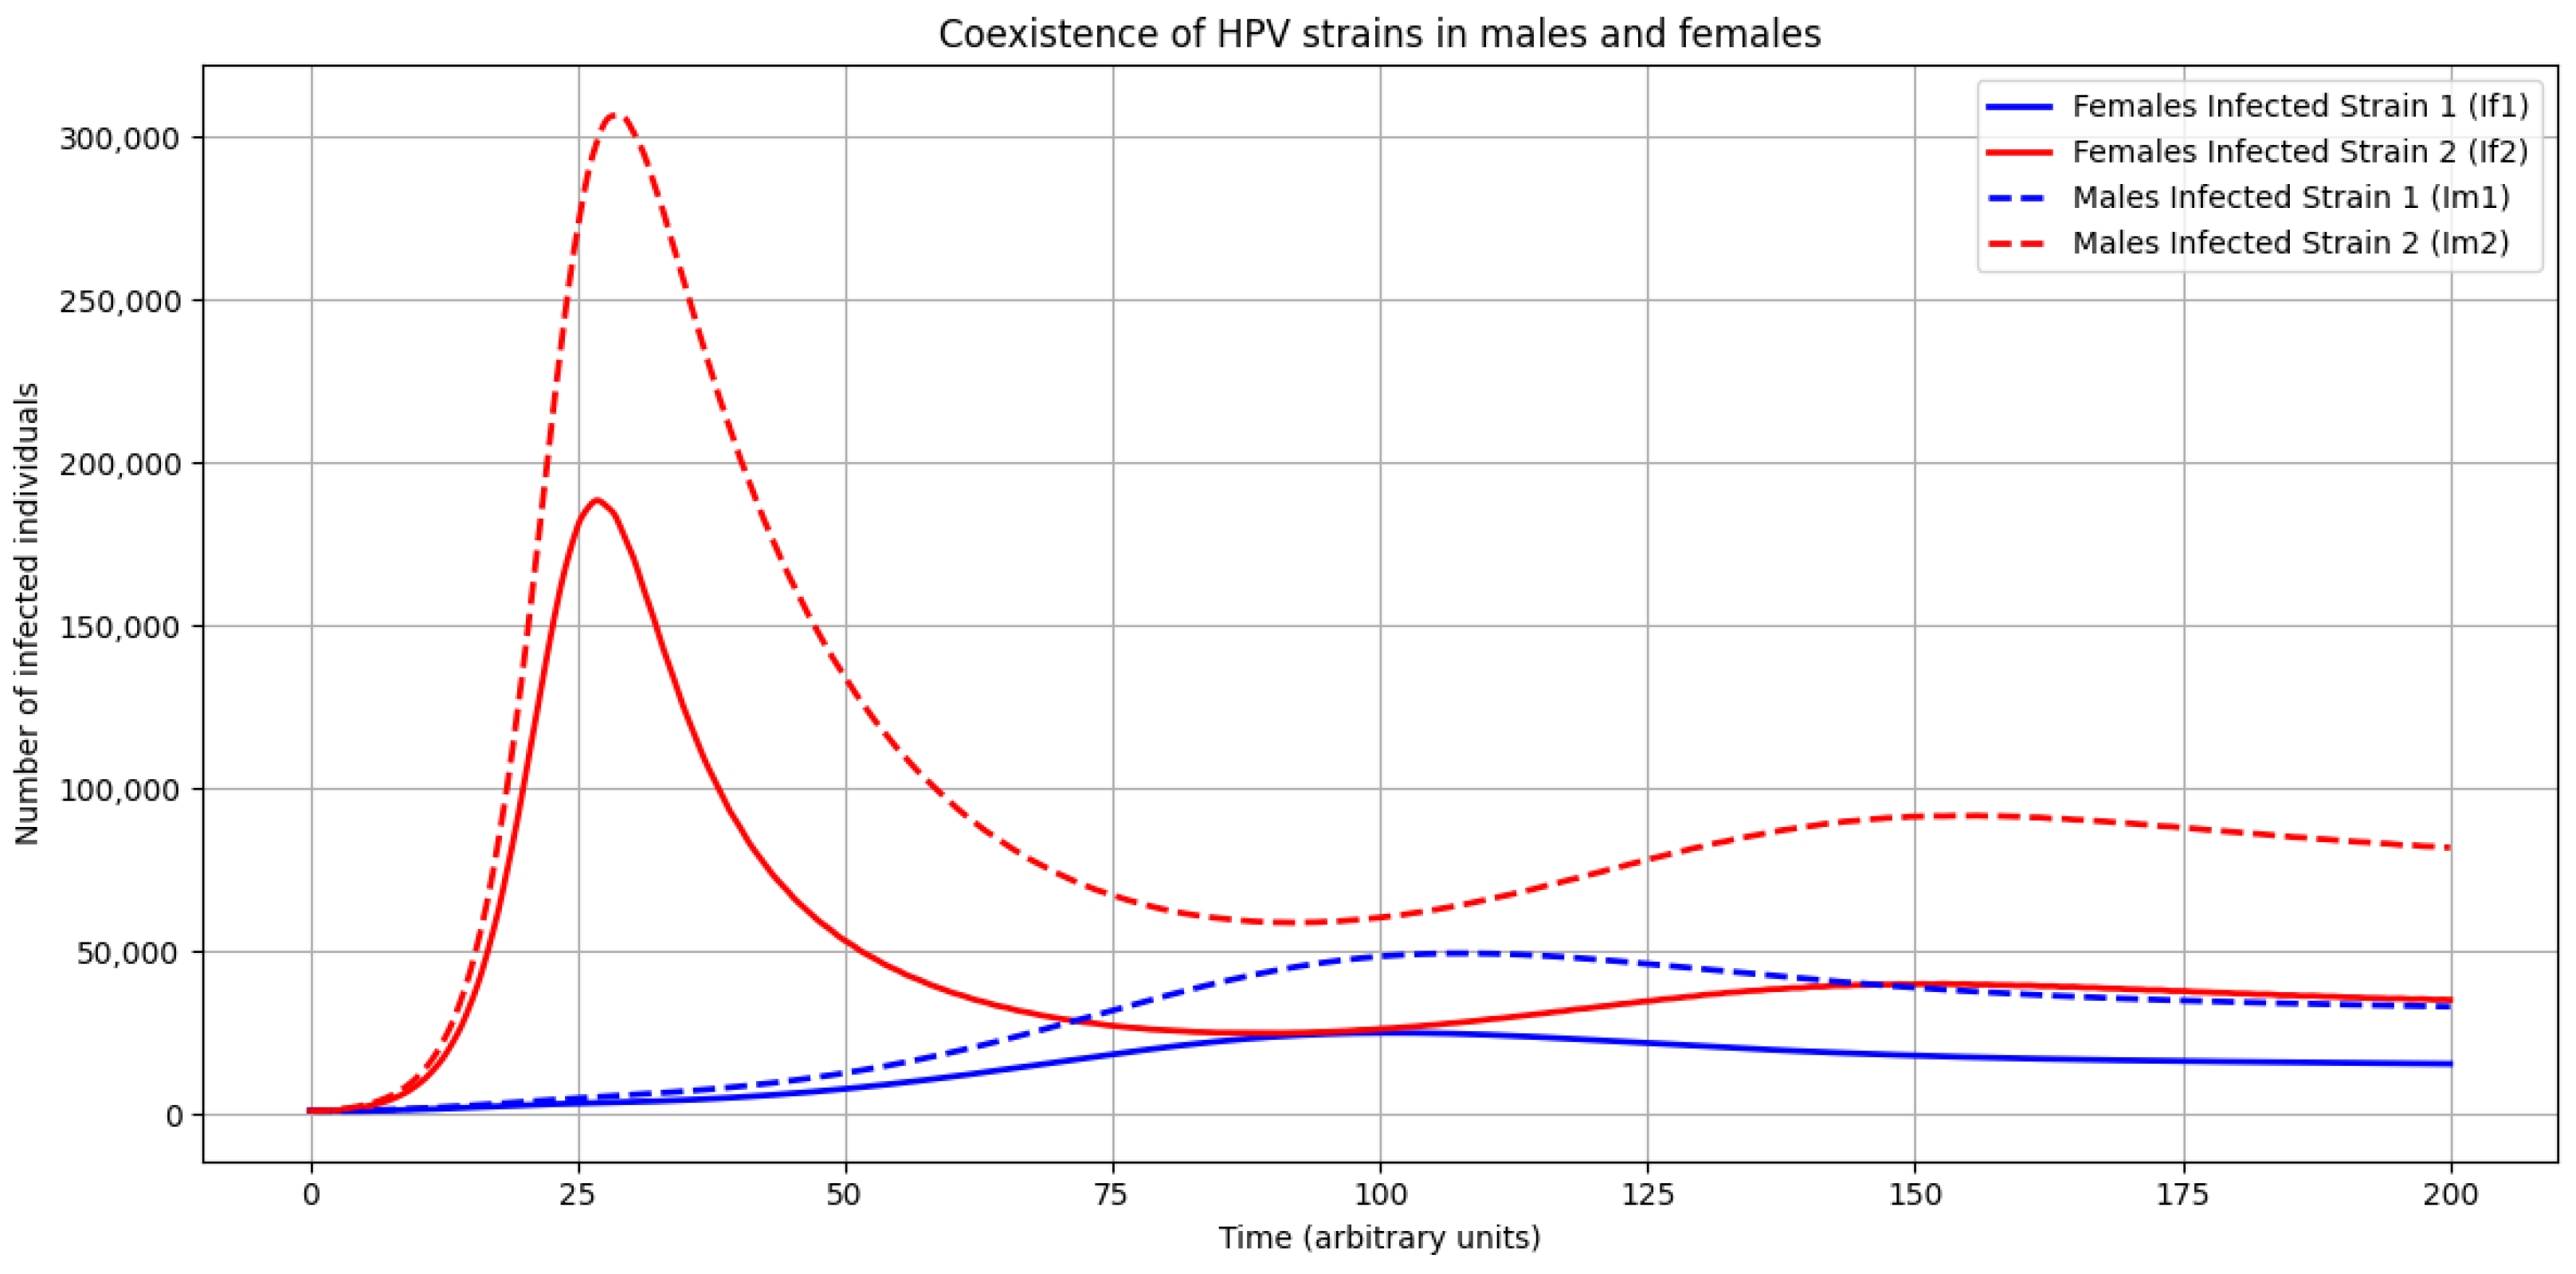
Figure 2 shows how the two HPV strains evolve over time in males and females. Even though the peaks are quite different due to the difference in the vaccine’s impact on the two strains, they both remain present in the population. After the initial peak, each strain settles to a steady level, indicating that they continue to coexist despite the unequal impact of vaccination.

4. Sensitivity Analysis

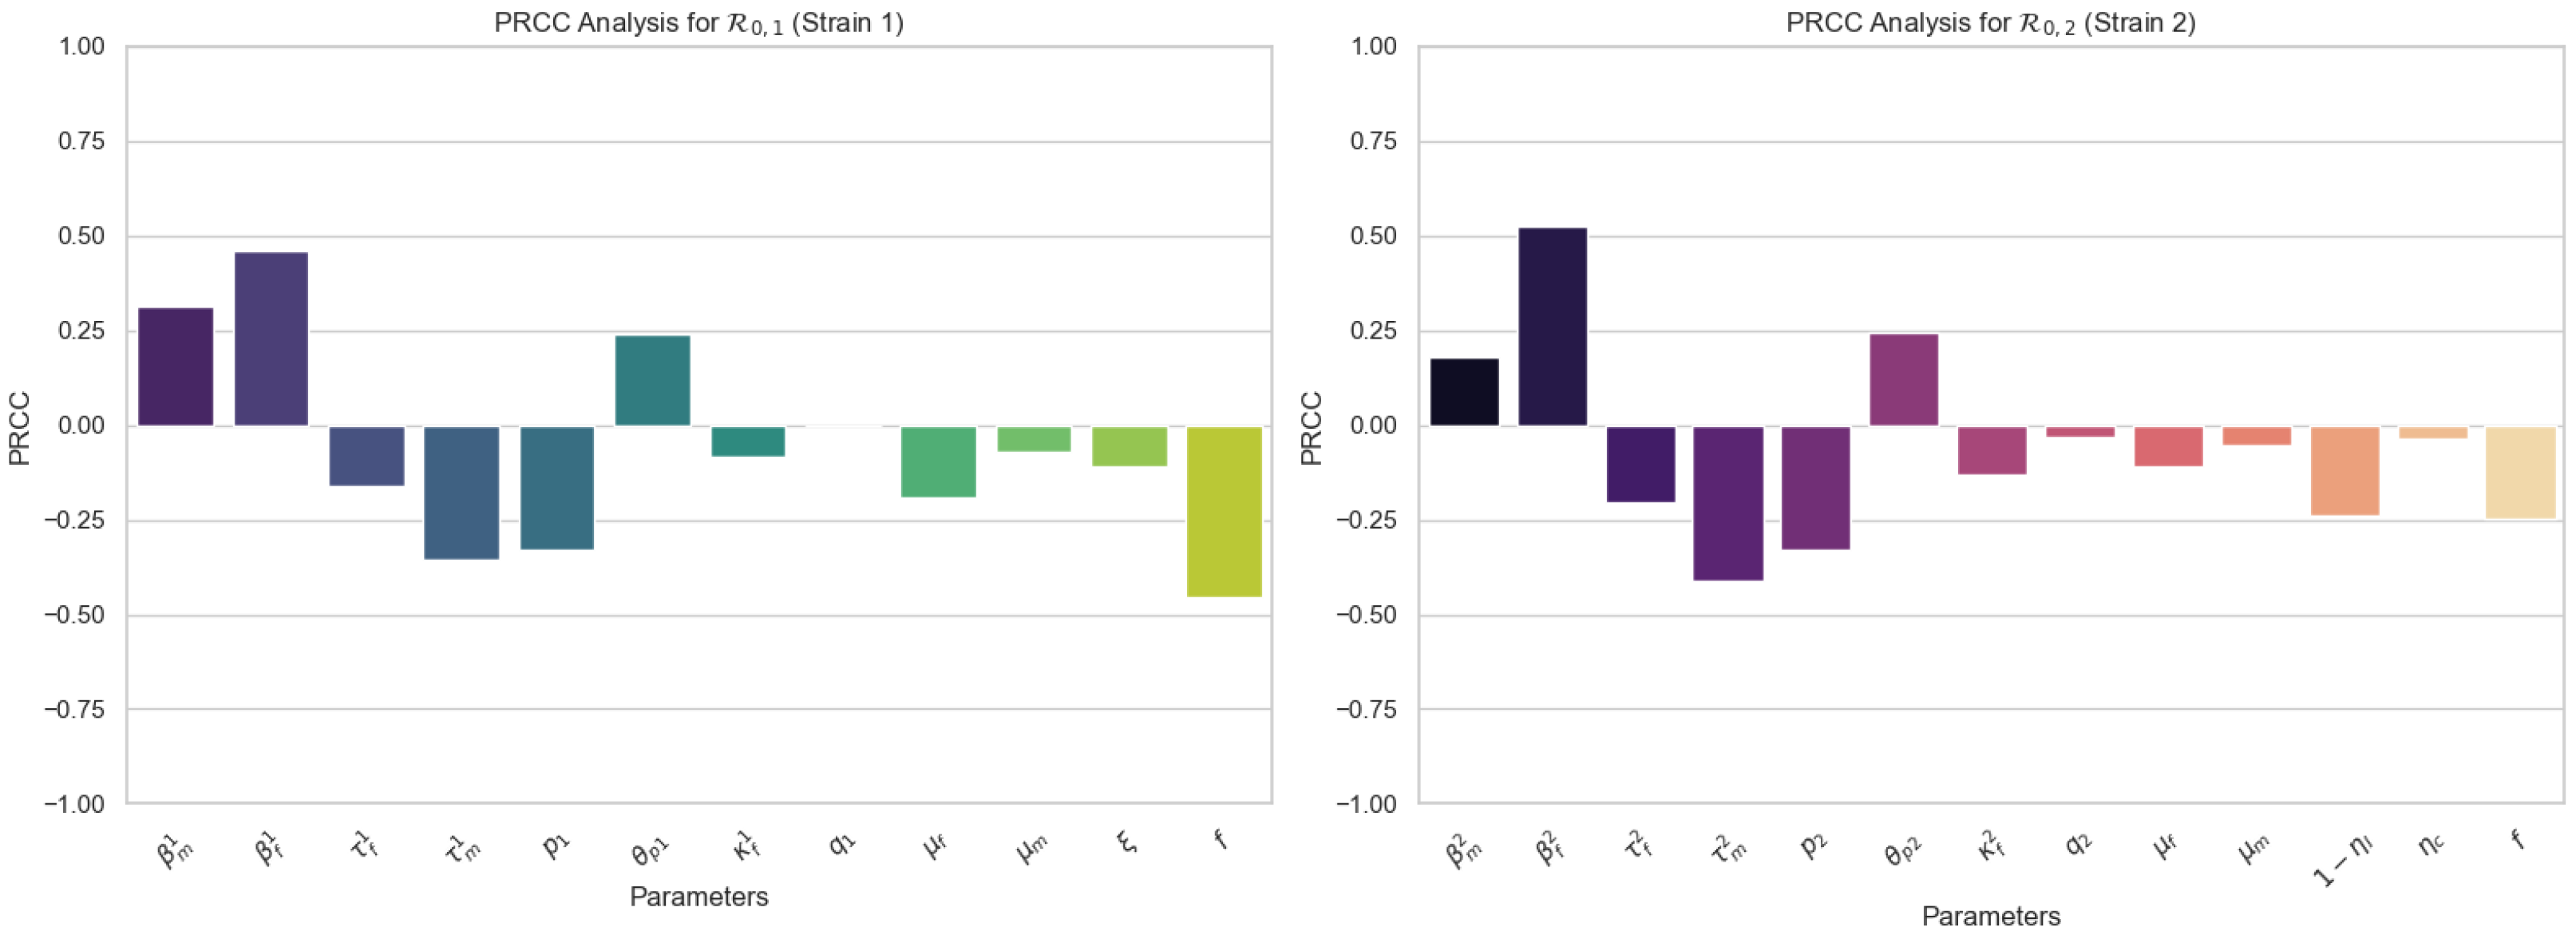
To better understand which biological mechanisms most strongly shape HPV transmission in our model, we performed a global sensitivity analysis of the strain-specific basic reproduction numbers, c and R 0 , 2 , using the parameter ranges listed in Table A3. A total of 100,000 independent parameter combinations were generated using Latin Hypercube Sampling, ensuring an efficient and uniform exploration of the multidimensional parameter space. For each sampled parameter set, R 0 , 1 and R 0 , 2 were computed from the analytical expressions derived above, and Partial Rank Correlation Coefficients (PRCCs) were obtained via Spearman rank correlations to quantify the strength and direction of association between each parameter and the resulting R 0 values. The results, summarized in Figure 3, show distinct transmission signatures for the two viral strains. For strain 1, vaccination coverage and efficacy exert the strongest influence, leading to a marked reduction in R 0 , 1 as these parameters increase. In contrast, strain 2 is much less sensitive to direct vaccine protection and is strongly modulated by indirect effects; the quantity 1 η I , which captures the effect of vaccine cross-protection against strain 2, emerges among the dominant drivers of reducing R 0 , 2 . These findings highlight that vaccine-mediated cross-immunity significantly influences the transmission of the second strain, thereby substantially limiting the number of infections by it.

Impact of Vaccine Coverage, Efficacy and Cross-Protection on Transmission Dynamics

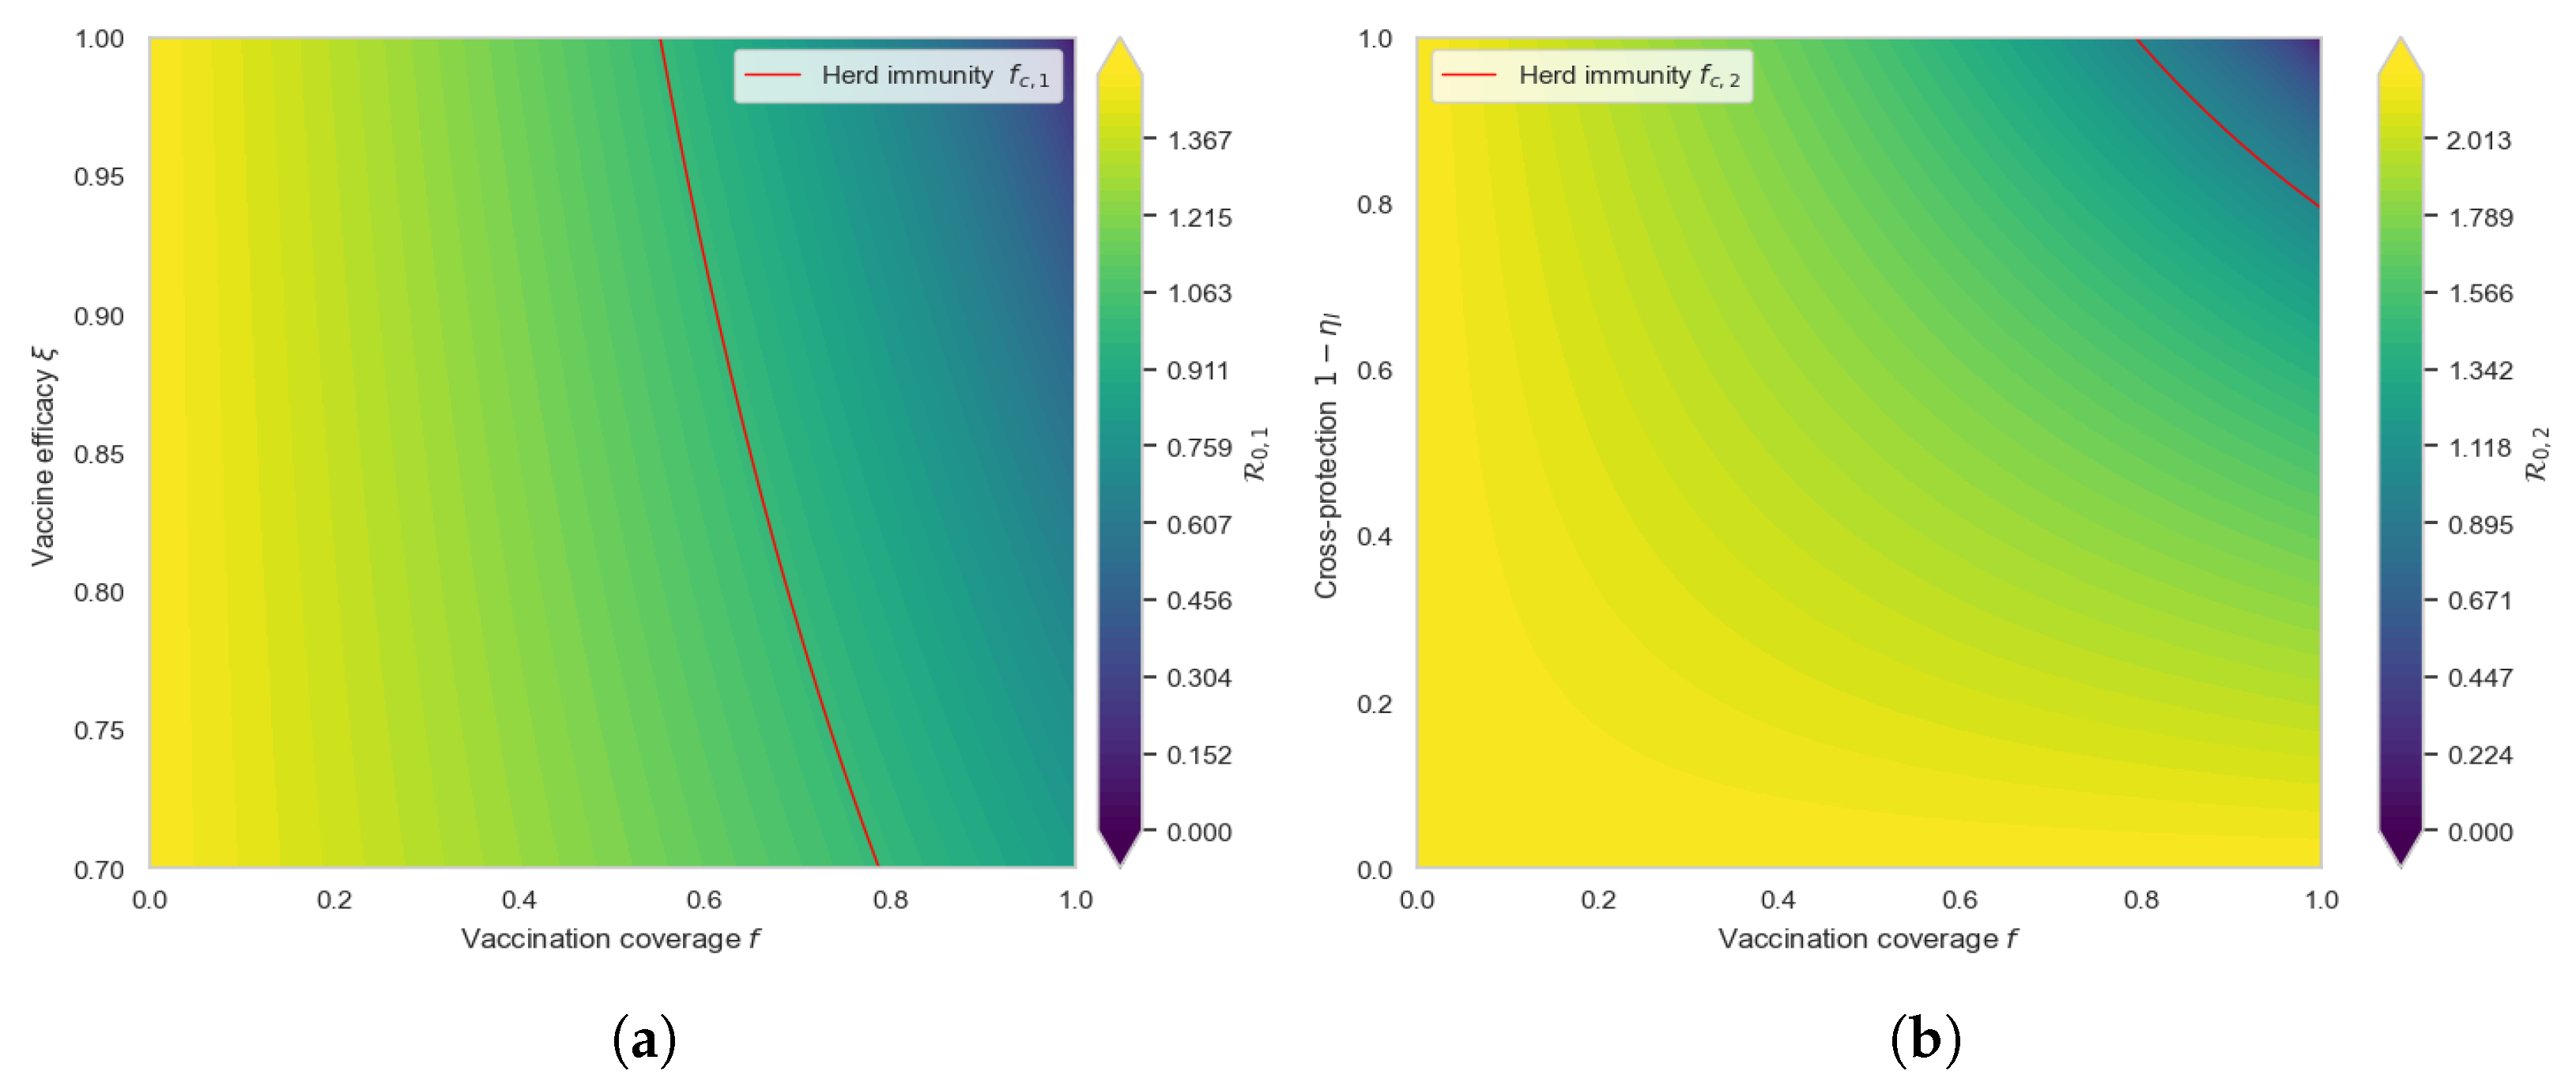
The contour plots in Figure 4 reveal the difference in the transmission behaviour of the two strains. For strain 1, the threshold curve f c , 1 shows that control is largely controlled by direct vaccine action. Increasing either coverage or efficacy has a strong suppressive effect on R 0 , 1 . In particular, when ξ = 0.7 , a coverage of f 0.8 already ensures R 0 , 1 < 1 , thereby preventing sustained outbreaks. In the ideal case ξ = 1 , the required coverage drops to f 0.6 , illustrating that improvements in efficacy translate directly into lower herd-immunity thresholds. These results indicate that the transmission of strain 1 is highly responsive to vaccination, with broad regions of the ( f , ξ ) space lying below the epidemic threshold. In contrast, strain 2 is not directly targeted by vaccination, and R 0 , 2 is therefore much less sensitive to changes in coverage alone. Reduction in transmission arises only through vaccine-mediated cross-protection 1 η I . As a consequence, large regions of the ( f , 1 η I ) domain still satisfy R 0 , 2 > 1 , even at high vaccination coverage. Elimination becomes achievable only under combined conditions of high coverage and strong cross-immunity. For example, when f = 1 and 1 η I = 0.8 , or conversely, when cross-protection is high, but coverage is maximal, the threshold R 0 , 2 = 1 is crossed, and persistence is no longer possible. Overall, these findings demonstrate that strain 1 can be controlled through classical vaccination strategies alone, whereas the suppression of strain 2 additionally requires non-trivial cross-protective immunity. This mechanistic distinction highlights the epidemiological importance of indirect vaccine effects in multi-strain infectious diseases.

5. Optimal Control Problem

5.1. Problem Formulation

In this section, we extend the mathematical model (1)–(14) to propose a corresponding optimal control problem to characterize the optimal vaccination strategy under different scenarios.
For that, we chose to minimize the number of females with persistent HPV of both strains P f 1 and P f 2 over the whole period [ 0 , T ] . This is derived from the importance of these compartments as the precancerous stages, which makes them key factors in the final outcome of reducing cancer. In fact, from a medical perspective, while initial HPV infections are extremely common and most sexually active women acquire HPV at least once in a lifetime, only a small fraction progresses to a precancerous state. Therefore, minimizing all infections would not reflect the clinical priority. Cancer minimization was included as a final cost C ( T ) , accounted for at the final time T rather than under an integral over the time interval [ 0 , T ] , as an individual can experience cancer only once. Including it under an integral would inaccurately count repeated “events” for the same person, which is biologically implausible. This approach aligns the objective function with the clinical and biological realities of HPV progression. However, as mentioned above, achieving these results is constrained to limited vaccination resources, which requires continuous minimizing of the vaccination effort over the entire time interval [ 0 , T ] . To account for this constraint, vaccination f is included in the running cost of the objective function, balancing the reduction of precancerous and cancerous states with the practical limitations of vaccine deployment. Thus, for all t in [ 0 , T ] , the running cost L is defined as follows:
L ( t ) = A 1 P f 1 ( t ) + P f 2 ( t ) + A 2 f ( t ) .
where A 1 and A 2 are weight parameters that characterize the impact of the control and state variables on the objective function.
The optimal control problem is, then, given by
min 0 f f m a x 0 T L ( t ) d t + C ( T ) .
subject to the system (1)–(14). The set of admissible controls U is given by
U = { f ( t ) L ( [ 0 , T ] , R ) , such that for all t [ 0 , T ] , 0 f ( t ) f m a x } .

5.2. Mathematical Analysis of the Optimal Control Problem

Proposition 4.
There exists an optimal control f * and a corresponding state variable vector
S f , V , I f 1 , I f 2 , R f 1 , R f 2 , P f 1 , P f 2 , C , S m , I m 1 , I m 2 , R m 1 , R m 2 .
that minimizes the objective function.
Proof. 
To prove the existence of the optimal control, we use the results by Fleming and Rishel (1975) [26]. One can easily verify the following:
(1)
The set of controls and corresponding state variables is nonempty. In fact, for f = 0 , the model has a solution according to the Cauchy–Lipschitz theorem.
(2)
The set U = [ 0 , f m a x ] is convex and closed.
(3)
The right-hand side of the state variables system (1)–(14) is bounded by a linear function in the state and control variables. In fact,
| | X ˙ | | α ( 1 + | | X | | + | f | )
where α is a positive constant, X is the state variable vector, and f is the vaccination rate.
(4)
The integrand L of the objective functional is convex on U since it is a linear function in f and there exist constants ω 1 > 0 , ω 2 > 0 and ρ > 1 such that
J ω 2 + ω 1 | f | ρ .
where ρ = 2 , ω 1 = ω 2 = ε 2 where ε = min 0 t T L ( t ) .
The previous proposition satisfies the mathematical criterion that the control should not be characterized before its existence is guaranteed. After establishing the existence of optimal control, we characterized it using the Pontryagin minimum principle [27], which converts the optimality problem into a problem of the maximization of the Hamiltonian H with regard to the controls f.
Therefore, we define the Hamiltonian given by
H ( t , f ( t ) , X ( t ) , ψ ( t ) ) = < ψ ( t ) , X ˙ ( t ) > + L ( t ) .
Proposition 5.
Given optimal control f * and the corresponding solution X ( t ) of the corresponding state system (1)–(14)–(18), there exists a vector of adjoint variables ψ = ( ψ 1 , , ψ 14 ) that satisfy
d ψ 1 d t = ( λ m 1 + λ m 2 + μ f ) ψ 1 λ m 1 ψ 3 λ m 2 ψ 4 λ f 1 + λ f 2 N f S m ψ 10 + λ f 1 N f ( S m + ε 3 R m 1 + R m 2 ) ψ 11 + λ f 2 N f ( S m + R m 1 + ε 4 R m 2 ) ψ 12 ε 3 λ f 1 + λ f 2 N f R m 1 ψ 13 λ f 1 + ε 4 λ f 2 N f R m 2 ψ 14 ,
d ψ 2 d t = ( 1 ξ ) λ m 1 + η I λ m 2 + μ f ψ 2 ( 1 ξ ) λ m 1 ψ 3 η I λ m 2 ψ 4 λ f 1 + λ f 2 N f S m ψ 10 + λ f 1 N f ( S m + ε 3 R m 1 + R m 2 ) ψ 11 + λ f 2 N f ( S m + R m 1 + ε 4 R m 2 ) ψ 12 ε 3 λ f 1 + λ f 2 N f R m 1 ψ 13 λ f 1 + ε 4 λ f 2 N f R m 2 ψ 14 , d ψ 3 d t = ( τ f 1 + μ f ) ψ 3 p 1 τ f 1 ψ 5 ( 1 p 1 ) τ f 1 ψ 7 + β f 1 λ f 1 λ f 2 N f S m ψ 10 β f 1 λ f 1 N f ( S m + ε 3 R m 1 + R m 2 ) ψ 11 + λ f 2 N f ( S m + R m 1 + ε 4 R m 2 ) ψ 12 + ( ε 3 ( β f 1 λ f 1 ) λ f 2 N f R m 1 ψ 13 + ( β f 1 λ f 1 ) ε 4 λ f 2 N f R m 2 ) ψ 14 , d ψ 4 d t = ( τ f 2 + μ f ) ψ 4 p 2 τ f 2 ψ 6 ( 1 p 2 ) τ f 2 ψ 8 + λ f 1 + β f 2 λ f 2 N f S m ψ 10 + λ f 1 N f ( S m + ε 3 R m 1 + R m 2 ) ψ 11 β f 2 λ f 2 N f ( S m + R m 1 + ε 4 R m 2 ) ψ 12 + ε 3 λ f 1 + β f 2 λ f 2 N f R m 1 ψ 13 + λ f 1 + ε 4 ( β f 2 λ f 2 ) N f R m 2 ψ 14 , d ψ 5 d t = ε 1 λ m 1 ψ 3 λ m 2 ψ 4 + ( μ f + ε 1 λ m 1 + λ m 2 ) ψ 5 λ f 1 + λ f 2 N f S m ψ 10 + λ f 1 N f ( S m + ε 3 R m 1 + R m 2 ) ψ 11 + λ f 2 N f ( S m + R m 1 + ε 4 R m 2 ) ψ 12 ε 3 λ f 1 + λ f 2 N f R m 1 ψ 13 λ f 1 + ε 4 λ f 2 N f R m 2 ψ 14 , d ψ 6 d t = λ m 1 ψ 3 ε 2 λ m 2 ψ 4 + ( μ f + λ m 1 + ε 2 λ m 2 ) ψ 6 λ f 1 + λ f 2 N f S m ψ 10 + λ f 1 N f ( S m + ε 3 R m 1 + R m 2 ) ψ 11 + λ f 2 N f ( S m + R m 1 + ε 4 R m 2 ) ψ 12 ε 3 λ f 1 + λ f 2 N f R m 1 ψ 13 λ f 1 + ε 4 λ f 2 N f R m 2 ψ 14 , d ψ 7 d t = q 1 κ f 1 ψ 5 + ( κ f 1 + μ f ) ψ 7 ( 1 q 1 ) κ f 1 ψ 9 + ( β f 1 θ p 1 λ f 1 ) λ f 2 N f S m ψ 10 β f 1 θ p 1 λ f 1 N f ( S m + ε 3 R m 1 + R m 2 ) ψ 11 + λ f 2 N f ( S m + R m 1 + ε 4 R m 2 ) ψ 12 + ε 3 ( β f 1 θ p 1 λ f 1 ) λ f 2 N f R m 1 ψ 13 + ( β f 1 θ p 1 λ f 1 ) ε 4 λ f 2 N f R m 2 ψ 14 A 1 , d ψ 8 d t = q 2 η c κ f 1 ψ 6 + ( η c κ f 2 + μ f ) ψ 8 η c ( 1 q 2 ) κ f 2 ψ 9 + ( β f 2 θ p 2 λ f 2 ) λ f 1 N f S m ψ 10 + λ f 1 N f ( S m + ε 3 R m 1 + R m 2 ) ψ 11 + β f 2 θ p 2 λ f 2 N f ( S m + R m 1 + ε 4 R m 2 ) ψ 12 + ε 3 ( λ f 1 ) + β f 2 θ p 2 λ f 2 N f R m 1 ψ 13 + λ f 1 ε 4 ( β f 2 θ p 2 λ f 2 ) N f R m 2 ψ 14 A 1 , d ψ 9 d t = ( μ f + δ ) ψ 9 λ f 1 + λ f 2 N f S m ψ 10 + λ f 1 N f ( S m + ε 3 R m 1 + R m 2 ) ψ 11 + λ f 2 N f ( S m + R m 1 + ε 4 R m 2 ) ψ 12 ε 3 λ f 1 + λ f 2 N f R m 1 ψ 13 λ f 1 + ε 4 λ f 2 N f R m 2 ψ 14 ,
d ψ 10 d t = λ m 1 + λ m 2 N m S f ψ 1 ( 1 ξ ) λ m 1 + η I λ m 2 N m V ψ 2 + λ m 1 N m ( 1 ξ ) V + S f + ε 1 R f 1 + R f 2 ψ 3 + λ m 2 N m η I V + S f + R f 1 + ε 2 R f 2 ψ 4 ε 1 λ m 1 + λ m 2 N m R f 1 ψ 5 λ m 1 + ε 2 λ m 2 N m R f 2 ψ 6 + ( λ m 1 + λ m 2 + μ m ) ψ 10 λ f 1 ψ 11 λ f 2 ψ 12 , d ψ 11 d t = ( β m 1 λ m 1 ) λ m 2 N m S f ψ 1 + ( 1 ξ ) ( β m 1 λ m 1 ) η I λ m 2 N m V ψ 2 ( β m 1 λ m 1 ) N m ( 1 ξ ) V + S f + ε 1 R f 1 + R f 2 ψ 3 + λ m 2 N m η I V + S f + R f 1 + ε 2 R f 2 ψ 4 + ε 1 ( β m 1 λ m 1 ) λ m 2 N m R f 1 ψ 5 + ( β m 1 λ m 1 ) ε 2 λ m 2 N m R f 2 ψ 6 + ( τ m 1 + μ m ) ψ 11 τ m 1 ψ 13 , d ψ 12 d t = ( β m 2 λ m 2 ) λ m 1 N m S f ψ 1 + ( 1 ξ ) λ m 1 η I ( β m 2 λ m 2 ) N m V ψ 2 + λ m 1 N m ( 1 ξ ) V + S f + ε 1 R f 1 + R f 2 ψ 3 β m 2 λ m 2 N m η I V + S f + R f 1 + ε 2 R f 2 ψ 4 + ε 1 λ m 1 + ( β m 2 λ m 2 ) N m R f 1 ψ 5 + λ m 1 + ε 2 ( β m 2 λ m 2 ) N m R f 2 ψ 6 + ( τ m 2 + μ m ) ψ 12 τ m 2 ψ 14 , d ψ 13 d t = λ m 1 + λ m 2 N m S f ψ 1 ( 1 ξ ) λ m 1 + η I λ m 2 N m V ψ 2 + λ m 1 N m ( 1 ξ ) V + S f + ε 1 R f 1 + R f 2 ψ 3 + λ m 2 N m η I V + S f + R f 1 + ε 2 R f 2 ψ 4 ε 1 λ m 1 + λ m 2 N m R f 1 ψ 5 λ m 1 + ε 2 λ m 2 N m R f 2 ψ 6 ε 3 λ f 1 ψ 11 λ f 2 ψ 12 + ( μ m + ε 3 λ f 1 + λ f 2 ) ψ 13 , d ψ 14 d t = λ m 1 + λ m 2 N m S f ψ 1 ( 1 ξ ) λ m 1 + η I λ m 2 N m V ψ 2 + λ m 1 N m ( 1 ξ ) V + S f + ε 1 R f 1 + R f 2 ψ 3 + λ m 2 N m η I V + S f + R f 1 + ε 2 R f 2 ψ 4 ε 1 λ m 1 + λ m 2 N m R f 1 ψ 5 λ m 1 + ε 2 λ m 2 N m R f 2 ψ 6 λ f 1 ψ 11 ε 4 λ f 2 ψ 12 + ( μ m + λ f 1 + ε 4 λ f 2 ) ψ 13 .
with transversality conditions:
ψ ( T ) = ( 0 , 0 , 0 , 0 , 0 , 0 , 0 , 0 , 1 , 0 , 0 , 0 , 0 , 0 ) .
Furthermore, the optimal control is given by
f * = m i n m a x 0 , Λ f ( ψ 2 ψ 1 ) 2 A 2 ; f m a x .
Hint of the Proof.
The adjoint equations and transversality conditions are determined using Pontryagin’s maximum principle such that
X ˙ i ( t ) = d H d ψ i ( t , X ( t ) , ψ ( t ) , f ( t ) )
ψ i ˙ ( t ) = d H d X i ( t , X ( t ) , ψ ( t ) , f ( t ) ) .
The optimal control f * then satisfies the maximization condition such that
H ( t , X ( t ) , ψ ( t ) , f * ( t ) ) = max f U H ( t , X ( t ) , ψ ( t ) , f ( t ) ) .

5.3. Numerical Results of the Optimal Control Problem

In this section, we examine a set of vaccination scenarios to identify the most effective strategy for reducing infections caused by both vaccine-targeted and non-targeted high-risk HPV genotypes. These genotypes are of particular concern because they are responsible for the majority of HPV-related precancerous lesions and cervical cancer. Although the circulating high-risk types in Tunisia show a specific distribution [9], financial constraints have led to the adoption of the bivalent vaccine, administered exclusively to female teenagers. Thus, our central goal is to characterize a time-dependent vaccination policy that minimizes persistent HPV infections of both strains, cervical cancer incidence, with minimal vaccination effort, within the bounds of realistic vaccine availability. In this study, we examine three vaccination control scenarios that differ in the extent to which vaccination effort is constrained. Scenario 1 represents an ideal setting with no penalty on vaccine use ( A 2 = 0 ) and full allowable coverage ( f max = 1 ), resulting in continuous vaccination throughout the simulation. Scenario 2 introduces a moderate cost on vaccination ( A 2 = 10,000 ) while still permitting full coverage ( f max = 1 ), reflecting a situation in which vaccination remains accessible but health authorities must account for resource limitations. Scenario 3 imposes the strongest constraint, with a high vaccination cost ( A 2 = 100,000 ) and a coverage threshold of f max = 0.8 , representing a realistic scenario in which only 80 % of girls can be vaccinated. The 80 % threshold in Scenario 3 is derived from the computation of the critical vaccination coverage required to control strain 1 ( R 0 , 1 < 1 ). Vaccinating less than this level, even with maximal effort, would be insufficient to eradicate the disease, establishing a lower bound for f max of 0.8. It should be noted that the basic reproduction number of strain 2 remains above 1 under this vaccination strategy, which is why strain 2 was not considered when defining the scenario limits.
Together, these three scenarios allow us to assess how increasing constraints on vaccination effort influence infection dynamics and cancer outcomes. To summarize, the scenarios are defined as follows:
  • Scenario 1: f m a x = 1 and A 2 = 0 .
  • Scenario 2: f m a x = 1 and A 2 = 10,000 .
  • Scenario 3: f m a x = 0.8 and A 2 = 100,000 .
These values are selected to represent qualitative dynamics that remain robust within a neighborhood of the chosen values.
For the numerical simulations, the initial population is stratified by sex and restricted to individuals aged 10 years and above, yielding approximately 5.68 × 10 6 males and 5.71 × 10 6 females. Baseline HPV infection levels are initialized using genotype-specific prevalence estimates for Tunisia, with strain 1 (HPV 16/18) infecting about 1.23% of females and strain 2 (HPV 31/52/59) about 2.20%. Natural clearance is incorporated using a one-year recovery proportion of 52%, which determines the initial recovered and persistent infection classes. The susceptible populations are then obtained by subtracting all infected, recovered, persistent, and (for females) cancer cases from the total. Vaccinated compartments are set to zero at t = 0 , reflecting the introduction of the vaccination programme, and the bivalent vaccine’s partial cross-protection against non-targeted high-risk genotypes is obtained from [12]. All detailed numerical derivations and vaccine-related parameter values are provided (for details, see Appendix A and Appendix B).
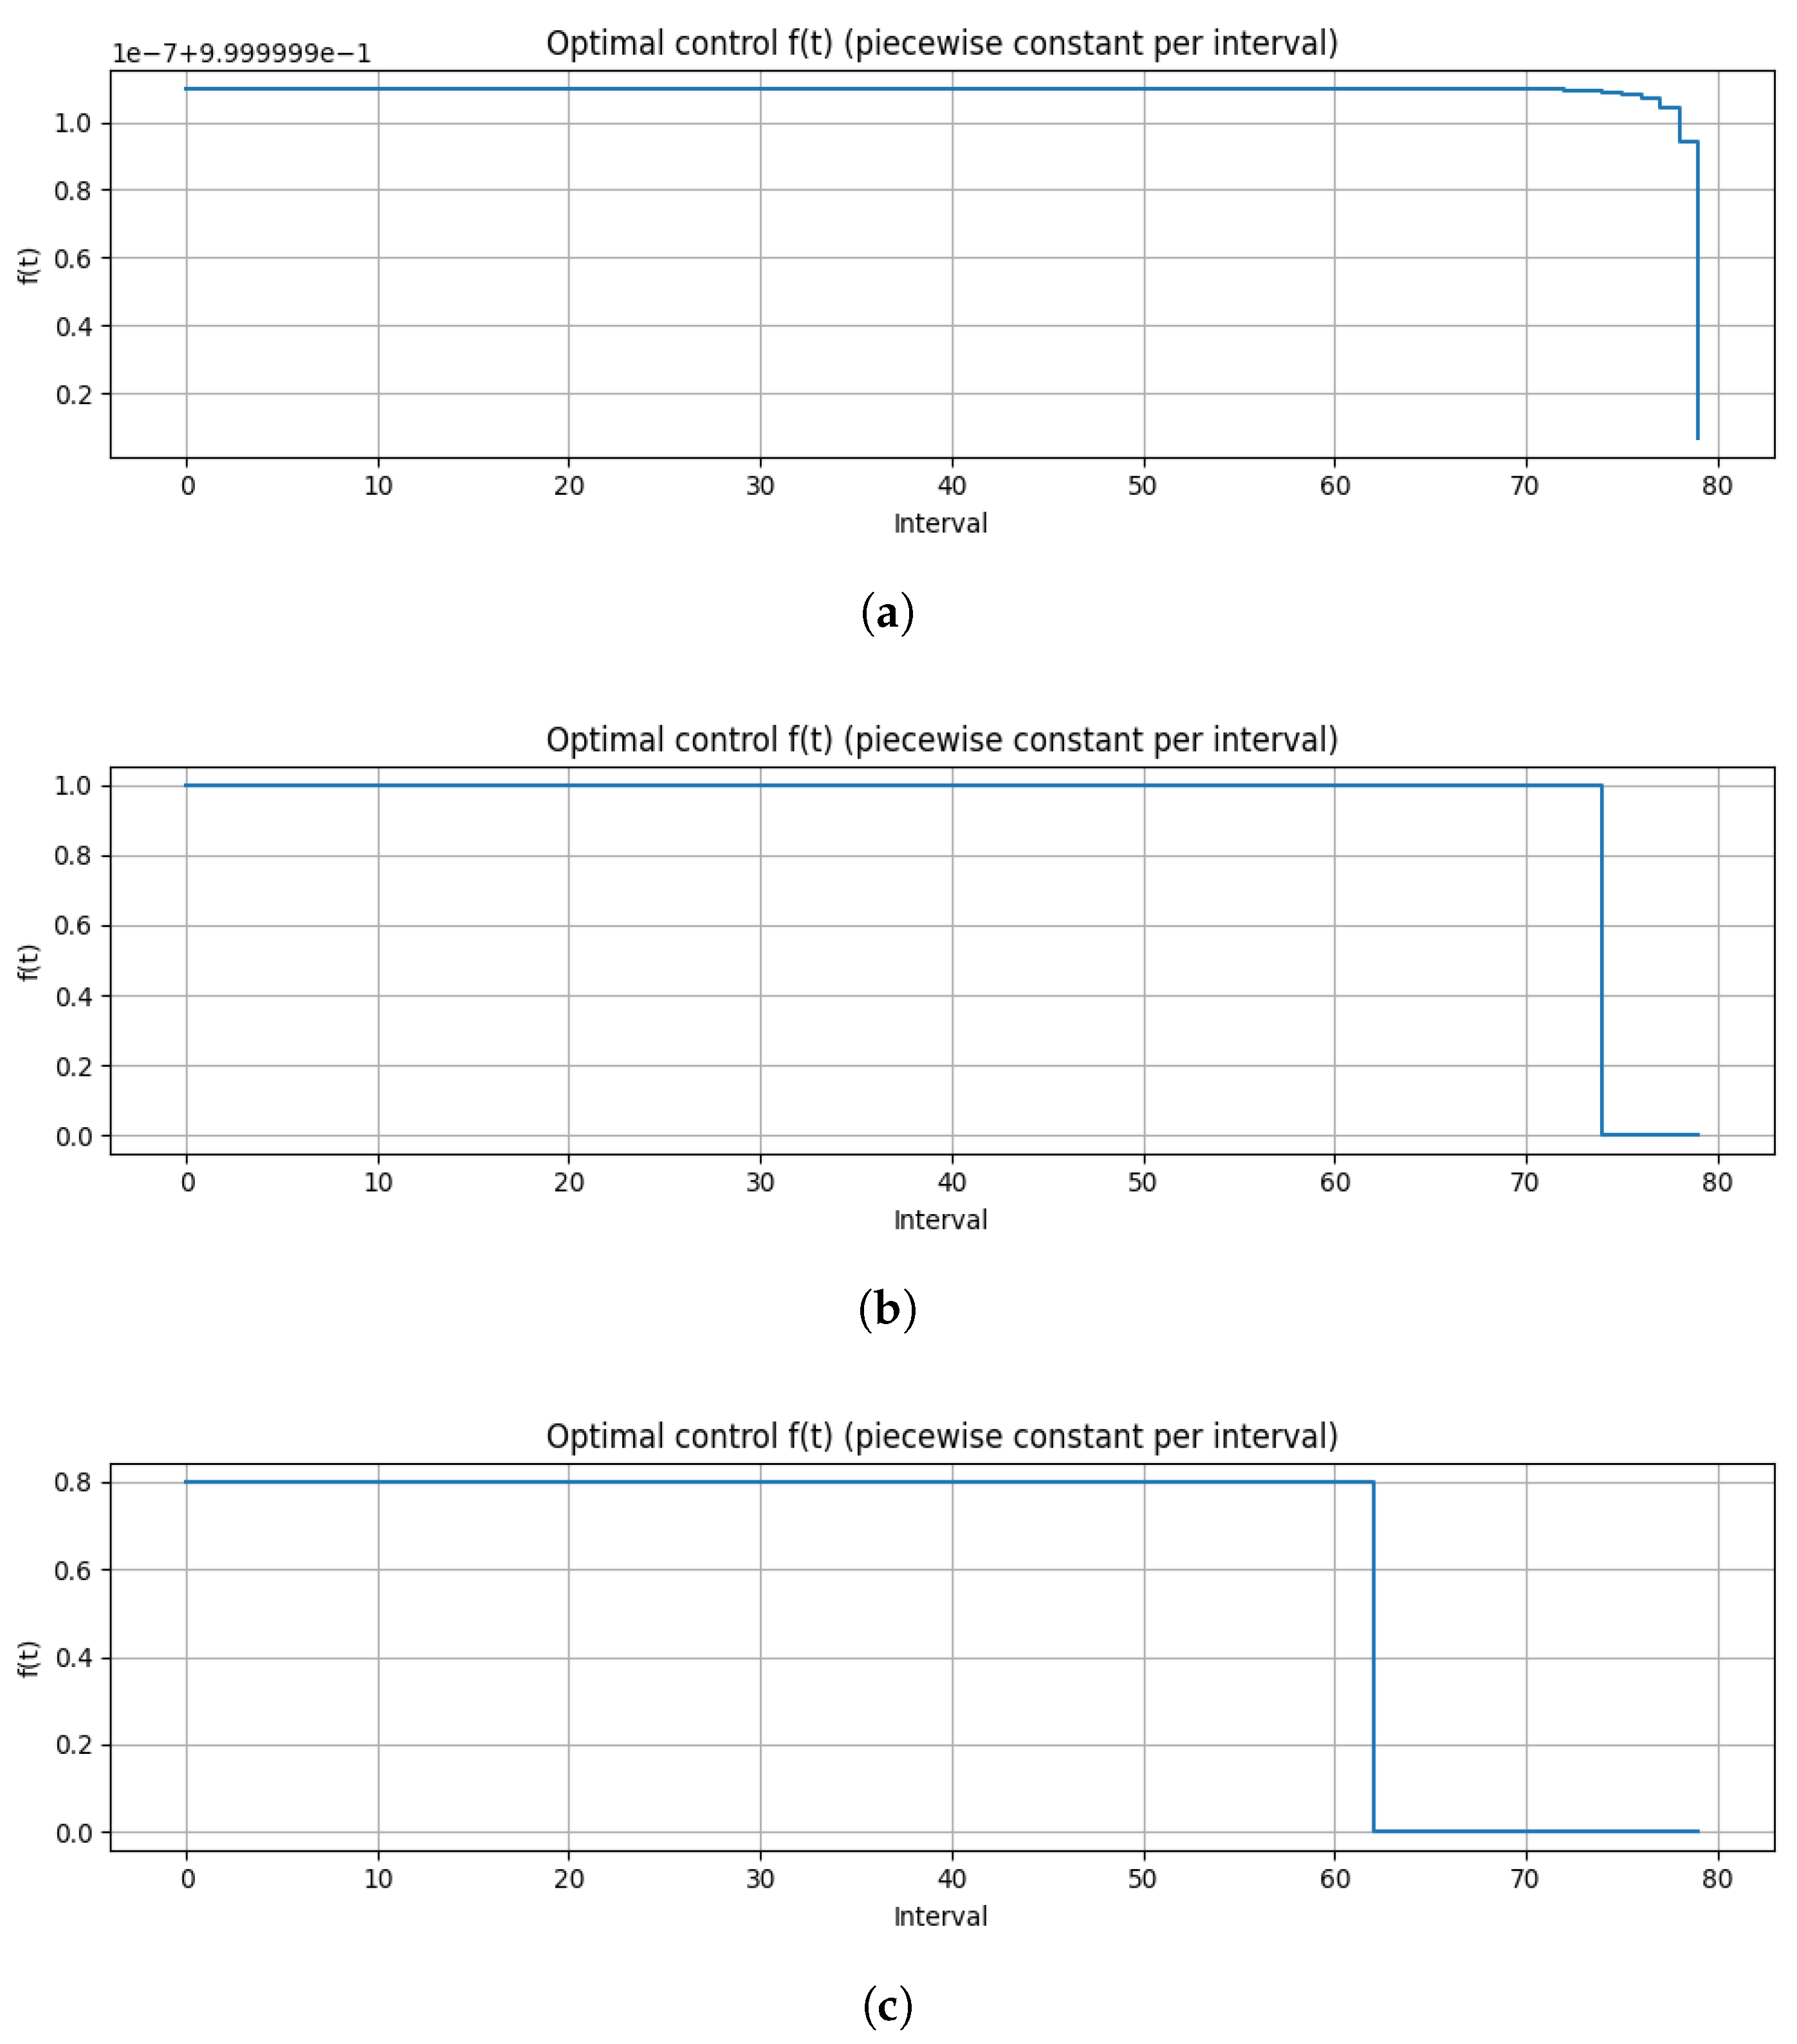
Figure 5 illustrates the optimal vaccination profiles under the three control scenarios. In all cases, the optimal controls exhibit a bang-bang structure. In Scenario 1 (Figure 5a), the control remains at its upper bound throughout the entire simulation horizon, indicating that continuous maximal vaccination is required to achieve the optimal epidemiological outcome. In Scenario 2 (Figure 5b), the control is discontinued approximately five years before the end of the simulation, reflecting that sustained maximal effort is unnecessary once sufficient population immunity is established. Finally, in Scenario 3 (Figure 5c), the vaccination effort can be stopped well before the final simulation time, about 18 years in advance, demonstrating that even under stringent cost and coverage constraints, a finite-duration vaccination campaign suffices to approximate the optimal reduction in infection and disease. These results highlight the interplay between vaccination effort, resource constraints, and the timing of intervention in determining the optimal control trajectory.
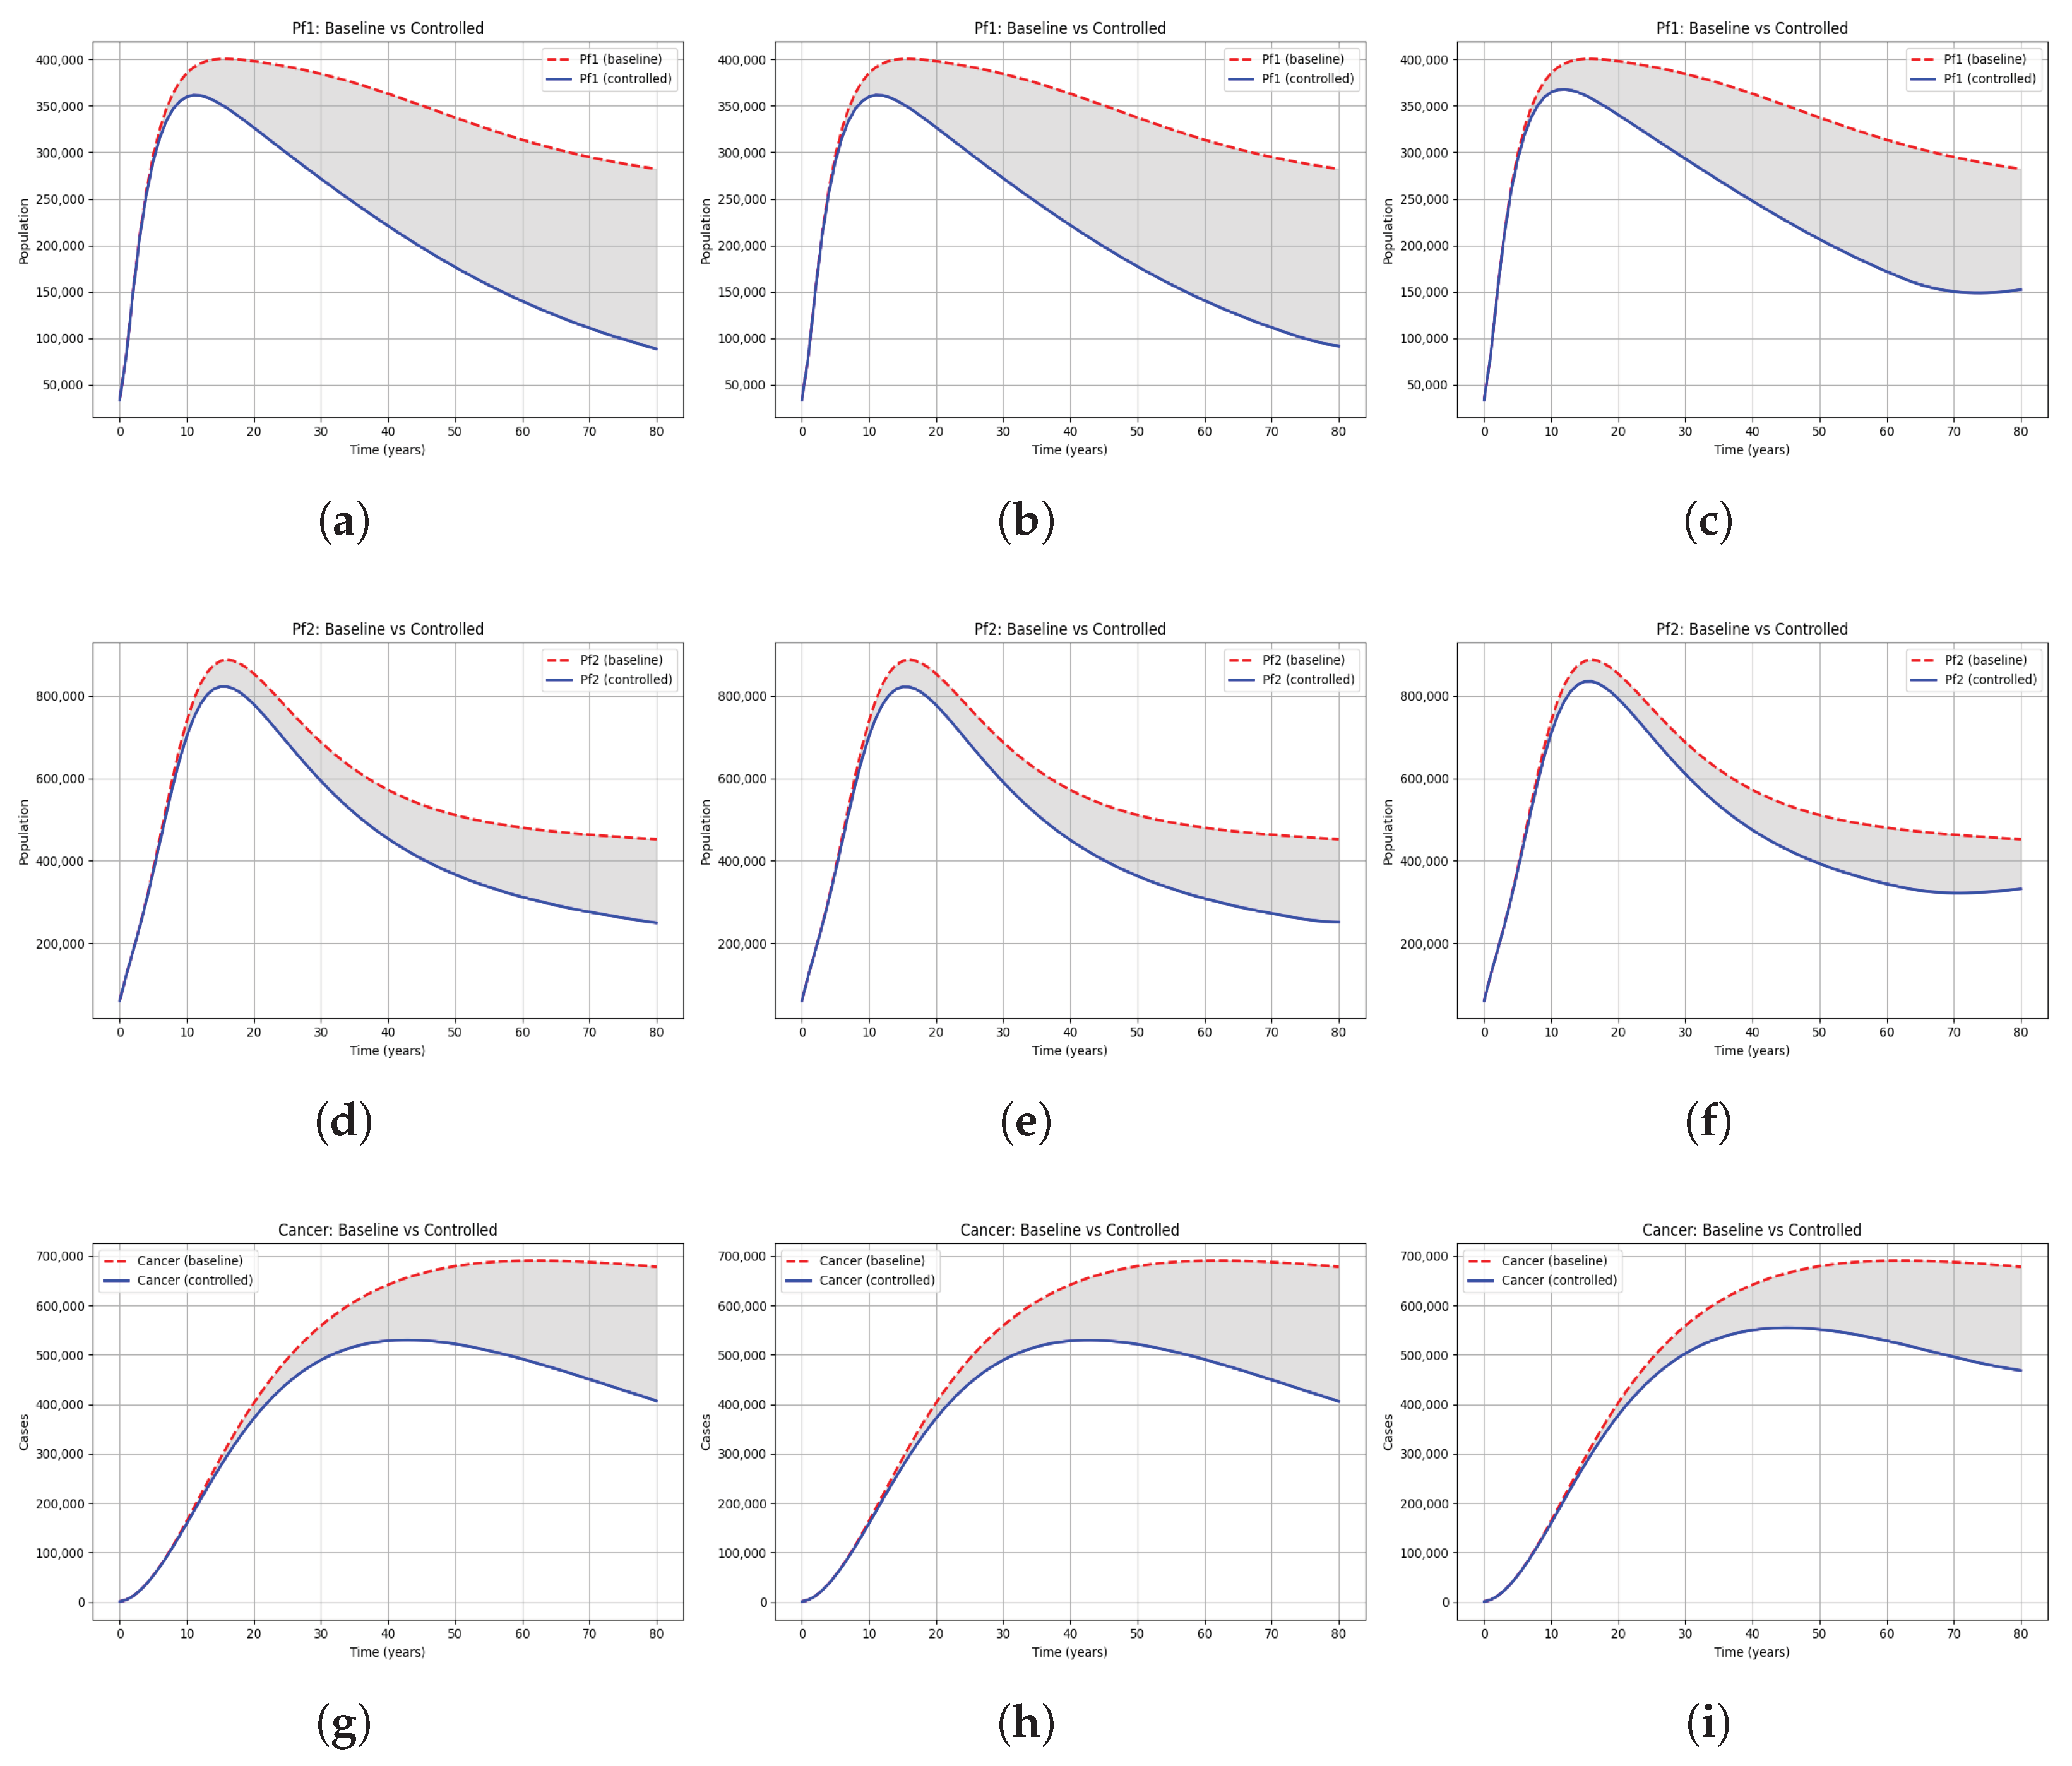
Figure 6 shows the impact of these three control scenarios on cancer incidence and persistent infection among females. Scenarios 1 and 2 yield very similar trajectories; both achieve a substantial reduction in cancer cases and in persistent infections for the two circulating high-risk strains, with a more pronounced decline observed for strain 1. This similarity reflects the fact that, despite the moderate cost introduced in Scenario 2, the effective vaccination pressure remains sufficiently strong to suppress long-term transmission. In contrast, Scenario 3 produces a noticeably smaller reduction in overall cases, consistent with its stricter cost and coverage constraints. Nevertheless, even under this limited vaccination effort, a noteworthy pattern emerges: while persistent infection levels stabilize toward the end of the simulation, cancer cases continue to decline, indicating that the intervention retains a delayed yet meaningful impact on disease progression.
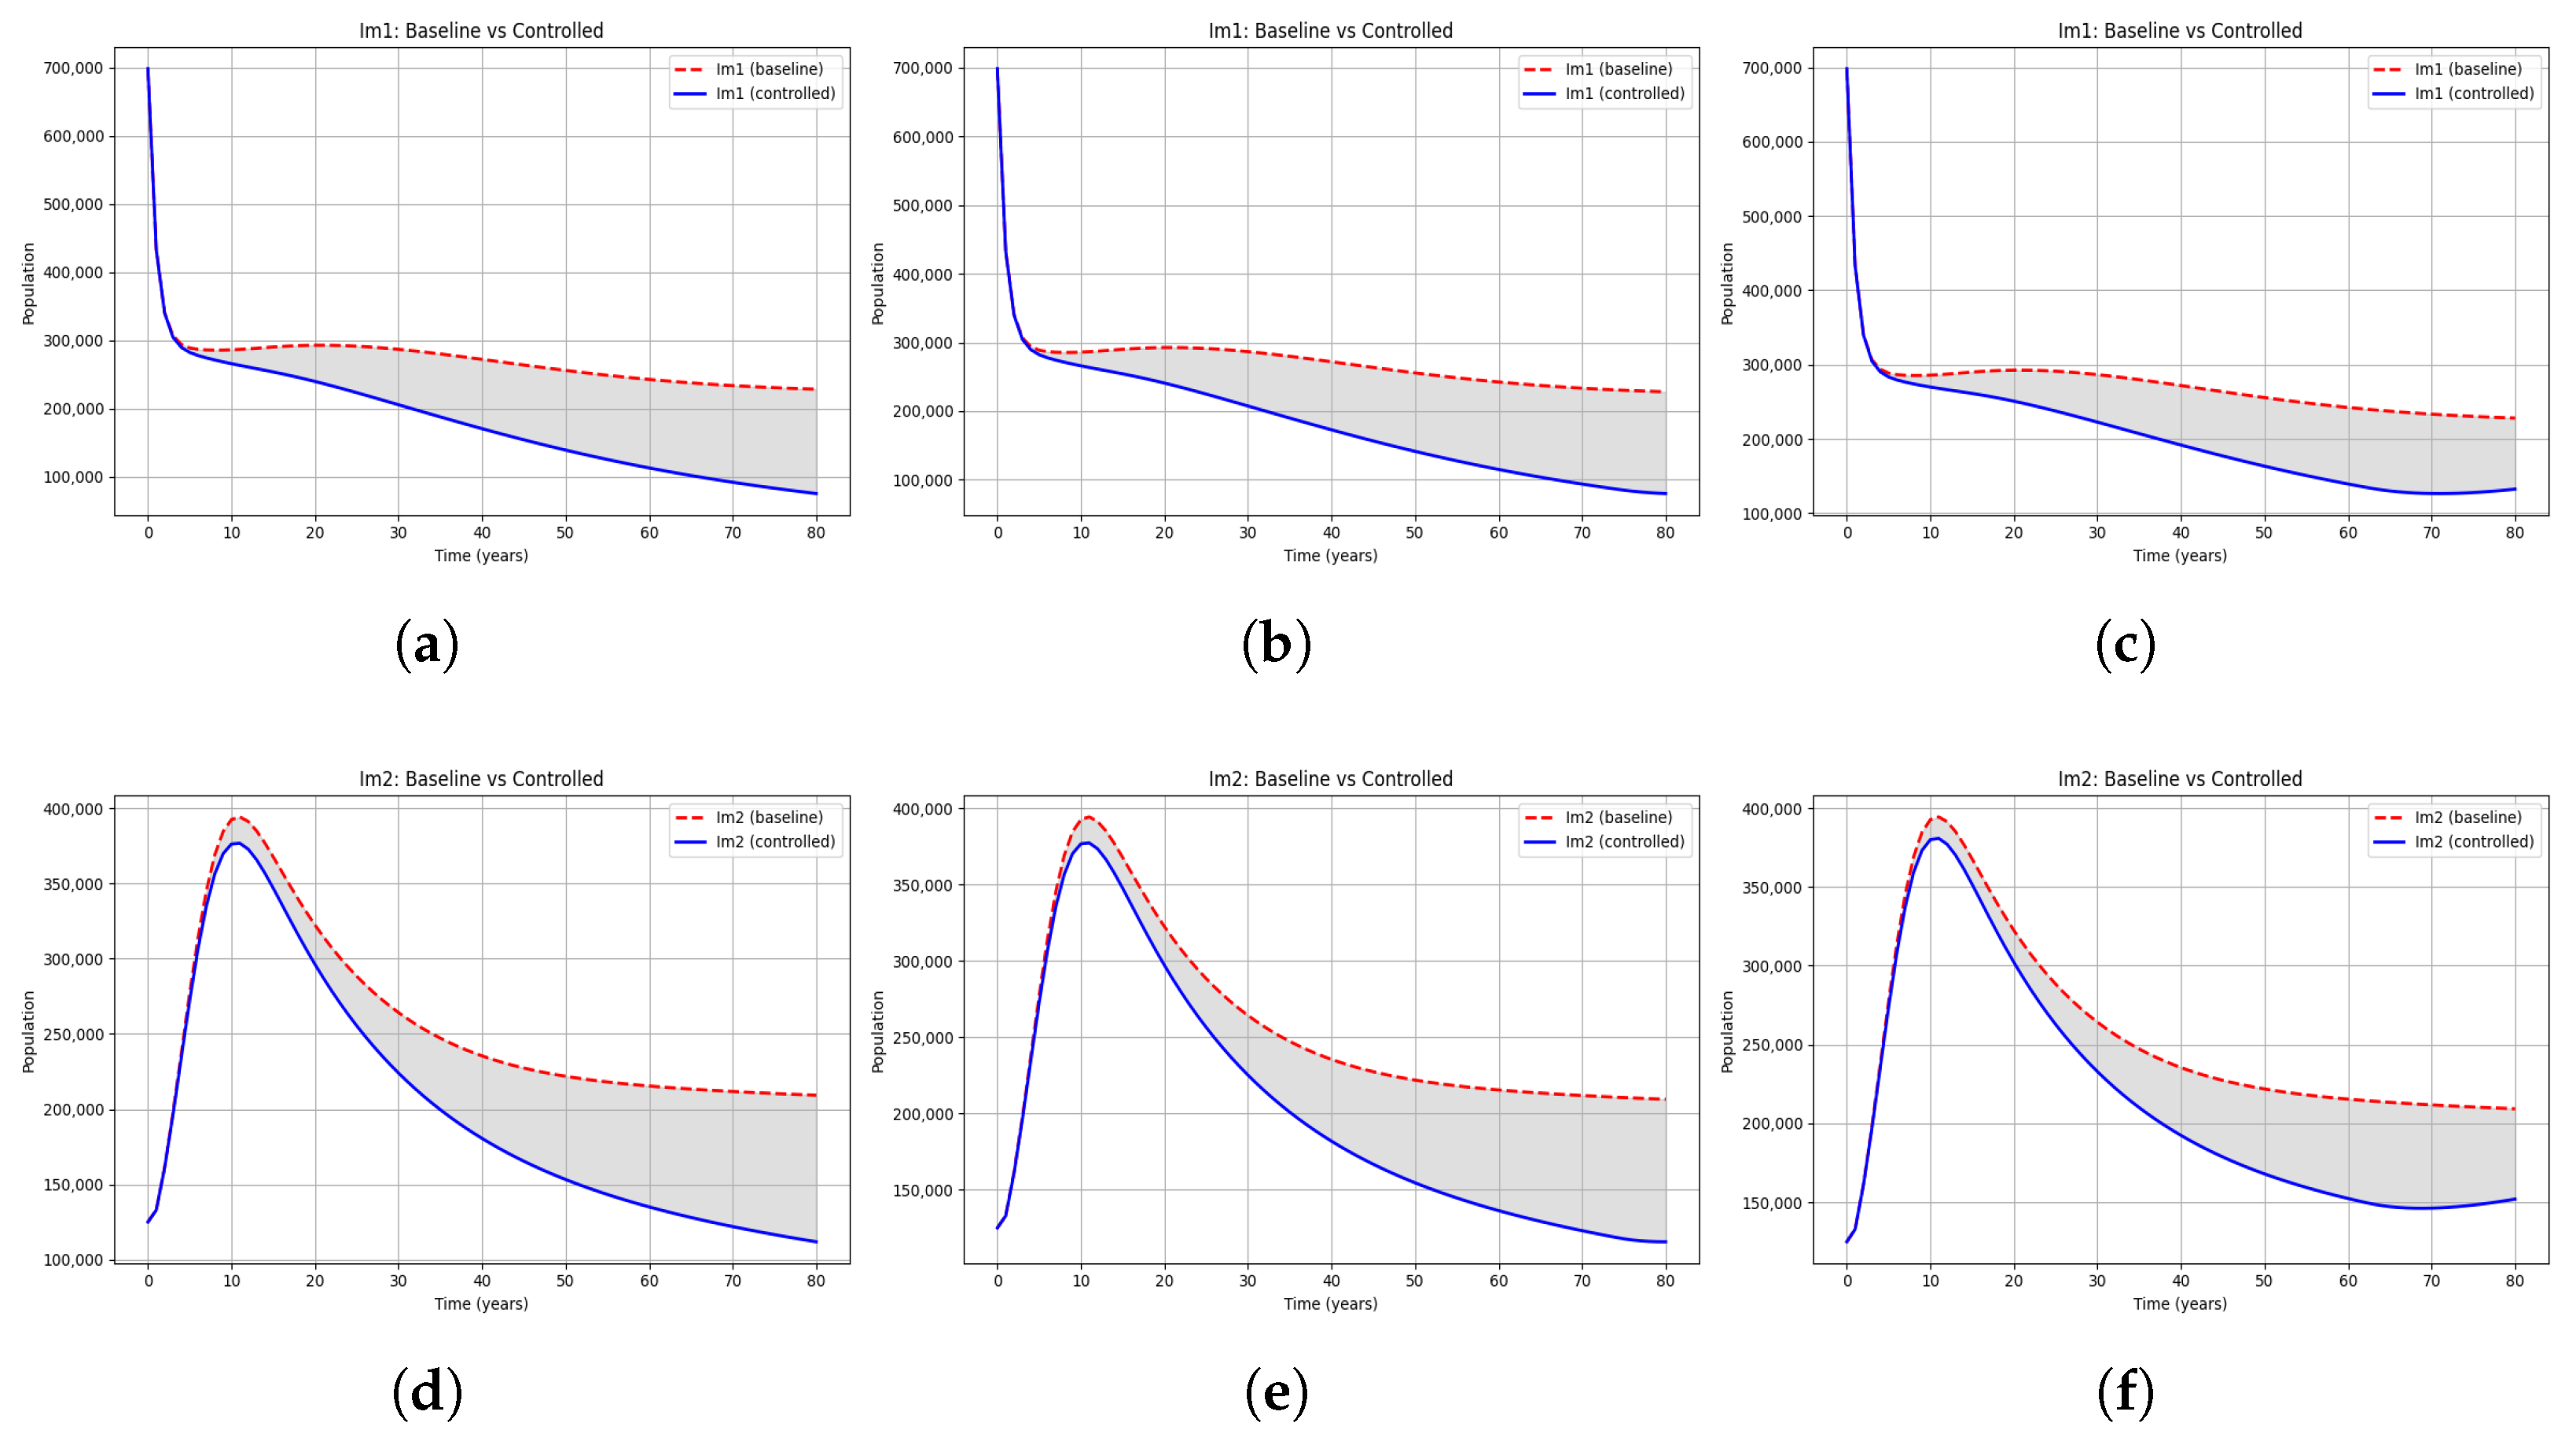
On the other side, Figure 7 displays how the distinct female-targeted vaccination strategies influence male infection dynamics through changes in female transmission. Unlike the female outcomes, where vaccination directly alters individual risk, the effect on males arises solely from a reduction in the force of infection generated by female partners. Scenarios 1 and 2 produce almost identical declines in male infections, indicating that once female transmission is sufficiently suppressed, additional increases in vaccination intensity yield minimal further benefit for males. Under Scenario 3, the decrease in infection is less pronounced, reflecting the weaker reduction in transmission pressure from females. Nonetheless, a clear indirect benefit persists: even with constrained vaccination, diminishing female infectiousness is enough to lower male acquisition risk, underscoring that male infection trends are driven predominantly by the level of transmission circulating in the female population.

6. Conclusions and Discussion

In this work, we aim to identify an optimal vaccination strategy that aligns with the high-risk HPV genotype distribution in Tunisia and the corresponding economic constraints. To that end, a gender-stratified compartmental model for HPV was formulated and studied mathematically for well-posedness. The parameters used for the model were estimated based on the available Tunisian data to fit the country context. In order to determine the key parameters of the model system, a sensitivity analysis was carried out, as well as calculating the basic reproduction number R 0 . We extended our proposed model to a corresponding optimal control problem where the vaccination rate is the control. An objective function was designed, and the analytical characterization of the optimal control was conducted using Pontryagin’s maximum principle. In order to test the effect of various scenarios of controls and provide a numerical comparison, we propose three different control scenarios: Scenario 1 represents the unconstrained case, Scenario 2 is a moderately constrained case, and Scenario 3 has the tightest constraints.
The results obtained from the three control scenarios provide important insights into the role of vaccination effort and cost constraints in shaping disease outcomes in Tunisia.
A key finding is the substantial reduction observed in the untargeted strain, which highlights the beneficial cross-protective effects of the bivalent vaccine. This provides strong validation for its use in the Tunisian context, where the non-targeted high-risk genotypes contribute meaningfully to the overall disease burden. However, we could not completely eradicate the disease, as most studies link this result to the addition of male vaccination [28,29,30]. Despite that, our results show a large indirect benefit for males under female-only vaccination, emphasizing the strong population-level protection generated by targeting girls alone. This finding aligns with many other studies that highlight the prioritization of female vaccination in settings where gender-neutral vaccination is not achievable. In fact, ref. [31] presents a comparative approach showing that the most favorable strategies included the vaccination of 14-year-old girls. In contrast, vaccinating boys (aged 9–14) or adult women (aged 18 and older) indicates similar efficiency and reduced cost-effectiveness.
The comparison of the three scenarios showed that scenarios 1 and 2 exhibit similar reductions in persistent infection and cancer, indicating that moderate cost constraints do not significantly compromise the effectiveness of the vaccination program. This suggests that the system is highly responsive to vaccination, even when a penalty on vaccine effort is introduced. In fact, among all simulations, Scenario 2 emerges as the best compromise, achieving strong reductions in persistent infection and cancer incidence while simultaneously limiting the vaccination effort. This balance between cost and health benefit is particularly relevant in settings where resources are limited and sustained large-scale vaccination may not be feasible.
It is noteworthy that while Scenario 2 performs best in balancing epidemiological impact and control cost, Scenario 3 is more realistic for Tunisia, where HPV vaccine uptake remains extremely low. Even though we used a maximal vaccination rate of 80 % , which is already far below the WHO recommendation of 95 % coverage, the HPV vaccination in Tunisia is characterized by pronounced hesitancy and widespread rejection of the vaccine, added to the hardship of accessing all teenage girls. Scenario 3, therefore, reflects the challenges faced by public health authorities and highlights the need for orienting research towards studying these issues [11].

Author Contributions

Conceptualization, Z.O., A.K. and A.B.; methodology, A.B. and Z.O.; software, A.B. and Z.O.; validation, A.K., A.M. and S.B.M.; formal analysis, A.B. and Z.O.; data curation, A.B. and Z.O.; writing—original draft preparation, A.B. and Z.O.; writing—review and editing, all authors; supervision, A.K., A.M. and S.B.M.; funding acquisition, A.K. and S.B.M. All authors have read and agreed to the published version of the manuscript.

Funding

This work was supported, in whole or in part, by the Gates Foundation [INV-059607]. The conclusions and opinions expressed in this work are those of the author(s) alone and shall not be attributed to the Foundation. Under the grant conditions of the Foundation, a Creative Commons Attribution 4.0 License has already been assigned to the Author Accepted Manuscript version that might arise from this submission. Please note that works submitted as a preprint have not undergone a peer review process.

Informed Consent Statement

Not applicable due to the absence of direct patient contact.

Data Availability Statement

No new data were created or analyzed in this study. Data sharing is not applicable to this article.

Conflicts of Interest

The authors declare no conflicts of interest.

Appendix A. Initial Conditions’ Estimation

In 2024, the Tunisian population was estimated to consist of 6,189,741 males and 6,194,759 females [32]. Discarding individuals aged below 10 years ( 8.3 % of males, 7.9 % of females [33]) yields:
N m ( 0 ) = 5,675,992 , N f ( 0 ) = 5,705,373 .
As we model the vaccination campaign from its start, it is assumed that
V ( 0 ) = 0 .
Assuming that strain 1 has a prevalence of 1.23 % and strain 2 has a prevalence of 2.2 % ,
I f 1 ( 0 ) = 0.0123 × N f ( 0 ) = 70,176 , I f 2 ( 0 ) = 0.022 × N f ( 0 ) = 125,518 .
As for the progression to recovery of persistence states, 52 % of the cases are cleared spontaneously within a year [34]. Assuming that both strains would have similar clearance, one has
R f 1 ( 0 ) = 0.52 × I f 2 ( 0 ) = 36,492 , P f 1 ( 0 ) = I f 1 ( 0 ) R f 1 ( 0 ) = 33,684 ,
R f 2 ( 0 ) = 0.52 × I f 2 ( 0 ) = 65,269 , P f 2 ( 0 ) = I f 2 ( 0 ) R f 2 ( 0 ) = 60,249 .
A yearly prevalence of approximately 300 individuals is registered. Thus, without any loss of generality, we assume that
C ( 0 ) = 300 .
Consequently,
S f ( 0 ) = N f ( 0 ) V ( 0 ) + I f 1 ( 0 ) + I f 2 ( 0 ) + R f 1 ( 0 ) + R f 2 ( 0 ) + P f 1 ( 0 ) + P f 2 ( 0 ) + C ( 0 ) = 5,313,685 .
For males, due to the absence of Tunisian data, we rely on global studies.
Assuming the same distribution and clearance of strains as among females, one has
I m 1 ( 0 ) = 0.0123 × N m ( 0 ) = 69,815 , I m 2 ( 0 ) = 0.0220 × N m ( 0 ) = 124,872 .
R m 1 ( 0 ) = 0.52 × I m 1 ( 0 ) = 36,304 , R m 2 ( 0 ) = 0.52 × I m 2 ( 0 ) = 64,933 .
Thus, one has
S m ( 0 ) = N m ( 0 ) ( I m 1 ( 0 ) + I m 2 ( 0 ) + R m 1 ( 0 ) + R m 2 ( 0 ) ) = 5,380,068 .
Table A1. Initial values of model compartments based on data from Tunisia.
VariableDescriptionInitial Value
N f Total number of females aged 10 years and older5,705,373
N m Total number of males aged 10 years and older5,675,992
S f Susceptible females5,313,685
VVaccinated females0
I f 1 Females infected with strain 1 (HPV 16/18)70,176
I f 2 Females infected with strain 2 (HPV 31/52/59)125,518
P f 1 Females with persistent infection of strain 133,684
P f 2 Females with persistent infection of strain 260,249
R f 1 Females who naturally recovered from strain 136,492
R f 2 Females who naturally recovered from strain 265,269
CFemales with cervical cancer300
S m Susceptible males5,286,618
I m 1 Males infected with strain 1 (HPV 16/18)69,815
I m 2 Males infected with strain 2 (HPV 31/52/59)124,872
R m 1 Males who naturally recovered from strain 136,304
R m 2 Males who naturally recovered from strain 264,933

Appendix B. Parameters’ Estimation

The model parameters are divided into two categories: disease-related parameters and country-specific ones. For the disease-related parameters, we either rely on the literature to identify their values, since they do not vary with the societal demographic and cultural variations [19], or we assume them according to the context. As for the country-related parameters, the first step for estimating them consists of analytical computations based on the available data about the Tunisian population.

Appendix B.1. Mortality Rates μf, μm and δ

The natural mortality rate is defined as the inverse of life expectancy [35]. Life expectancy in Tunisia for females is 78.6 years, and for males, it is 75.14 years. Thus,
μ f = 1 78.5 = 0.0127 year 1 and μ m = 1 75.14 = 0.0133 year 1

Appendix B.2. Recruitment Rates Λf and Λm

Recruitment into the susceptible classes occurs via births. Using the latest available national birth statistics, we calculate gender-specific birth rates as follows:
Λ f = number of female births and Λ m = number of male births .
Hence, according to the National Institute of Statistics of Tunisia [36], the recruitment rates are:
Λ f = 71807 and Λ m = 76171 .

Appendix B.3. Recovery Rates τf1, τm1 and τf2, τm2

The recovery rates are defined as the inverse of the average infection duration [37]. This period is estimated to be 1.5 years for strain 1 (HPV 18/16) and 10 months for strain 2 (HPV 31/52/59). It is assumed that the recovery rates are sex-independent; thus,
τ f 1 = τ m 1 = 1 1.5 = 0.667 year 1 and τ f 2 = τ m 2 = 1 ( 5 / 6 ) = 1.2 year 1 .

Appendix B.4. Recovery Proportions: p1, p2, q1 and q2

In Tunisia, a significant proportion of individuals infected with HPV 16 and 18, like in many other populations, will naturally clear the infection. Specifically, around 90 % of HPV infections are cleared by the body’s immune system within a couple of years. However, no published studies in Tunisia report the one-year natural clearance rates of HPV-16 or HPV-18. Thus, it is important to rely on the global studies [38,39]. According to these studies,
  • Approximately 45–56% of HPV-16 infections clear naturally within one year.
  • Approximately 60–62% of HPV-18 infections clear within the same period.
Thus,
p 1 0.45 × 1 + 0.6 × 0.33 1.33 , 0.56 × 1 + 0.62 × 0.33 1.33 [ 0.5 , 0.6 ]
Similarly, no Tunisian studies report one-year natural clearance rates for HPV-31, 59, or 52. However, global studies suggest the following:
  • Approximately 45% of HPV-31 infections clear naturally within one year.
  • Approximately 43% of HPV-59 infections clear within one year.
  • Approximately 55% of HPV-52 infections clear within one year.
Thus, we assume that
p 2 = 0.45 × 1.0 + 0.43 × 0.7 + 0.55 × 0.6 1.0 + 0.7 + 0.6 = 1.081 2.3 = 0.47 0.5 .
Epidemiological studies estimate that a substantial proportion of individuals infected with HPV types 16 and 18 develop persistent infections:
  • HPV 16: Approximately 30 % to 50 % of infections persist beyond 12 months.
  • HPV 18: Approximately 20 % to 40 % of infections persist beyond 12 months.
Considering the prevalence of these two types in Tunisia, one has
q 1 1 0.5 × 0.9 + 0.4 × 0.33 0.9 + 0.33 ; 1 0.3 × 0.9 + 0.2 × 0.33 0.9 + 0.33 [ 0.5 ; 0.7 ]
Although less studied than HPV 16 and 18, the persistence of other high-risk HPV types, such as 31, 52, and 59, has been evaluated in cohort studies:
  • HPV 31: Around 25 % to 35 % of infections persist beyond 1 year.
  • HPV 52: Approximately 15 % to 25 % of infections persist beyond 1 year.
  • HPV 59: Estimated persistence is around 10 % to 20 % at 1 year.
q 2 1 0.35 × 1 + 0.25 × 0.7 + 0.2 × 0.7 2.4 ; 1 0.25 × 1 + 0.15 × 0.7 + 0.1 × 0.7 2.4 [ 0.7 ; 0.8 ]

Appendix B.5. Infection Rates βf1, βm1, βf2, and βm2

The transmission rates β m 1 , β m 2 , β f 1 , β f 2 were estimated using the one-strain endemic equilibrium approach. For strain 1 (HPV-16/18) and strain 2 (HPV-31/52/59), we used the steady-state form of the infection equations expression and Tunisian prevalence data.
Assuming no vaccination and constant population size, the equilibrium condition for infected females with strain i is:
0 = λ m i S f + ε i R f i + R f j ( τ f i + μ f ) I f i for i = 1 , 2 , j = 1 , 2 and i j .
Solving this equation for β m i using λ m i = β m i I m i N m yields:
β m i = ( τ f i + μ f ) I f i ( S f + ε i R f i + R f j ) · I m i N m
The corresponding male infection equilibrium for strain i is:
0 = λ f i S m + ε i R m i ( τ m i + μ m ) I m i for i = 1 , 2 , j = 1 , 2 and i j .
Using λ f i = β f i ( I f i + θ p i P f i ) N f , we obtain:
β f i = ( τ m i + μ m ) I m i ( S m + ε i R m i + R m j ) · ( I f i + θ p i P f i ) N f
Using the previously computed parameters and initial conditions, one has
β m 1 0.6 , β m 2 1.181 β f 1 1.324 , β f 2 1.962
The values obtained lie within or near ranges commonly used in compartmental HPV models calibrated to population-level prevalence [19].

Appendix B.6. Cross-Protection Parameter ηI

To represent the partial protection conferred by the bivalent HPV vaccine against non-targeted high-risk genotypes, we introduced a cross-protection parameter η I into the model. This parameter modifies the force of infection of strain 2 in vaccinated females and is defined as the proportion of residual susceptibility to infection by genotypes not directly targeted by the vaccine. Specifically, η I = 1 e , where e is the estimated average vaccine-induced cross-protection efficacy against the genotypes included in strain 2.
In our model, strain 2 is composed of HPV genotypes 31, 52, and 59, which are among the most prevalent high-risk types in Tunisia not covered by the bivalent vaccine. Cross-protective efficacy data were extracted from the meta-analysis by Malagón et al. [12], which reported a high efficacy of 77.1% against HPV 31, but lower and non-significant efficacies against HPV 52 (27%) and HPV 59 (23%). To derive an average cross-protection level, we computed a weighted mean based on the local relative prevalence of these three genotypes, obtained from Tunisian epidemiological data (see Table A2).
Table A2. Weighted estimation of cross-protection efficacy against strain 2.
GenotypePrevalence in Tunisia (%)Cross-Protection Efficacy (%)Weight
HPV 310.977.10.409
HPV 520.727.00.318
HPV 590.623.00.273
Using these weights, the average cross-protection efficacy was estimated as
e = 0.409 × 0.771 + 0.318 × 0.27 + 0.273 × 0.23 0.464 ,
yielding a baseline cross-protection and reducing the susceptibility of η I = 1 e = 0.536 0.5 .
Table A3. Parameter description summary table.
ParameterDescriptionRangeValueReference
Disease-related parameters
f m a x Maximal proportion of susceptible females vaccinated against strain 1 at most [ 0 , 1 ] 1 and 0.8 [19]
ξ Bivalent vaccine efficacy for females [ 0.9 , 1 ] 0.9 [19]
incident infection with strain 2
η c Modification parameter for rate of progression to cancer by females≥1 1.5 [19]
with persistent strain 2 infection relative to those with persistent strain 1 infection
ε 1 Parameter for reduced susceptibility of individuals who have naturally recovered [ 0.1 , 1 ] 0.2 [19]
from one of the strains relative to those in the susceptible class
ε 2 Parameter for reduced susceptibility of individuals who have naturally recovered [ 0.1 , 1 ] 0.2 [19]
from one of the strains relative to those in the susceptible class
ε 3 Parameter for reduced susceptibility of individuals who have naturally recovered [ 0.1 , 1 ] 0.3 [19]
from one of the strains relative to those in the susceptible class
ε 4 Parameter for reduced susceptibility of individuals who have naturally recovered [ 0.1 , 1 ] 0.3 [19]
from one of the strains relative to those in the susceptible class
θ p 1 Modification parameter for the infectiousness of females with persistent strain 1 [ 0.7 , 0.9 ] 0.9 [19]
θ p 2 Modification parameter for the infectiousness of females with persistent strain 2 [ 0.7 , 0.9 ] 0.9 [19]
κ f 1 Transition rate out of P f 1 class for females [ 0.1 , 0.5 ] 0.1 [19]
κ f 2 Transition rate out of P f 2 class for females [ 0.1 , 0.5 ] 0.1 [19]
η I Modification parameter for cross-protection of vaccinated females against infection [ 0 , 1 ] 0.5 Estimated
with strain 2
Country-related parameters
Λ f Recruitment rate for females 71,807Estimated
Λ m Recruitment rate for males 76,171Estimated
μ f Natural death rate for females [ 0.01 ; 0.2 ] 0.0127 Estimated
μ m Natural death rate for males [ 0.01 ; 0.2 ] 0.0133 Estimated
δ Cancer-induced death rate 0.019 Estimated
β f 1 Female-induced infection rate with strain 1 [ 0.4 ; 3 ] 0.5 Estimated
β f 2 Female-induced infection rate with strain 2 [ 0.4 ; 3 ] 0.9 Estimated
β m 1 Male-induced infection rate with strain 1 [ 0.3 ; 2.5 ] 0.72 Estimated
β m 2 Male-induced infection rate with strain 2 [ 0.3 ; 2.5 ] 1.29 Estimated
τ f 1 Recovery rate of females infected with strain 1 [ 0.5 ; 2.5 ] 0.667 Estimated
τ f 2 Recovery rate of females infected with strain 2 [ 0.5 ; 2.5 ] 1.2 Estimated
τ m 1 Recovery rate of males infected with strain 1 [ 0.5 ; 2.5 ] 0.667 Estimated
τ m 2 Recovery rate of males infected with strain 2 [ 0.5 ; 2.5 ] 1.2 Estimated
p 1 Proportion of females who recover naturally from strain 1 and do not progress [ 0.1 ; 1 ] 0.6 Estimated
to persistent HPV infection
p 2 Proportion of females who recover naturally from strain 2 and do not progress [ 0.1 ; 1 ] 0.5 Estimated
to persistent HPV infection
q 1 Proportion of females who recover from persistent strain 1 infection do not [ 0.1 ; 1 ] 0.6 Estimated
progress to cervical cancer
q 2 Proportion of females who recover from persistent strain 2 infection and do not [ 0.1 ; 1 ] 0.8 Estimated
progress to cervical cancer

References

  1. Burd, E.M. Human papillomavirus and cervical cancer. Clin. Microbiol. Rev. 2003, 16, 1–17. [Google Scholar] [CrossRef] [PubMed]
  2. Schiffman, M.; Castle, P.E.; Jeronimo, J.; Rodriguez, A.C.; Wacholder, S. Human papillomavirus and cervical cancer. Lancet 2007, 370, 890–907. [Google Scholar] [CrossRef]
  3. Clifford, G.M.; Smith, J.S.; Plummer, M.; Muñoz, N.; Franceschi, S. HPV types in invasive cervical cancer worldwide. Br. J. Cancer 2003, 88, 63–73. [Google Scholar] [CrossRef] [PubMed]
  4. Sung, H.; Ferlay, J.; Siegel, R.L.; Laversanne, M.; Soerjomataram, I.; Jemal, A.; Bray, F. Global cancer statistics 2020. CA Cancer J. Clin. 2021, 71, 209–249. [Google Scholar] [CrossRef] [PubMed]
  5. de Sanjosé, S.; Quint, W.G.; Alemany, L.; Geraets, D.T.; Klaustermeier, J.E.; Lloveras, B.; Tous, S.; Felix, A.; Bravo, L.E.; Shin, H.-R.; et al. HPV genotype attribution in invasive cervical cancer: A retrospective cross-sectional worldwide study. Lancet Oncol. 2010, 11, 1048–1056. [Google Scholar] [CrossRef]
  6. World Health Organization. Human papillomavirus vaccines: WHO position paper. Wkly. Epidemiol. Rec. 2022, 97, 645–672. [Google Scholar]
  7. Goldie, S.J.; Kim, J.J.; Kobus, K.; Goldhaber-Fiebert, J.D.; Salomon, J.; O’Shea, M.K.; Bosch, X.; de Sanjosé, S.; Franco, E.L. Cost-effectiveness of HPV vaccination in Brazil. Vaccine 2007, 25, 6257–6270. [Google Scholar] [CrossRef]
  8. Burger, E.A.; Campos, N.G.; Sy, S.; Regan, C.; Kim, J.J. Health and economic benefits of single-dose HPV vaccination. Vaccine 2018, 36, 4823–4829. [Google Scholar] [CrossRef]
  9. Ardhaoui, M.; Letaief, H.; Ennaifer, E.; Bougatef, S.; Lassili, T.; Bel Haj Rhouma, R.; Fehri, E.; Ouerhani, K.; Guizani, I.; Mchela, M.; et al. The prevalence, genotype distribution and risk factors of human papillomavirus in Tunisia. Viruses 2022, 14, 2175. [Google Scholar] [CrossRef]
  10. Ben Miled, S.; Gzara, A.; Laraj, O. Note Synthétique: Choix du Vaccin Contre le HPV en Tunisie; Institut Pasteur de Tunis: Tunis, Tunisia, 2024; preprint. [Google Scholar]
  11. Laraj, O.; Benzina, B.; Gzara, A.; Kebir, A.; Abbas, K.; Ben Miled, S. HPV vaccination at the national level in Tunisia. medRxiv 2024. [Google Scholar] [CrossRef]
  12. Malagon, T.; Drolet, M.; Boily, M.-C.; Franco, E.L.; Jit, M.; Brisson, J.; Brisson, M. Cross-protective efficacy of HPV vaccines. Lancet Infect. Dis. 2012, 12, 781–789. [Google Scholar] [CrossRef] [PubMed]
  13. Brown, D.R.; Joura, E.A.; Yen, G.P.; Kothari, S.; Luxembourg, A.; Saah, A.; Walia, A.; Perez, G.; Khoury, H.; Badgley, D.; et al. Cross-protective effect of HPV vaccines. Vaccine 2021, 39, 2224–2236. [Google Scholar] [CrossRef] [PubMed]
  14. Berhe, H.W.; Makinde, O.D. Optimal control of measles epidemic. Biosystems 2020, 190, 104102. [Google Scholar] [CrossRef] [PubMed]
  15. Lata, K.; Mishra, S.N.; Misra, A.K. Optimal control for carrier-dependent diseases. Biosystems 2020, 187, 104039. [Google Scholar] [CrossRef]
  16. Misra, A.K.; Sharma, A.; Shukla, J.B. Epidemic model with awareness programs. Biosystems 2015, 138, 53–62. [Google Scholar] [CrossRef]
  17. Malik, T.; Reimer, J.; Gumel, A.B.; Elbasha, E.H.; Mahmud, S. Impact of imperfect vaccination on HPV. Math. Biosci. Eng. 2013, 10, 1173–1205. [Google Scholar] [CrossRef]
  18. Alsaleh, A.A.; Gumel, A.B. Analysis of risk-structured vaccination model. Bull. Math. Biol. 2014, 76, 1670–1726. [Google Scholar] [CrossRef]
  19. Omame, A.; Daniel, O.; Inyama, S. A mathematical study of a model for HPV with two high-risk strains. In Mathematical Modelling in Health, Social and Applied Sciences; Springer: Singapore, 2020. [Google Scholar] [CrossRef]
  20. Allali, K. Stability analysis and optimal control of HPV infection. Biosystems 2021, 199, 104321. [Google Scholar] [CrossRef]
  21. Malik, T.; Imran, M.; Jayaraman, R. Optimal control with multiple HPV vaccines. J. Theor. Biol. 2016, 393, 179–193. [Google Scholar] [CrossRef]
  22. Brown, V.; White, K.A.J. The HPV vaccination strategy: Could male vaccination have a significant impact? Comput. Math. Methods Med. 2010, 11, 395631. [Google Scholar] [CrossRef]
  23. Sharomi, O.; Malik, T. A model to assess the effect of vaccine compliance on Human Papillomavirus infection and cervical cancer. Appl. Math. Model. 2017, 47, 528–550. [Google Scholar] [CrossRef]
  24. Diekmann, O.; Heesterbeek, J.A.P.; Metz, J.A.J. Definition of the basic reproduction number. J. Math. Biol. 1990, 28, 365–382. [Google Scholar] [CrossRef]
  25. van den Driessche, P.; Watmough, J. Reproduction numbers and sub-threshold endemic equilibria. Math. Biosci. 2002, 180, 29–48. [Google Scholar] [CrossRef] [PubMed]
  26. Fleming, W.; Rishel, R. The title of the cited contribution. In Deterministic and Stochastic Optimal Control; Springer: New York, NY, USA, 1975. [Google Scholar] [CrossRef]
  27. Trélat, E. Contrôle Optimal: Théorie et Applications; Université Pierre et Marie Curie (Paris 6) et Institut Universitaire de France: Paris, France, 2005. [Google Scholar]
  28. Saldaña, F.; Camacho-Gutiérrez, J.A.; Villavicencio-Pulido, G.; Velasco-Hernández, J.X. Modeling HPV transmission and vaccination strategies. Appl. Math. Model. 2022, 112, 767–785. [Google Scholar] [CrossRef]
  29. Ren, H.; Xu, R.; Zhang, J. HPV transmission and optimal control in China. Sci. Rep. 2025, 15, 21354. [Google Scholar] [CrossRef]
  30. Saldaña, F.; Korobeinikov, A.; Barradas, I. Optimal Control against the Human Papillomavirus: Protection versus Eradication of the Infection. Abstr. Appl. Anal. 2019, 2019, 4567825. [Google Scholar] [CrossRef]
  31. Drolet, M.; Laprise, J.-F.; Martin, D.; Jit, M.; Bénard, E.; Gingras, G.; Boily, M.-C.; Alary, M.; Baussano, I.; Hutubessy, R.; et al. Optimal human papillomavirus vaccination strategies to prevent cervical cancer in low-income and middle-income countries in the context of limited resources: A mathematical modelling analysis. Lancet Infect. Dis. 2021, 21, 1598–1610. [Google Scholar] [CrossRef]
  32. Countrymeters. Tunisia Population. Available online: https://countrymeters.info/en/Tunisia (accessed on 20 December 2024).
  33. PopulationPyramid.net. Pyramides des âges pour la Tunisie. 2024. Available online: https://www.populationpyramid.net/fr/tunisie/2024/ (accessed on 20 December 2024).
  34. Feng, T.; Cheng, B.; Sun, W.; Yang, Y. Factors of high-risk HPV infection. BMC Womens Health 2023, 23, 599. [Google Scholar] [CrossRef]
  35. Selvin, S. Life tables. In Survival Analysis for Epidemiologic and Medical Research; Cambridge University Press: Cambridge, UK, 2008. [Google Scholar]
  36. Institut National de la Statistique. Tunisia Statistics. 2025. Available online: https://www.ins.tn/statistiques/112 (accessed on 13 July 2025).
  37. World Bank. An Introduction to Deterministic Infectious Disease Models. Available online: https://documents1.worldbank.org/curated/en/888341625223820901/pdf/An-Introduction-to-Deterministic-Infectious-Disease-Models.pdf (accessed on 13 July 2025).
  38. Kjaer, S.; Høgdall, E.; Frederiksen, K.; Munk, C.; van den Brule, A.; Svare, E.; Meijer, C.; Lorincz, A.; Iftner, T. The absolute risk of cervical abnormalities in high-risk human papillomavirus-positive, cytologically normal women over a 10-year period. Cancer Res. 2006, 66, 21. [Google Scholar] [CrossRef]
  39. Bulkmans, N.W.; Berkhof, J.; Bleeker, M.C.; Van Kemenade, F.J.; Rozendaal, L.; Snijders, P.J.; Meijer, C.J.; POBASCAM Study Group. High-risk HPV type-specific clearance rates in cervical screening. Br. J. Cancer 2007, 96, 1419–1424. [Google Scholar] [CrossRef]
Figure 1. Schematic of the HPV transmission model stratified by sex and strain. Females are subdivided into susceptible ( S f ), vaccinated (V), infected ( I f i ), recovered ( R f i ), persistent ( P f i ), and cancer (C) compartments; and males into susceptible ( S m ), infected ( I m i ), and recovered ( R m i ), with ( i = 1 , 2 ) describing the strain-specific index. Arrows indicate infection, recovery, progression, and cross-strain reinfection.
Mathematics 14 01634 g001
Figure 2. Coexistence of the two strains in the Tunisian context.
Mathematics 14 01634 g002
Figure 3. Sensitivity analysis of the basic reproduction numbers, R 0 , 1 and R 0 , 2 , using Partial Rank Correlation Coefficients (PRCCs) with Latin Hypercube Sampling. Parameter ranges were taken from Table A1 (Appendix A). The analysis identifies the most influential parameters on R 0 , showing that vaccination coverage and efficacy strongly reduce R 0 , 1 , whereas R 0 , 2 is modulated indirectly via cross-protection.
Mathematics 14 01634 g003
Figure 4. Contour maps of R 0 , 1 and R 0 , 2 as functions of vaccination coverage f and protective factors. Left: R 0 , 1 depends on vaccine efficacy ξ with parameters β m 1 = 0.72 , β f 1 = 0.5 , κ f 1 = 0.2 , τ f 1 = 0.55 , and p 1 = 0.6 . The red line indicates the herd immunity threshold f c , 1 ( ξ ) ; below this line, R 0 , 1 > 1 . Right: R 0 , 2 as a function of coverage and residual susceptibility 1 η I , with β m 2 = 0.9 , β f 2 = 0.8 , κ f 2 = 0.2 , τ f 2 = 1.2 , p 2 = 0.1 , and η c = 0.5 . The red line indicates f c , 2 ( 1 η I ) : (a) Basic reproduction number R 0 , 1 as a function of vaccination coverage f and vaccine efficacy ξ . (b) Basic reproduction number R 0 , 2 as a function of vaccination coverage f and vaccine cross-protection 1 η I .
Mathematics 14 01634 g004
Figure 5. Vaccine administration. Scenario 1, where A 1 = 1 , A 2 = 0 and f m a x = 1 ; Scenario 2, where A 1 = 1 , A 2 = 10,000 and f m a x = 1 ; and Scenario 3, where A 1 = 1 , A 2 = 100,000 and f m a x = 0.8 : (a) Vaccine administration to girls in Scenario 1. (b) Vaccine administration to girls in Scenario 2. (c) Vaccine administration to girls in Scenario 3.
Mathematics 14 01634 g005
Figure 6. Control scenarios’ impact on cancer cases and persistent infection among females, as well as on infection among males: Scenario 1, where A 1 = 1 , A 2 = 0 and f m a x = 1 ; Scenario 2, where A 1 = 1 , A 2 = 10,000 and f m a x = 1 ; and Scenario 3, where A 1 = 1 , A 2 = 100,000 and f m a x = 0.8 : (a) Strain 1 persistent infection among females (Scenario 1). (b) Strain 1 persistent infection among females (Scenario 2). (c) Strain 1 persistent infection among females (Scenario 3). (d) Strain 2 persistent infection among females (Scenario 1). (e) Strain 2 persistent infection among females (Scenario 2). (f) Strain 2 persistent infection among females (Scenario 3). (g) Cancer cases among females (Scenario 1). (h) Cancer cases among females (Scenario 2). (i) Cancer cases among females (Scenario 3).
Mathematics 14 01634 g006
Figure 7. Control scenarios’ impact on infection among males: Scenario 1, where A 1 = 1 , A 2 = 0 and f m a x = 1 ; Scenario 2, where A 1 = 1 , A 2 = 10,000 and f m a x = 1 ; and Scenario 3, where A 1 = 1 , A 2 = 100,000 and f m a x = 0.8 : (a) Strain 1 infection among males (Scenario 1). (b) Strain 1 infection among males (Scenario 2). (c) Strain 1 infection among males (Scenario 3). (d) Strain 2 infection among males (Scenario 1). (e) Strain 2 infection among males (Scenario 2). (f) Strain 2 infection among males (Scenario 3).
Mathematics 14 01634 g007
Disclaimer/Publisher’s Note: The statements, opinions and data contained in all publications are solely those of the individual author(s) and contributor(s) and not of MDPI and/or the editor(s). MDPI and/or the editor(s) disclaim responsibility for any injury to people or property resulting from any ideas, methods, instructions or products referred to in the content.